
Spinal Muscular Atrophy (SMA) Subtype Concordance in Siblings: Findings From the Cure SMA Cohort
Abstract
Background:
Spinal muscular atrophy (SMA) is an autosomal recessive neuromuscular disorder caused by homozygous survival of motor neuron 1 (SMN1) gene disruption. Despite a genetic etiology, little is known about subtype concordance among siblings.
Objective:
To investigate subtype concordance among siblings with SMA.
Methods:
Cure SMA maintains a database of newly diagnosed patients with SMA, which was utilized for this research.
Results:
Among 303 sibships identified between 1996 and 2016, 84.8% were subtype concordant. Of concordant sibships, subtype distribution was as follows: Type I, 54.5%; Type II, 31.9%; Type III, 13.2%; Type IV, 0.4%. Subtype and concordance/discordance association was significant (Fisher’s exact test; p < 0.0001). Among discordant sibships (chi-square test, p < 0.0001), Types II/III (52.2%) and Types I/II (28.3%) were the most common pairs. No association was found between sibling sex and concordance. Our findings show that most siblings with SMA shared the same subtype concordance (most commonly Type I).
Conclusions:
These data are valuable for understanding familial occurrence of SMA subtypes, enabling better individual treatment and management planning in view of new treatment options and newborn screening initiatives.
ABBREVIATIONS
HFMS | Hammersmith Functional Motor Scale; |
MFM | Motor Function Measure; |
SMA | Spinal muscular atrophy; |
SMN | Survival motor neuron |
INTRODUCTION
A genetic neuromuscular disease, spinal muscular atrophy (SMA), is an autosomal recessive disorder that results in degeneration of spinal cord motor neurons [1, 2]. In the United States, ∼1:40–1:60 people are SMA carriers [3], and each offspring has a 25% chance of being born with SMA if both parents are carriers [4]. SMA is caused by a homozygous disruption of the survival motor neuron 1 (SMN1) gene in 95–98% of cases [4] and is the leading monogenetic cause of infant mortality, as well as significant childhood morbidity [1, 2, 5]. Mortality and morbidity, along with the observed SMA phenotypes, are expected to be altered with widespread early administration of the disease-modifying therapy nusinersen, which has recently been approved for use in many countries [6]. Several other disease-modifying therapies are also in late-stage clinical development [7].
The estimated overall annual birth prevalence of SMA ranges from 8.5–10.3 per 100,000 live births, making it a rare disease [3, 8–11]. SMA has traditionally been classified into five subtypes (Types 0, I, II, III, and IV), which are distinguished by age of symptom onset and highest motor milestone achieved [12, 13]. The most severe phenotype is seen in the rare SMA Type 0, with a prenatal onset and postnatal survival of less than one month [1, 12, 14]. Type I (infantile onset) is also a severe form of SMA; symptoms usually present at less than six months of age, patients never sit unsupported, and without respiratory intervention, their life expectancy is generally less than two years [1, 2, 12]. Without treatment, individuals with SMA Type I typically do not experience motor milestone and motor function gains once they become symptomatic [1, 12]. Among the subtypes, SMA Type I is the most frequently occurring (>50% of cases) and has been the least prevalent due to its high mortality rate [1, 15, 16]. Symptom onset in patients with SMA Type II is within the first 18 months of life [1]. Individuals with SMA Type II may sit independently, but never walk unaided, and had a life expectancy into early adulthood [1]. SMA Type III usually presents after 18 months of age, affected individuals walk independently, and their life expectancy is almost identical to that of the general population [1]. The rarest form of the disorder, associated with the lowest morbidity, is SMA Type IV, with symptom onset typically occurring after 20 years of age. Similar to SMA Type III, survival in Type IV is in line with that expected for the general population [1, 12, 17].
Phenotypic severity is thought to be associated with the number of copies of the paralogous SMN1 gene, SMN2, present in an individual’s genome [13, 18]. Patients with SMA Type 0 usually only have one copy of the SMN2 gene, while one study has reported individuals with SMA Type IV as having up to eight copies [12, 19]. With early symptom onset across the majority of affected individuals and short survival among the most severe forms, understanding the course of SMA within families enables better consideration of options for possible treatment, care management, and family planning.
There have been descriptions of phenotypic variation of SMA within families, but most have been relatively limited in the number of sibships included. A 1994 publication described variability in 101 siblings in 48 families observed from 1985–1993 [20]. This study classified patients according to motor development and reported that 15% were discordant based on this measure [20]. Age of onset was examined separately, but was similar within each SMA subtype [20]. Other available studies have tended to be smaller case series with even fewer sibling sets (≤10 families) [21–28]. A more recent small case series of 14 siblings reported seven sibships with the same SMA subtype and found phenotypic discordance across measures such as best motor function achieved, age of onset, highest functional scores, need for ventilation and/or spinal surgery, or loss of independent gait [29]. In a study of 45 patients with SMA, four sets of siblings were identified; siblings within each set had identical SMN2 copy numbers, but showed markedly different SMA phenotypes [23].
This study aims to describe the most frequently occurring SMA subtypes among siblings, evaluate the concordance and discordance of SMA subtypes among siblings, assess the association of sex with SMA phenotype concordance, and characterize SMA subtypes of siblings according to birth order. These results are of particular importance as new therapies for SMA are developed; these findings have the potential to support the identification of genetic modifiers, the discovery of which may lead to more effective drug treatment regimens. These data, in addition to family experience, may also be valuable in creating and implementing treatment plans for individuals with SMA.
METHODS
As an organization supporting SMA families, Cure SMA has maintained the largest global patient-reported database of patients with SMA since 1996 [30]. The database currently has >7000 patients with SMA worldwide, with an average of 27 new patients each month contacting Cure SMA for information and resources [30]. In the days, weeks, or months following the SMA diagnosis, patients or their caregivers contact Cure SMA seeking further information about the disease and available resources. All information provided to Cure SMA by newly diagnosed patients or their caregivers is voluntary and includes details such as birthdate, date of diagnosis, type of SMA, and contact information. The Cure SMA database is used to recruit patients for clinical studies, raise awareness about SMA to health care providers, and establish a network for families and affected individuals [31]. Analyses of the Cure SMA database qualify as exempt research by the Advarra Institutional Research Board (Columbia, MD). The Cure SMA privacy policy is available here: http://www.curesma.org/privacy-policy.html.
This descriptive analysis utilizes patient- and family-level data collected from 1996–2016, after individuals contacted Cure SMA following a recent new diagnosis of SMA. Information was primarily self- or family reported to Cure SMA. The families who contacted Cure SMA consented to their data being utilized for research to advance the mission of Cure SMA, with the privacy statement on the Cure SMA website stating that aggregated, deidentified information may be shared with third parties. Each patient was assigned a unique identifier and each household was also assigned a unique identifier. Subsequent to identification of eligible siblings within the Cure SMA database, the following deidentified data were analyzed: randomly modified (to retain anonymity) dates of birth and death (if applicable), sex, and diagnosis date. For date of birth and diagnosis date, Cure SMA applied an algorithm to alter dates systematically. This enables estimates of time while maintaining the confidentiality of the patient’s true dates of birth and diagnosis. To maintain confidentiality, only Cure SMA has access to the algorithm key.
Data from a total of 848 siblings were available to be assessed for eligibility for study inclusion as of December 31, 2016. The first disease-modifying therapy was authorized December 23, 2016, so the majority of siblings observed would not have had an opportunity for exposure to such therapies during the study period. Siblings were identified using their unique household identifier. Concordant sibships were defined as those where all siblings with SMA had the same subtype. Discordant sibships were those where two or more siblings with SMA had different subtypes. Tests of association were conducted using Fisher’s exact test and chi-square statistics.
RESULTS
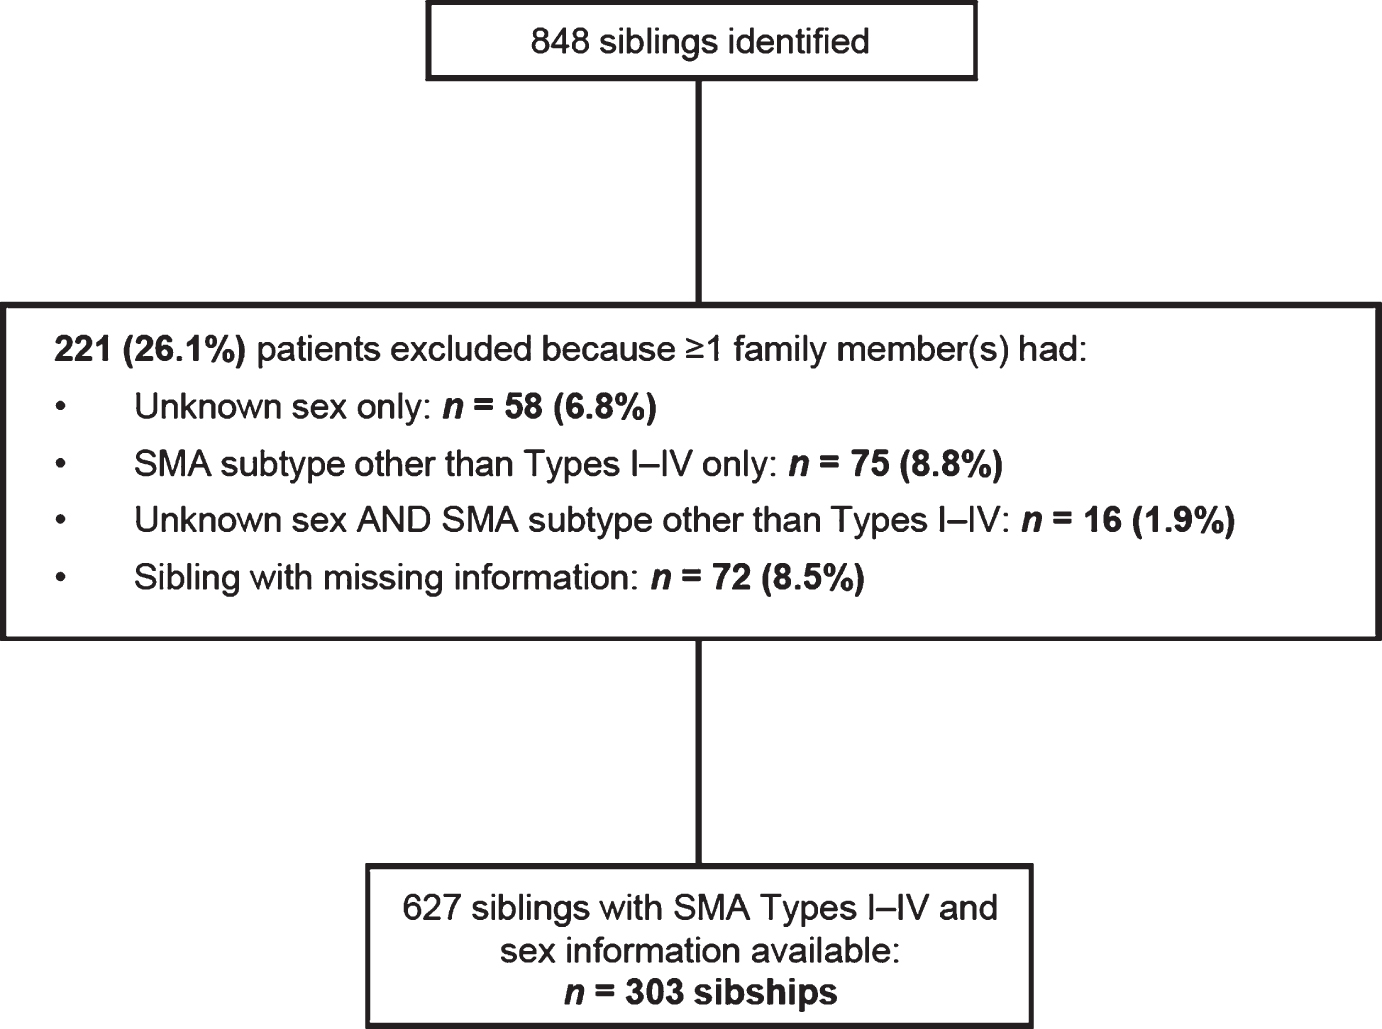
Among the 848 patients identified, 627 were included in these analyses, representing 303 sibships (Fig. 1). Of the 221 patients (101 sibships) that were excluded, 58 were missing sex identification, 75 had a form of SMA other than Types I–IV (non-5q SMA), 16 were missing information on sex and SMA subtype, and 72 were excluded because a sibling was missing required information.
Fig.1
Total sibships in the Cure SMA sibling database from 1996–2016 and number included in this analysis. SMA, spinal muscular atrophy.
Among the 627 patients analyzed, the highest proportion of individuals had SMA Type I (49.8%; Table 1). The subtype distribution in the overall population followed the SMA type distributions described in the literature, both in the total Cure SMA sibling database (Table 1) and in the cohort with available data for SMA subtype that was used for further analysis. The majority (94.1%) of SMA sibships contained two children with SMA (Table 2); 39 sets of twins and one set of triplets were also identified.
Table 1
Summary of unique patients included in these analyses from the Cure SMA sibling database from 1996–2016
| Sex, n (%) | SMA Type I | SMA Type II | SMA Type III | SMA Type IV | Total |
| Female | 148 (48.5) | 108 (35.4) | 49 (16.1) | 0 | 305 (48.6) |
| Male | 164 (50.9) | 100 (31.1) | 52 (16.1) | 6 (1.9) | 322 (51.4) |
| Total | 312 (49.8) | 208 (33.2) | 101 (16.1) | 6 (1.0) | 627 (100.0) |
SMA, spinal muscular atrophy.
Table 2
Total number of sibships in the Cure SMA sibling database from 1996–2016 (627 individuals in 303 families)
| Number of siblings per family | Number of families, n (%) |
| 2 | 285 (94.1) |
| 3 | 15 (5.0) |
| 4 | 3 (1.0) |
| Total | 303 (100.0) |
SMA subtype concordance and discordance
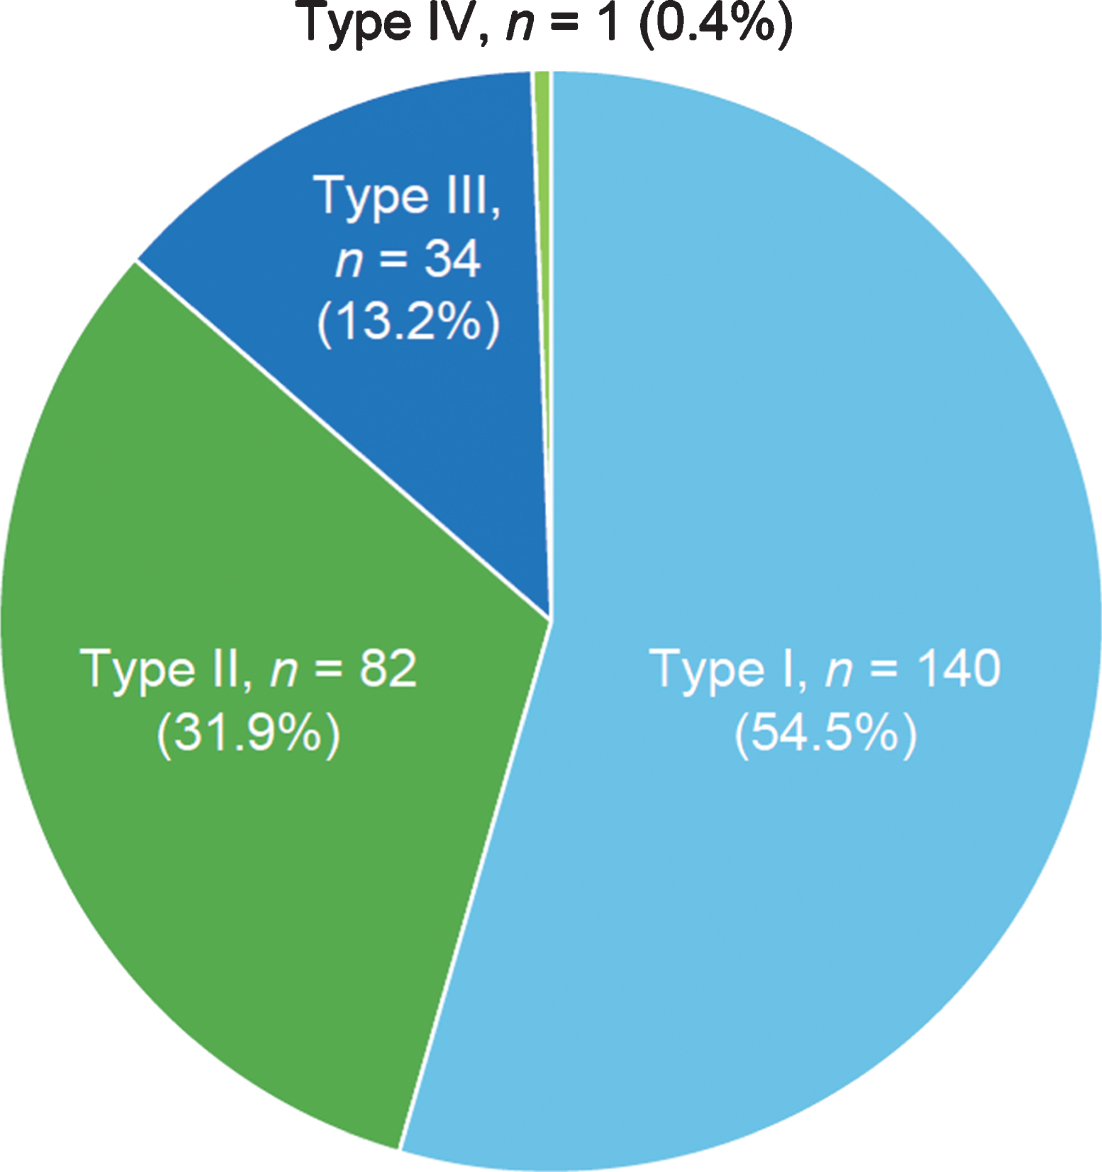
Among the 303 sibships, 84.8% (n = 257) had concordant SMA subtypes (Fig. 2), while 15.2% (n = 46) had discordant SMA subtypes. Concordance/discordance was associated with SMA subtype (Fisher’s exact test, p < 0.0001). Among concordant subtypes, SMA Type I comprised the largest percentage (54.5%), followed by SMA Type II (31.9%) and Type III (13.2%). These differences were statistically significant according to a chi-square test of association (170.72; p < 0.0001, i.e., the probability of the observed frequencies being due to chance is low). Among all families with one or more children with SMA Type I (n = 159), 88.1% of siblings with SMA were subtype concordant.
Fig.2
Frequency of spinal muscular atrophy subtypes among concordant sibships in the Cure SMA sibling database from 1996–2016 (n = 257 sibships). Chi-square test, 170.72; p < 0.0001.
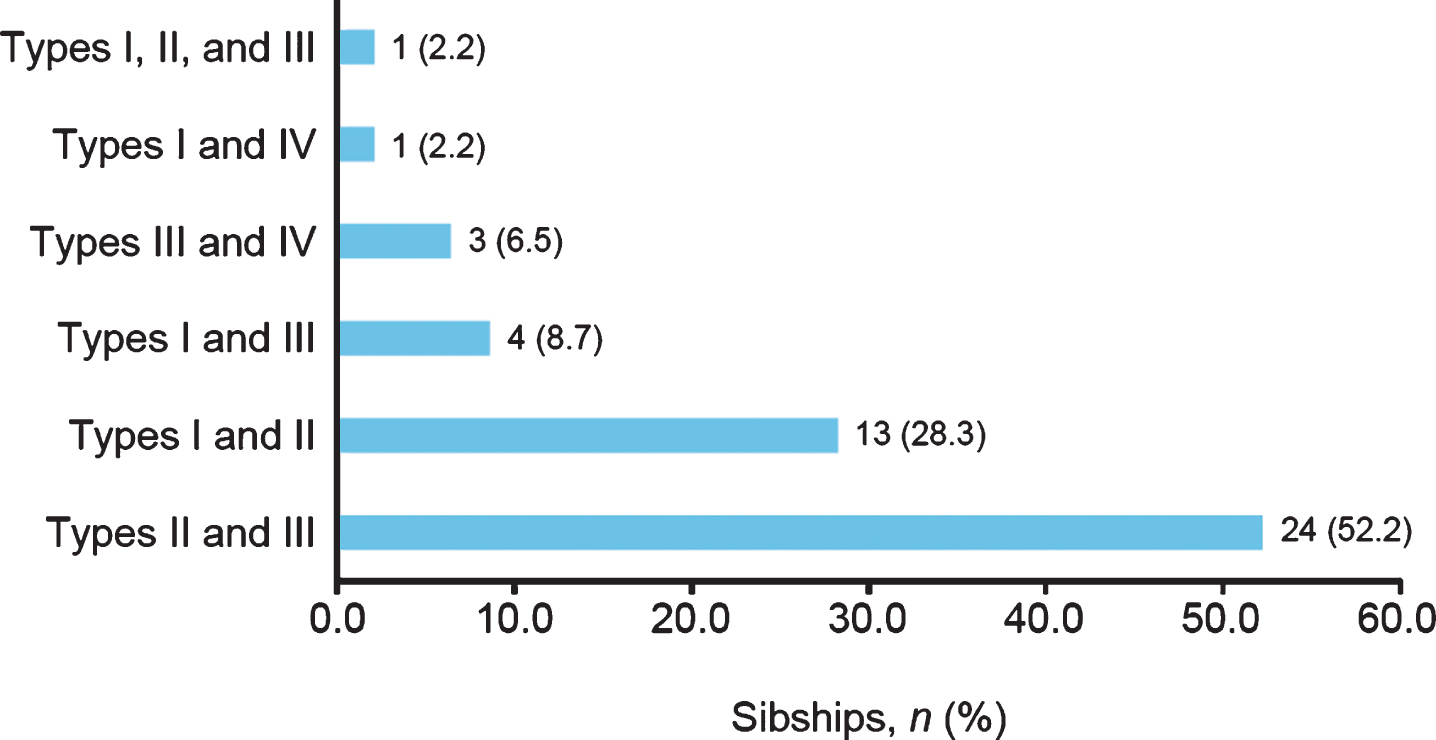
Among discordant SMA subtypes, the combination of SMA Types II and III was most common (52.2%), followed by the combination of SMA Types I and II (28.3%; Fig. 3). The frequencies of the observed combinations of SMA subtypes in discordant sibships were significantly different as assessed by chi-square test (54.70; p < 0.0001).
Fig.3
Spinal muscular atrophy (SMA) subtypes among siblings with SMA subtype discordance in the Cure SMA sibling database from 1996–2016 (n = 46 sibships). Chi-square test, 54.70; p < 0.0001.
SMA subtype of discordant siblings according to birth order
Among discordant sibships with an available date of birth (modified to protect privacy; n = 39/46), an analysis of birth order was undertaken. Overall, 27/39 (69.2%) sibships included children with a less severe SMA subtype who were born before their sibling(s) with more severe SMA subtype(s); of these, SMA Type III followed by SMA Type II was the most common birth order (n = 16 sibships [16/27; 59.3%]). Fourteen of the discordant sibships comprised one or more individuals with SMA Type I; of these sibships, four included SMA Type I earlier in the birth order than less severe SMA subtypes, nine sibships contained individuals with SMA Type I born after those with a less severe subtype, and one sibship had a birth order of SMA Types I, I, II, and IV.
Sex concordance
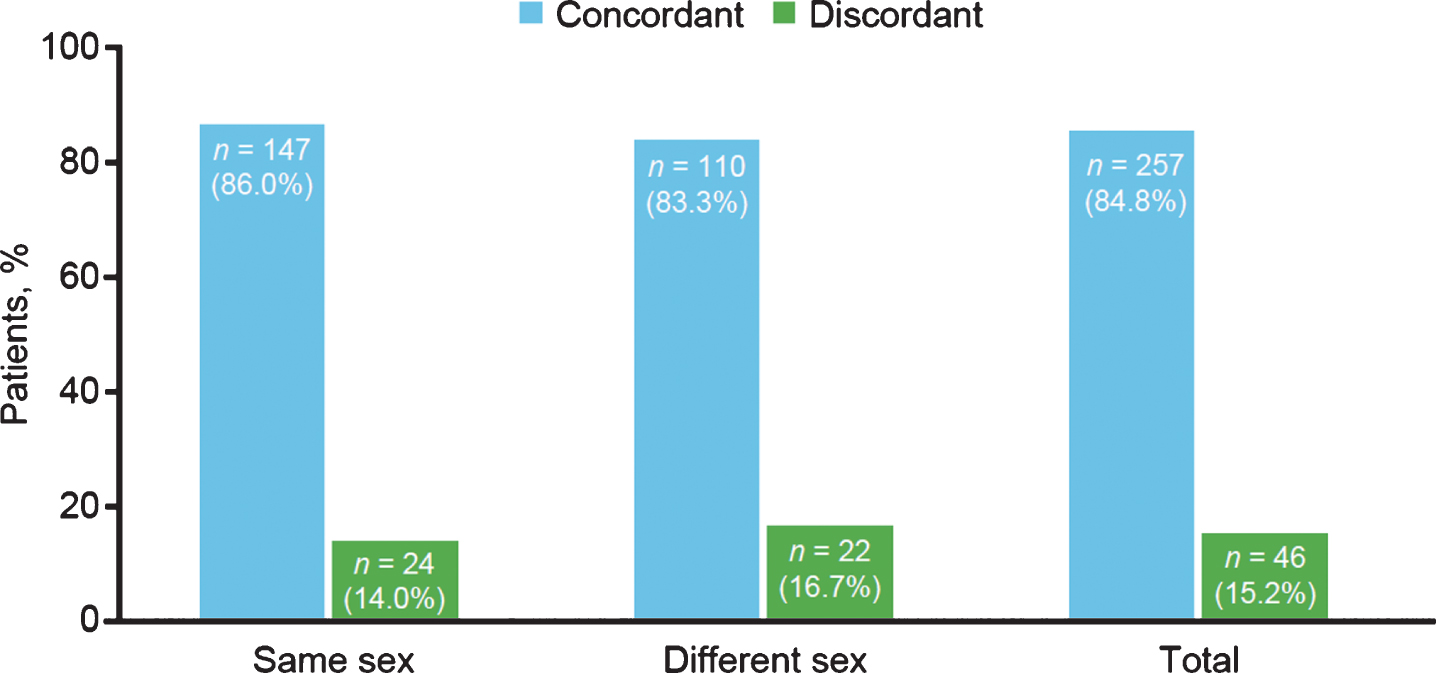
Sex was not associated with SMA subtype concordance; 86.0% and 83.3% of same- and different-sex sibships, respectively, had the same subtype of SMA (Fig. 4). Concordance and discordance rates between same- and different-sex sibships were not significantly different as assessed by chi-square test (0.40; p = 0.5268).
Fig.4
Spinal muscular atrophy subtype concordance among same- and different-sex siblings in the Cure SMA sibling database from 1996–2016 (n = 303 sibships). Chi-square test, 0.40; p = 0.5268.
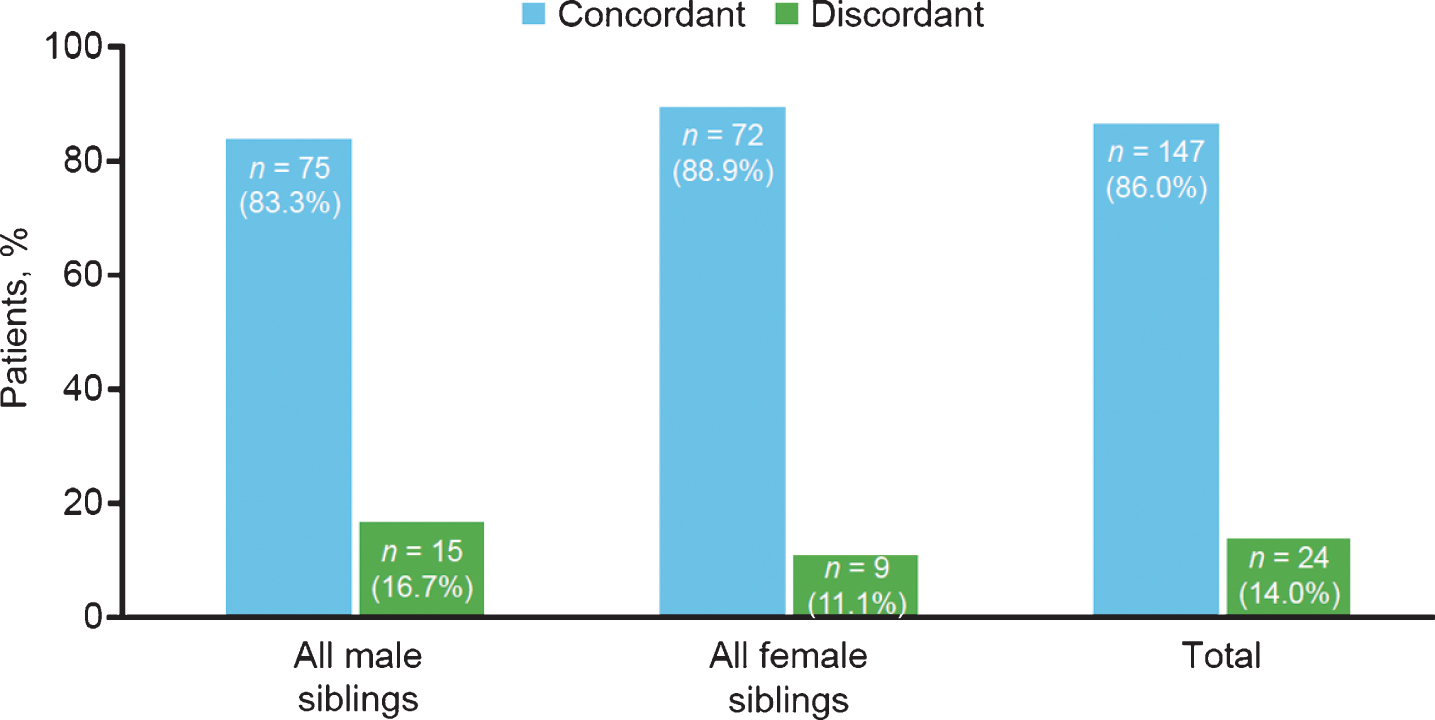
SMA subtype concordance within all-male and all-female sibships also was not significantly different (Fig. 5). Concordance and discordance rates between same-sex sibships were not significantly different as assessed by chi-square test (1.09; p = 0.2963).
Fig.5
Spinal muscular atrophy subtype concordance among same-sex siblings in the Cure SMA sibling database from 1996–2016 (n = 171 sibships). Chi-square test, 1.09; p = 0.2963.
DISCUSSION
This study represents the largest group of sibships (n = 303) for which SMA phenotype concordance and discordance has been reported. Sibling concordance of subtype was high (85%); this is the same as an earlier study of 101 siblings in 48 families that also reported 85% concordance rates based on motor development [20]. The data reported here provide valuable understanding regarding the epidemiology of SMA in the community and within families. The distribution of SMA subtypes in the overall Cure SMA sibling subset (SMA Type I, 49.8%; SMA Type II, 33.2%; SMA Type III, 16.1%; SMA Type IV, 1.0%) was consistent with that described in the incidence literature [1].
The size and breadth of participation in the Cure SMA database are among the strengths of this analysis. Because data collection was independent of health care providers, it reflects a variety of individuals with SMA who are treated across various types of medical specialists, clinics, geographies, and care standards, all of which increase the generalizability of these results.
Limitations of this analysis include that data were self-reported by patients and patients’ families without independent verification (such as with health care providers); however, a recent community survey conducted by Cure SMA found that self-reported data by patients and parents were similar to clinician-reported data in a study by Calucho et al. [32]. The Calucho et al. study reported that 73% of individuals with SMA Type I, 78% of individuals with SMA Type II, and 44% of individuals with SMA Type III have two, three, and four SMN2 copies, respectively. In Cure SMA’s self-reported data, 76% (n = 117) of individuals with SMA Type I reported having two SMN2 copies, 76% (n = 112) of individuals with SMA Type II reported having three SMN2 copies, and in individuals with SMA Type III, 42% (n = 39) reported having four SMN2 copies [33]. Sibling relationships were assumed as verification of sibships could not be conducted (e.g., children in the same household may have been siblings, cousins, step-siblings, half siblings, adopted). Notably, unless Cure SMA was notified that a diagnosis had changed, as might be expected in the presence of approved treatments, clinical trials, or the rare occurrence of motor function achievements, SMA subtypes were not recoded as standard procedure after the first diagnosis. While this dataset represents the largest study of SMA sibships to date, care must be taken when extrapolating cohort data to wider affected populations.
A statistical association was observed between SMA subtype and concordance/discordance, meaning that the subtypes were not evenly distributed across concordance/discordance. The most frequently occurring SMA subtype among concordant sibships was Type I. The SMA subtypes of discordant sibships were statistically different; SMA Types II and III were the most common co-occurring discordant phenotypes, and SMA Types I and II the second most common. The observation that the most common discordant sibships were between subtypes closest on the SMA spectrum is consistent with SMA being a phenotypic continuum [1, 4].
A number of possible sources for variability in observed SMA phenotypes and general subtype concordance have been identified, including SMN2 copy number, aspects of motor function, sex, and birth order [34–37]. The severity of SMA is thought to be influenced by the amount of full-length SMN protein that is residually expressed. Cure SMA began additional data collection, including SMN2 copy number, maximum motor function achieved, and exposure to disease-modifying therapy towards the end of the study period, and as a result, these data were not available for the majority of individuals in this study. Besides SMN2 copy number, other factors can lead to differing levels of SMN protein expression, such as modulation by splicing factors or transcriptional regulators, epigenetic factors (e.g., acetylation and methylation within the SMN2 promoter), factors influencing SMN protein stability (e.g., proteasome inhibitors), or by extrinsic non-genetic or environmental factors (e.g., hypoxia, starvation), thus providing possible mechanisms for interfamilial discordance in SMA subtype [34]. These factors may underlie the discordant sibships containing SMA Types I and III (n = 4/46; 8.7%) and SMA Types I and IV (n = 1/46; 2.2%) reported in the current study. Further studies examining SMN2 copy number among siblings are warranted given the importance of SMN2 in phenotype manifestation. Sibling discordance by variation in SMN2 copy number has not been available in studies with large numbers of sibling pairs and has been added to Cure SMA data collection for future studies.
Concordance of motor function is a key aspect of variation among siblings with SMA. Motor function assessments of individuals with SMA using the Hammersmith Functional Motor Scale (HFMS) and the Motor Function Measure (MFM) have characterized discordant SMA subtypes within sibships in several studies [21, 29]. Differences in motor function scale scores in siblings with the same genotype were described. For example, in the study by Medrano et al., of two sisters with SMA Type IIIa, each with three SMN2 copies and assessed at 15 and 13 years of age, respectively, one lost the ability to walk at two years of age (HFMS score, 8; MFM score, 40.62) and the other at 10 years of age (HFMS score, 18; MFM score, 52.08) [21]. Phenotypic differences were observed by Monges et al. in best motor function compared with SMA type in four families (two subtype concordant: males with SMA Type II, females with SMA Type III; two discordant: males with SMA Types I and II, and a male with SMA Type III and his asymptomatic brother) [29]. The rate of phenotypic discordance in the Monges et al. study was 79% (11/14 sibling pairs) [29], which is much higher than an earlier study of 101 siblings in 48 families and much higher than the results presented here (both report 15% discordance rates overall) [20]. Motor function results are not available for this dataset, but it is expected that such measures would enable linkage studies to further elucidate the molecular mechanisms behind sibling discordance in SMA. Describing such mechanisms is becoming increasingly important because disease-modifying therapy alters SMA phenotype manifestation.
Several large studies have suggested that sex may have an influence on SMA phenotype [35, 38]. Although the occurrence of SMA subtype was not stratified by sex in the Cure SMA sibling cohort, concordance and discordance rates in same- and different-sex sibships were not statistically significantly different. When siblings with unknown gender were included in the analysis (N = 716 individuals; 344 sibships), the percent of sibships that were discordant decreased (14.2%; n = 49) and the distribution by subtype among concordant (Type 1:54.9%, Type II: 31.5%, Type III: 12.9%, and Type IV: 0.7%) and discordant sibships (all 3 additional discordant sibships were a combination of Types I and II) were similar to the distribution when sibships with missing gender were excluded from the study analysis.
The small numbers of discordant sibships allowed limited analysis of birth order. Among those patients with available date of birth, the less severe individual was born first in 69.2% of discordant sibships. Of these sibships that included one or more siblings with SMA Type I (n = 14), the less severe individual was born first in nine sibships. Despite the fact that infants with SMA Type I could be born after siblings with a less severe SMA subtype, the concordance of SMA subtype remains high.
The data reflected in this study are part of an ongoing effort to better understand numerous aspects of SMA. As the database has evolved over time, the collection of additional information, such as SMN2 copy number, motor milestone achievement, and respiratory function measures where further discordance may be studied, are now underway. Although there was missing information for 149 individuals leading to a total exclusion of 221 individual siblings (26.1%), missing data is acknowledged as a common issue in observational data [39]. In addition, the Cure SMA database maintains information on unaffected siblings for whom only limited descriptions have previously been published [26]. Together, these data enable more robust descriptions of the occurrence of SMA within families.
In summary, the study of siblings in the Cure SMA dataset is a valuable resource for describing and characterizing the familial aggregation of subtypes. The study of subtype concordance supports the prediction of disease trajectory and enables a better understanding of the burden of illness within families. Moreover, as treatments for SMA are reaching later stages of clinical development and approval, it is anticipated that concordance data in particular will help inform newborn screening initiatives, care pathways, family-planning decision making, and health care–seeking behavior within families affected by SMA. In addition, research questions remain regarding potential SMA modifiers in discordant sibships, and their identification could lead to the development of novel SMA therapies. Additional data collection and analyses ongoing from the Cure SMA dataset may allow answers to these questions.
AUTHOR CONTRIBUTION
CCJ, SFC, JJ, WF, and KH contributed to the conception and design of the study; LB and KH contributed to acquisition, analysis, and interpretation; CCJ, SFC, SPR, JS, and WF contributed to analysis and interpretation; JJ contributed to interpretation. All authors critically revised the manuscript for intellectual content and agree to be accountable for all aspects of the work in ensuring that questions relating to the accuracy or integrity of any part of the work are appropriately investigated and resolved.
CONFLICT OF INTEREST
CCJ, SPR, JS, and WF are/were employees of and hold stock/stock options in Biogen. SFC was a consultant to Biogen at the time the research was conducted. JJ, LB, and KH are employees of Cure SMA.
ACKNOWLEDGMENTS
Biogen provided funding for medical writing support in the development of this paper; Kim Croskery, PhD, from Excel Scientific Solutions wrote the first draft of the manuscript based on input from authors, and Kristen DeYoung from Excel Scientific Solutions copyedited and styled the manuscript per journal requirements. Biogen reviewed and provided feedback on the paper to the authors. The authors had full editorial control of the paper and provided their final approval of all content.
The Cure SMA database has been supported and built by Cure SMA since 1984. The analysis of these data was supported by Biogen (Cambridge, MA, USA).
REFERENCES
[1] | Darras BT . Spinal muscular atrophies. Pediatr Clin North Am. (2015) ;62: (3):743–66. doi: 10.1016/j.pcl.2015.03.010 |
[2] | Lunn MR , Wang CH . Spinal muscular atrophy. Lancet. (2008) ;371: (9630):2120–33. doi: 10.1016/S0140-6736(08)60921-6 |
[3] | Sugarman EA , Nagan N , Zhu H , Akmaev VR , Zhou Z , Rohlfs EM , et al. Pan-ethnic carrier screening and prenatal diagnosis for spinal muscular atrophy: Clinical laboratory analysis of >72,400 specimens. Eur J Hum Genet. (2012) ;20: (1):27–32. doi: 10.1038/ejhg.2011.134 |
[4] | Prior TW , Finanger E . Spinal muscular atrophy. In: AdamMP, ArdingerHH, PagonRA, et al, eds. GeneReviews®. Seattle, WA: University of Washington, Seattle; 1993–2018. |
[5] | Lally C , Jones CC , Cook SF , Farwell W , Staropoli J , Flanders WD . Genetic causes of death in US infants: Findings from the National Center for Health Statistics. Presented at: American Society of Human Genetics Annual Meeting; Orlando, FL, (2017) . |
[6] | Tizzano EF , Finkel RS . Spinal muscular atrophy: A changing phenotype beyond the clinical trials. Neuromuscul Disord. (2017) ;27: (10):883–9. doi: 10.1016/j.nmd.2017.05.011 |
[7] | Shorrock HK , Gillingwater TH , Groen EJN . Overview of current drugs and molecules in development for spinal muscular atrophy. Drugs. (2018) ;78: :293–305. doi: 10.1007/s40265-018-0868-8 |
[8] | Arkblad E , Tulinius M , Kroksmark AK , Henricsson M , Darin N . A population-based study of genotypic and phenotypic variability in children with spinal muscular atrophy. Acta Paediatr. (2009) ;98: (5):865–72. doi: 10.1111/j.1651-2227.2008.01201.x |
[9] | Jedrzejowska M , Milewski M , Zimowski J , Zagozdzon P , Kostera-Pruszczyk A , Borkowska J , et al. Incidence of spinal muscular atrophy in Poland – more frequent than predicted? Neuroepidemiology. (2010) ;34: (3):152–7. doi: 10.1159/000275492 |
[10] | Prior TW . Perspectives and diagnostic considerations in spinal muscular atrophy. Genet Med. (2010) ;12: (3):145–52. doi: 10.1097/GIM.0b013e3181c5e713 |
[11] | Tassie B , Isaacs D , Kilham H , Kerridge I . Management of children with spinal muscular atrophy type 1 in Australia. J Paediatr Child Health. (2013) ;49: (10):815–9. doi: 10.1111/jpc.12291 |
[12] | Kolb SJ , Kissel JT . Spinal muscular atrophy. Neurol Clin. (2015) ;33: (4):831–46. doi: 10.1016/j.ncl.2015.07.004 |
[13] | d’Ydewalle C , Sumner CJ . Spinal muscular atrophy therapeutics: Where do we stand? Neurotherapeutics. (2015) ;12: (2):303–16. doi: 10.1007/s13311-015-0337-y |
[14] | Grotto S , Cuisset JM , Marret S , Drunat S , Faure P , Audebert-Bellanger S , et al. Type 0 spinal muscular atrophy: Further delineation of prenatal and postnatal features in 16 patients. J Neuromuscul Dis. (2016) ;3: (4):487–95. doi: 10.3233/JND-160177 |
[15] | Ogino S , Wilson RB , Gold B . New insights on the evolution of the SMN1 and SMN2 region: Simulation and meta-analysis for allele and haplotype frequency calculations. Eur J Hum Genet. (2004) ;12: (12):1015–23. doi: 10.1038/sj.ejhg.5201288 |
[16] | Jones C , Zielinski D , Vinikoor L , Farwell W . Systematic review of incidence and prevalence of spinal muscular atrophy (SMA). Presented at: 11th European Paediatric Neurology Society Congress; Vienna, Austria, (2015) . |
[17] | Wang CH , Finkel RS , Bertini ES , Schroth M , Simonds A , Wong B , et al. Participants of the International Conference on SMA Standard of Care. Consensus statement for standard of care in spinal muscular atrophy. J Child Neurol. (2007) ;22: (8):1027–49. doi: 10.1177/0883073807305788 |
[18] | Feldkötter M , Schwarzer V , Wirth R , Wienker TF , Wirth B . Quantitative analyses of SMN1 and SMN2 based on real-time LightCycler PCR: Fast and highly reliable carrier testing and prediction of severity of spinal muscular atrophy. Am J Hum Genet. (2002) ;70: (2):358–68. doi: 10.1086/338627 |
[19] | Vitali T , Sossi V , Tiziano F , Zappata S , Giuli A , Paravatou-Petsotas M , et al. Detection of the survival motor neuron (SMN) genes by FISH: Further evidence for a role for SMN2 in the modulation of disease severity in SMA patients. Hum Mol Genet. (1999) ;8: (13):2525–32. doi: 10.1093/hmg/8.13.2525 |
[20] | Rudnik-Schöneborn S , Röhrig D , Morgan G , Wirth B , Zerres K . Autosomal recessive proximal spinal muscular atrophy in 101 sibs out of 48 families: Clinical picture, influence of gender, and genetic implications. Am J Med Genet. (1994) ;51: (1):70–6. doi: 10.1002/ajmg.1320510115 |
[21] | Medrano S , Monges S , Gravina LP , Alias L , Mozzoni J , Araoz HV , et al. Genotype–phenotype correlation of SMN locus genes in spinal muscular atrophy children from Argentina. Eur J Paediatr Neurol. (2016) ;20: (6):910–17. doi: 10.1016/j.ejpn.2016.07.017 |
[22] | Muqit MM , Moss J , Sewry C , Lane RJ . Phenotypic variability in siblings with type III spinal muscular atrophy. J Neurol Neurosurg Psychiatry. (2004) ;75: (12):1762–4. doi: 10.1136/jnn2003.018614 |
[23] | Cuscó I , Barceló MJ , Rojas-García R , Illa I , Gamez J , Cervera C , et al. SMN2 copy number predicts acute or chronic spinal muscular atrophy but does not account for intrafamilial variability in siblings. J Neurol. (2006) ;253: (1):21–5. doi: 10.1007/s00415-005-0912-y |
[24] | Parano E , Pavone L , Falsaperla R , Trifiletti R , Wang C . Molecular basis of phenotypic heterogeneity in siblings with spinal muscular atrophy. Ann Neurol. (1996) ;40: (2):247–51. doi: 10.1002/ana.410400219 |
[25] | Helmken C , Hofmann Y , Schoenen F , Oprea G , Raschke H , Rudnik-Schoneborn S , et al. Evidence for a modifying pathway in SMA discordant families: Reduced SMN level decreases the amount of its interacting partners and Htra2-beta1. Hum Genet. (2003) ;114: (1):11–21. doi: 10.1007/s00439-003-1025-2 |
[26] | Jedrzejowska M , Borkowska J , Zimowski J , Kostera-Pruszczyk A , Milewski M , Jurek M , et al. Unaffected patients with a homozygous absence of the SMN1 gene. Eur J Hum Genet. (2008) ;16: (8):930–4. doi: 10.1038/ejhg.2008.41 |
[27] | Cuscó I , López E , Soler-Botija C , Jesus Barcelo M , Baiget M , Tizzano EF . A genetic and phenotypic analysis in Spanish spinal muscular atrophy patients with c.399_402del AGAG, the most frequently found subtle mutation in the SMN1 gene. Hum Mutat. (2003) ;22: (2):136–43. doi: 10.1002/humu.10245 |
[28] | Capon F , Levato C , Merlini L , Angelini C , Mostacciuolo ML , Politano L , et al. Discordant clinical outcome in type III spinal muscular atrophy sibships showing the same deletion pattern. Neuromuscul Disord. (1996) ;6: (4):261–4. doi: 10.1016/0960-8966(96)00350-1 |
[29] | Monges S , Mozzoni J , Franchi ME , Medrano S , Gravina LP , Araoz HV , et al. Clinical and molecular findings in spinal muscular atrophy siblings. Presented at: 20th SMA Researcher Meeting; Anaheim, CA, (2016) . |
[30] | Belter L , Cook SF , Crawford TO , Jarecki J , Jones CC , Kissel JT , et al. An overview of the Cure SMA membership database: Highlights of key demographic and clinical characteristics of SMA members. J Neuromuscul Dis. (2018) ;5: (2):167–76. doi: 10.3233/JND-170292 |
[31] | Belter L , Crawford T , Jarecki J , Jones C , Kissel J , Schroth M , et al. An overview of the Cure SMA membership database: Highlights of key demographic and clinical characteristics of registrants. Neuromuscul Disord. (2017) ;27: (suppl 2):S129. doi: 10.1016/j.nmd.2017.06.136 |
[32] | Calucho M , Bernal S , Alias L , March F , Vencesla A , Rodriguez-Alvarez FJ , et al. Correlation between SMA type and SMN2 copy number revisited: An analysis of 625 unrelated Spanish patients and a compilation of 2834 reported cases. Neuromuscul Disord. (2018) ;28: (3):208–15. doi: 10.1016/j.nmd.2018.01.003 |
[33] | Belter L , Jones C , Paradis A , Jhaveri M , Reyna S , Hobby K , et al. Cure SMA membership: Findings from the 2019 membership survey. Nerueruomuscular Disord. (2018) ;28: (Suppl. 2):S58 [abstract P.94]. |
[34] | Wirth B , Garbes L , Riessland M . How genetic modifiers influence the phenotype of spinal muscular atrophy and suggest future therapeutic approaches. Curr Opin Genet Dev. (2013) ;23: (3):330–8. doi: 10.1016/j.gde.2013.03.003 |
[35] | Jedrzejowska M , Milewski M , Zimowski J , Borkowska J , Kostera-Pruszczyk A , Sielska D , et al. Phenotype modifiers of spinal muscular atrophy: The number of SMN2 gene copies, deletion in the NAIP gene and probably gender influence the course of the disease. Acta Biochim Pol. (2009) ;56: (1):103–8. |
[36] | Talbot K , Tizzano EF . The clinical landscape for SMA in a new therapeutic era. Gene Ther. (2017) ;24: (9):529–33. doi: 10.1038/gt.2017.52 |
[37] | Winsor EJ , Murphy EG , Thompson MW , Reed TE . Genetics of childhood spinal muscular atrophy. J Med Genet. (1971) ;8: (2):143–8. doi: 10.1136/jmg.8.2.143 |
[38] | Novelli G , Semprini S , Capon F , Dallapiccola B . A possible role of NAIP gene deletions in sex-related spinal muscular atrophy phenotype variation. Neurogenetics. (1997) ;1: (1):29–30. doi: 10.1007/s100480050004 |
[39] | Perkins NJ , Cole SR , Harel O , Tcheten EJ , Sun B , Mitchell EM , et al. Principled approaches to missing data in epidemiolgigical studies. Am J Epidemiol. (2018) ;187: (3):568–75. |


