
An overview of the Cure SMA membership database: Highlights of key demographic and clinical characteristics of SMA members
Abstract
Background:
The Cure SMA database is one of the largest patient reported databases for people affected with SMA.
Objective:
The purpose of this study was to examine a subset of affected SMA persons with types I, II, and III from a patient reported database.
Methods:
Individuals with SMA were selected from the database using a date of first contact to Cure SMA between 2010 and 2016. Data analyzed included age at diagnosis, number of weeks from SMA diagnosis to contacting Cure SMA, and geographic distribution of individuals.
Results:
A total of 1,966 individuals with SMA were included in the analysis. Of these individuals, 51.9% had type I, 32.3% had type II, and 15.8% had type III. The average age of diagnosis for type I patients was 5.2 months, 22.1 months for type II, and 97.8 months for type III. From published incidence, about 59.0% of affected individuals in the US are registered in the Cure SMA database.
Conclusions:
The Cure SMA database is a unique and robust source of patient reported data that informs on the burden of illness and supports the development of new therapeutic modalities.
Abbreviations
CI | Confidence Interval |
NIV | Non-invasive mechanical ventilation |
PedsQL | Pediatric Quality of Life Inventory |
RUSP | Recommended Uniform Screening Panel |
SMA | Spinal Muscular Atrophy |
SMARD | Spinal Muscular Atrophy with Respiratory Distress |
INTRODUCTION
Spinal muscular atrophy (SMA) is an autosomal recessive disorder caused by homozygous mutations of the Survival Motor Neuron 1 gene (SMN1) [1] that affects approximately 1 in 11,000 live births. SMA is characterized by dysfunction and then loss of the alpha motor neurons in the spinal cord, causing progressive muscular weakness and atrophy [2]. There is a wide range of clinical severity in SMA, and the key determinant of disease phenotype is the copy number of SMN2, a low-functioning paralogue of SMN1 [1, 3]. With the recent approval of a therapy that enhances SMN expression from the SMN2 gene and the expectation of widespread early treatment with the adoption of newborn screening protocols, there is reason to expect substantial improvement in the debility in SMA. Key to understanding the impact of this therapy and others to come in future is enumeration of the prevalence, mortality, morbidity, and the present diagnostic journey.
The broad spectrum of SMA manifestation has classically been segregated into subtypes defined by age of onset and maximum motor function [2, 4]. Those with type I SMA, constituting approximately 60% of SMA births, are those identified as evidencing signs of weakness within the first six months of life [2, 4–6] and who never achieve the ability to sit independently. Those defined as having SMA type II account for approximately 30% of SMA births, and manifest weakness by 18 months of age [2, 4, 5] along with the inability to sit, but not walk independently. Another 10% of SMA cases are classified as SMA type III [5], with symptoms appearing after 18 months of age [2, 4]. SMA type III can be further divided into type IIIa and type IIIb depending on whether a child was diagnosed before or after the age of three, respectively [7]. Some clinicians also break out a SMA type IV group by adult onset and only mild motor impairment [2, 4]. Infants with SMA type I usually require both ventilatory and feeding support, with the eventual use of permanent ventilation or death prior to the age of two years [8, 9]. Those with type II often later develop swallowing problems, impaired breathing particularly during sleep or with respiratory illnesses, and scoliosis [2, 4, 7, 10, 11]. Survival of individuals with SMA type II has been documented to be common into the third decade of life [12]. Patients with SMA type III are initially able to walk, but most lose this ability by the age of 40 [7, 11]. Natural history studies have indicated that type III patients have a normal lifespan [7, 11]. Patients with type IV are able to walk in adult years [13].
There are very few published studies of populations addressing the prevalence of SMA. Instead, most of what is known about the SMA population is inferred from small European populations [6] or from small numbers of patients in natural history studies in an academic clinical setting. While this type of data provides longitudinal-medical data about SMA patients seen at the most experienced care centers, it likely does not represent the SMA population as a whole.
The Cure SMA database constitutes one of the largest patient-reported data repositories on SMA patients worldwide. The database was launched in 1996, and since then, an average of 27 newly diagnosed individuals have been contacting Cure SMA each month to provide patient reported data. As of December 31, 2016 there were 6,583 individuals with SMA and their 15,210 family members in the Cure SMA database. Patient reported data captures real world patient experiences, represents a broader spectrum of patients than those being followed at major medical centers, and minimizes certain elements of ascertainment bias that arise from generalizations about those able to enroll in long-term natural history studies. Here we report an analysis of the current database, including, the demographic profile of each SMA type, time to contact Cure SMA post-diagnosis, and survival time. This report provides robust baseline data on the SMA population before outcomes change with the widespread use of new therapies.
METHODS
Patients
Self-identified individuals with SMA were identified from the database extending back from December 31, 2016 to January 1, 2010, the date when Cure SMA first recorded the date of first contact amongst its membership. All patient information sent to the Cure SMA database was automatically assigned a computer-generated household ID number and a personal contact ID number. Only de-identified information was used for data analysis. This study qualified as exempt research by Johns Hopkins Institutional Review Board (IRB00139963).
Aggregated data from the membership of affected individuals included personal contact ID number, birthdate, gender, deceased date, date of first contact to Cure SMA, type of SMA, and diagnosis date.
Statistical analysis
Descriptive statistics were used to report data pertaining to gender, age, age at diagnosis, time from diagnosis to contacting Cure SMA, and state of residence for those individuals. To summarize the average age at diagnosis by clinical characteristics, those with a diagnosis made at less than 1 week of age were removed from analysis; these babies were likely diagnosed in utero or by means of pre-symptomatic screening. To show the community’s engagement in the SMA community and the possible time to information on trials and other research studies, the average number of weeks between an individual receiving an SMA diagnosis and contacting Cure SMA was calculated. To estimate the median age of death, the Kaplan-Meier survival function was used. Survival time was calculated in days from birthdate to the date of death. The data solely represented time to death, and was not a combined endpoint that also included the time of tracheostomy or non-invasive mechanical ventilation (NIV) more than 16 hours per day. For survivors, survival time was right-censored at the date of the most recent team registration date or date of first contact if the individual did not have a team registration date. About 16% of the Cure SMA members had a team registration date, which is the date an individual registered to participate in a fundraising event. Individuals with missing data fields were excluded from an analysis where the field was required.
Geography of self-identified SMA cases
Self-identified individuals were compared to the expected birth prevalence rates by each state. The expected birth prevalence rates of SMA (all types) were calculated by multiplying the published incidence rate of 1 in 11,000 live births to the number of live births recorded by the CDC, National Vital Statistics for US births from 2010–2015 [14]. These rates were then compared to the self-identified cases the Cure SMA database had registered for each state of residence. The normality of the data was tested with both a histogram and regression modeling. A standardized incidence ratio (SIR) was calculated for each state by dividing the total self-identified cases registered by the expected number of new cases. An SIR of 100 indicated that the number of self-identified cases registered was equal to the number of new SMA cases expected. An SIR greater than 100 indicated that more SMA cases were registered than expected and an SIR less than 100 indicated that fewer SMA cases were registered than expected [15]. Poisson confidence intervals for the SIR were calculated using standard methods [16].
Data management and statistical analysis were performed by the research department at Cure SMA. All calculations were made using Stata/IC 14.1 software.
RESULTS
As of December 31, 2016, the Cure SMA database contained 6,583 individuals with SMA. For this report, self-identified individuals with SMA were identified from the database with a date of first contact to Cure SMA between January 1, 2010 and December 31, 2016. Of the 2,216 individuals that were identified in this time period, 250 individuals were excluded due to having distal SMA (n = 7), SMA with respiratory distress (SMARD) (n = 19), Kennedy’s (n = 2) (distal, SMARD, and Kennedy’s are rare conditions caused by a different gene mutation other than SMA) [17–19], type IV SMA (n = 90), and unreported subtype of SMA (n = 132). Individuals with type IV were not included in this analysis because these individuals represent a very rare subset and only 58.8% of individuals with type IV have indicated to Cure SMA that they have a confirmed diagnosis through a genetic test. The final dataset used for this analysis included 1,966 individuals. Of these individuals, 51.9% had type I, 32.3% had type II, and 15.8% had type III. The percentages of type IIIa and type IIIb were not calculated in this analysis.
Demographics
The average age of living individuals at first contact with Cure SMA was 7.0 months for type I, 3.4 years for type II and 11.5 years for type III. Males and females were represented equally, and there was not a statistically significant difference between gender and type of SMA. A total of 70 individuals (52 individuals for type I, 24 individuals for type II, and 4 individuals for type III) were diagnosed pre-symptomatically. For the individuals that were diagnosed symptomatically, the average age of diagnosis for type I was 5.2 months, 22.1 months for type II, and 97.8 months for type III. The median time in weeks for families to reach out to Cure SMA for the first time after a diagnosis was 2 weeks and the average time was 14.4 weeks for type I. The median time was 3 weeks with an average time of 61.3 weeks for type II. For SMA type III, it was 3 weeks and 155.6 respectively. The large disparity between the median and mean exists because of 74 outliers (38 for type I, 33 for type II, and 3 for type III). After removing these outlying observations for time to contact Cure SMA following a diagnosis, the average time (in weeks) was 5.3 for type I, 24.1 for type II, and 157.4 for type III. The majority of patients identified California, Texas, Illinois, and Florida as their current states of residence. Outside of the United States, there were affected individuals from 75 other countries. Tables 1 and 2 summarize these results.
Table 1
Demographics
| All | Type I n = 1,021 | Type II n = 635 | Type III n = 310 | p-value | |
| Gender, n (%) | 0.958 | ||||
| Male | 966 | 497 (51.5%) | 315 (32.6%) | 154 (15.9%) | |
| Female | 934 | 492 (52.7%) | 298 (31.9%) | 144 (15.4%) | |
| Unknown | 66 | 33 (50.7%) | 22 (33.3%) | 12 (18.2%) | |
| Current Age†, n (%) | <0.001 | ||||
| Less than 5 years old | 754 | 433 (57.4%) | 267 (35.4%) | 54 (7.2%) | |
| 6–10 years old | 417 | 99 (23.7%) | 218 (52.3%) | 100 (24.0%) | |
| 11–15 years old | 61 | 3 (4.4%) | 23 (40.6%) | 35 (57.4%) | |
| 16–20 years old | 45 | 3 (6.7%) | 14 (31.1%) | 28 (62.2%) | |
| 21–29 years old | 50 | 3 (6.0%) | 15 (30.0%) | 32 (64.0%) | |
| 30–39 years old | 17 | 1 (5.9%) | 10 (58.8%) | 6 (35.3%) | |
| 40–49 years old | 13 | 1 (7.7%) | 0 | 12 (92.3%) | |
| 50–59 years old | 6 | 0 | 0 | 6 (100.0%) | |
| Greater than 60 years old | 5 | 0 | 0 | 5 (100.0%) | |
| Deceased, n (%) | 441 | 424 (96.2%) | 16 (3.6%) | 1 (0.2%) | <0.001 |
| Age at diagnosis (in months), mean (sd)* | 25.5 (58.2) | 5.2 (6.4) | 22.1 (28.6) | 97.8 (111.9) | <0.001 |
| Time from diagnosis to contacting Cure SMA (in weeks), mean (sd)† | 51.2 (236.3) | 14.4 (100.8) | 61.3 (224.7) | 155.6 (453.1) | <0.001 |
†Removed those that are deceased at time of analysis. *Removed those that were diagnosed pre-symptomatically (less than 1 week of age).
Table 2
State of Residence
| All | Type I n = 806 | Type II n = 460 | Type III n = 232 | p-value | |
| 0.032 | |||||
| Alabama | 30 | 16 (53.3%) | 10 (33.3%) | 4 (13.3%) | |
| Arkansas | 20 | 10 (50.0%) | 9 (45.0%) | 1 (5.0%) | |
| Arizona | 30 | 19 (63.3%) | 7 (23.3%) | 4 (13.3%) | |
| California | 128 | 71 (55.5%) | 39 (30.5%) | 18 (14.1%) | |
| Colorado | 34 | 22 (64.7%) | 9 (26.5%) | 3 (8.8%) | |
| Connecticut | 20 | 10 (50.0%) | 4 (20.0%) | 6 (30.0%) | |
| Florida | 86 | 50 (58.1%) | 20 (23.3%) | 16 (18.6%) | |
| Georgia | 44 | 23 (52.3%) | 17 (38.6%) | 4 (9.1%) | |
| Iowa | 19 | 10 (52.6%) | 8 (42.1%) | 1 (5.3%) | |
| Idaho | 6 | 3 (50.0%) | 2 (33.3%) | 1 (16.7%) | |
| Illinois | 88 | 45 (51.1%) | 24 (27.3%) | 19 (21.6%) | |
| Indiana | 35 | 25 (71.4%) | 6 (17.1%) | 4 (11.4%) | |
| Kansas | 17 | 10 (58.8%) | 5 (29.4%) | 2 (11.8%) | |
| Kentucky | 21 | 10 (47.6%) | 9 (42.9%) | 2 (9.5%) | |
| Louisiana | 24 | 10 (41.7%) | 9 (37.5%) | 5 (20.8%) | |
| Massachusetts | 31 | 13 (41.9%) | 10 (32.3%) | 8 (25.8%) | |
| Maryland | 33 | 19 (57.6%) | 3 (9.1%) | 11 (33.3%) | |
| Maine | 6 | 5 (83.3%) | 1 (16.7%) | 0 | |
| Michigan | 53 | 27 (50.9%) | 16 (30.2%) | 10 (18.9%) | |
| Minnesota | 42 | 17 (40.5%) | 21 (50.0%) | 4 (9.5%) | |
| Missouri | 30 | 17 (56.7%) | 10 (33.3%) | 3 (10.0%) | |
| North Carolina | 44 | 23 (52.3%) | 13 (29.6%) | 8 (18.2%) | |
| Nebraska | 12 | 3 (25.0%) | 6 (50.0%) | 3 (25.0%) | |
| New Hampshire | 15 | 10 (66.7%) | 4 (26.7%) | 1 (6.7%) | |
| New Jersey | 34 | 15 (44.1%) | 13 (38.2%) | 6 (17.7%) | |
| New Mexico | 8 | 4 (50.0%) | 2 (25.0%) | 2 (25.0%) | |
| Nevada | 9 | 4 (44.4%) | 5 (55.6%) | 0 | |
| New York | 62 | 35 (56.5%) | 21 (33.9%) | 6 (9.7%) | |
| Ohio | 62 | 31 (50.0%) | 25 (40.3%) | 6 (9.7%) | |
| Oklahoma | 18 | 8 (44.4%) | 8 (44.4%) | 2 (11.1%) | |
| Oregon | 12 | 6 (50.0%) | 3 (25.0%) | 3 (25.0%) | |
| Pennsylvania | 64 | 31 (48.4%) | 17 (26.6%) | 16 (25.0%) | |
| South Carolina | 29 | 16 (55.2%) | 9 (31.0%) | 4 (13.8%) | |
| Tennessee | 33 | 12 (36.4%) | 16 (48.5%) | 5 (15.2%) | |
| Texas | 116 | 70 (60.3%) | 30 (25.9%) | 16 (13.8%) | |
| Utah | 28 | 17 (60.7%) | 4 (14.3%) | 7 (25.0%) | |
| Virginia | 38 | 25 (65.8%) | 6 (15.8%) | 7 (18.4%) | |
| Washington | 30 | 12 (40.0%) | 14 (46.7%) | 4 (13.3%) | |
| Wisconsin | 39 | 25 (64.1%) | 8 (20.5%) | 6 (15.4%) | |
| West Virginia | 16 | 7 (43.8%) | 7 (43.8%) | 2 (12.5%) | |
| *States with < 5 affected individuals | 32 | 20 (62.5%) | 10 (31.3%) | 2 (6.3%) |
*AK, DE, HI, MS, MT, ND, RI, SD, VT, WY.
Survival
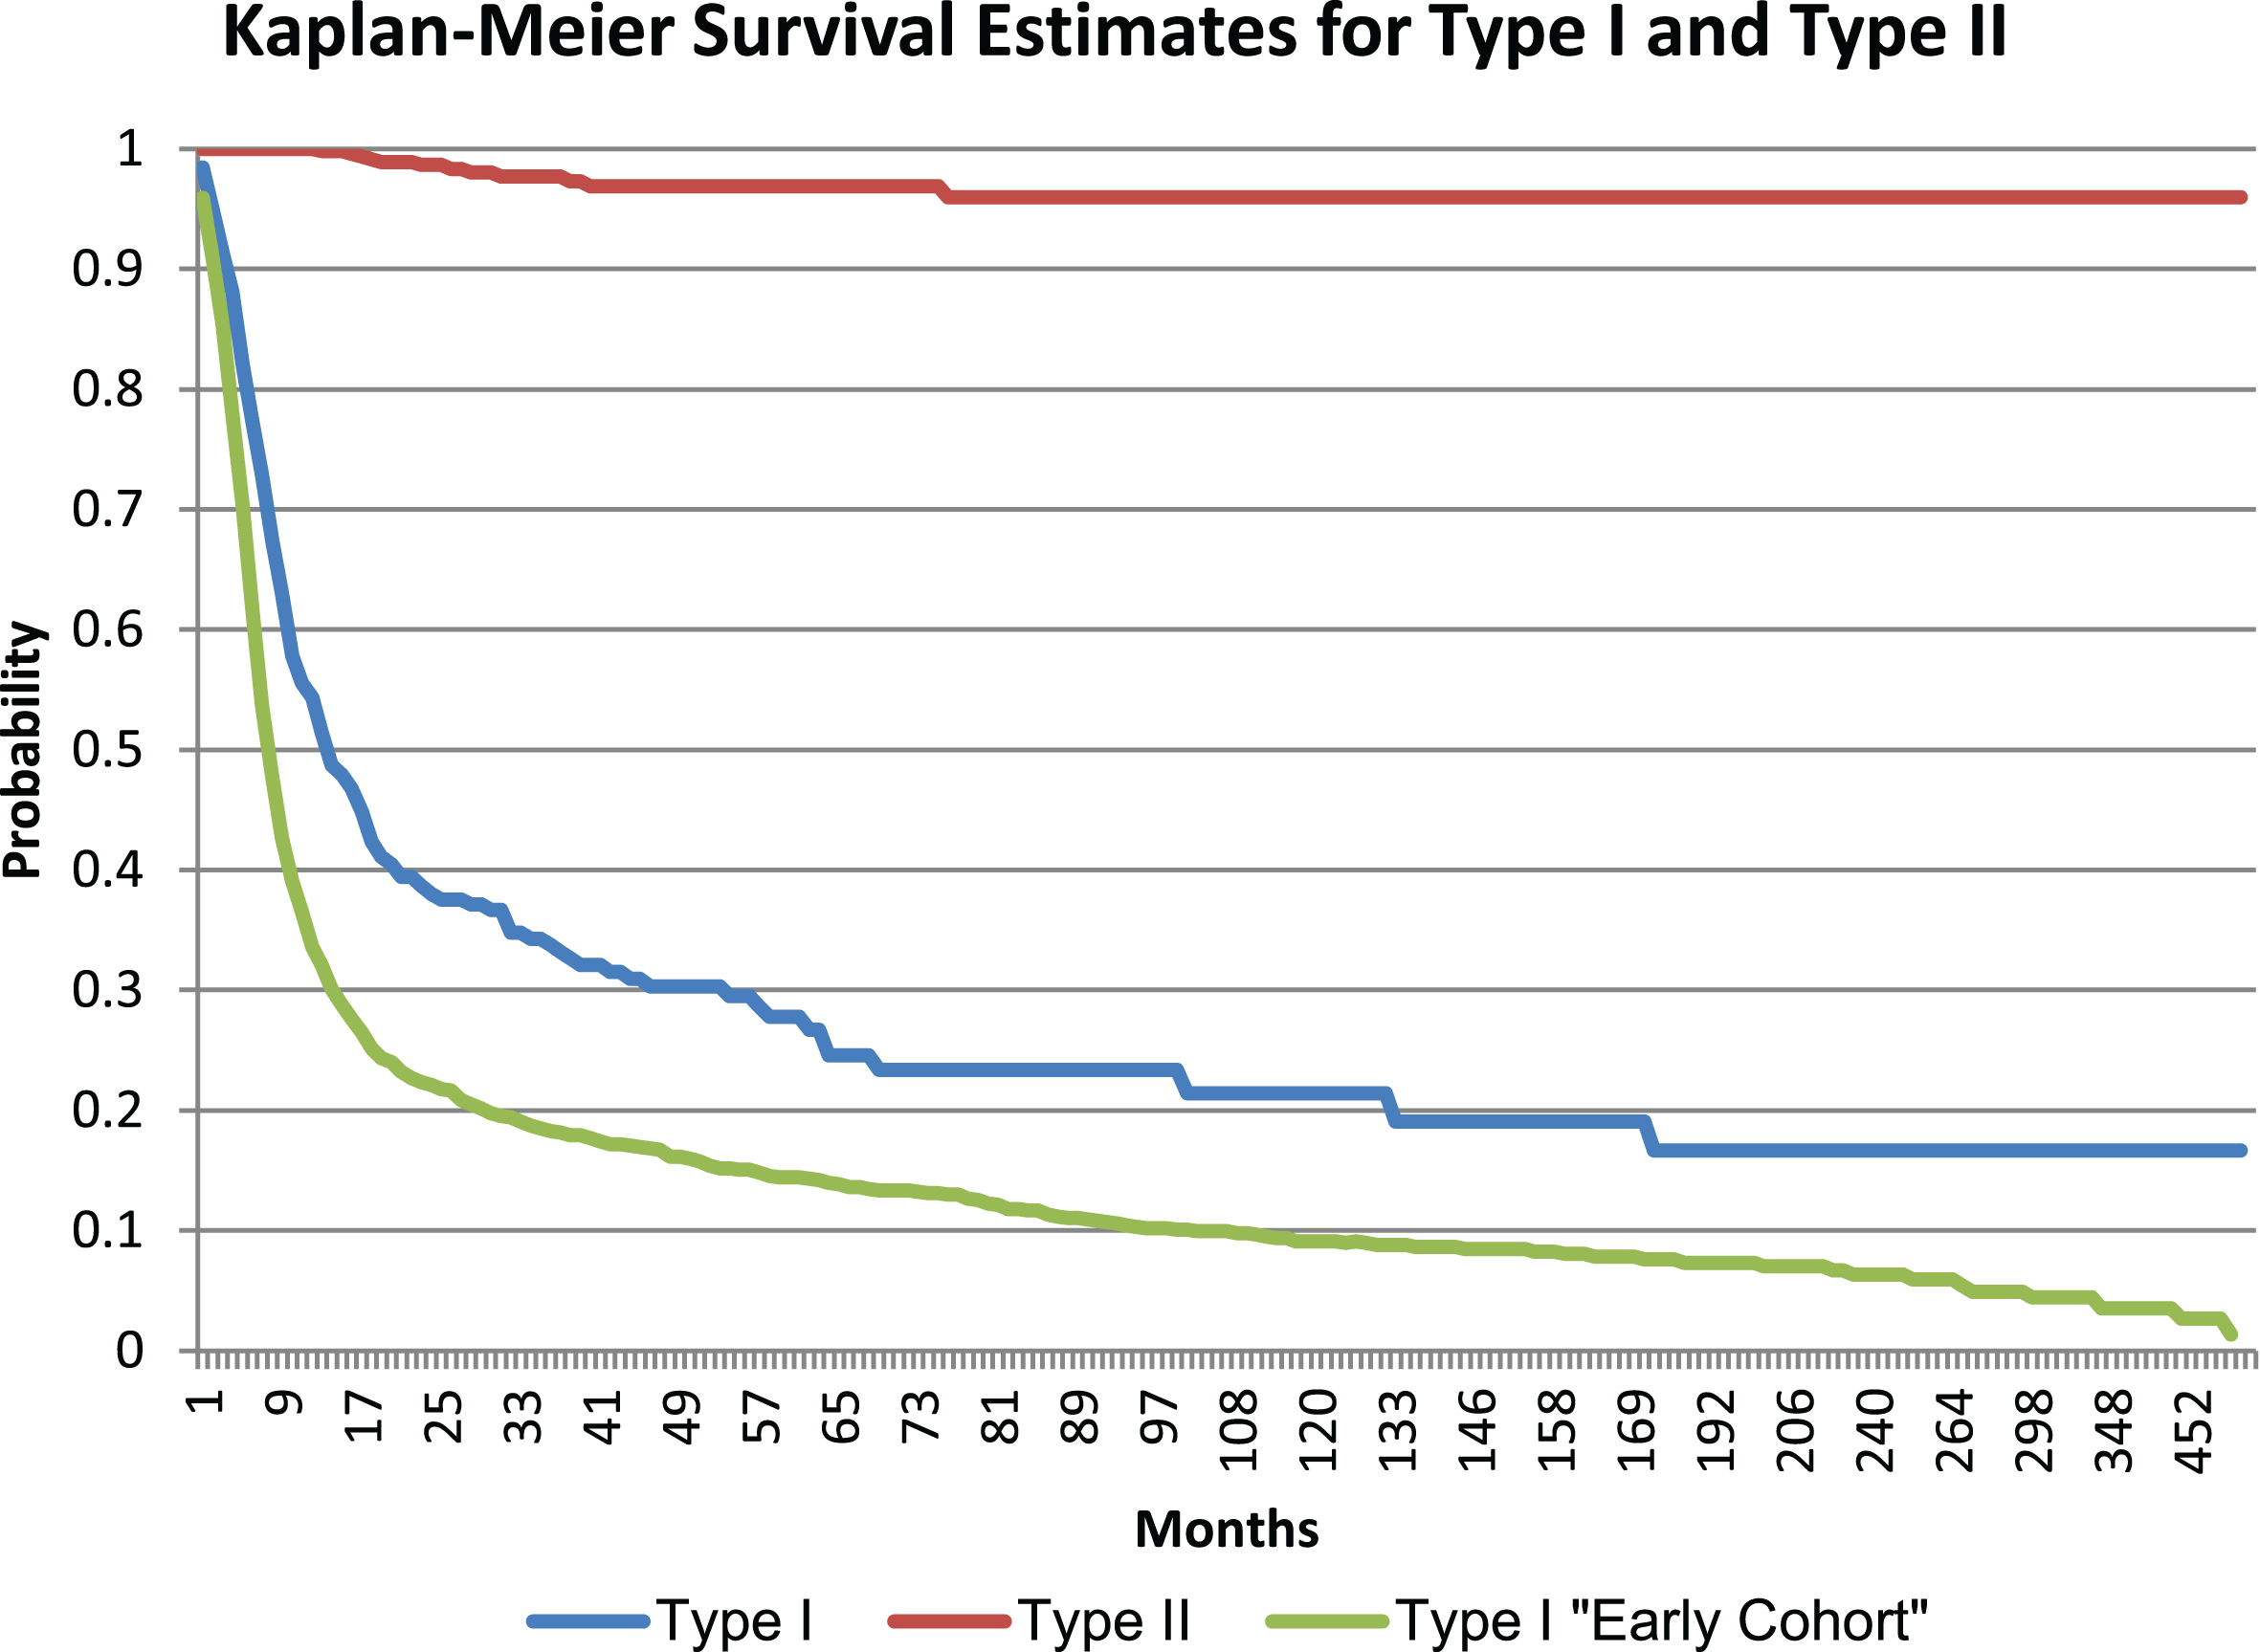
Of the individuals included in the final dataset, 441 individuals were deceased. The majority of deceased individuals (96.1%) had type I, followed by type II (3.6%) and type III (0.2%). The respective mean and median age at death was 10.4 and 7.0 months for type I and 87.2 and 27.0 months for type II. The mean and median age of death for type III was not calculated due to limited data. Individuals without a birthdate (9.6% and 12.3% of individuals with type I and type II, respectively) were excluded from the survival analysis. The Kaplan-Meier estimate for the median survival of individuals with type I was 13.6 months, and the median survival of individuals with type II was 59.9 years. Figure 1 shows these results. In a separate analysis in individuals with type I who came into the Cure SMA database prior to 2010 (n = 1,534), the median survival of individuals was 7.8 months which was a statistically significant (p < 0.0001) shorter survival than the data presented here. Figure 1 also shows the survival curve of this earlier cohort.
Fig.1
Survival Estimates for type I and II SMA.
Geographic distribution of self-identified SMA cases
Using the birth prevalence of 1 in 11,000 live births [20], and the US birth rate [14], 2,158 individuals would be expected to be born with SMA in the US between 2010 and 2015. The Cure SMA database had records on 1,280 individuals with SMA from this time period. The SIR for the total registered individuals and estimated individuals with SMA was 58.87, or almost 60% full enrollment if the calculated birth incidence is correct. States with fewer than 5 registered cases were aggregated into one observation to maintain anonymity. New Hampshire had more SMA cases registered in the Cure SMA database than expected, Minnesota and Connecticut were the only two states that had the expected number of SMA cases registered; all other states had less than the predicted number of SMA cases. Oregon, New York, California, and Nevada, ranked the lowest; i.e. had far fewer SMA cases registered than expected. Table 3 summarizes these results. An additional analysis was completed to determine whether the SIR for the total registered individuals and estimated individuals with SMA was influenced by race-specific birth prevalence rates, but this analysis did not account for any change in the SIR [20].
Table 3
Expected vs Self-Identified Cases
| State | Number of Births: 2010–2015 | Expected SMA incidence | Observed self-identified cases | SIR | Confidence Interval |
| New Hampshire | 75,208 | 7 | 14 | 204.77 | (111.95 – 343.56) |
| West Virginia | 122,945 | 11 | 12 | 107.37 | (55.48 – 187.55) |
| Minnesota | 414,688 | 38 | 38 | 100.80 | (71.33 – 138.35) |
| Connecticut | 219,644 | 20 | 20 | 100.16 | (61.18 – 154.69) |
| Alabama | 355,098 | 32 | 29 | 89.83 | (60.16 – 129.02) |
| Arkansas | 230,831 | 21 | 18 | 85.78 | (50.84 – 135.56) |
| Utah | 307,835 | 28 | 24 | 85.76 | (54.95 – 127.60) |
| Wisconsin | 404,443 | 37 | 31 | 84.31 | (57.29 – 119.68) |
| Nebraska | 157,148 | 14 | 12 | 84.00 | (43.40 – 146.73) |
| Colorado | 394,015 | 36 | 30 | 83.75 | (56.51 – 119.56) |
| Illinois | 959,275 | 87 | 73 | 83.71 | (65.61 – 105.25) |
| South Carolina | 345,451 | 31 | 26 | 82.79 | (54.08 – 121.31) |
| Massachusetts | 433,658 | 39 | 30 | 76.10 | (51.34 – 108.63) |
| Kansas | 237,848 | 22 | 16 | 74.00 | (42.30 – 120.17) |
| Maryland | 439,267 | 40 | 29 | 72.62 | (48.64 – 104.30) |
| Ohio | 833,196 | 76 | 55 | 72.61 | (54.70 – 94.51) |
| Michigan | 682,806 | 62 | 45 | 72.49 | (52.88 – 97.00) |
| Pennsylvania | 853,249 | 78 | 56 | 72.19 | (54.54 – 93.75) |
| Iowa | 233,898 | 21 | 15 | 70.54 | (39.48 – 116.35) |
| Tennessee | 482,733 | 44 | 29 | 66.08 | (44.26 – 94.90) |
| Kentucky | 334,739 | 30 | 20 | 65.72 | (40.15 – 101.50) |
| Louisiana | 379,299 | 34 | 20 | 58.00 | (35.43 – 89.58) |
| Virginia | 617,417 | 56 | 32 | 57.01 | (39.00 – 80.48) |
| Indiana | 502,090 | 46 | 26 | 56.96 | (37.21 – 83.46) |
| North Carolina | 723,390 | 66 | 37 | 56.26 | (39.61 – 77.55) |
| New Jersey | 626,042 | 57 | 32 | 56.23 | (38.46 – 79.37) |
| Missouri | 454,039 | 41 | 22 | 53.30 | (33.40 – 80.70) |
| Florida | 1,300,819 | 118 | 63 | 53.27 | (40.94 – 68.16) |
| Georgia | 787,734 | 72 | 38 | 53.06 | (37.55 – 72.83) |
| Washington | 525,130 | 48 | 25 | 52.37 | (33.89 – 77.31) |
| Oklahoma | 318,091 | 29 | 15 | 51.87 | (29.03 – 85.55) |
| Texas | 2,337,014 | 212 | 105 | 49.42 | (40.42 – 59.93) |
| Idaho | 136,552 | 12 | 6 | 48.33 | (17.74 – 105.20) |
| Arizona | 517,299 | 47 | 22 | 46.78 | (29.32 – 70.83) |
| Oregon | 272,128 | 25 | 10 | 40.42 | (19.38 – 74.38) |
| New York | 1,439,630 | 131 | 52 | 39.73 | (29.67 – 52.10) |
| California | 3,005,405 | 273 | 106 | 38.80 | (31.76 – 46.92) |
| Nevada | 213,330 | 19 | 7 | 36.09 | (14.51 – 74.37) |
| *States with < 5 cases | 1,074,953 | 98 | 40 | 40.82 | (29.17 – 55.58) |
| Total | 23,748,337 | 2,158 | 1,280 | 59.29 | (56.08 – 62.63) |
*Wyoming, Alaska, North Dakota, Mississippi, New Mexico, South Dakota, Hawaii, Montana, Delaware, Maine, Rhode Island, Vermont.
DISCUSSION
Breadth of the Cure SMA database
The Cure SMA database constitutes the largest data repositories on SMA patients worldwide. It is likely to be one of the least biased to many economic and geographic characteristics, as families contact Cure SMA for specific educational, personal, and social network support. Other SMA databases include the Muscular Dystrophy Association reporting 5,500 patients, the International SMA Registry at the University of Indiana reporting 3,000 patients, and the Treat NMD Alliance reporting 5,000 patients enrolled in 2017 [21, 22]. Each of these registries collects a distinct data set (either patient-reported or clinician-entered) from different regional populations and thus contributes unique and valuable information to the SMA community.
Following registration with the Cure SMA database, all newly diagnosed individuals are sent a care package with blankets, age appropriate games and toys, a record keeping binder, and information on SMA. In addition to these individual member services, Cure SMA also assists in research recruitment activities. Each year on average 18 researchers from various hospitals, universities, biomedical facilities, and market research companies have contacted Cure SMA to help with identifying possible research participants for various studies with the broad aim of improving patient outcomes. The database has helped place over 1,100 individuals in over 15 SMA related clinical trials.
Comparison to published birth prevalence
The birth prevalence of SMA in the literature is about 1 in 11,000 [20, 23]. Comparing Cure SMA membership to birthrates in the United States identifies about one case per 20,000 live births. As a voluntary organization, membership registration is expected to be below the estimated birth prevalence. We believe several factors influence this gap. The first factor relates to potential birth incidence differences in racial and ethnicity populations. Carrier rates for SMA are lower in self-identified Hispanics and Asians than that of pan-ethnic population [20]. In states with higher proportions of Hispanics and Asians, the overall expected incidence of SMA would be lower than the calculated incidence when considering race-specific carrier rates [20] and therefore would explain the gap between expected and observed registration. Other factors that might diminish membership rates include rural or urban residence, low socioeconomic status (pre-existing or related to the diagnosis), and concern over one’s privacy. Differences in SIR rates between states exceed those explicable by these factors, however, and likely reflect regional differences in the formation of family support networks and awareness of Cure SMA programs.
Comparison to published diagnostic times
A critical metric to patient outcomes is diagnostic delay. The Cure SMA database reports the average age of diagnosis to be 5.2 months, 22.1 months, and 97.8 months each for types I, II, and III SMA, similar to that reported in a recent systematic literature review of 21 case studies that reported weighted mean ages at age of genetic diagnosis of 6.3, 20.7, and 50.3 months for types I, II, and III [24]. The diagnosis times for patients with type III SMA are highly variable from both the Cure SMA database and the systematic literature review. An average age of diagnosis of over 6 months of age for type I SMA, is particularly problematic as there is strong evidence in SMA type I that the irreplaceable loss of motor neurons begins early in the perinatal period, with severe denervation in the first 3 months of life and loss of more than 90% of motor units within 6 months of age [25, 26]. This identified delay in diagnosis that depends upon the late-occurring appearance of clinical signs [27, 28], combined with efficacy of early treatment [29, 30], highlights the need for, and advantage of, diagnosis by means of comprehensive unbiased screening of newborn infants. In fact, because of the urgent need for SMA newborn screening, Cure SMA nominated SMA for inclusion on the recommended uniform screening panel (RUSP) in February 2017. In February 2018 Secretary’s Advisory Committee on Heritable Disorders in Newborns and Children (ACHDNC) recommended to the Health and Human Services Secretary that SMA be added to the RUSP.
Comparison to published natural history
The median survival time for type I SMA in the Cure SMA database from 2010 to 2016 is 13.6 months. This is consistent with a recent natural history study that was first was conducted at four clinical sites expert in SMA, reporting a median survival of 10.5 months in infants with type I SMA and two copies of SMN2 and 13.5 months when including infants with SMA type I and both 2 and 3 copies of SMN2 [9]. Although we do not have information on genotype, we expect those in the Cure SMA database with type I to include both 2 and 3 copies of SMN2. In earlier studies survival in clinically identified babies with SMA type I approximated 8–10 months [27, 28]; which is consistent to the Cure SMA database median survival of 7.8 months for those who contacted Cure SMA prior to 2010. This increase in survival over time both in the Cure SMA database and in earlier studies show that there has been an increase in supportive care in recent years through the use of noninvasive pulmonary support and the use of gastrostomy tube feeding to prevent aspiration and provide adequate nutrition, which supports the need for early intervention by an experienced care team [29]. While the median survival time for those with type II was 59.9 years, it is important to note that 97.5% of the individuals with type II in the Cure SMA database are living. Natural history studies in type II and III SMA reflect survival well into adulthood [6, 7, 10, 11].
Limitations
As with any patient reported database, there is enrollment bias; patients who reach out to Cure SMA after diagnosis may not represent the entire SMA population. Patient reported data is vulnerable to errors in memory, and reporting inaccurate or incomplete information, such as only providing the year an individual was born or diagnosed may further degrade the accuracy. Cure SMA membership may represent a more engaged population, especially if there is a family history of SMA. Those who have not been diagnosed with SMA or live in areas with limited expertise in SMA may not know to contact Cure SMA. However, the Cure SMA members likely represent a broader portion of the population than a study in a single center or a tertiary care center. As the Cure SMA program supports all ages and types of SMA, members likely represent a broader range of population than is seen by Children’s Hospital-based programs.
Another limitation is that Cure SMA members are not providing genetic information to validate the diagnosis. Although the SMA phenotype is very distinctive and an SMA diagnosis is likely to be correct, one study reported that only 71% of SMA patients have been diagnosed with a genetic test [29]. Genetic testing was widely accepted by 2010, but those with clinical diagnosis carried through the start date of this interval likely had a lower percentage of genetic confirmation.
Lastly, the lack of race and ethnicity birth data precluded an analysis of whether or not the number of self-identified cases relates to ethnic and racial characteristics of individual states. Hispanics and Asians have a lower projected SMA incidence than the general population, and it follows that states with a higher proportion of Hispanics and Asians would have a lower overall incidence of SMA than the general population. The geographic distribution and ethnic composition of the Cure SMA members relative to publicly available census data was examined and the analyses broadly indicate that approximately 60% of individuals affected by SMA register with Cure SMA but this data warrants further exploration and consideration as Cure SMA continues to advance its mission to the SMA community.
CONCLUSION
The demographic and clinical data available from 1,996 individuals of the Cure SMA membership can help inform outreach activities and the planning, coordination and delivery of healthcare services. It also provides a baseline against which advances associated with better treatment and newborn screening programs can be compared. The Cure SMA membership data supports further understanding of the burden of illness, treatment patterns, and health status of the patient community. This is particularly important data to establish a baseline as nusinersen becomes widely available, and the other 18 drugs in the SMA drug pipeline move forward [31].
CONFLICT OF INTEREST
Belter, Jarecki, and Hobby are employees of Cure SMA and have no personal financial interest in any SMA drug program; Jones is an employee of and holds stock/stock options in Biogen. Cook is a paid consultant to Biogen. Crawford has been an advisor/consultant to AveXis, Biogen, Cytokinetics, Roche, Sarepta, Catalyst, Marathon, Novartis, SMA Foundation, and Cure SMA. Schroth has been an advisory committee member to AveXis, Biogen, IONIS Pharmaceuticals, and paid consultant, chair, and medical advisory council member to Cure SMA. Kissel has been funded by NeuroNEXT clinical trials. Cure SMA has received support from Biogen for the collection of additional information to maximize completion of data in Cure SMA’s data fields.
ACKNOWLEDGMENTS
Funding to support database analyses was provided by Biogen.
REFERENCES
[1] | Lefebvre S , Burglen L , Reboullet S , Clermont O , Burlet P , Viollet L , et al. Identification and characterization of a spinal muscular atrophy - determining gene. Cell. (1995) ;80: (1):155–65. |
[2] | Arnold WD , Kassar D , Kissel JT . Spinal Muscular Atrophy: Diagnosis and Management in a New Therapeutic Era. Muscle Nerve. (2015) ;51: (2):157–67. |
[3] | Feldkotter M , Schwarzer V , Wirth R , Wienker TF , Wirth B . Quantitative analyses of SMN1 and SMN2 based on real-time lightCycler PCR: Fast and highly reliable carrier testing and prediction of severity of spinal muscular atrophy. Am J Hum Genet. (2002) ;70: (2):358–68. |
[4] | Wang CH , Finkel RS , Bertini ES , Schroth M , Simonds A , Wong B , et al. Consensus Statement for Standard of Care in Spinal Muscular Atrophy. J Child Neurol. (2007) ;22: (8):1027–49. |
[5] | Ogino S , Leonard DG , Rennert H , Ewens WJ , Wilson RB . Genetic risk assessment in carrier testing for spinal muscular atrophy. Am J Med Genet. (2002) ;110: (4):301–7. |
[6] | Verhaart IE , Robertson A , Wilson IJ , Aartsma-Rus A , Cameron S , Jones CC , et al. Prevalence, incidence and carrier frequency of 5q-linked spinal muscular atrophy - a literature review. Orphanet J Rare Dis. (2017) . |
[7] | Zerres K , Rudnik-Schoneborn S . Natural history in proximal spinal muscular atrophy. Clinical analysis of 445 patients and suggestions for a modification of existing classifications. Arch Neurol. (1995) ;52: (5):518–23. |
[8] | Kolb SJ , Coffey CS , Yankey JW , Krosschell K , Arnold WD , Rutkove SB , et al. Baseline results of the NeuroNEXT spinal muscular atrophy infant biomarker study. Ann Clin Transl Neurol. (2016) ;3: (2):132–45. |
[9] | Finkel RS , McDermott MP , Kaufmann P , Darras BT , Chung WK , Sproule DM , et al. Observational study of spinal muscular atrophy type I and implications for clinical trials. Neurology. (2014) ;83: (9):810–17. |
[10] | Kaufmann P , McDermott MP , Darras BT , Finkel R , Kang P , Oskoui M , et al. Observational study of spinal muscular atrophy type 2 and Functional outcomes over 1 year. Arch Neurol. (2011) ;68: (6):779–86. |
[11] | Zerres K , Rudnik-Schoneborn S , Forrest E , Lusakowska A , Borkowska J , Hausmanowa-Petrusewicz I . A collaborative study on the natural history of childhood and juvenile onset proximal spinal muscular atrophy (type II and III SMA): 569 patients. J Neurol Sci. (1997) ;146: (1):67–72. |
[12] | Finkel RS , Sejersen T , Mercuri E . 218th ENMC International Workshop: Revisiting the consensus on standards of care in SMA. Neuromuscul Disord. (2017) ;596–605. |
[13] | Lunn MR , Wang CH . Spinal muscular atrophy. Lancet. (2008) ;(371):2120–33. |
[14] | Centers of Disease Control and Prevention. New Released for Birth Data. National Center for Health Statistics [Internet]. Atlanta: Centers of Disease Control and Preventrion (US). Available from: http://www.cdc.gov/nchs/nvss/new_nvss.htm. |
[15] | Massachusetts Department of Public Health, Bureau of Environmental Health Assessment. Explanation of a Standardized Incidence Ratio (SIR) And 95% Confidence Interval [Internet]. 1998. Available from: http://www.mass.gov/eohhs/docs/dph/environmental/investigations/sir-explanation.pdf. |
[16] | Esteve J , Benhamou E , Raymond L . Statistical Methods in Cancer Research. Vol IV: . Lyon: IARC Scientific Publications; (1994) . |
[17] | Eckart M , Guenther UP , Idkowiak J , Varon R , Grolle B , Boffi P , et al. The Natural Course of Infantile Spinal Muscular Atrophy With Respiratory Distress Type 1 (SMARD1). Pediatrics. (2012) ;129: (1):148–56. |
[18] | Viollet L , Barois A , Rebeiz JG , Rifai Z , Burlet P , Zarhrate M , et al. Mapping of autosomal recessive chronic distal spinal muscular atrophy to chromosome 11q13. Ann Neurol. (2002) ;51: (5):585–92. |
[19] | Finsterer J . Bulbar and spinal muscular atrophy (Kennedy’s disease): A review. Euro J Neurol. (2009) ;16: (5):556–61. |
[20] | Sugarman EA , Nagan N , Zhu H , Akmaev VR , Zhou Z , Rohlfs EM , et al. Pan-ethnic Carrier Screening and Prenatal Diagnosis for Spinal Muscular Atrophy: Clinical Laboratory Analysis of>72,400 Specimens. Eur J Hum Genet. (2011) ;(20):27–32. |
[21] | Kayadjanian N , Burghes A , Finkel RS , Mercuri E , Rouault F , Schwersenz I , et al. SMA-EUROPE workshop report: Opportunities and challenges in developing clinical trials for spinal muscular atrophy in Europe. Orphanet J Rare Dis. (2013) ;8: (44). |
[22] | Verhaart IEC , Robertson A , Leary R , McMacken G , König K , Kirschner J , et al. A multi-source approach to determine SMA incidence and research ready population. J Neurol. (2017) ;264: (7):1465–73. |
[23] | Prior TW . Carrier screening for spinal muscular atrophy. Genet Med. (2008) ;10: (11):840–42. |
[24] | Lin CW , Kalb SJ , Yeh WS . Delay in Diagnosis of Spinal Muscular Atrophy: A Systematic Literature Review. Pediatr Neurol. (2015) ;53: (4):293–300. |
[25] | Finkel RS . Electrophysiological and motor function scale association in a pre-symptomatic infant with spinal muscular atrophy type I. Neuromuscul Disord. (2013) ;23: (2):112–15. |
[26] | Swoboda KJ , Prior TW , Scott CB , McNaught TP , Wride MC , Reyna SP , et al. Natural history of denervation in SMA: Relation to age, SMN2 copy number, and function. Ann Neurol. (2005) ;57: (5):704–12. |
[27] | Pearn JH , Wilson J . Acute Werdnig-Hoffmann disease: Acute infantile spinal muscular atrophy. Arch Dis Child. (1973) ;48: (6):425–30. |
[28] | Thomas NH , Dubowitz V . The Natural History of Type I (Severe) Spinal Muscular Atrophy. Neuromusc Disord. (1994) ;4: (5/6):497–502. |
[29] | Oskoui M , Levy G , Garland CJ , Gray JM , O’Hagen J , De Vivo DC , et al. The changing natural history of spinal muscular atrophy type 1. Neurology. (2007) ;69: (20):1931–36. |
[30] | De Vivo DC , Hwu WL , Reyna SP , Farwell W , Gheuens S , Sun P , et al. Interim Efficacy and Safety Results from the Phase 2 NURTURE Study Evaluating Nusinersen in Presymptomatic Infants With Spinal Muscular Atrophy. Presented at American Academy of Neurology. (2017) ; Boston, MA. |
[31] | Cure SMA. SMA Drug Pipeline. Presented at 2017 Annual SMA Conference. 2017; Orlando, FL. |


