Mammalian Mss51 is a Skeletal Muscle-Specific Gene Modulating Cellular Metabolism
Abstract
Background:
The transforming growth factor β (TGF-β) signaling pathways modulate skeletal muscle growth, regeneration, and cellular metabolism. Several recent gene expression studies have shown that inhibition of myostatin and TGF-β1 signaling consistently leads to a significant reduction in expression of Mss51, also named Zmynd17. The function of mammalian Mss51 is unknown although a putative homolog in yeast is a mitochondrial translational activator.
Objective:
The objective of this work was to characterize mammalian MSS51.
Methods:
Quantitative RT-PCR and immunoblot of subcellular fractionation were used to determine expression patterns and localization of Mss51. The CRISPR/Cas9 system was used to reduce expression of Mss51 in C2C12 myoblasts and the function of Mss51 was evaluated in assays of proliferation, differentiation and cellular metabolism.
Results:
Mss51 was predominantly expressed in skeletal muscle and in those muscles dominated by fast-twitch fibers. In vitro, its expression was upregulated upon differentiation of C2C12 myoblasts into myotubes. Expression of Mss51 was modulated in response to altered TGF-β family signaling. In human muscle, MSS51 localized to the mitochondria. Its genetic disruption resulted in increased levels of cellular ATP, β-oxidation, glycolysis, and oxidative phosphorylation.
Conclusions:
Mss51 is a novel, skeletal muscle-specific gene and a key target of myostatin and TGF-β1 signaling. Unlike myostatin, TGF-β1 and IGF-1, Mss51 does not regulate myoblast proliferation or differentiation. Rather, Mss51 appears to be one of the effectors of these growth factors on metabolic processes including fatty acid oxidation, glycolysis and oxidative phosphorylation.
LIST OF ABBREVIATIONS
2-DG, 2-deoxy-D-glucose; Acadl, acyl-CoA dehydrogenase, long chain (also called LCAD); Acads, acyl-CoA dehydrogenase, short chain (also called SCAD); Acadvl, acyl-CoA dehydrogenase, very long chain (also called VLCAD); ActRIIB-Fc, soluble Activin receptor type IIB; Alas1, delta-aminolevulinic acid synthase 1; AMPKα, AMP-activated protein kinase alpha; ANOVA, analysis of variance; Atp5o, ATP synthase, H+ transporting, mitochondrial F1 complex, O subunit; β2 m, β-2-microglobulin; BCA, bicinchoninic acid; Cas9, CRISPR-associated protein 9; Cd36, cluster of differentiation 36; CK, creatine kinase; Cox, cytochrome c oxidase; Cpt, carnitine palmitoyltransferase; CRISPR, clustered regularly interspaced short palindromic repeats; Cs, citrate synthase; Cycs, cytochrome c, somatic; DAPI, 4′,6-diamidino-2-phenylindole; DMEM, Dulbecco’s modified Eagle’s Medium; ECAR, extracellular acidification rate; ECL, electrochemiluminescence; EDL, extensor digitorum longus; EdU, 5-ethynyl– 2′-deoxyuridine; Eno3, enolase 3 (beta, muscle); Esrr, estrogen related receptor; FACS, fluorescence-activated cell sorting; Fasn, fatty acid synthase; FCCP, carbonyl cyanide-p-trifluoromethoxyphenylhydrazone; GAPDH, glyceraldehyde 3-phosphate dehydrogenase; GCN5L2, general control of amino acid synthesis, yeast, homolog-like 2; GDF-8, growth/differentiation factor 8 (myostatin); GDF-11, growth/differentiation factor 11; gRNA, guide RNA; GTEx, Genotype-Tissue Expression; Hk2, hexokinase 2; IGF-1, insulin-like growth factor-1; Lipe, hormone sensitive lipase (also called HSL); Mss51, Mss51 mitochondrial translational activator; Mstn, myostatin; MyHC, myosin heavy chain; Nfe2l2, nuclear factor, erythroid 2-like 2 (also called Nrf2); Nrf1, nuclear respiratory factor-1; OCR, oxygen consumption rate; ORF, open reading frame; Pdk4, pyruvate dehydrogenase lipoamide kinase 4; Pfk-1, phosphofructokinase 1; PGC1, peroxisome-proliferator activated receptor gamma coactivator 1; Pgk1, phosphoglycerate kinase 1; PPAR, peroxisome-proliferator activated receptor; PVDF, polyvinylidene fluoride; qRT-PCR, quantitative reverse transcription polymerase chain reaction; RPKM, reads per kilobase per million reads mapped; SDS-PAGE, sodium dodecyl sulfate polyacrylamide gel electrophoresis; Sirt1, sirtuin 1; Slc2a4, solute carrier family 2 member 4 (also called Glut4); Socs7, suppressor of cytokine signaling 7; Srebf1, sterol regulatory element binding transcription factor 1; SUnSET, Surface Sensing of Translation; TBP, TATA box binding protein; TBS, Tris-buffered saline; Tfam, transcription factor A, mitochondrial; TGF-β, transforming growth factor β; Ucp, uncoupling protein; VDAC, voltage-dependent anion channel; WVL, white vastus lateralis; Zmynd17, zinc-finger MYND-domain containing protein 17.
INTRODUCTION
Myostatin, or growth/differentiation factor 8 (GDF-8), is a member of the TGF-β superfamily and a negative regulator of muscle growth [1]. Myostatin inhibition has been shown to increase regeneration and decrease fibrosis of skeletal muscle and is thus of high interest for the treatment of acquired and inherited conditions where muscle is not able to regenerate efficiently [2– 7]. An important additional feature of myostatin inhibition that may indicate potential therapeutic use in insulin resistance and obesity is its modulation of skeletal muscle metabolism [8]. Constitutive deletion of myostatin leads to changes in fiber type composition of skeletal muscle with a decrease in type I/type IIA oxidative fibers and an increase in type IIB glycolytic fibers [9– 11]. Myostatin deletion or postnatal inhibition improves insulin sensitivity, increases glucose uptake into skeletal muscle and decreases total body fat [12– 14]. Myostatin deletion suppresses fat accumulation and abnormal glucose metabolism in agouti lethal yellow (A(y)) and obese (ob/ob) mice and transgenic overexpression of a dominant negative activin receptor type IIB resolves the severe diabetes of the lipodystrophy A-ZIP mouse [15, 16]. Treating mice fed high-fat diets with postnatal inhibitors of myostatin reduces the development of insulin resistance and fat accumulation [17, 18]. However, the specific targets of myostatin and other TGF-β family members on genes producing these metabolic effects have not been clarified.
In a previous study, we profiled gene expression in skeletal muscle of mice treated with a soluble activin type IIB receptor (ActRIIB-Fc), the putative receptor of myostatin and activin A [19]. One of the genes whose expression was most significantly altered was Mss51 mitochondrial translational activator, named after its putative yeast homolog Mss51 and previously known as Zmynd17. Mss51 was downregulated 4.3-fold in response to acute, and 3.3-fold in response to chronic treatment with ActRIIB-Fc, suggesting that Mss51 might be an effector or downstream target of myostatin or activin A [19].
Similar results have been seen in numerous other published studies. Mss51 was downregulated 2.7-fold in skeletal muscle of mice where the myostatin gene was deleted post-developmentally [20], 2.8-fold when mice were treated with myostatin neutralizing antibody JA16 [21] and 4.8-fold in transgenic mice expressing a skeletal-muscle specific, myostatin inhibitory pro-peptide [22]. Additionally, Mss51 expression decreased 2.2-fold in skeletal muscle of transgenic mice expressing a skeletal muscle-specific dominant negative TGF-β receptor [23]. The consistent downregulation of Mss51 expression in response to numerous methods of postnatal TGF-β superfamily inhibition suggested that Mss51 might have a unifying role in skeletal muscle function.
The function of Mss51 in mammals has not been previously reported. In the yeast Saccharomyces cerevisiae, Mss51 couples the synthesis of cytochrome c oxidase subunit 1 (COX1) to the assembly of the cytochrome c oxidase complex of the respiratory chain in the mitochondria [24]. Yeast Mss51 also senses heme and oxygen availability to regulate cytochrome c oxidase biogenesis [25]. Iterative orthology prediction using Ortho-Profile demonstrated that the human MSS51 protein is a putative homolog of the yeast Mss51 protein, and that human MSS51 has a mitochondrial localization signal [26]. However, a global pairwise alignment (using the Needleman-Wunsch algorithm) between yeast Mss51 [NCBI RefSeq: NP_013304.1] and mouse Mss51 [RefSeq: NP_083380.1] revealed only 19% amino acid identity (91/490 residues). This suggested that Mss51, a newly recognized target of myostatin and other TGF-β family member signaling, may have a novel function in mammals. Here we investigate the expression and function of Mss51 in skeletal muscle.
MATERIALS AND METHODS
Cell culture
C2C12 cells (ATCC, Manassas, VA) were maintained in Dulbecco’s Modified Eagle’s Medium (DMEM, Life Technologies, Carlsbad, CA, USA) supplemented with 10% fetal bovine serum (Sigma-Aldrich, St. Louis, MO). Differentiation was induced when cells reached approximately 80% confluence by switching to differentiation medium, DMEM supplemented with 2% horse serum (Life Technologies). Cells were treated with growth factors or inhibitors after three days of differentiation. For treatment with the inhibitors ActRIIB-Fc (generously provided by Qian Wang, Stony Brook University Medical Center, produced as previously described [27]) and TGF-β1/2/3 neutralizing antibody 1D11 (R&D Systems, Minneapolis, MN), media was changed to DMEM supplemented with 0.1% bovine serum albumin 24 hours before the addition of the inhibitors. For treatment with recombinant myostatin, activin A, TGF-β1 and insulin-like growth factor 1 (IGF-1) (all obtained from R&D Systems), media was changed to DMEM supplemented with 0.1% bovine serum albumin and the indicated growth factor on the third day post differentiation media change. For all treatments, cells were incubated for 5 hours and harvested in TRIzol (Life Technologies) for qRT-PCR analysis.
Skeletal muscle acquisition
Skeletal muscle was obtained from mice for qRT-PCR and humans for subcellular fractionation and Western blots. All animal experiments were conducted in accordance with the guidelines prescribed by the Institutional Animal Care and Use Committee at the Johns Hopkins University School of Medicine. Ten to twelve week-old female C57BL/6J mice (The Jackson Laboratory, Bar Harbor, ME, USA) were maintained under a 12:12 hour light:dark schedule with ad libitum access to food and water. Mice were euthanized by inhalation overdose of isoflurane followed by cervical dislocation. From three mice, the brain, heart, kidney, liver, small intestine, diaphragm, and quadriceps were harvested. From three other mice, the soleus, diaphragm, long head of the triceps, extensor digitorum longus (EDL), and white vastus lateralis (WVL) were harvested. Tissues were minced and frozen in TRIzol for qRT-PCR analysis.
Acquisition of human skeletal muscle was approved by the Johns Hopkins Medicine Institutional Review Board. Written informed consent was obtained for the collection and use of human tissue samples. Human samples of deltoid muscle were obtained by open muscle biopsy of a living volunteer and from an autopsy donor and were stored frozen prior to subcellular fractionation.
CRISPR/Cas9-mediated disruption of Mss51 locus in C2C12 cells
In order to decrease Mss51 expression, the Mss51 genomic locus was disrupted in C2C12 cells using the clustered regularly interspaced short palindromic repeats (CRISPR)/Cas9 system for genome engineering [27]. Guide RNA (gRNA) target sequences and plasmids were designed and synthesized through the University of Massachusetts Medical School’s Mutagenesis Core, which provided a plasmid expressing both the CRISPR gRNA and the RNA-guided DNA endonuclease Cas9 under independent promoters, as well as a reporter plasmid containing a non-functional GFP ORF, disrupted by homology arms flanking DNA sequence containing the Mss51-specific CRISPR target sequence [28]. Proliferating C2C12 cells were transfected with the CRISPR/Cas9 plasmid and disrupted GFP reporter plasmid using an Amaxa Nucleofector II and Cell Line Nucleofector Kit V (Lonza, Walkersville, MD, USA) according to manufacturer’s instructions. The target sequence within Mss51, depicted in Fig. 4A, was cleaved by the CRISPR/Cas9 complex and re-sealed by non-homologous end joining. Simultaneously, the CRISPR/Cas9 complex also cleaved the disrupted GFP reporter plasmid, which was re-sealed by homology-directed repair using the homology arms flanking the cut site, allowing for functional expression of GFP only when the CRISPR/Cas9 complex was present. After 24 hours, transfected cells were isolated by fluorescence-activated cell sorting using a FACSAria Ilu (BD Biosciences, Franklin Lakes, NJ, USA), shown schematically in Fig. 4B. In parallel, control cells were transfected with a plasmid expressing functional GFP and subjected to the same cell sorting process as the Mss51-disrupted cells. Pooled populations of Mss51-disrupted and control cells were collected and expanded for comparative analysis. Cells were allowed to differentiate into myotubes for six days before analysis unless otherwise stated.
Cell proliferation and differentiation
To compare rates of cell proliferation, incorporation of the nucleoside analog 5-ethynyl– 2′-deoxyuridine (EdU) was measured using the Click-iT EdU Alexa Fluor 594 Imaging Kit per manufacturer’s instructions (Life Technologies). To compare myotube differentiation, cells were stained with anti-sarcomeric myosin (MF20-s, DSHB, Iowa City, IA, USA, 1:1) after fixing with 4% paraformaldehyde (Electron Microscopy Sciences, Hatfield, PA, USA), permeabilizing with 0.1% Triton X-100 (Fisher Scientific, Hampton, NH, USA), and blocking with 5% normal goat serum (Vector Laboratories, Burlingame, CA, USA). For both proliferation and differentiation, images were acquired using an EVOS FL Cell Imaging System equipped with a 20×/0.45 NA objective (Life Technologies). Images were analyzed using ImageJ (National Institutes of Health, Bethesda, MD, USA). The myofusion index was calculated as the percentage of nuclei that were found in MF20-positive fibers. As an additional measure of differentiation, creatine kinase (CK) activity was compared between control and Mss51-disrupted cells using the EnzyChrom Creatine Kinase Assay Kit (BioAssay Systems, Hayward, CA, USA) following the manufacturer’s instructions.
Subcellular fractionation and western blot
In order to separate nuclear, cytosolic, and mitochondrial fractions from human tissue, subcellular fractionation was performed as previously described [29] with minor modification. Tissue homogenization was performed with a Poltyron PT 10– 35 benchtop homogenizer (Kinematica, Luzern, Switzerland) and 20 passes through a 20 G needle. Human tissue was used because at the time of these experiments, there were no available antibodies that selectively recognized mouse Mss51. The resulting fractions were then heat-denatured and reduced.
For Western blotting, cells were harvested in RIPA lysis buffer. Heat-denatured and reduced protein samples were separated by SDS-PAGE and transferred to PVDF membranes by standard techniques. To ensure equal protein loading, sample concentrations were measured using the bicinchoninic acid (BCA) assay. Membranes were blocked with 5% nonfat milk in TBS with 0.1% Tween 20 (TBS-T), probed with primary antibodies, washed, incubated with appropriate horseradish peroxidase-conjugated secondary antibodies in TBS-T, and developed using X-ray film and Amersham ECL Prime Western Blotting Detection Reagent (RPN2232; GE Healthcare Life Sciences, Pittsburgh, PA, USA). Primary antibodies used were anti-puromycin (PMY-2A4-s; Developmental Studies Hybridoma Bank (DSHB), Iowa City, IA, USA; 1:200), anti-GAPDH (G9545; Sigma-Aldrich; 1:10,000), anti-Histone H3 (H0164; Sigma-Aldrich; 1:10,000), anti-VDAC (4866; Cell Signaling Technology (CST), Danvers, MA, USA; 1:1,000), anti-AMPKα (5831; CST; 1:1,000), and anti-phospho-AMPKα (2535; CST; 1:1,000). At the time of publication, the only Mss51 antibody available is a human-specific, “anti-Zmynd17” (AP54659PU-N; Acris Antibodies, San Diego, CA, USA; 1:500).
Quantitative RT-PCR
Cells and tissues were homogenized in TRIzol, total RNA was isolated using the Direct-zol RNA MiniPrep Kit (Zymo Research, Irvine, CA, USA) and cDNA was synthesized from 1 microgram of RNA per sample using the iScript cDNA Synthesis Kit (Bio-Rad, Hercules, CA, USA). cDNA was diluted and used as the template for real-time PCR using a CFX Connect Real-Time PCR Detection System (Bio-Rad) and SYBR Green PCR Master Mix (Life Technologies). Relative gene expression was determined using the ΔΔCt method normalized to the indicated reference genes through the analytical software qbase+ (Biogazelle, Ghent, Belgium). At least three reference genes were included in each qRT-PCR experiment, and qbase+ was used to run the geNorm algorithm to select the most stable and suitable reference gene(s) for each experiment. Primer sequences are available upon request.
SUnSET assay
To assay relative rates of protein synthesis, the surface sensing of translation (SUnSET) assay was used as previously described [30]. Cells were incubated with 1μM puromycin for 30 minutes before lysis in RIPA buffer with protease inhibitors, allowing for Western blot analysis of puromycin incorporation as a marker of protein synthesis. In addition to the gel that was used for Western blot analysis, a duplicate gel was stained with SYPRO Ruby protein gel stain (Life Technologies) following manufacturer’s instructions for use in densitometry analysis normalization using ImageJ.
Metabolic assays
For determination of cellular ATP content, cells were differentiated for 6 days and lysed in Reporter Lysis Buffer (Promega, Madison, WI, USA). The ATP Determination Kit (Life Technologies) was used according to manufacturer’s instructions and data were normalized to the protein content of each well as determined by BCA assay.
β-Oxidation of [1-14C]palmitic acid (C16:0, Moravek Biochemicals Inc., Brea, CA, USA) to water-soluble products was measured in intact myotubes grown in 6-well plates. Fatty acid in benzene solution was dried under a stream of nitrogen in a glass tube and solubilized with 10 mg/ml α-cyclodextrin (Sigma-Aldrich) in 10 mM Tris-Cl- , pH 8.0, to a final concentration of 0.1 mM and a specific activity of ∼30,000 dpm/nmol. After 6 days of differentiation, the culture medium was replaced with serum-free DMEM containing 10μM solubilized radiolabeled palmitate and 2 mM L-carnitine. After 2 hours at 37°C, the reaction was stopped by adding ice-cold HClO4 (final concentration 3% ) to the medium. Plates were kept on ice for 1 hour before extraction of water soluble products using Folch partition as previously described [31]. The aqueous phase was mixed with Budget-Solve (RPI, Mount Prospect, IL, USA) and radioactivity was determined using a Beckman LS 6500 liquid scintillation spectrometer. Protein was determined in 5-6 wells of parallel 6-well plates by the method of Lowry et al. [32]. Results are presented as nmol/2 hr/mg protein±SEM.
Extracellular acidification and oxygen consumption rates were measured using a Seahorse XF24 Flux Analyzer (Seahorse Bioscience, Billerica, MA, USA) according to manufacturer’s instructions for the glycolysis stress test and mitochondrial stress test. Cells were seeded at equal densities and differentiated for 6 days at which point metabolic flux analysis was performed. For the glycolysis stress test, cells began in glucose-free stress test medium, to which glucose, oligomycin (an ATP coupler), and 2-deoxy-D-glucose (a glucose analog) were added sequentially to final concentrations of 10 mM, 1μM, and 100 mM, respectively. For the mitochondrial stress test, cells began in stress test medium containing 10 mM glucose, to which oligomycin, carbonyl cyanide-p-trifluoromethoxyphenylhydrazone (FCCP, an ATP uncoupler), and rotenone/Antimycin A (mitochondrial inhibitors) were added to final concentrations of 1μM, 1μM, and 0.5μM/0.5μM, respectively. In both tests, between the addition of each component, the oxygen consumption rate and extracellular acidification were measured as previouslydescribed [33].
Statistical analysis
The data are presented as mean±standard error of the mean with the exception of Fig. 2 C, which presents data in box-and-whiskers format with the median, quartiles, and outliers depicted. For qRT-PCR analysis, statistical analysis was performed using qbase+. For all other experiments, statistical analysis was performed using SigmaPlot 11 (SyStat Software, Chicago, IL). When two groups were compared, differences were analyzed with a two-way Student’s t test. For more than two groups, differences were compared using one-way analysis of variance (ANOVA) with Bonferroni post hoc comparisons. Probability (p) values less than 0.05 were considered statistically significant.
RESULTS
Mss51 gene expression is modulated by TGF-β superfamily signaling
To examine modulation of Mss51 expression, we first determined the time course of its expression in vitro. Mss51 was expressed at low levels in proliferating C2C12 myoblasts, and significantly higher levels as cells differentiated into myotubes (Fig. 1A). Myotubes were then differentiated for three days and treated with various TGF-β superfamily members as well as various inhibitors (Fig. 1B). TGF-β superfamily members (myostatin, TGF-β1 and activin A) all increased Mss51 expression in myotubes. The TGF-β1/2/3 neutralizing antibody 1D11 decreased Mss51 expression and there was a trend toward decreased expression with ActRIIB-Fc treatment. IGF-1, which has several similar effects on skeletal muscle as myostatin inhibition including increasing proliferation and differentiation in vitro and muscle growth in vivo [34], also decreased Mss51 expression. We examined other time points and saw the greatest effects on Mss51 expression levels when the myotubes were differentiated for three days and no significant change seen when proliferating myoblasts were treated (data not shown). This may be because during differentiation, the cells are actively increasing Mss51 expression and are therefore more responsive to exogenous signaling cues.
Mss51 is predominantly expressed in glycolytic skeletal muscle
To determine the tissue specificity of Mss51, we performed qRT-PCR using RNA isolated from the brain, heart, kidney, liver, small intestine, diaphragm, and quadriceps of 10– 12 week-old female C57BL/6J mice. There were no significant differences between brain, heart, kidney, and liver, while expression was higher in the small intestine and diaphragm, approximately 20-fold above the expression level found in the brain. In the quadriceps, expression was approximately 150-fold higher compared to brain (Fig. 2A).
We also examined the relative expression of Mss51 in different skeletal muscle groups, selected based on their established fiber type distributions [35– 37], listed from more oxidative to more glycolytic: soleus, diaphragm, long head of the triceps brachii, extensor digitorum longus (EDL), and white vastus lateralis (WVL) (Fig. 2B). There were significant differences between muscle groups, with lower expression in the more oxidative soleus and diaphragm muscles, intermediate in the mixed-type long head of the triceps brachii, and higher expression in the glycolytic EDL and WVL. Mss51 was highly expressed in muscles that are more glycolytic and dominated by type IIB fibers, while lowly expressed in predominantly oxidative muscles dominated by type I/IIA fibers.
To determine if the expression pattern was similar in humans, we examined the Genotype-Tissue Expression (GTEx) Portal database (http://www.gtexportal.org[gtexportal.org]). The GTEx Portal includes searchable RNA-seq data from over 40 tissue types of 175 humans [38]. Our search revealed MSS51 to be expressed at much higher levels in skeletal muscle than any other tissue examined (Fig. 2C).
MSS51 is localized to the mitochondria
To determine cellular localization of MSS51, human deltoid muscles from an open muscle biopsy of a living donor and from an autopsy were used to perform subcellular fractionation. Fractions of nuclear, cytoplasmic, and mitochondrial proteins were collected and used for SDS-PAGE and Western blotting. These data showed that MSS51 protein co-fractionated with the mitochondrial fraction (Fig. 3).
Mss51 does not regulate proliferation and differentiation
Using the CRISPR/Cas9 system for genome engineering, a double-strand break was introduced into the first exon of Mss51 in C2C12 cells at the locus depicted in Fig. 4A. Pooled populations of sorted cells, control (transfected with a plasmid encoding GFP) versus Mss51-disrupted (CRISPR/Cas9 dual expression plasmid co-transfected with a GFP reporter plasmid that only expressed GFP when CRISPR/Cas9 is expressed in the same cell), were collected and enriched as represented in Fig. 4B. The Mss51-disrupted myotube population was a pool of many unique Mss51 mutants including cells that have at least one wild-type allele. Relative Mss51 expression in the pooled cells was determined using primers flanking the predicted double strand break, which demonstrated a significant decrease in total Mss51 transcript in the differentiating Mss51-disrupted myotubes when compared to control cells (Fig. 4C).
Myostatin, TGF-β, and IGF-1 all modulate myoblast proliferation and differentiation and, as shown in Fig. 1B, also are associated with altered Mss51 gene expression. For this reason, we examined cell proliferation and differentiation in Mss51-disrupted cells. Proliferation was unchanged compared to control cells, as measured by EdU incorporation (Fig. 5A, B) and alamarBlue assay (Supplementary Figure 1). Differentiation was also equivalent in Mss51-disrupted and control cell populations by myofusion index, the proportion of nuclei found in myosin heavy chain-positive fibers at day 5 post differentiation media (Fig. 5C, D). Creatine kinase enzyme activity, a marker of differentiation, did not differ significantly between control and Mss51-disrupted myotubes after six days of differentiation (Fig. 5E). Myotubes were differentiated for six days to ensure that stable levels of Mss51 transcript and protein were present in control cells, corresponding to the greatest difference between control and disrupted populations. We also looked at expression of myogenic regulatory factors by qPCR and did not see meaningful differences between control and Mss51-disrupted cells (data not shown). Protein synthesis, as measured by puromycin incorporation using the SUnSET assay, was not altered in Mss51-disrupted myotubes after 6 days of differentiation (Fig. 5F, G).
Mss51-disrupted myotubes are more metabolically active than wild-type myotubes
Myostatin knockout and IGF-1 transgene expression lead to an alteration in fiber-type composition with a decrease in type 1 slow oxidative fibers and an increase in type IIB fast glycolytic fibers [9, 10, 19, 39– 42]. We therefore examined whether CRISPR/Cas9-mediated disruption of the Mss51 locus altered expression of the various myosin heavy chain isoforms (MyHCs) expressed by C2C12 myotubes. In Mss51-disrupted C2C12 myotubes, embryonic MyHC (Myh3), neonatal MyHC (Myh8), and MyHC IIX (Myh1) were significantly decreased, MyHC IIB (Myh4) was significantly increased, and MyHC IIA (Myh2) and MyHC I (Myh7) were unchanged (Fig. 6A). The changes exhibited in Mss51-disrupted myotubes indicated a shift towards more fast-twitch MyHC expression.
Since expression of MyHC isoforms typically coincide with metabolic properties of muscle, we evaluated whether Mss51 modulates the mRNA expression of several key regulators of metabolism (Fig. 6B). Consistent with a shift toward MyHC IIB expression, Mss51-disrupted myotubes displayed a downregulation of PGC1α, which among its many functions is the major factor in type I fiber type determination [43]. Cytochrome c oxidase subunit 2 (Cox2) gene expression was minimally increased but other genes involved with mitochondrial biogenesis (including Nrf1, Nfe2l2, citrate synthase, ESRRα) and genes of mitochondrial respiration (including Atp5o, Alas1, Cox5b, Cycs) were unchanged. PGC1α is a major player in mitochondrial biogenesis, and it is intriguing that we did not see greater alterations in other genes involved in mitochondrial biogenesis, indicating that the decreased PGC1α expression may be primarily linked to the shift in fiber type profile in cells deficient in Mss51. We evaluated PGC1α expression in proliferating and differentiating Mss51-disrupted myotubes and found similar levels in proliferating Mss51-disrupted myoblasts versus controls but lower levels in differentiated Mss51-disrupted myoblasts compared to controls (Supplementary Figure 2).
Expression of the glycolytic gene hexokinase 2 (Hk2), which has been shown to be more active in the glycolytic EDL muscle than the oxidative soleus muscle [44], was significantly increased in Mss51-disrupted myotubes (Fig. 6B). Other genes that had significant changes in expression with decreased Mss51 expression were Cd36 (fatty acid translocase), Fasn (fatty acid synthase), and Pdk4 (pyruvate dehydrogenase lipoamide kinase isozyme 4), which were all increased. The products of these genes are all critical in fatty acid utilization. Other genes involved in fatty acid oxidation (FAO) including HSL (hormone sensitive lipase) and Acadl (long chain specific acyl-coA dehydrogenase) were also increased to a lesser extent while other genes involved in FAO were unchanged.
Since yeast Mss51 is a translational activator, we examined changes in protein expression via immunoblotting. We examined several mitochondrial markers, including cytochrome c, VDAC, CoxI, CoxIV, and pyruvate dehydrogenase, and did not detect any differences between Mss51-disrupted and control myotubes (Supplementary Figure 3). We also examined markers of peroxisome proliferator-activated receptor gamma (PPARγ)-regulated fatty acid metabolism, including AMP-activated protein kinase (AMPKα), SirT1, and GCN5L2 (Fig. 6C and Supplementary Figure 3). Of these, only AMPKα was increased in Mss51-disrupted myotubes. Activated, phosphorylated AMPKα (p-AMPKα) is a marker of cellular energy [45], and both total protein expression and p-AMPKα (relative to total AMPKα) were increased in myotubes with reduced Mss51 expression (Fig. 6C, D).
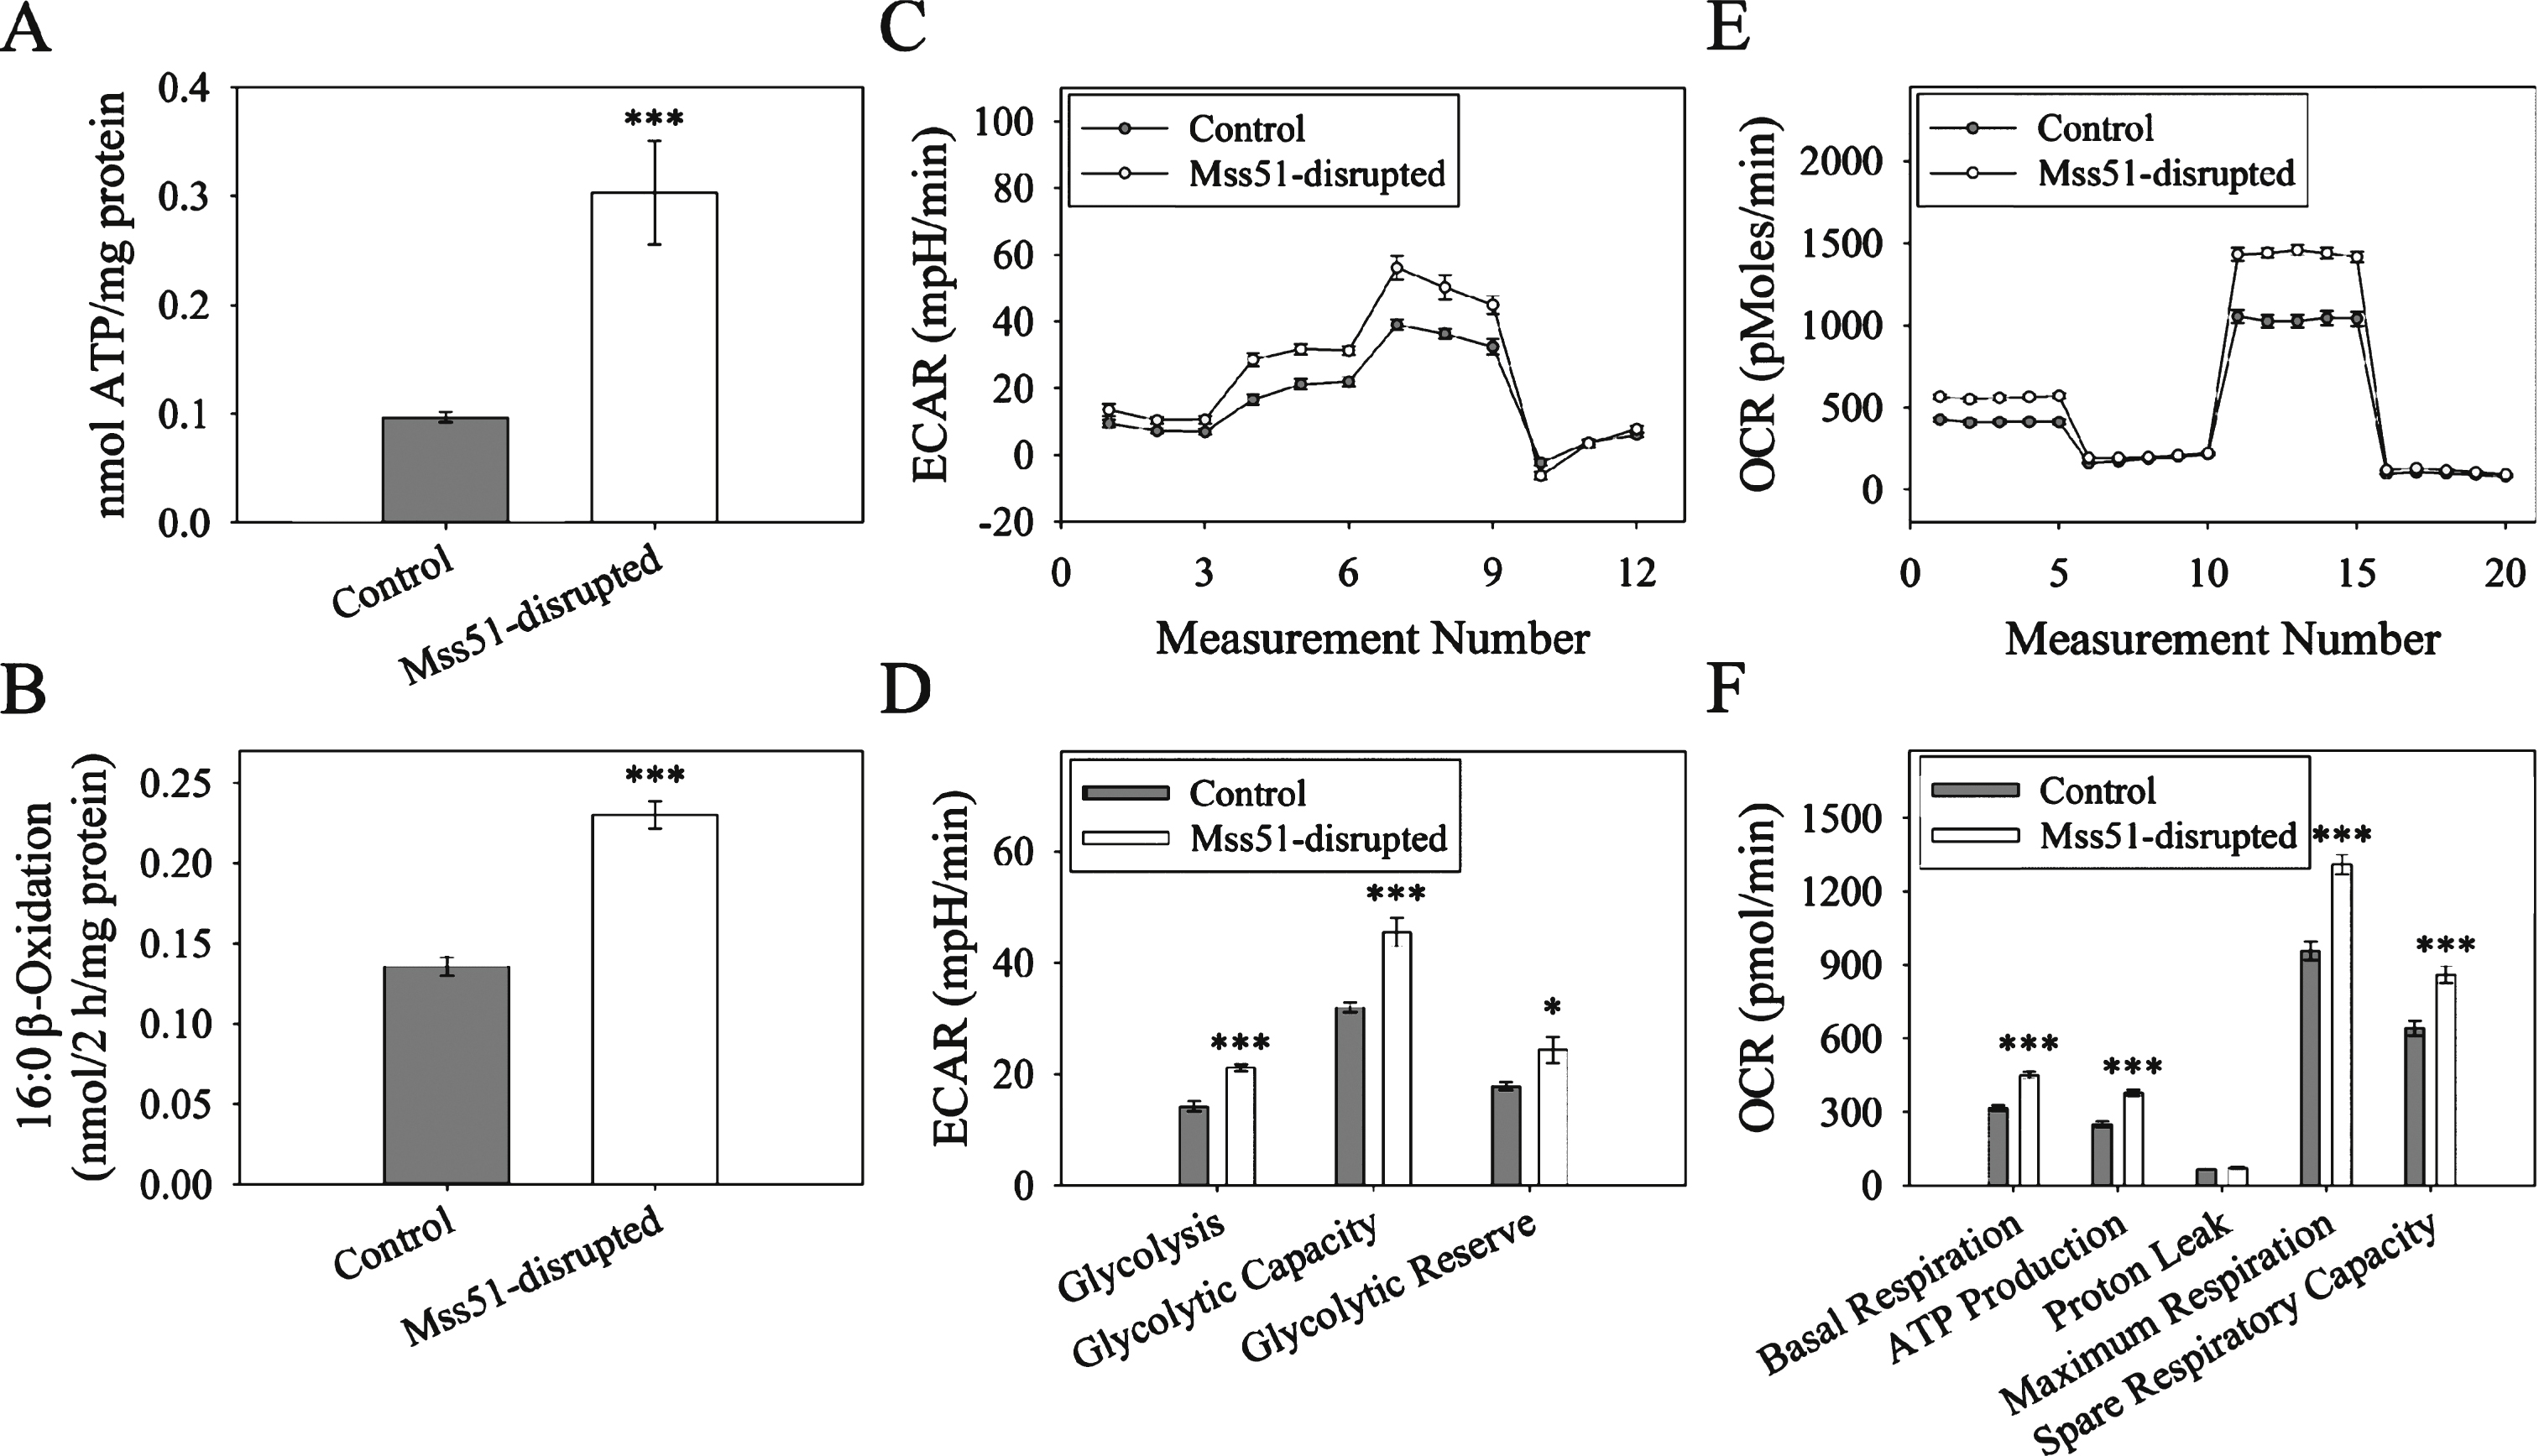
AMPKα activation switches off ATP consuming pathways and switches on ATP generating processes (glucose uptake and fatty acid oxidation) [46]. To determine if the increases in gene expression of fatty acid utilization and p-AMPKα described above resulted in increased ATP generation, we measured ATP content of populations of differentiated myotubes. Cellular ATP content was significantly increased in Mss51-disrupted myotubes (Fig. 7A). To determine if fatty acid utilization was altered in Mss51-disrupted myotubes, we measured β-oxidation of radiolabeled palmitic acid in intact control and Mss51-disrupted myotubes (Fig. 7B). Mss51-disrupted myotubes were shown to have a significantly higher β-oxidation activity.
To confirm the finding that reduced Mss51 expression resulted in increased cellular metabolism as suggested by increased ATP production and increased β-oxidation of palmitic acid, glycolysis stress and mitochondrial stress tests were performed using the Seahorse XF24 Flux Analyzer. In the glycolysis stress test, the extracellular acidification rate was measured as an indicator of glycolysis when differentiated myotubes were perturbed. Baseline measurements were taken in glucose-free media before glucose, oligomycin, and 2-deoxy-D-glucose were injected to begin glycolysis, shut down the electron transport chain, and inhibit glycolysis, respectively. Between each treatment, the extracellular acidification rate was measured and plotted (Fig. 7C), allowing for the calculation of several key parameters: glycolysis under normal conditions, maximal glycolytic capacity when the electron transport chain is disrupted, and glycolytic reserve. Comparing Mss51-disrupted and control myotubes, we found that Mss51-disrupted myotubes had significantly higher glycolysis, glycolytic capacity, and glycolytic reserve than wild-type myotubes (Fig. 7D). We also performed a mitochondrial stress test, where cells were treated with oligomycin, carbonyl cyanide-p-trifluoromethoxyphenylhydrazone, and Rotenone/Antimycin to inhibit Complex V, uncouple the proton gradient, and inhibit Complexes I and III, respectively. This allowed for the calculation of basal respiration, ATP production, maximal respiration, and spare respiratory capacity, all measured by changes in oxygen consumption rate (Fig. 7E). We found that all metrics of mitochondrial respiration excluding proton leak were significantly increased in Mss51-disrupted cells (Fig. 7F), indicating that cells that expressed less Mss51 had higher metabolic activity, resulting in higher levels of respiration, glycolysis, and ATP production.
DISCUSSION
In this report, we introduce mammalian Mss51 as a muscle-specific gene regulated by members of the TGF-β superfamily. Mammalian Mss51 initially came to attention as one of the most consistently downregulated genes in gene profiling studies of myostatin inhibition [19– 23]. Given myostatin’s role in skeletal muscle development, postnatal growth and regeneration, we originally postulated that Mss51 might have a role in myoblast proliferation or differentiation but this was not supported by assays on C2C12 myoblasts in which Mss51 was genetically disrupted (Fig. 5). Rather, Mss51 appears to modulate other aspects of TGF-β signaling in skeletal muscle including fiber type determination and metabolism. The observation that myostatin, TGF-β1, activin A and IGF-1 all modulate expression of Mss51 suggest that it may be a common effector of these growth factors which converge to regulate metabolic adaptations (Fig. 1).
Mss51 is expressed almost exclusively in skeletal muscle in mice and humans. In mice, it is expressed most abundantly in muscles rich in glycolytic type II fibers and 20- to 25-fold less in those rich in oxidative type I fibers (Fig. 2). Genetic disruption of Mss51 shifts the myosin heavy chain expression profile toward a more glycolytic phenotype dominated by Type IIB myosin heavy chain (Fig. 6). This is consistent with the effects of myostatin gene deletion and IGF-1 transgene overexpression on fiber type composition which cause a similar shift toward a more glycolytic phenotype in vivo [9– 11, 39– 42]. PGC1α, which is a major determinant of type 1 fiber formation, has been shown to be decreased in myostatin-null mice and muscle-specific IGF-1 transgenic mice [11, 40, 47]. Further, in a transgenic model of overexpression of activated Akt1, a shift toward increased type IIB fibers was shown to accompany an increase in Hk2 expression and a decrease in PGC1α expression alongside increased metabolic parameters [48]. Consistent with these findings, PGC1α is downregulated and Hk2 is upregulated in Mss51-disrupted myotubes which have increased MyHC IIB expression compared to control myotubes (Fig. 6).
Although mammalian Mss51 has a limited similarity to its yeast ortholog Mss51 (19% amino acid identity shared only across the zf-MYND domain), both proteins co-localize with mitochondria (Fig. 3, [24]). Yeast Mss51 is a translational activator of Cox1 but Mss51-disrupted myotubes did not show a reduction in CoxI or CoxIV protein, suggesting its function is not conserved across species (Supplementary Figure 3). Conversely, myotubes deficient in Mss51 displayed increased ATP production, β-oxidation and activation of AMPKα, a marker of cellular metabolic state (Figs. 6 and 7). Glycolysis and mitochondrial respiration are both increased after Mss51 disruption (Fig. 7). While the specific actions of Mss51 on cellular metabolism remain to be determined, it appears that there is a shift from glucose to fatty acid utilization occurring when there is less Mss51 present. β-oxidation is increased in Mss51-disrupted cells (Fig. 7B) and several genes involved in fatty acid metabolism (HSL, Acadl, Cd36, Fasn) are upregulated. Further, increased expression of Pdk4 and activation of AMPKα would predict a shift toward fatty acid utilization. Although the relationship between lipid balance and muscle insulin sensitivity continues to be explored, one model of obesity-associated insulin resistance posits intramyocellular lipid content as a principal contributor [49]. Myostatin inhibitors have been shown to prevent diet-induced obesity and insulin resistance in a number of models [17, 18, 50, 51]. The possibility that these effects are in part mediated by Mss51 is consistent with the downregulation of Mss51 by myostatin inhibitors and corresponding upregulation of genes involved in fatty acid metabolism.
Multiple myostatin inhibitors are currently in clinical trials for the treatment of neuromuscular disease (ClinicalTrials.gov Identifiers: NCT012310763, NCT02515669, NCT01519349 and NCT01423110). While these trials hope to increase muscle function by stimulating muscle growth and regeneration, inhibition of myostatin is also likely to have metabolic effects on skeletal muscle. Preclinical work by our group and others, suggest that Mss51 will be downregulated by myostatin inhibition [19– 22]. The current study suggests that this will have positive effects on bioenergetics, increasing cellular ATP. However, there are limitations to the current in vitro study in which, necessarily, only basal states are assayed and glucose and glutamine are the primary fuels of cellular metabolism. Additionally, the cell population characterized in this present study expresses a low level of Mss51, albeit significantly less than control populations, which may obscure changes that would occur in its complete absence. In vivo studies of Mss51 knockout animals using stimuli that modulate fatty acid oxidation and mitochondrial biogenesis will be necessary to further elucidate Mss51 function.
CONFLICT OF INTEREST
The authors have no conflict of interest to report.
ACKNOWLEDGMENTS
The authors thank Qian Wang for ActRIIB-Fc, Alexandra McPherron for helpful comments on the manuscript, Jonathan Pevsner for scientific and technical advice, Paul Watkins for FAO assay assistance and Naili Liu, Alexis Norris, Xiaohai Shi and Gwynn Marsh-Armstrong for technical assistance. Funding for the study was provided by the Hugo W. Moser Research Institute of Kennedy Krieger, and by grant no. 5U54HD060848 from Eunice Kennedy Shriver National Institute of Child Health and Human Development that supports the Senator Paul D. Wellstone Muscular Dystrophy Cooperative Research Center for FSHD Research.
Appendices
The supplementary table and figure are available in the electronic version of this article: http://dx.doi.org/10.3233/JND-150119.
REFERENCES
1 | McPherron AC, Lawler AM, Lee SJ (1997) Regulation of skeletal muscle mass in mice by a new TGF-beta superfamily member Nature 387: 6628 83 90 |
2 | Li ZB, Zhang J, Wagner KR (2012) Inhibition of myostatin reverses muscle fibrosis through apoptosis J Cell Sci 125: 17 3957 3965 |
3 | Wagner KR, Liu X, Chang X, Allen RE (2005) Muscle regeneration in the prolonged absence of myostatin Proc Natl Acad Sci USA 102: 7 2519 2524 |
4 | Li ZB, Kollias HD, Wagner KR (2008) Myostatin directly regulates skeletal muscle fibrosis J Biol Chem 283: 28 19371 19378 |
5 | Zhu J, Li Y, Shen W, Qiao C, Ambrosio F, Lavasani M (2007) Relationships between transforming growth factor-β1, Myostatin, and decorin: Implications for skeletal muscle fibrosis J Biol Chem 282: 35 25852 25863 |
6 | Siriett V, Salerno MS, Berry C, Nicholas G, Bower R, Kambadur R (2007) Antagonism of myostatin enhances muscle regeneration during sarcopenia Mol Ther 15: 8 1463 1470 |
7 | McCroskery S, Thomas M, Platt L, Hennebry A, Nishimura T, McLeay L (2005) Improved muscle healing through enhanced regeneration and reduced fibrosis in myostatin-null mice J Cell Sci 118: Pt 15 3531 3541 |
8 | McPherron AC (2010) Metabolic functions of myostatin and GDF11 Immunol Endocr Metab Agents Med Chem 10: 4 217 231 |
9 | Girgenrath S, Song K, Whittemore LA (2005) Loss of myostatin expression alters fiber-type distribution and expression of myosin heavy chain isoforms in slow- and fast-type skeletal muscle Muscle and Nerve 31: 1 34 40 |
10 | Amthor H, Macharia R, Navarrete R, Schuelke M, Brown SC, Otto A (2007) Lack of myostatin results in excessive muscle growth but impaired force generation Proc Natl Acad Sci USA 104: 6 1835 1840 |
11 | Mouisel E, Relizani K, Mille-Hamard L, Denis R, Hourde C, Agbulut O (2014) Myostatin is a key mediator between energy metabolism and endurance capacity of skeletal muscle AJP Regul Integr Comp Physiol 307: 4 R444 R454 |
12 | Guo T, Jou W, Chanturiya T, Portas J, Gavrilova O, McPherron AC (2009) Myostatin inhibition in muscle, But not adipose tissue, Decreases fat mass and improves insulin sensitivity PLoS One 4: 3 1 11 |
13 | Zhang C, McFarlane C, Lokireddy S, Bonala S, Ge X, Masuda S (2011) Myostatin-deficient mice exhibit reduced insulin resistance through activating the AMP-activated protein kinase signalling pathway Diabetologia 54: 6 1491 1501 |
14 | Qiu S, Mintz JD, Salet CD, Han W, Giannis A, Chen F (2014) Increasing Muscle Mass Improves Vascular Function in Obese (db/db) Mice J Am Heart Assoc 3: 3 e000854 e000854 |
15 | McPherron AC, Lee SJ (2002) Suppression of body fat accumulation in myostatin-deficient mice J Clin Invest 109: 5 595 601 |
16 | Guo T, Bond ND, Jou W, Gavrilova O, Portas J, McPherron AC (2012) Myostatin inhibition prevents diabetes and hyperphagia in a mouse model of lipodystrophy Diabetes 61: 10 2414 2423 |
17 | Koncarevic A, Kajimura S, Cornwall-Brady M, Andreucci A, Pullen A, Sako D (2012) A novel therapeutic approach to treating obesity through modulation of TGFβ; signaling Endocrinology 153: 7 3133 3146 |
18 | Akpan I, Goncalves MD, Dhir R, Yin X, Pistilli EE, Bogdanovich S (2009) The effects of a soluble activin type IIB receptor on obesity and insulin sensitivity Int J Obes (Lond). Nature Publishing Group 33: 11 1265 1273 |
19 | Rahimov F, King OD, Warsing LC, Powell RE, Emerson CP, Kunkel LM (2011) Gene expression profiling of skeletal muscles treated with a soluble activin type IIB receptor Physiol Genomics 43: 8 398 407 |
20 | Welle S, Cardillo A, Zanche M, Tawil R (2009) Skeletal muscle gene expression after myostatin knockout in mature mice Physiol Genomics 38: 3 342 350 |
21 | Welle S, Burgess K, Mehta S (2009) Stimulation of skeletal muscle myofibrillar protein synthesis, p70 S6 kinase phosphorylation, and ribosomal protein S6 phosphorylation by inhibition of myostatin in mature mice Am J Physiol Endocrinol Metab 296: 3 E567 E572 |
22 | Miao Y, Yang J, Xu Z, Jing L, Zhao S, Li X (2015) RNA Sequencing Identifies Upregulated Kyphoscoliosis Peptidase and Phosphatidic Acid Signaling Pathways in Muscle Hypertrophy Generated by Transgenic Expression of Myostatin Propeptide Int J Mol Sci 16: 4 7976 7994 |
23 | Accornero F, Kanisicak O, Tjondrokoesoemo A, Attia AC, McNally EM, Molkentin JD (2014) Myofiber-specific inhibition of TGFβ signaling protects skeletal muscle from injury and dystrophic disease in mice Hum Mol Genet 23: 25 6903 6915 |
24 | Perez-Martinez X, Butler CA, Shingu-Vazquez M, Fox TD (2009) Dual functions of Mss1 couple synthesis of Cox1 to assembly of cytochrome c oxidase in Saccharomyces cerevisiae mitochondria Mol Biol Cell 20: 20 4371 4380 |
25 | Soto IC, Fontanesi F, Myers RS, Hamel P, Barrientos A (2012) A heme-sensing mechanism in the translational regulation of mitochondrial cytochrome c oxidase biogenesis Cell Metab. Elsevier Inc 16: 6 801 813 |
26 | Szklarczyk R, Wanschers BF, Cuypers TD, Esseling JJ, Riemersma M, van den Brand MA (2012) Iterative orthology prediction uncovers new mitochondrial proteins and identifies C12orf62 as the human ortholog of COX14, A protein involved in the assembly of cytochrome c oxidase Genome Biol. BioMed Central Ltd 13: 2 R12 |
27 | (a) Ran FA, Hsu PD, Wright J, Agarwala V, Scott DA, Zhang F. Genome engineering using the CRISPR-Cas9 system. Nat Protoc. 2013;8(11):2281–308; (b) Lee SJ, Reed LA, Davies MV, Girgenrath S, Goad ME, Tomkinson KN, et al. Regulation of muscle growth by multiple ligands signaling through activin type II receptors. Proc Natl Acad Sci U S A. 2005;102(50):18117–22 |
28 | Wilson KA, Chateau ML, Porteus MH (2013) Design and Development of Artificial Zinc Finger Transcription Factors and Zinc Finger Nucleases to the hTERT Locus Mol Ther Nucleic Acids 2: April e87 |
29 | Dimauro I, Pearson T, Caporossi D, Jackson MJ (2012) A simple protocol for the subcellular fractionation of skeletal muscle cells and tissue BMC Res Notes. BMC Research Notes 5: 1 513 |
30 | Schmidt EK, Clavarino G, Ceppi M, Pierre P (2009) SUnSET, A nonradioactive method to monitor protein synthesis Nat Methods 6: 4 275 277 |
31 | Watkins PA, Ferrell EV, Pedersen JI, Hoefler G (1991) Peroxisomal fatty acid beta-oxidation in HepG2 cells Arch Biochem Biophys 289: 2 329 336 |
32 | Lowry OH, Rosebrough NJ, Farr AL, Randall RJ (1951) Protein measurement with the Folin phenol reagent J Biol Chem 193: 1 265 275 |
33 | Wu M, Neilson A, Swift AL, Moran R, Tamagnine J, Parslow D (2007) Multiparameter metabolic analysis reveals a close link between attenuated mitochondrial bioenergetic function and enhanced glycolysis dependency in human tumor cells Am J Physiol Cell Physiol 292: 1 C125 C136 |
34 | Song YH, Song JL, Delafontaine P, Godard MP (2013) The therapeutic potential of IGF-I in skeletal muscle repair Trends Endocrinol Metab. Elsevier Ltd 24: 6 310 319 |
35 | Bloemberg D, Quadrilatero J (2012) Rapid determination of myosin heavy chain expression in rat, mouse, and human skeletal muscle using multicolor immunofluorescence analysis PLoS One 7: 4 e35273 |
36 | Mathewson MA, Chapman MA, Hentzen ER, Fridén J, Lieber RL (2012) Anatomical, Architectural, and biochemical diversity of the murine forelimb muscles J Anat 221: 5 443 451 |
37 | Green HJ, Reichmann H, Pette D (1984) Inter- and intraspecies comparisons of fibre type distribution and of succinate dehydrogenase activity in type I, IIA and IIB fibres of mammalian diaphragms Histochemistry 81: 1 67 73 |
38 | The GTEx Consortium (2015) The Genotype-Tissue Expression (GTEx) pilot analysis: Multitissue gene regulation in humans Science 348: 6235 648 660 |
39 | Musaró A, McCullagh K, Paul A, Houghton L, Dobrowolny G, Molinaro M (2001) Localized Igf-1 transgene expression sustains hypertrophy and regeneration in senescent skeletal muscle Nat Genet 27: 2 195 200 |
40 | Christoffolete MA, Silva WJ, Ramos GV, Bento MR, Costa MO, Ribeiro MO (2015) Muscle IGF-1-Induced Skeletal Muscle Hypertrophy Evokes Higher Insulin Sensitivity and Carbohydrate Use as Preferential Energy Substrate Biomed Res Int 2015 |
41 | Lynch GS, Cuffe SA, Plant DR, Gregorevic P (2001) IGF-I treatment improves the functional properties of fast- and slow-twitch skeletal muscles from dystrophic mice Neuromuscul Disord 11: 3 260 268 |
42 | Messi ML, Delbono O (2003) Target-derived trophic effect on skeletal muscle innervation in senescent mice J Neurosci 23: 4 1351 1359 |
43 | Lin J, Wu H, Tarr PT, Zhang C-Y, Wu Z, Boss O (2002) Transcriptional co-activator PGC-1 alpha drives the formation of slow-twitch muscle fibres Nature 418: 6899 797 801 |
44 | Suwa M, Nakano H, Radak Z, Kumagai S (2011) Short-term adenosine monophosphate-activated protein kinase activator 5-aminoimidazole-4-carboxamide-1-β-d-ribofuranoside treatment increases the sirtuin 1 protein expression in skeletal muscle Metabolism. Elsevier BV 60: 3 394 403 |
45 | Garcia-Roves PM, Osler ME, Holmström MH, Zierath JR (2008) Gain-of-function R225Q mutation in AMP-activated protein kinase γ3 subunit increases mitochondrial biogenesis in glycolytic skeletal muscle J Biol Chem 283: 51 35724 35734 |
46 | Hardie DG (2007) AMP-activated/SNF1 protein kinases: Conserved guardians of cellular energy Nat Rev Mol Cell Biol 8: 10 774 785 |
47 | Lipina C, Kendall H, McPherron AC, Taylor PM, Hundal HS (2010) Mechanisms involved in the enhancement of mammalian target of rapamycin signalling and hypertrophy in skeletal muscle of myostatin-deficient mice FEBS Lett. Federation of European Biochemical Societies 584: 11 2403 2408 |
48 | Izumiya Y, Hopkins T, Morris C, Sato K, Zeng L, Viereck J (2008) Fast/Glycolytic Muscle Fiber Growth Reduces Fat Mass and Improves Metabolic Parameters in Obese Mice Cell Metab 7: 2 159 172 |
49 | McPherron AC, Guo T, Bond ND, Gavrilova O (2013) Increasing muscle mass to improve metabolism Adipocyte 2: 2 92 98 |
50 | Bernardo BL, Wachtmann TS, Cosgrove PG, Kuhn M, Opsahl AC, Judkins KM (2010) Postnatal PPARδ activation and myostatin inhibition exert distinct yet complimentary effects on the metabolic profile of obese insulin-resistant mice PLoS One 5: 6 e11307 |
51 | McPherron AC, Guo T, Wang Q, Portas J (2012) Soluble activin receptor type IIB treatment does not cause fat loss in mice with diet-induced obesity Diabetes Obes Metab 14: 3 279 282 |
Figures and Tables
Fig.1
Mss51 expression in vitro. (A) Mss51 mRNA expression measured by qRT-PCR in proliferating and differentiating C2C12 cells. Expression level is normalized to proliferating (Day 0) cells using the reference gene TBP. (B) Mss51 expression in differentiated C2C12 myotubes treated with various growth factors and inhibitors: 300 ng/mL myostatin, 5μg/mL ActRIIB-Fc, 50 ng/mL TGF-β1, 10μg/mL TGF-β neutralizing antibody 1D11, 20 ng/mL Activin A, and 100 ng/mL IGF-1. Expression level is normalized to control (untreated) cells using reference genes β2 m and TBP. For (A) and (B), significant differences between groups were determined by a one-way ANOVA (n = 3, p < 0.01) with Bonferroni post hoc comparisons. The annotation above each bar indicates statistically significant differences between the means in each group at p < 0.05: Groups sharing a letter designation were not significantly different from each other, while groups not sharing a letter were significantly different.
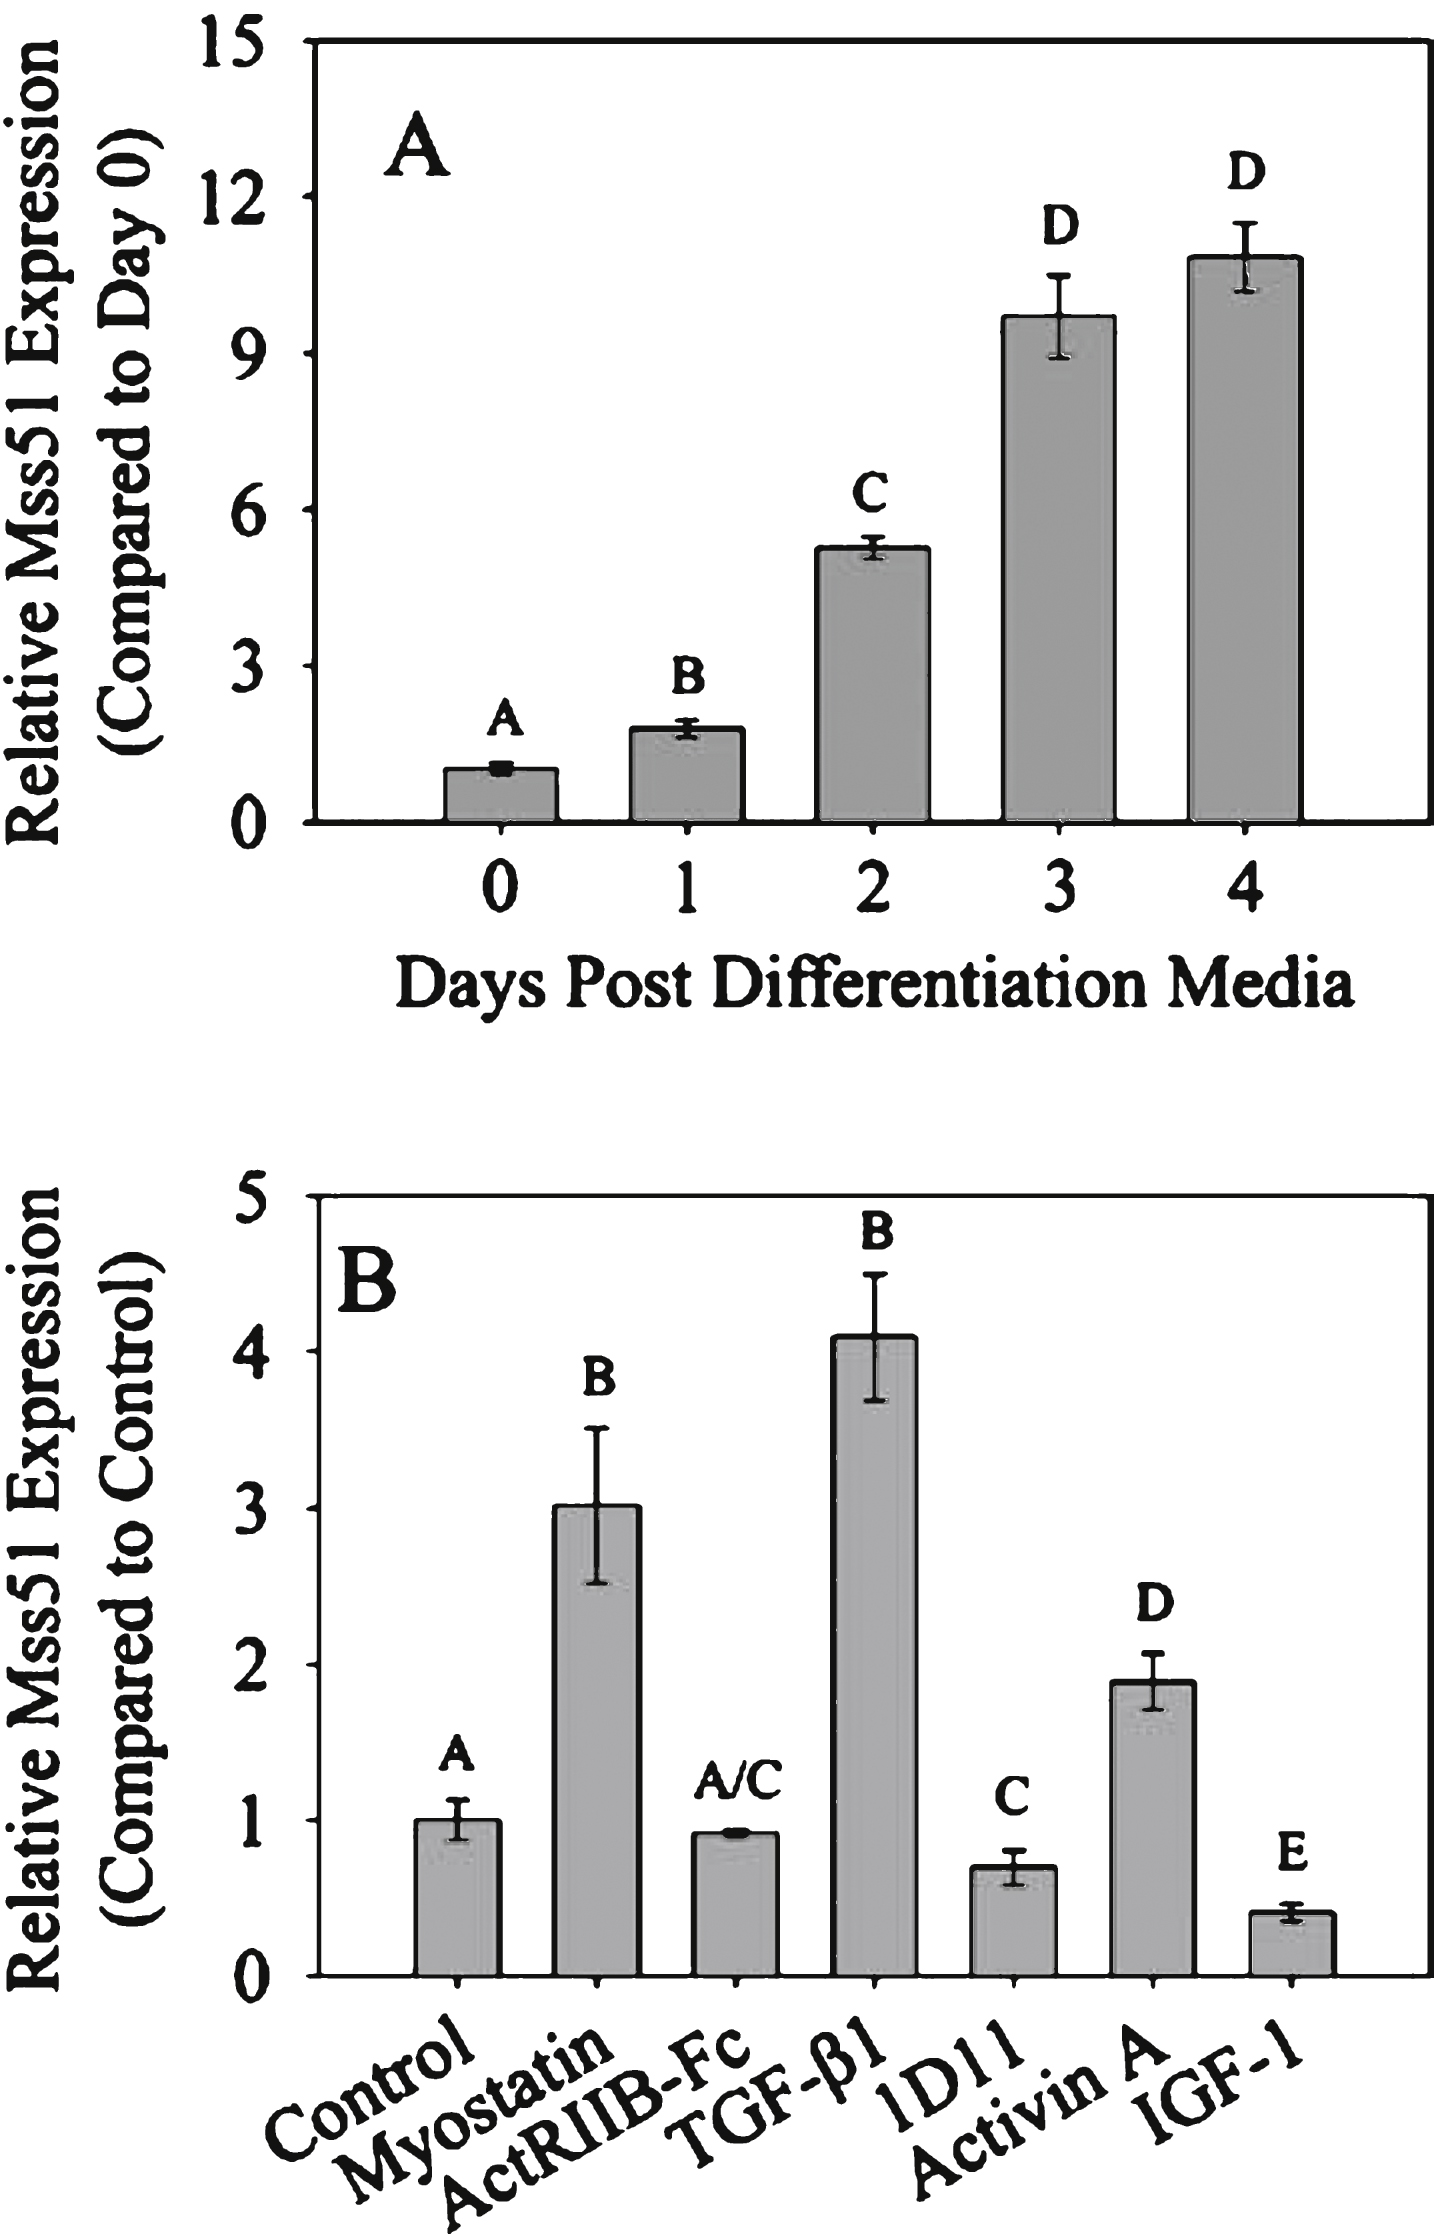
Fig.2
Mss51 tissue expression. (A) Mss51 mRNA expression measured by qRT-PCR in brain, heart, kidney, liver, small intestine, diaphragm, and quadriceps of 10– 12 week-old female C57BL/6J mice, normalized to the quantity found in the brain using the reference gene Pgk1 (n = 3). (B) Mss51 mRNA expression in soleus, diaphragm, long head of triceps brachii, extensor digitorum longus, and white vastus lateralis of the quadriceps of 10– 12 week-old female C57BL/6J mice, normalized to the expression levels found in the soleus using reference genes Pgk1 and TBP (n = 3). (C) MSS51 expression across human tissue types determined by RNA-seq from the Genotype-Tissue Expression (GTEx) Portal showing MSS51 reads per kilobase per million reads mapped (RPKM). Data were downloaded from GTEx Portal on June 17, 2015. For qRT-PCR experiments, groups were significantly different from each other as determined by a one-way ANOVA (n = 3, p < 0.01) and Bonferroni post hoc comparisons. Different letters above each bar signify statistically significant differences between the means in each group at p < 0.05.
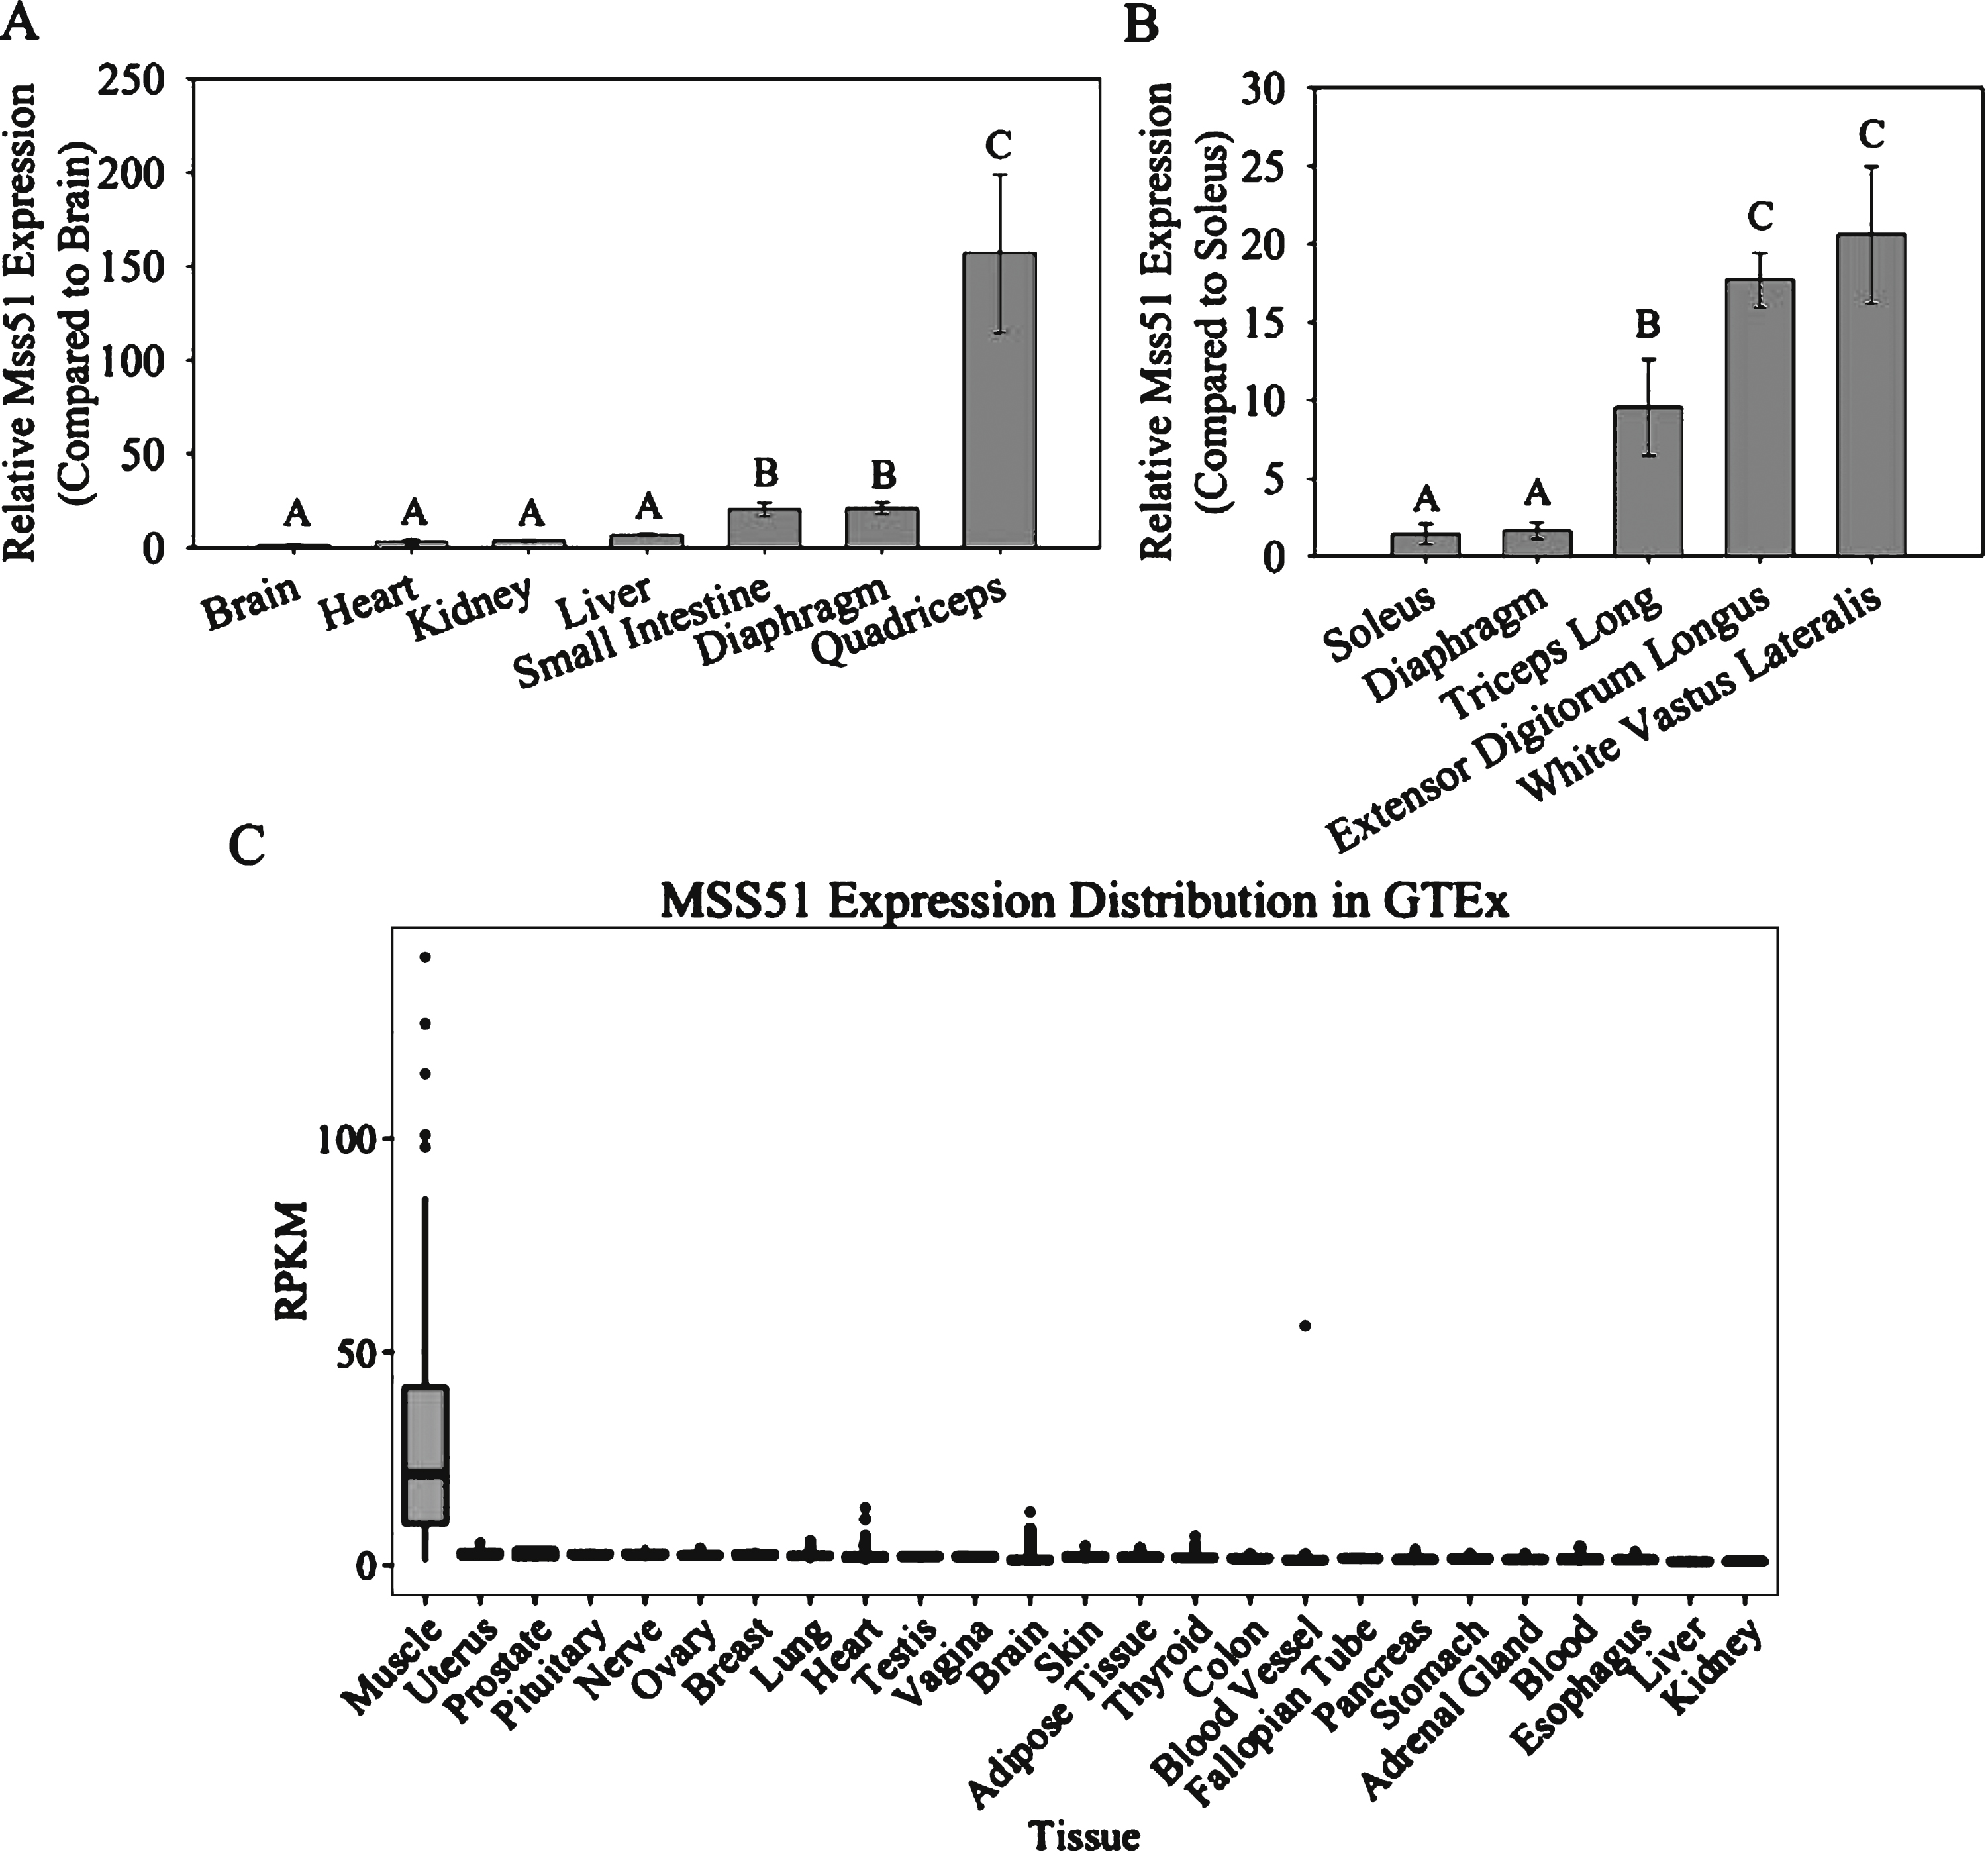
Fig.3
Subcellular localization of MSS51. Subcellular fractionation was performed on human deltoid samples from a biopsy and an autopsy and resulting fractions were subjected to SDS-PAGE. Immunoblotting was performed with the only current antibody specific to MSS51 (anti-human MSS51, Acris Antibodies, San Diego, CA, USA) showing a band in the mitochondrial fraction of the predicted protein product size, 51 kDa. Loading controls were VDAC (mitochondrial), GAPDH (cytoplasmic), and Histone H3 (nuclear).
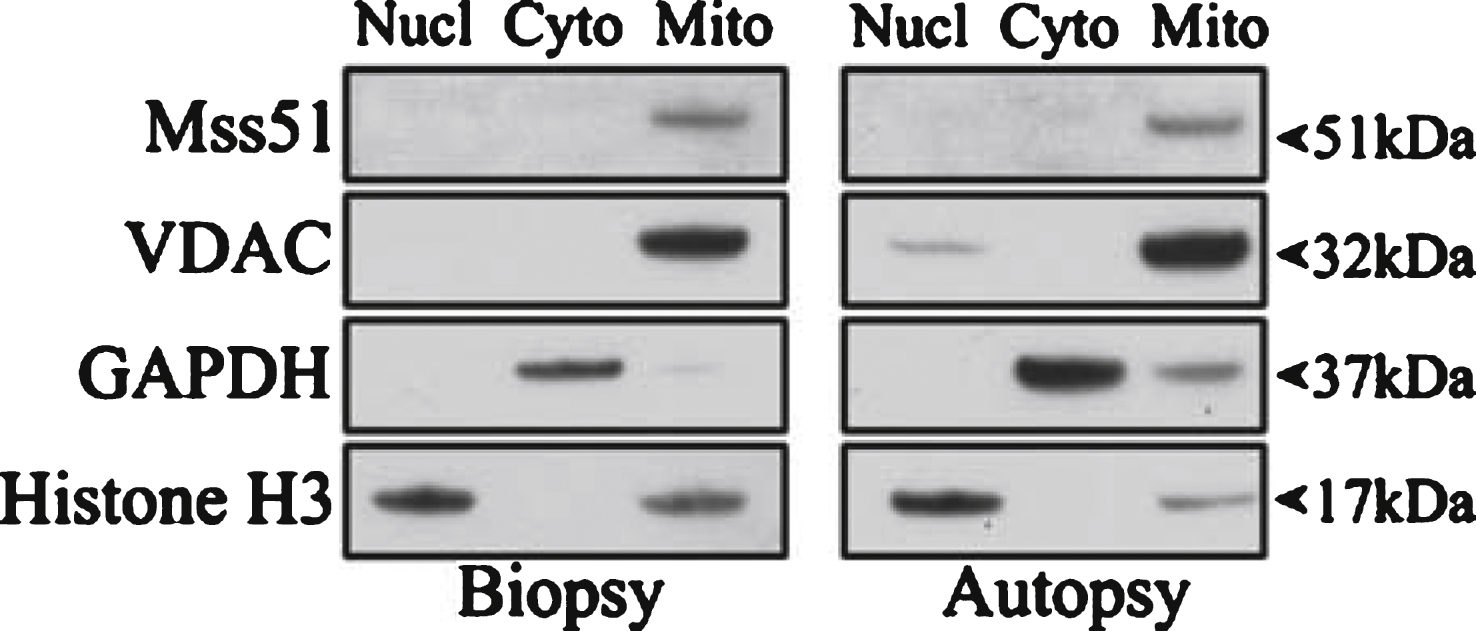
Fig.4
CRISPR/Cas9-disruption of Mss51 locus in C2C12 myoblasts. (A) Schematic of theMss51 genomic locus with the CRISPR guide RNA (gRNA) target sequence enlarged, predicted cut site marked in red, exons marked in black, UTRs in white. At the cut site, a double-strand break occurred and was re-sealed by non-homologous end joining. (B) Production of Mss51-disrupted cells was achieved by co-transfection of a dual-expression plasmid encoding the CRISPR gRNA (red) and the Cas9 endonuclease (blue), and a reporter plasmid encoding a disrupted GFP with two homology arms (dark green) flanking the CRISPR target site (red), which was cleaved by Cas9, re-sealed by homology-directed repair, and expressed functional GFP. Two populations of GFP-positive cells were collected by FACS sorting and expanded for further analysis – Mss51-disrupted cells were collected as shown and in parallel, control cells were transfected with a GFP expression plasmid and subjected to the same FACS process. (C) Mss51 expression measured by qRT-PCR in control and Mss51-disrupted populations over 6 days of differentiation, normalized to expression in proliferating control cells (Day 0) using reference genes Tfam and TBP (n = 3). **p < 0.01,***p < 0.001.
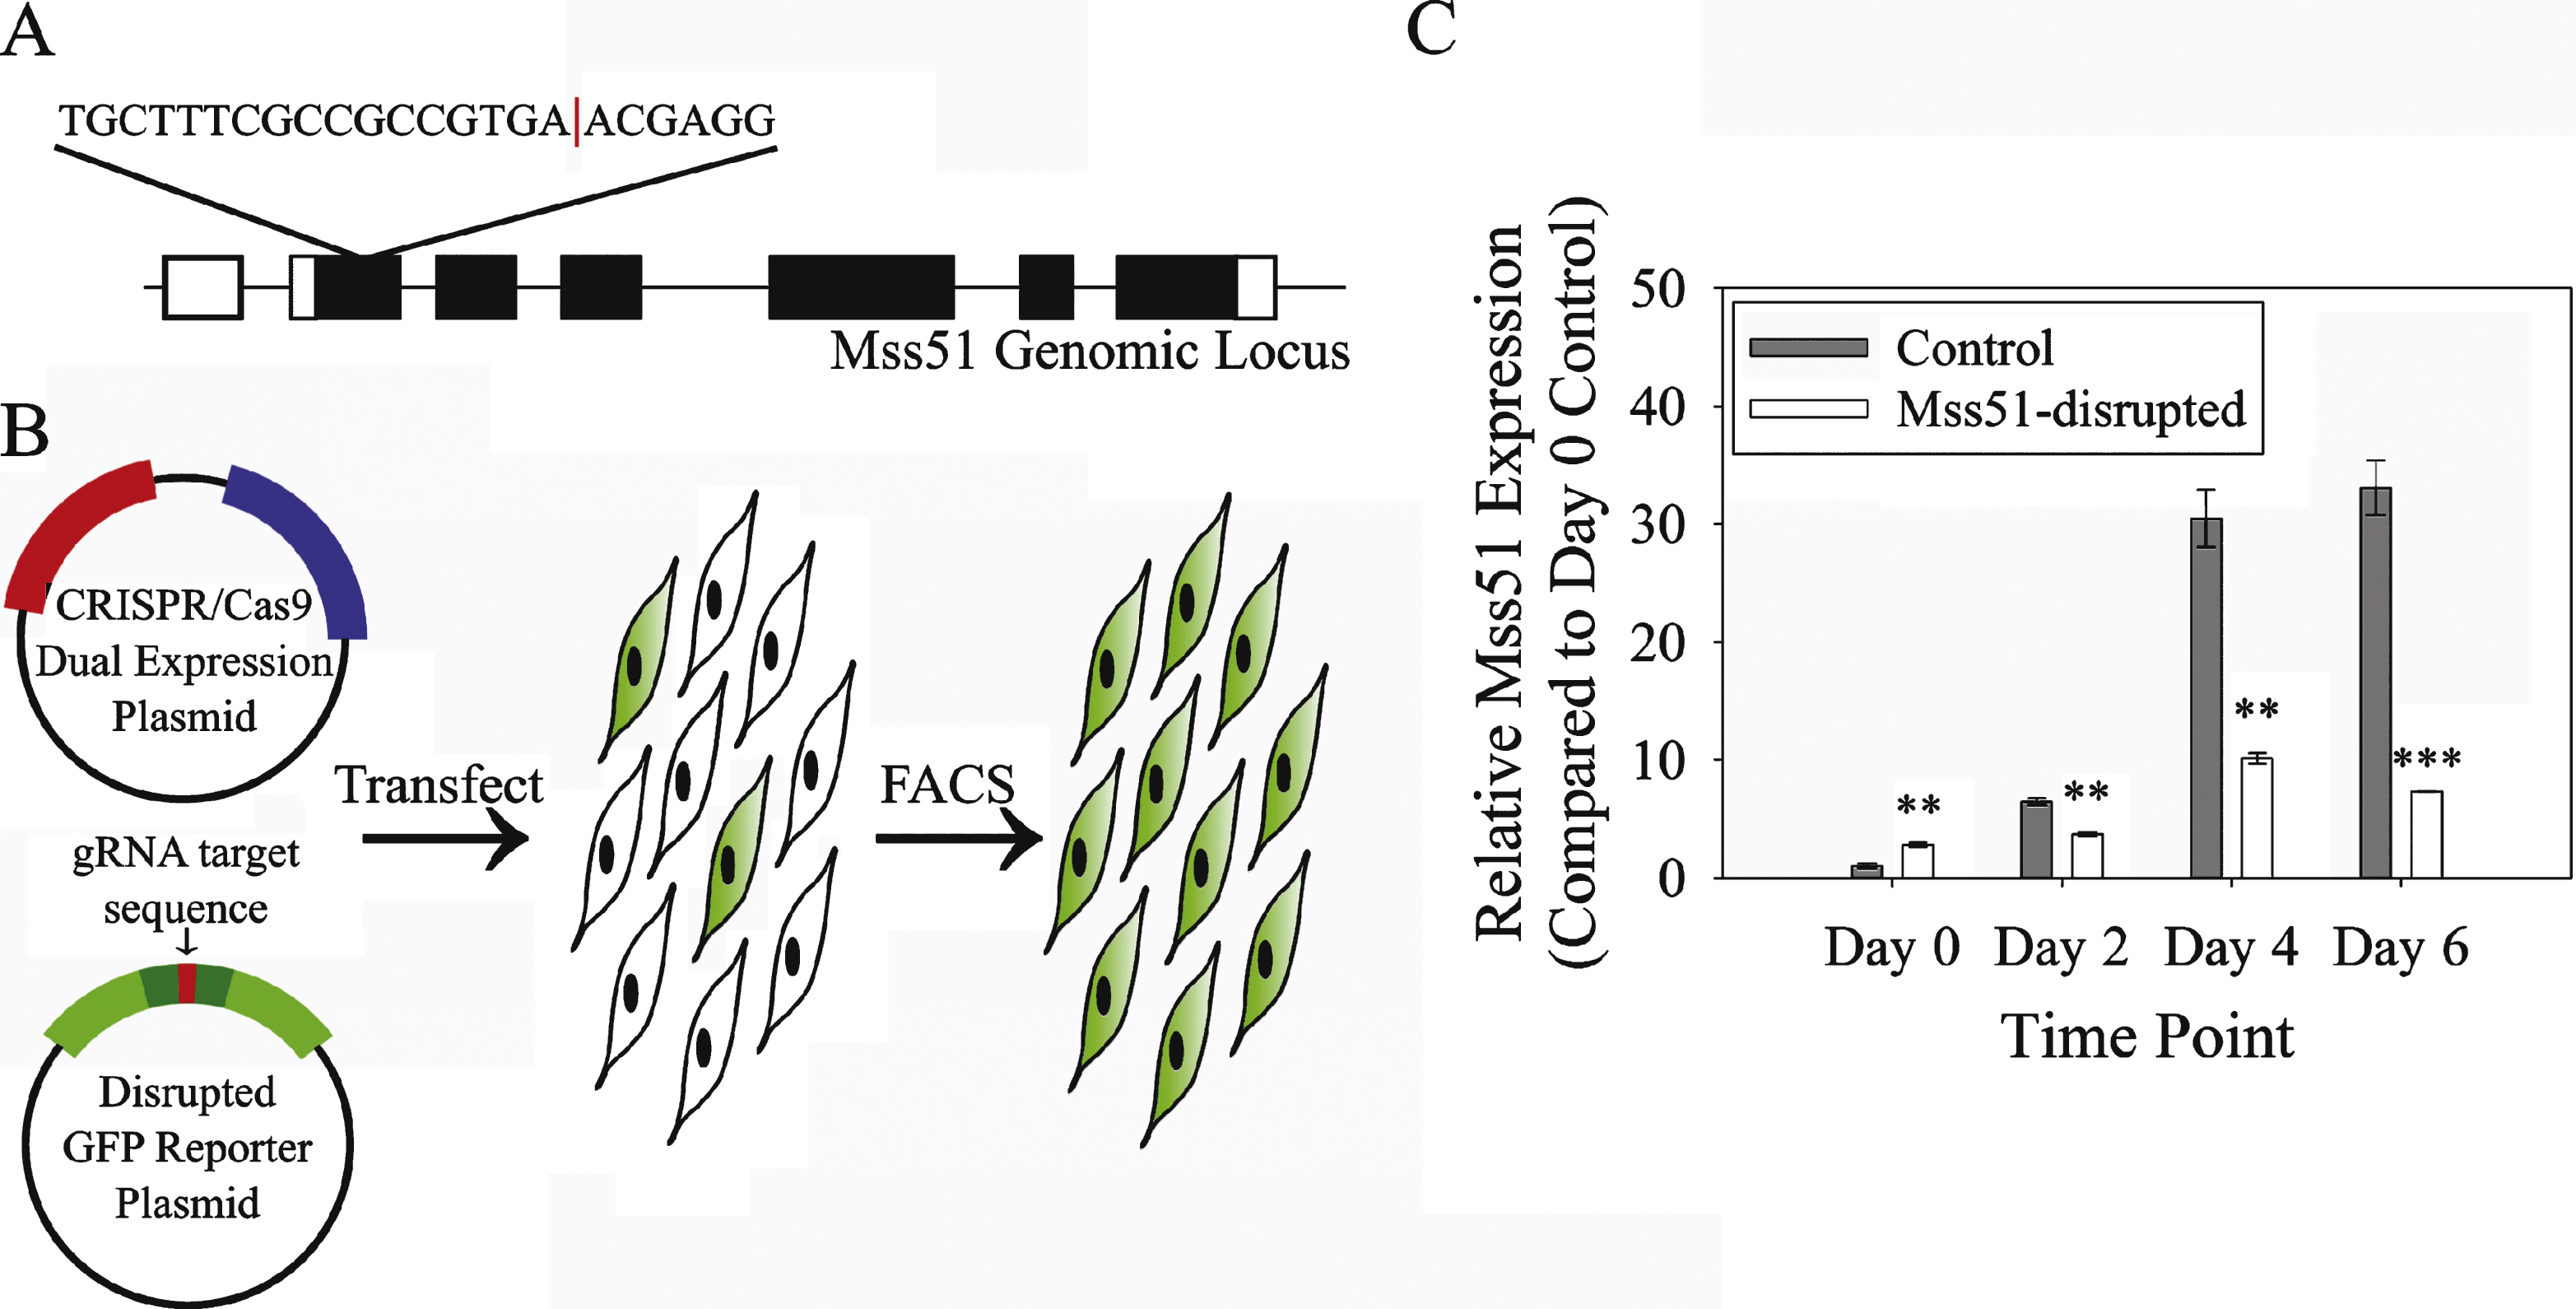
Fig.5
Mss51-disrupted myoblasts proliferate and differentiate normally. (A) Proliferating control and Mss51-disrupted myoblasts labeled with EdU (red) and Hoeschst 33342 (blue). (B) Quantification of EdU staining (n = 6 wells imaged per sample). (C) Representative myosin heavy chain (MF20, green) staining of control and Mss51-disrupted myotubes 2 days after induction of differentiation with nuclei stained by DAPI (blue). (D) Quantification of fusion index (percentage of nuclei found in MF20+ myotubes, n = 6). (E) Creatine kinase (CK) activity in myotubes after 6 days of differentiation. (F) Protein synthesis rates as measured by puromycin incorporation on the left and total protein stained by SYPRO Ruby on the right after 6 days of differentiation. (G) Densitometric analysis of SUnSET assay as shown in F, normalized to SYPRO Ruby-stained total protein (n = 3). Differences between groups were not statistically significant.
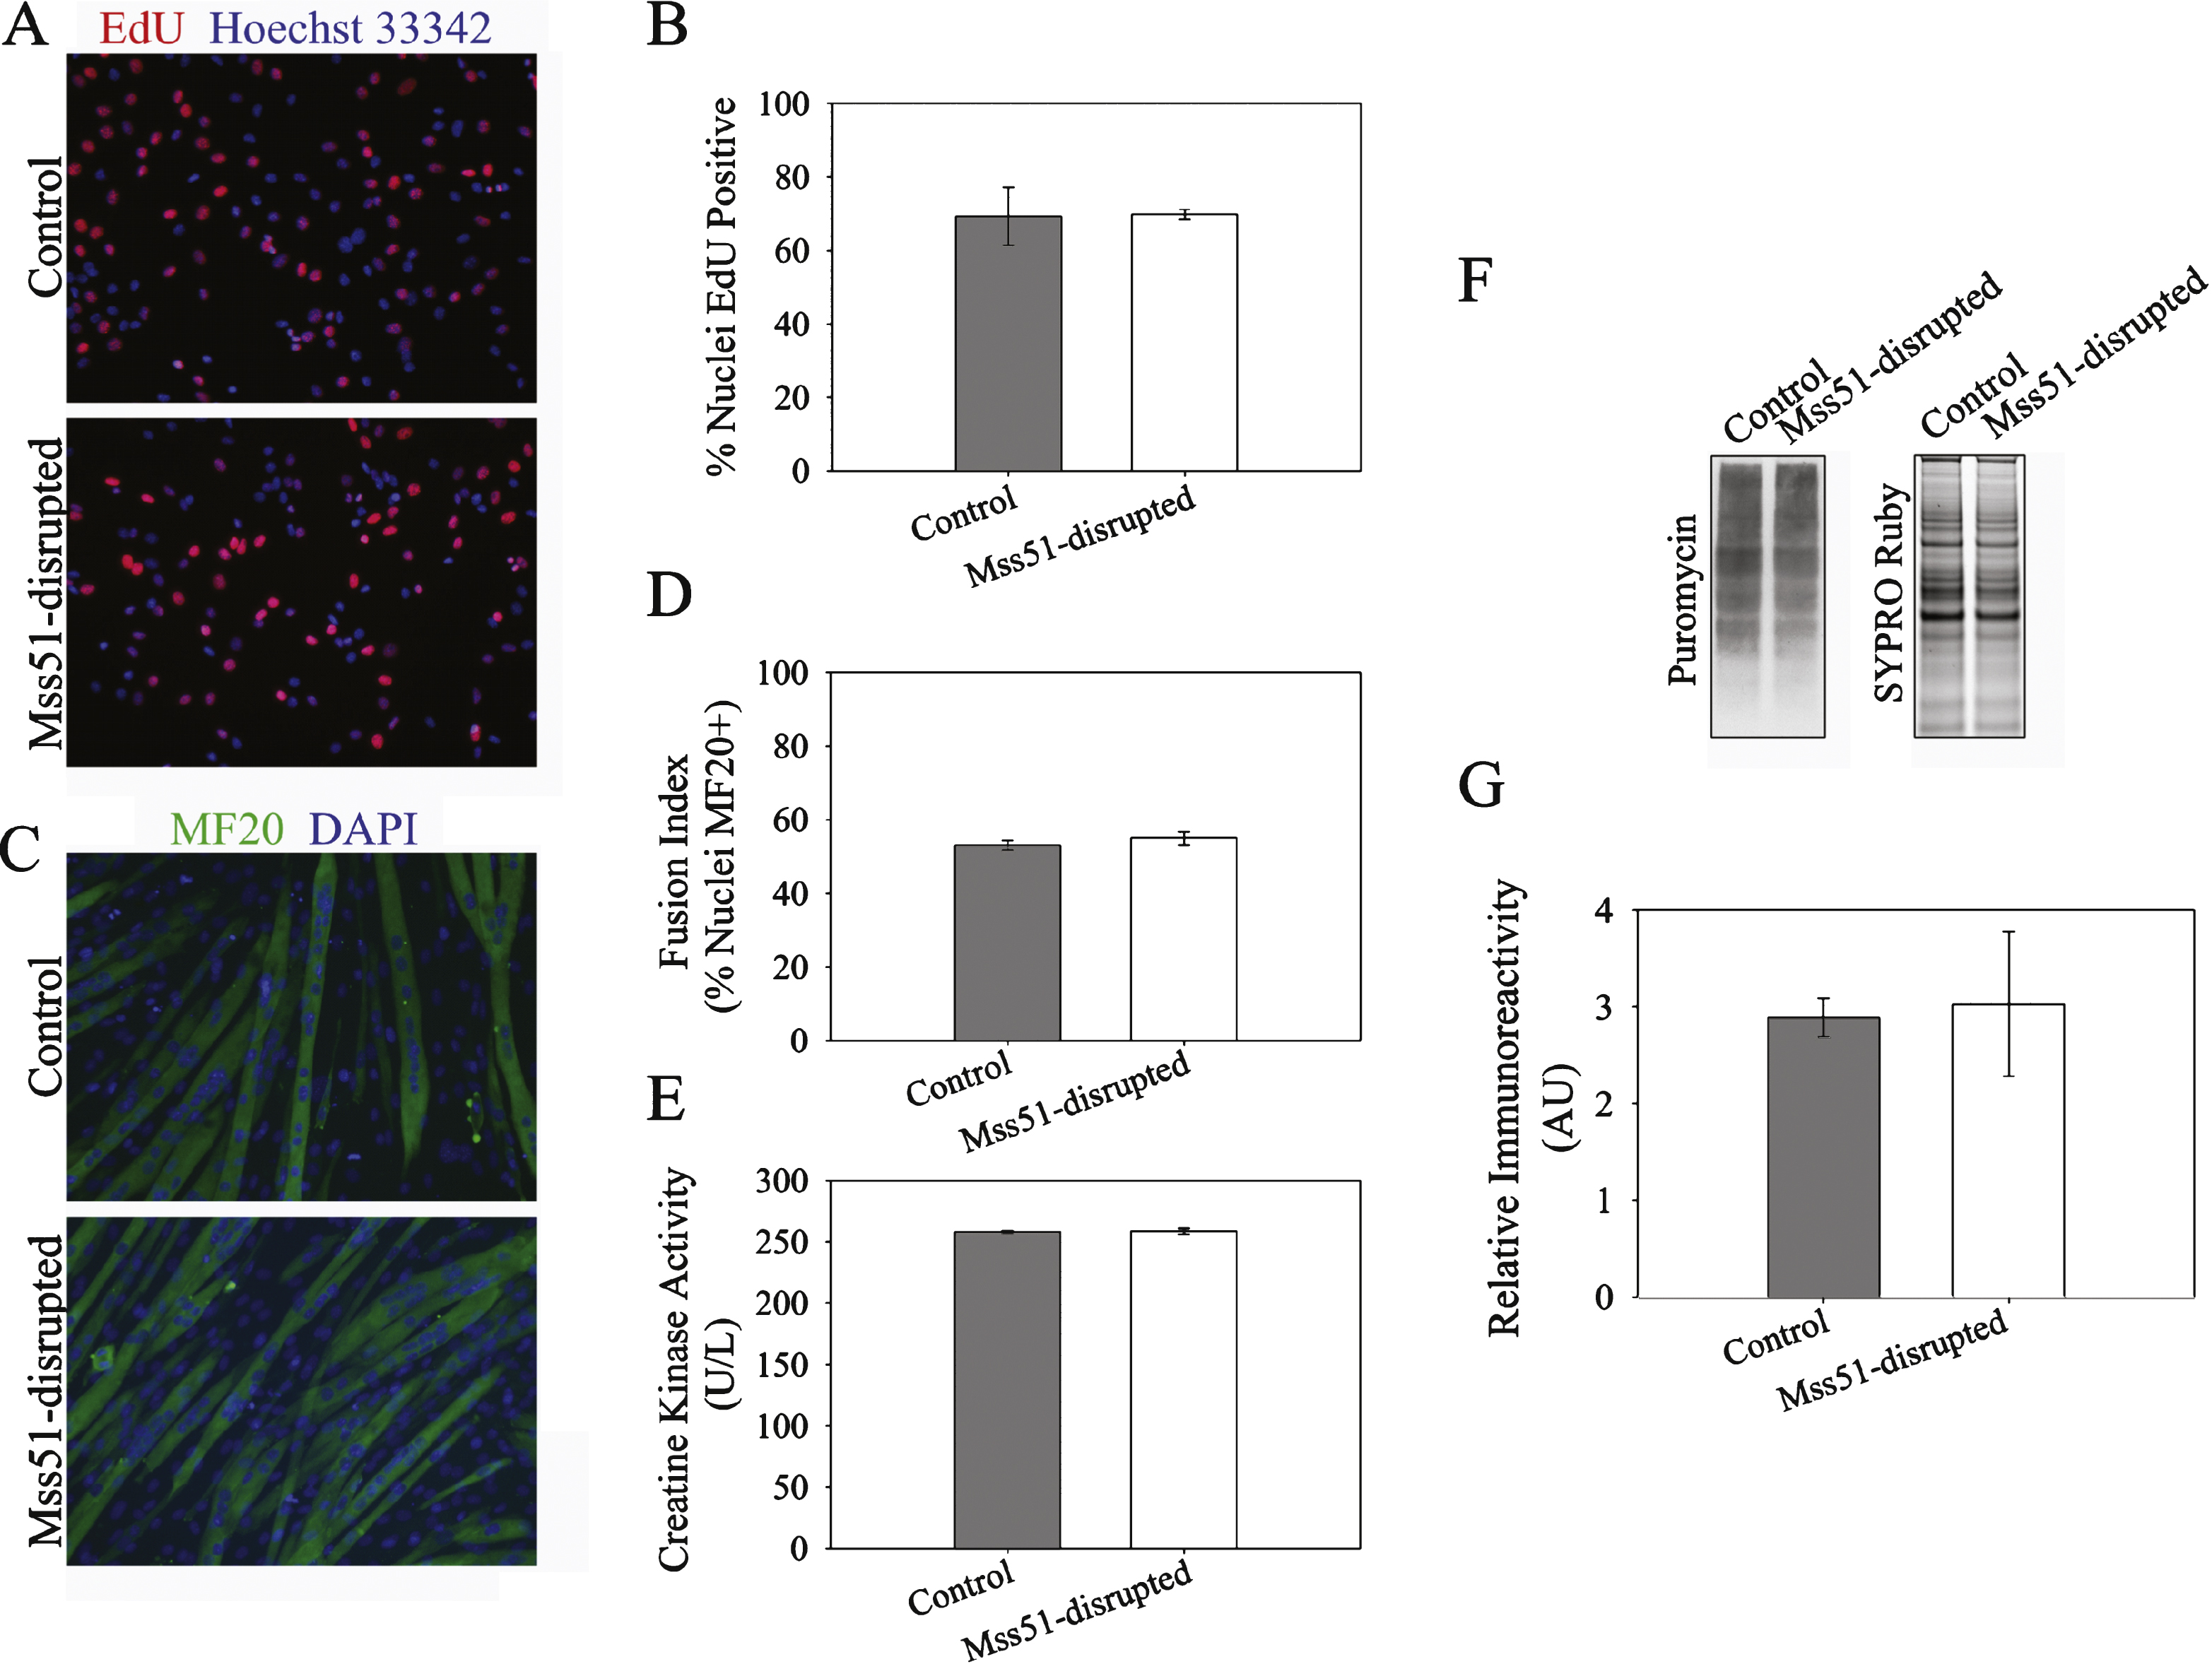
Fig.6
Gene and protein expression in Mss51-disrupted differentiated myotubes (A) Myosin heavy chain expression measured by qRT-PCR in control and Mss51-disrupted C2C12 myotubes, normalized to expression levels in control myotubes using reference genes Tfam and TBP (n = 3). (B) Expression of metabolic genes in control and Mss51-disrupted C2C12 myotubes, normalized to expression levels in control myotubes using reference genes Tfam and TBP (n = 3). (C) Western blots of control andMss51-disrupted C2C12 myotubes examining expression and phosphorylation of AMPKα. (D) Densitometric analysis of AMPKα expression normalized to GAPDH and of AMPKα phosphorylation normalized to both GAPDH and total AMPKα (n = 3). *p < 0.05, **p < 0.01.
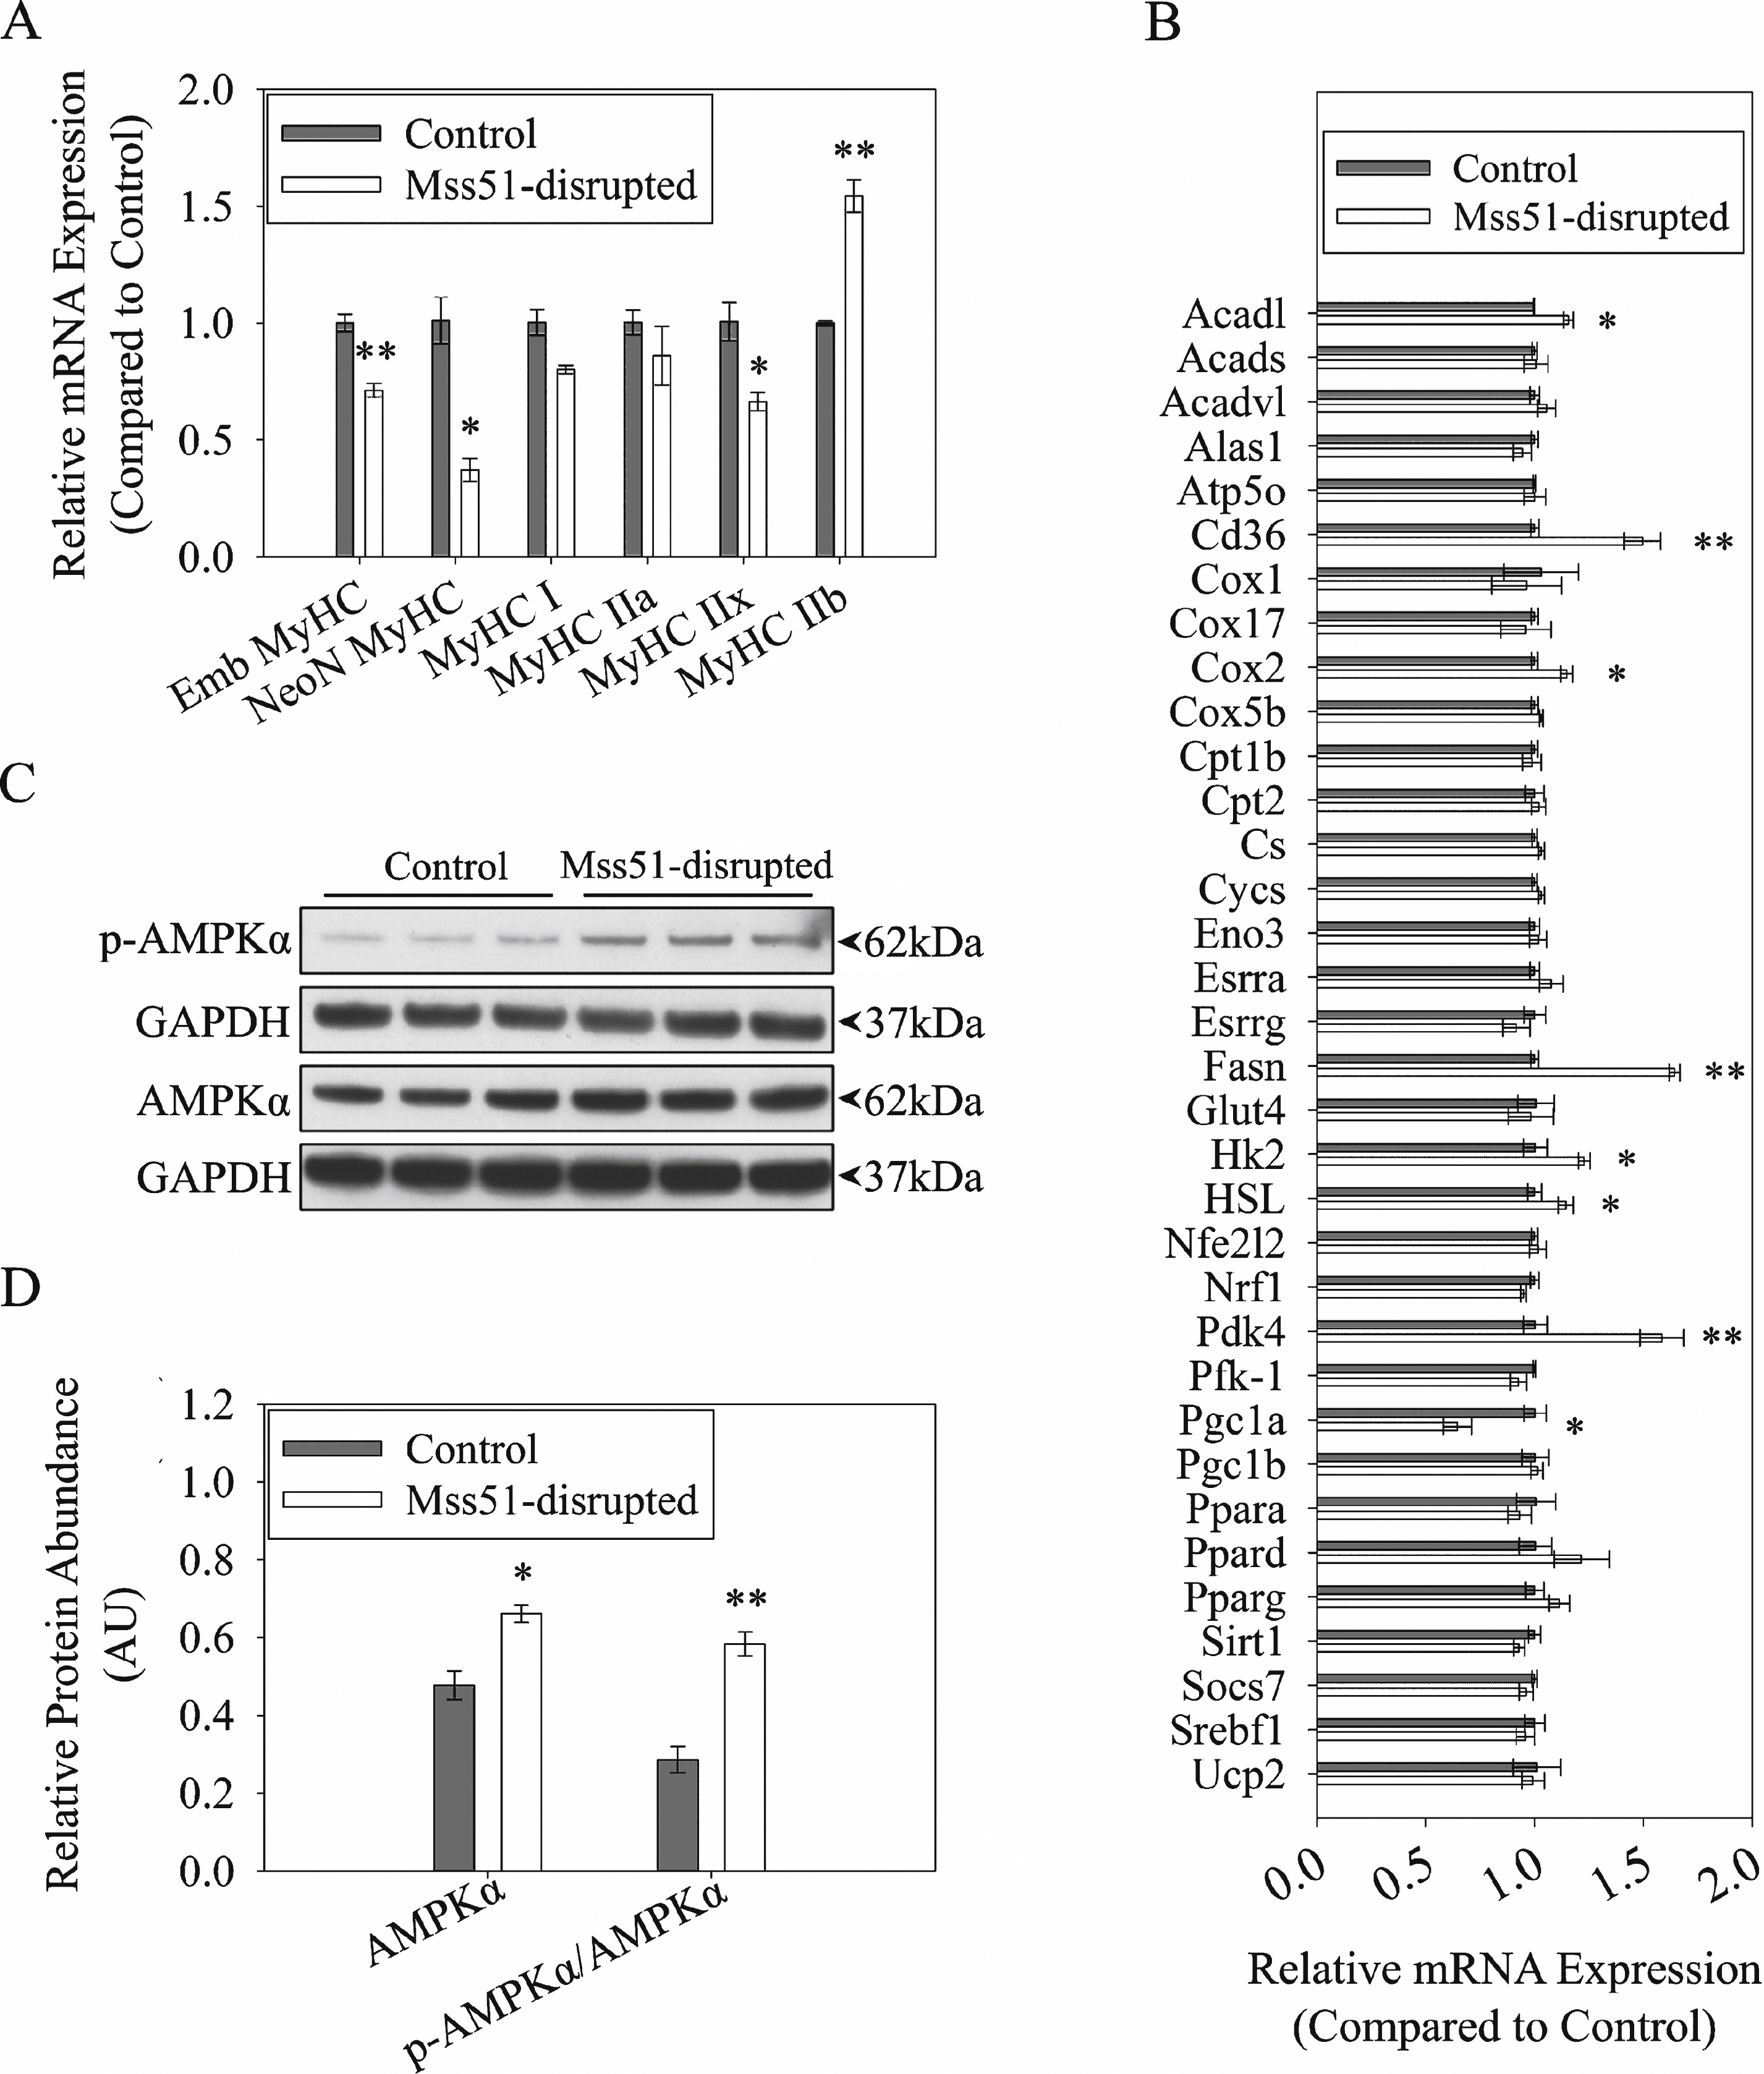
Fig.7
Glycolysis and Oxidative Phosphorylation in Mss51-disrupted cells. (A) ATP production in control and Mss51-disrupted myotubes (n = 6). (B) Activity of C16 :0 fatty acid β-oxidation in control and Mss51-disrupted myotubes (n = 6). (C) Glycolysis stress test measuring the extracellular acidification rate (ECAR) in control and Mss51-disrupted myotubes treated with glucose, oligomycin, and 2-deoxy-D-glucose. (D) Glycolysis, glycolytic capacity, and glycolytic reserve calculated from the glycolysis stress test (n = 10). (E) Mitochondrial stress test results comparing oxygen consumption rates (OCR) between control and Mss51-disrupted myotubes treated with oligomycin, carbonyl cyanide-p-trifluoromethoxyphen (FCCP), and Antimycin A/Rotenone. (F) Basal respiration, ATP production, proton leak, maximum respiration, and spare respiratory capacity as calculated from the mitochondrial stress test (n = 10). *p < 0.05, ***p < 0.001.