
MicroRNA and mRNA Expression Changes in Steroid Naïve and Steroid Treated DMD Patients
Abstract
Background:
Duchenne Muscular Dystrophy (DMD) is a recessive X-linked form of muscular dystrophy. Steroid therapy has clinical benefits for DMD patients, but the mechanism remains unclear.
Objective:
This study was designed to identify mRNAs and microRNAs regulated in Duchenne Muscular Dystrophy patients prior to and after steroid therapy.
Methods:
Genome wide transcriptome profiling of whole blood was performed to identify mRNAs and microRNAs regulated in DMD patients.
Results:
The data show many regulated mRNAs and some microRNAs, including some muscle-specific microRNAs (e.g., miR-206), that were significantly altered in blood of young (age 3–10) DMD patients compared to young controls. A total of 95 microRNAs, but no mRNAs, were differentially expressed in older DMD patients compared to matched controls (age 11–20). Steroid treatment reversed expression patterns of several microRNAs (miR-206, miR-181a, miR-4538, miR-4539, miR-606, and miR-454) that were altered in the young DMD patients. As an example, the over-expression of miR-206 in young DMD patients is predicted to down-regulate a set of target genes (e.g., RHGAP31, KHSRP, CORO1B, PTBP1, C7orf58, DLG4, and KLF4) that would worsen motor function. Since steroids decreased miR-206 expression to control levels, this could provide one mechanism by which steroids improve motor function.
Conclusions:
These identified microRNA-mRNA alterations will help better understand the pathophysiology of DMD and the response to steroid treatment.
INTRODUCTION
Duchenne muscular dystrophy (DMD) leads to progressive weakness of skeletal, respiratory and cardiac muscles [1, 2]. Increasing evidence shows that inflammatory cell infiltration of muscle is an important facet of disease pathophysiology and is associated withdisease severity in individual patients [2, 3]. Treatment with prednisone (a steroid) or a derivative (deflazacort, which produces fewer side effects) improves muscle strength, prolongs ambulation, and preserves pulmonary and cardiac function of patients with DMD [4–9]. However, it is unclear whether the clinical benefits from steroids relate to immunosuppressive activity since azathioprine - a non-steroid-immunosuppressant-failed to improve DMD [4]. As disordered glycometabolism may be one of the features of DMD [10, 11], it is possible that the clinical benefits from steroid treatment of DMD might be associated with the regulation of glycometabolism, since a steroid like prednisone has significant effects on glucose tolerance in healthy young adults [12].
Whole genome profiling of skeletal muscle as well as peripheral blood have been used to identify specific DMD-related cell death and cell regeneration pathways, and monitor gene expression changes after anti-inflammatory treatment with immunoglobulin, prednisone or deflazacort in patients with DMD [13–16]. However, the mechanisms that lead to the changes of mRNA expression remain unclear.
The discovery of microRNAs (miRNA) and their role as regulators of mRNA expression has led to new insights as to how gene expression is regulated [17–20]. Although there are only just over a thousand miRNAs, each one regulates hundreds of target genes [21]. More than a third of all human genes may be regulated by miRNAs [22]. Recently, several blood miRNAs (such as miR-1, miR-206, miR-133, miR-29, miR-223, and others) were shown to be differentially expressed in DMD animal models as well as in DMD patients [23–32]. In addition to helping account for changes in mRNA expression, the expression pattern ofmiRNAs alone could be biomarkers for prognosis and/or therapeutic response in DMD.
In this study we performed whole transcriptome profiling to identify differentially expressed mRNAs and miRNAs in non-glucocorticoid (steroid) treated DMD subjects with early stage disease (at presentation) ages 3–10 years and late stage disease (non-ambulatory) ages 11–20 years. In addition, we studied early stage DMD subjects 6 months after starting glucocorticoid (steroid) treatment, as compared to age, gender and race matched healthy controls. Potential mRNA-miRNA interactions were studied using a miRNA target gene algorithm (Target Scan Human 6.0). We also performed integrated mRNA-miRNA functional analyses to investigate the possible networks of differentially expressed mRNAs andmiRNAs using Exploratory Gene Association Networks (EGAN) [33].
MATERIALS AND METHODS
Study subjects
Patients were recruited from the Comprehensive Neuromuscular Center at Cincinnati Children’sHospital Medical Center. The study was approved by the Institutional Review Board at Cincinnati Children’s Hospital Medical Center and was conducted in accordance with the Declaration of Helsinki. There were 66 DMD patients (49 patients ages 3 to 10, and 17 patients ages 11 to 20), and 46 healthy controls (28 healthy controls ages 3 to 10, and 18 healthy controls ages 11 to 20) (Table 1). Diagnoses were made by a single board-certified pediatric neurologist(B. Wong). The inclusion criteria for subjects for the study were the diagnosis of DMD with genetic mutational confirmation and/or absent dystrophin in muscle and a clinical phenotype of DMD with skeletal muscle (pelvic girdle) weakness with age-appropriate language development at the time of diagnosis. Exclusion criteria were history of any other known medical disorders, mental retardation or autistic/pervasive developmental disorders, concurrent illnesses or the use of other medications or supplements for DMD. The healthy controls had screening laboratory tests including CRP, CPK, liver panel and a renal panel (Table 1). All control subjects had normal CRP, CPK, liver enzymes and renal function and had no other known medical conditions.
All subjects were divided into two age ranges: (1) DMD patients aged 3 through 10 (DMD young, “DMD-Y”, n = 49); healthy controls aged 3 through 10 (controls young, CTRL-Y, n = 28); and (2) DMD patients aged 11 through 20 (DMD old, DMD-O, n = 17) and healthy controls aged 11 through 20 (controls old, CTRL-O, n = 18). One blood sample was obtained from each subject in the DMD-O group and healthy controls. Two blood samples were drawn from each DMD-Y patient, with one prior to steroid treatment (DMD-YpreTx, n = 49), and another 6 months after initiation of steroid treatment (DMD-YpostTx, n = 49). The mean duration of steroid treatment for this group was 0.57 years (Table 1). PAXgene tubes (PreAnalytiX GmbH, Switzerland) were used to collect blood and stabilize RNA in blood. The tubes were incubated at room temperature for at least 2 hours, and then stored frozen at –80°C until processed.
The protocol yielded five groups: (1) DMD-Y patients prior to steroid treatment (DMD-YpreTx, n = 49); (2) DMD-Y patients post initiation of steroid treatment (DMD-YpostTx, n = 49); (3) healthy controls young (CTRL-Y, n = 28); (4) DMD-O patients naïve to steroid treatment (DMD-O, n = 17); (5) and healthy controls old (CTRL-O, n = 18). For all subjects the parents provided informed consent and the children/adolescents provided either assent or consent.
Total RNA isolation
All blood samples were processed at the same time and in the same laboratory to reduce technical variation. Total RNA was isolated according to the manufacturer’s protocol (PAXgene blood miRNA kit; PreAnalytiX). RNA quantity and quality were determined using a Nano-Drop (Thermo Fisher) and Agilent 2100 Bioanalyzer, respectively. Samples required A260/A280 absorbance ratios ≥1.8, 28 S/18 S rRNA ratio ≥1.8, and an RNA integrity number (RIN)≥8.
mRNA microarrays
Total RNA (80 ng each sample) was converted to cDNA and amplified using the Applause WT-Amp Plus ST System (NuGEN, San Carlos, CA) and labeled using the FL-Ovation cDNA Biotin Module V2 (NuGEN). The labeled cDNA was then hybridized to Affymetrix GeneChip Human Gene 1.0 ST microarrays (Affymetrix, Santa Clara, CA) to profile gene expression of mRNAs according to the manufacturer protocol. High resolution images of the arrays were obtained and converted to CEL files for analysis.
microRNA arrays
RNA was isolated and 200 ng per subject of total RNA was used per microarray. RNA was converted to cDNA and labeled using FlashTag Biotin HSR labeling kits (Affymetrix, CA) with no amplification. The product was hybridized to Affymetrix Gene Chip miRNA 3.0 Arrays (Affymetrix, Santa Clara, CA) and scanned using an Affymetrix GCS3000 Gene Array Scanner according to the manufacturer’s protocol.
Statistical analysis of mRNA and miRNA data
Partek Genomics Suite 6.6 (Partek Inc., St. Louis, MI) was used to analyze mRNA and miRNA. Microarray data were imported into the software with RMA background correction, quantile normalization and median polish probeset summarization. No cut-off filters were used on the expression data. Statistical analyses on normalized mRNA or miRNA data were made with three primary comparisons: (1) DMD-YpostTx (n = 49) versus DMD-YpreTx (n = 49) (paired t-test); (2) DMD-YpreTx (n = 49) versus CTRL-Y (n = 28) (unpaired t-test); and (3) DMD-O (n = 17) versus CTRL-O (n = 18) (unpaired t-test). For the mRNA data, a P value < 0.05 with a false discovery rate (FDR) of 5% correction for multiple comparisons with a fold change > |1.2| cut off was used to identify differentially expressed mRNAs. For the miRNA data, a P < 0.05 coupled with a fold change > |1.2| was considered significant. The data analyses were performed by an investigator who was blinded to the groups. The significantly expressed mRNAs or miRNAs from each sample were subjected to hierarchical clustering by Euclidean distance based on their relative expression.
Custom database of differentially altered miRNAs and their putative target genes
Target Scan Human 6.0 uses an algorithm that discriminates whether target mRNAs have conserved or poorly conserved sites for corresponding miRNAs, using the principle that miRNAs bind to complementary sequences in the three prime untranslated regions (3’UTRs) of target mRNAs [18, 34]. Using this algorithm, we generated custom databases comprised of the over- or under- expressed miRNAs and their putative target genes (mRNAs), respectively.
Integrated mRNA-miNRA functional analyses
The integrated mRNA-miRNA functional network analyses were performed according to the method described previously with minor modifications [33]. Although there are two possible regulatory interactions between mRNAs and miRNA (inverse or positive), only the inverse mRNA-miRNA interactions were examined because they are the most common types of interactions and positive interactions are rare (see Discussion). Briefly, data lists of over/under-expressed mRNAs, and our custom database of under/over-expressed miRNAs and putative target genes were uploaded into the integrated mRNA-miRNA functional network analyses software: Exploratory Gene Association Networks (EGAN). The integrated mRNA-miRNA functional networks were identified and subjected to functional significance was assessed using the Gene Ontology database (GO, Biological Processes). The two possible pairs of inverse regulatory interactions are reported in this study including under-expressed miRNA/over-expressed mRNA or over-expressed miRNA/under-expressed mRNA.
RESULTS
Patient characteristics
The mean ages for the DMD-Y (n = 49) and DMD-O (n = 17) patients at enrollment were 5.41 ± 1.55 and 16.33 ± 2.45, respectively. This compares with the mean age of CTRL-Y (n = 28) group of 6.61 ± 1.93 and CTRL-O (n = 18) of 15.95 ± 3.25. All DMD-Y and DMD-O subjects were steroid naïve at the time of enrollment. Each DMD-Y patient received daily steroid treatment (45 patients were on deflazacort; 4 patients were on predinsone) for an average of 0.57 years before the 2nd blood draw. Steroid treatment in DMD-Y patients was associated with improved motor function in all subjects (Table 2). After steroid treatment, the time for Gowers’ test (timed sit to stand) decreased from 2.63 ± 1.19 seconds at enrollment to 1.95 ± 0.68 seconds (p < 0.0001); time for 30-feet run decreased from 5.32 ± 1.32 seconds at enrollment to 4.29 ± 0.76 seconds (p < 0.0001). CK decreased from 24788 ± 11081 at enrollment to 14717 ± 7555 (p < 0.0001).
Differentially expressed mRNAs and miRNAs
We measured mRNA and miRNA expression in blood samples of the five groups (DMD-YpreTx, n = 49; DMD-YpostTx, n = 49; CTRL-Y, n = 28; DMD-O, n = 17; and CTRL-O, n = 18) using Affymetrix GeneChip Human Gene 1.0 ST microarrays and Affymetrix Gene Chip miRNA 3.0 Arrays. There were 101 mRNAs (FDR < 0.05; fold change > |1.2|) (Fig. 1, Supplemental Table 1A) and 59 miRNAs (P < 0.05; fold change > |1.2|) (Supplemental Table 1B) differentially expressed in DMD-YpreTx (n = 49) compared to CTRL-Y (n = 28). A total of 80 mRNAs (FDR < 0.05; fold change > |1.2|) (Supplemental Table 2A) and 17 miRNAs (P < 0.05; fold change > |1.2|) (Supplemental Table 2B) were differentially expressed in DMD-YpostTx (n = 49) compared to DMD-YpreTx (n = 49). Though there were no mRNA (FDR < 0.05; fold change > |1.2|), a total of 95 miRNAs (P < 0.05; fold change > |1.2|) (Supplemental Table 3) were differentially expressed in DMD-O (n = 17) compared to CTRL-O (n = 18).
Effects of steroid treatment on miRNAs in DMD-Y patients
Expression of miR-206, miR-181a, miR-4538, miR-4539 and miR-606 were higher in DMD-Y (n = 49) patients as compared to CTRL-Y (n = 28), whereas miR-454 was lower in DMD-Y compared to CTRL-Y ( *P < 0.05 vs. CTRL-Y (n = 28). Steroid treatment (DMD-YpostTx, n = 49) reversed theexpression patterns of these miRNAs at the post-treatment time point, decreasing the over-expressed miR-181a, miR-4538, miR4539, miR-206 and miR-606, and increasing the under-expressed miR-454 to control levels ( # P < 0.05 vs. DMD-YpreTx, n = 49) (Fig. 2, Supplemental Table 4).
Functional analysis of under-expressed mRNAs and over-expressed miRNAs in DMD-YpreTx compared to CTRL-Y
In the comparison of DMD-YpreTx (n = 49) and CTRL-Y (n = 28), the integrated mRNA-miRNA functional analyses showed the links between the under-expressed mRNAs (PSAP, CTNND1, GLT25D1, PLD3, AGPAT3, SLC27A4, RPS6KA4, CD4, DPYSL2, DLG4, VASH1, GFRA2, GLTSCR1, TTYH3, KLF4, HDC, RAB34, CBX6, PTBP1, SEPN1, CORO1B, and others) and the over-expressed miRNAs (miR-206, miR-181a, miR-4538, miR4539, miR-548c-3p, miR-509-3-5p) (Fig. 3). The top canonical pathways of this mRNAs-miRNA network included locomotion/ motor function (p = 4.79E-04), lipid metabolic process (p = 4.95E-04), induction by virus of host cell-cell fusion (p = 6.85E-04), protein palmitolylation (p = 6.85E-04) and others (Fig. 3). We could not perform miRNA-mRNA functional analysis on the over-expressed mRNAs because there were no over-expressed mRNAs in this comparison.
Functional analysis of under-expressed mRNAs and over-expressed miRNAs in DMD-YpostTx compared to DMD-YpreTx
In the comparison of DMD-YpostTx (n = 49) and DMD-YpreTx (n = 49), the integrated mRNA-miRNA functional analyses showed links between the under-expressed mRNAs (ARID5B, COL19A1, CXCR5, BCL11A, ENPP2, FMNL3, KCNH8, BTBD3, TCF4, PDE7B, GGA2, PCDH9, BACH2, MOBKL2B, PMEPA1, AFF3) and the over-expressed miRNAs (miR-454, miR-4745-5p, miR-1303) (Fig. 3). The top canonical pathways of this mRNAs-miRNA network included B cell activation (p = 9.14E-04), phosphatidylcholine catabolic process (p = 1.06E-03), fibroblast migration (p = 1.41E-03), muscle organ development (p = 2.96E-03), lymph node development (p = 3.53E-03) and others (Fig. 4).
Functional analysis of over-expressed mRNAs and under-expressed miRNAs in DMD-YpostTx compared to DMD-YpreTx
In the comparison of DMD-YpostTx (n = 49) and DMD-YpreTx (n = 49), the integrated mRNA-miRNA functional analyses showed links between the over-expressed mRNAs (GRB10, CD163, FLT3, FKBP5, CDC14B, NETO1, ERG, ASPH, MMP8) and the under-expressed miRNAs (miR-206, miR-181a, miR-4538, miR4539, miR-409-3p, miR-4478, miR-1279) (Fig. 4). The top canonical pathways of this mRNAs-miRNA network included vascular endothelial growth factor receptor signaling pathway (p = 1.74E-05), negative regulation of glycogen biosynthetic process(p = 5.96E-04), activation of anaphase-promoting complex activity (p = 9.94E-04), negative regulation of glycogen metabolic process (p = 9.94E-04), negative regulation of glucose import (p = 1.39E-03), negative regulation of glucose transport (p = 1.59E-03) andothers (Fig. 5).
DISCUSSION
This study demonstrated numerous mRNAs and miRNAs, including some muscle-specific miRNAs (e.g., miR-206) previously reported by others [25–32], were altered significantly in the whole blood of young DMD patients (age 3–10, n = 49) as compared to young healthy controls (age 3–10, n = 28). Notably, no mRNAs but 95 miRNAs were significantly altered in old DMD patients (age 11–20, n = 17) as compared to old healthy controls (age 11–20, n = 18). The data also showed that steroid treatment attenuated the changes of several miRNAs (miR-206, miR-181a, miR-4538, miR-4539, miR-606, and miR-454) that were altered in young DMD patients (n = 49) before treatment compared to controls.
A recent study showed that DMD patients with milder disease have higher levels of muscle-specific miRNAs (e.g., miR-1, miR-206, miR-133) in blood than more severely affected patients [23]. This suggests that the expression abundance of muscle-specific miRNAs in blood varies depending on the severity of DMD. Our results confirm this suggestion in that miR-206 and miR-133 were both regulated in young DMD patients. In addition, miR-206 has also been implicated in other muscle disorders like muscle hypertrophy [35, 36].
There are two potential modes of miRNA regulation of target mRNAs. One is known as inverse/negative regulation by which miRNAs bind to complementary sequences in the 3’UTRs of target mRNAs, resulting in transcript degradation and post-translational suppression. Another is positive regulation in which miRNAs bind to the non-coding regulatory regions in gene promoters, sometimes leading to transcriptional and translational activation [40–43]. Here, we focused only on negative regulation in the mRNA-miRNA functional network analyses because mRNA-miRNA negative regulation is much more prevalent than positive regulation, and available algorithms for predicting target mRNAs of the miRNAs are currently based upon the principle of negativeregulation.
Although it was unknown of the exact cells/origins of the mRNA or miRNA as we measured from a whole blood composite, we thought it was important to address the regulatory interactions and relationships of these two classes of RNA as cell localization of miRNA does not limit the ability to cross transport through vesicles/exosomes and interact with other cells. The integrated mRNA-miRNA functional network analyses showed that: (1) in young DMD patients (n = 49) vs. healthy controls (n = 28), under-expressed mRNAs and over-expressed miRNAs were related to locomotor/motor function and (2) in post-steroid young DMD patients (n = 49), under-expressed mRNAs and over-expressed miRNAs were associated with muscle organ development and B cell activation, while over-expressed mRNAs and under-expressed miRNAs were associated with glycogen metabolism and glucose transport.
Our data showed that miR-206 was over-expressed significantly in young DMD patients but not in older DMD patients. This is consistent with previous reports that miR-206 increased in blood at the early stage of disease and resolved at a later stage over time in the mouse DMD model [25]. Although the over-expression of miR-206 in blood has been reported in DMD [25–32], we are the first to demonstrate the decrease of miR-206 after steroid treatment in young DMD patients. Furthermore, the integrated mRNA-miRNA functional network analysis revealed that over-expressed miR-206 would down-regulate a set of potential target genes (e.g., RHGAP31, KHSRP, CORO1B, PTBP1, C7orf58, DLG4, and KLF4) that affect motor function such that the over expressed miR-206 would worsen locomotion/motor function. Therefore, the decrease in miR-206 after steroid treatment would up-regulate the above target genes which would tend to improve skeletal muscle function and preserve pulmonary and cardiac function.
We also identified five more miRNAs, including miR-181a, miR-4538, miR-4539, miR-606, and miR-454, that were associated with steroid treatment in the young DMD patients. miR-206, miR-181a, miR-4538, miR-4539 and miR-606 were elevated in young DMD patients, but decreased to control levels after steroid treatment. Interestingly, many predicted functions of over-expressed mRNAs and under-expressed miRNAs after steroid treatment were associated with glycogen metabolism and glucose transport. This suggests a possible glycogen/glucose mechanism by which steroid treatment improves muscle function of DMD patients, as disrupted glycometabolism has been proposed to be a feature of DMD [10, 11]. Though miR-454 was decreased in young DMD patients compared to controls, it increased following steroid treatment. The integrated mRNA-miRNA functional network analysis showed that over-expressed miR-454 after steroid treatment might down-regulate a set of target genes (e.g., MOBKL2B, GGA2, AFF3, BACH2, COL19A1, PMEPA1, TCF4, BCL11A, PDE7B, FMNL3, BTBD3, KCNH8, and ARID5B) which are associated with muscle and immune cell development. Thus, steroids might suppress immune function but at the same time interfere with muscle development. However, it is unclear if the up-regulation of miR-454 after steroid treatment is beneficial or detrimental, as the changes in glycogen and glucose metabolism could either be favorable or damaging indicators for DMD or treatment progression.
Our data provides a library of possible mRNA-miRNA networks in blood that may provide insight into the molecular basis for disease mechanisms in DMD and biological pathways associated with the pharmacological response of steroid therapy in DMD. Future studies might compare blood of DMD patients to Becker’s and other muscular dystrophies to determine if there are specific leukocyte responses to each. Indeed, one of the DMD patients in this study was later diagnosed as Becker’s, though the blood mRNA-miRNA profile of this Becker’s patient was most like that of the controls than the DMD patients. Thus, even different genetic mutations in the dystrophin gene might produce different mRNA-miRNA responses which will require further study. Moreover, future studies will need to focus on the steroid responsive miRNAs (i.e., miR-206, miR-181a, miR-4538, miR-4539, miR-606, and miR-454) to examine which cell type(s) they are derived from and how they interact with blood leukocytes with or without steroid treatment in DMD.
There are some limitations of this study, including 1) Sample size of old DMD patients (n = 18) was small; 2) Lack of knowledge of the cell types expressing either the mRNA or miRNAs identified, and whether they were derived from muscle, white cells or other tissues; 3) Lack of validation of the transcript expression data by a second method (e.g. qRT-PCR); 4) Challenges in assigning steroid-responsive miRNAs as biomarkers of either efficacy or toxicity; 5) The utilization of relatively non-stringent statistical adjustments for multiple testing (particularly with miRNA analyses) suggests that some may be false positives, and should be validated in future independent data sets.
CONFLICT OF INTEREST
There are no conflicts of interest to report.
ACKNOWLEDGMENTS
The authors acknowledge the support of Genethon and the Advanced Diagnostics for New therapeutic Approaches (ADNA) program.
Appendices
The supplementary table and figure are available in the electronic version of this article: http://dx.doi.org/10.3233/JND-150076.
REFERENCES
1 | National Human Genome Research Institute N. Learning About Duchenne Muscular Dystrophy http://wwwgenomegov/19518854. 2013 |
2 | Mavrogeni S, Papavasiliou A, Spargias K, Constandoulakis P, Papadopoulos G, Karanasios E (2010) Myocardialinflammation in Duchenne Muscular Dystrophy as a precipitating factor for heart failure: A prospective study BMC Neurology 10: 33 |
3 | De Paepe B, De Bleecker JL (2013) Cytokines and chemokines as regulators of skeletal muscle inflammation: Presenting the case of Duchenne muscular dystrophy Mediators of Inflammation 2013: 540370 |
4 | Griggs RC, Moxley RT3rd, Mendell JR, Fenichel GM, Brooke MH, Pestronk A (1993) Duchenne dystrophy: Randomized, controlled trial of prednisone (18 months) and azathioprine (12 months) Neurology 43: 520 527 |
5 | Biggar WD, Gingras M, Fehlings DL, Harris VA, Steele CA (2001) Deflazacort treatment of Duchenne muscular dystrophy The Journal of Pediatrics 138: 45 50 |
6 | Biggar WD, Harris VA, Eliasoph L, Alman B (2006) Long-term benefits of deflazacort treatment for boys with Duchenne muscular dystrophy in their second decade Neuromuscular disorders: NMD 16: 249 255 |
7 | McAdam LC, Mayo AL, Alman BA, Biggar WD (2012) The Canadian experience with long-term deflazacort treatment in Duchenne muscular dystrophy Acta myologica: Myopathies and cardiomyopathies: Official Journal of the Mediterranean Society of Myology / edited by the Gaetano Conte Academy for the Study of Striated Muscle Diseases 31: 16 20 |
8 | Merlini L, Cicognani A, Malaspina E, Gennari M, Gnudi S, Talim B (2003) Early prednisone treatment in Duchenne muscular dystrophy Muscle & Nerve 27: 222 227 |
9 | Markham LW, Spicer RL, Khoury PR, Wong BL, Mathews KD, Cripe LH (2005) Steroid therapy and cardiac function in Duchenne muscular dystrophy Pediatric Cardiology 26: 768 771 |
10 | Wehling-Henricks M, Oltmann M, Rinaldi C, Myung KH, Tidball JG (2009) Loss of positive allosteric interactions between neuronal nitric oxide synthase and phosphofructokinase contributes to defects in glycolysis and increased fatigability in muscular dystrophy Human Molecular Genetics 18: 3439 3451 |
11 | Stapleton DI, Lau X, Flores M, Trieu J, Gehrig SM, Chee A (2014) Dysfunctional muscle and liver glycogen metabolism in mdx dystrophic mice PloS One 9: e91514 |
12 | Kauh E, Mixson L, Malice MP, Mesens S, Ramael S, Burke J (2012) Prednisone affects inflammation, glucose tolerance, and bone turnover within hours of treatment in healthy individuals European Journal of Endocrinology / European Federation of Endocrine Societies 166: 459 467 |
13 | Haslett JN, Sanoudou D, Kho AT, Han M, Bennett RR, Kohane IS (2003) Gene expression profiling of Duchenne muscular dystrophy skeletal muscle Neurogenetics 4: 163 171 |
14 | Pescatori M, Broccolini A, Minetti C, Bertini E, Bruno C, D’Amico A (2007) Gene expression profiling in the early phases of DMD: A constant molecular signature characterizes DMD muscle from early postnatal life throughout disease progression FASEB Journal: Official Publication of the Federation of American Societies for Experimental Biology 21: 1210 1226 |
15 | Lit L, Sharp FR, Apperson M, Liu DZ, Walker WL, Liao I (2009) Corticosteroid effects on blood gene expression in Duchenne muscular dystrophy The Pharmacogenomics Journal 9: 411 418 |
16 | Wong B, Gilbert DL, Walker WL, Liao IH, Lit L, Stamova B (2009) Gene expression in blood of subjects with Duchenne muscular dystrophy Neurogenetics 10: 117 125 |
17 | Chen K, Rajewsky N (2007) The evolution of gene regulation by transcription factors and microRNAs Nature Reviews Genetics 8: 93 103 |
18 | Bartel DP (2004) MicroRNAs: Genomics, biogenesis, mechanism, and function Cell 116: 281 297 |
19 | Filip A (2007) [MiRNA–new mechanisms of gene expression control] Postepy Biochem 53: 413 419 |
20 | Ruby JG, Jan CH, Bartel DP (2007) Intronic microRNA precursors that bypass Drosha processing Nature 448: 83 86 |
21 | Guarnieri DJ, DiLeone RJ (2008) MicroRNAs: A new class of gene regulators Ann Med 40: 197 208 |
22 | Esquela-Kerscher A, Slack FJ (2006) Oncomirs - microRNAs with a role in cancer Nat Rev Cancer 6: 259 269 |
23 | Zaharieva IT, Calissano M, Scoto M, Preston M, Cirak S, Feng L (2013) Dystromirs as serum biomarkers for monitoring the disease severity in Duchenne muscular Dystrophy PloS One 8: e80263 |
24 | Cacchiarelli D, Martone J, Girardi E, Cesana M, Incitti T, Morlando M (2010) MicroRNAs involved in molecular circuitries relevant for the Duchenne muscular dystrophy pathogenesis are controlled by the dystrophin/nNOS pathway Cell Metabolism 12: 341 351 |
25 | Liu N, Williams AH, Maxeiner JM, Bezprozvannaya S, Shelton JM, Richardson JA (2012) microRNA-206 promotes skeletal muscle regeneration and delays progression of Duchenne muscular dystrophy in mice The Journal of Clinical Investigation 122: 2054 2065 |
26 | Greco S, De Simone M, Colussi C, Zaccagnini G, Fasanaro P, Pescatori M (2009) Common micro-RNA signature in skeletal muscle damage and regeneration induced by Duchenne muscular dystrophy and acute ischemia FASEB journal: Official Publication of the Federation of American Societies for Experimental Biology 23: 3335 3346 |
27 | Crist CG, Buckingham M (2010) Megarole for microRNA in muscle disease Cell Metabolism 12: 425 426 |
28 | Mizuno H, Nakamura A, Aoki Y, Ito N, Kishi S, Yamamoto K (2011) Identification of muscle-specific microRNAs in serum of muscular dystrophy animal models: Promising novel blood-based markers for muscular dystrophy PloS One 6: e18388 |
29 | Hu J, Kong M, Ye Y, Hong S, Cheng L, Jiang L (2014) Serum miR-206 and other muscle-specific microRNAs as non-invasive biomarkers for Duchenne muscular dystrophy Journal of Neurochemistry 129: 877 883 |
30 | Wu J, Yang T, Li X, Yang Q, Liu R, Huang J (2013) Alteration of serum miR-206 and miR-133b is associated with lung carcinogenesis induced by 4-(methylnitrosamino)-1-(3-pyridyl)-1-butanone Toxicology and Applied Pharmacology 267: 238 246 |
31 | Roberts TC, Blomberg KE, McClorey G, El Andaloussi S, Godfrey C, Betts C (2012) Expression analysis in multiple muscle groups and serum reveals complexity in the microRNA transcriptome of the mdx mouse with implications for therapy Molecular Therapy Nucleic Acids 1: e39 |
32 | Saccone V, Consalvi S, Giordani L, Mozzetta C, Barozzi I, Sandona M (2014) HDAC-regulated myomiRs control BAF60 variant exchange and direct the functional phenotype of fibro-adipogenic progenitors in dystrophic muscles Genes & Development 28: 841 857 |
33 | Liu DZ, Ander BP, Tian Y, Stamova B, Jickling GC, Davis RR (2012) Integrated analysis of mRNA and microRNA expression in mature neurons, neural progenitor cells and neuroblastoma cells Gene 495: 120 127 |
34 | Bartel DP (2009) MicroRNAs: Target recognition and regulatory functions Cell 136: 215 233 |
35 | Lee JS, Kim JM, Lim KS, Hong JS, Hong KC, Lee YS (2013) Effects of polymorphisms in the porcine microRNA MIR206 / MIR133B cluster on muscle fiber and meat quality traits Animal genetics 44: 101 106 |
36 | Clop A, Marcq F, Takeda H, Pirottin D, Tordoir X, Bibe B (2006) A mutation creating a potential illegitimate microRNA target site in the myostatin gene affects muscularity in shee Nature Genetics 38: 813 818 |
37 | Jakymiw A, Pauley KM, Li S, Ikeda K, Lian S, Eystathioy T (2007) The role of GW/P-bodies in RNA processing and silencing Journal of Cell Science 120: 1317 1323 |
38 | Wu L, Fan J, Belasco JG (2006) MicroRNAs direct rapid deadenylation of mRNA Proceedings of the National Academy of Sciences of the United States of America 103: 4034 4039 |
39 | Lim LP, Lau NC, Garrett-Engele P, Grimson A, Schelter JM, Castle J (2005) Microarray analysis shows that some microRNAs downregulate large numbers of target mRNAs Nature 433: 769 773 |
40 | Li LC, Okino ST, Zhao H, Pookot D, Place RF, Urakami S (2006) Small dsRNAs induce transcriptional activation in human cells Proceedings of the National Academy of Sciences of the United States of America 103: 17337 17342 |
41 | Mao Q, Li Y, Zheng X, Yang K, Shen H, Qin J (2008) Up-regulation of E-cadherin by small activating RNA inhibits cell invasion and migration in human bladder cancer cells Biochemical and Biophysical Research Communications 375: 566 570 |
42 | Suzuki K, Kelleher AD (2009) Transcriptional regulation by promoter targeted RNAs Curr Top Med Chem 9: 1079 1087 |
43 | Place RF, Li LC, Pookot D, Noonan EJ, Dahiya R (2008) MicroRNA-373 induces expression of genes with complementary promoter sequences Proceedings of the National Academy of Sciences of the United States of America 105: 1608 1613 |
Figures and Tables
Fig.1
Hierarchical clustering of 101 mRNAs (FDR <0.05, fold change > |1.2|) that were differentially expressed in the comparison of DMD-YpreTx (n = 49) and CTRL-Y (n = 28). Statistical differences were determined using unpaired t-test. Red = up-regulation; white = no change; blue = down-regulation.
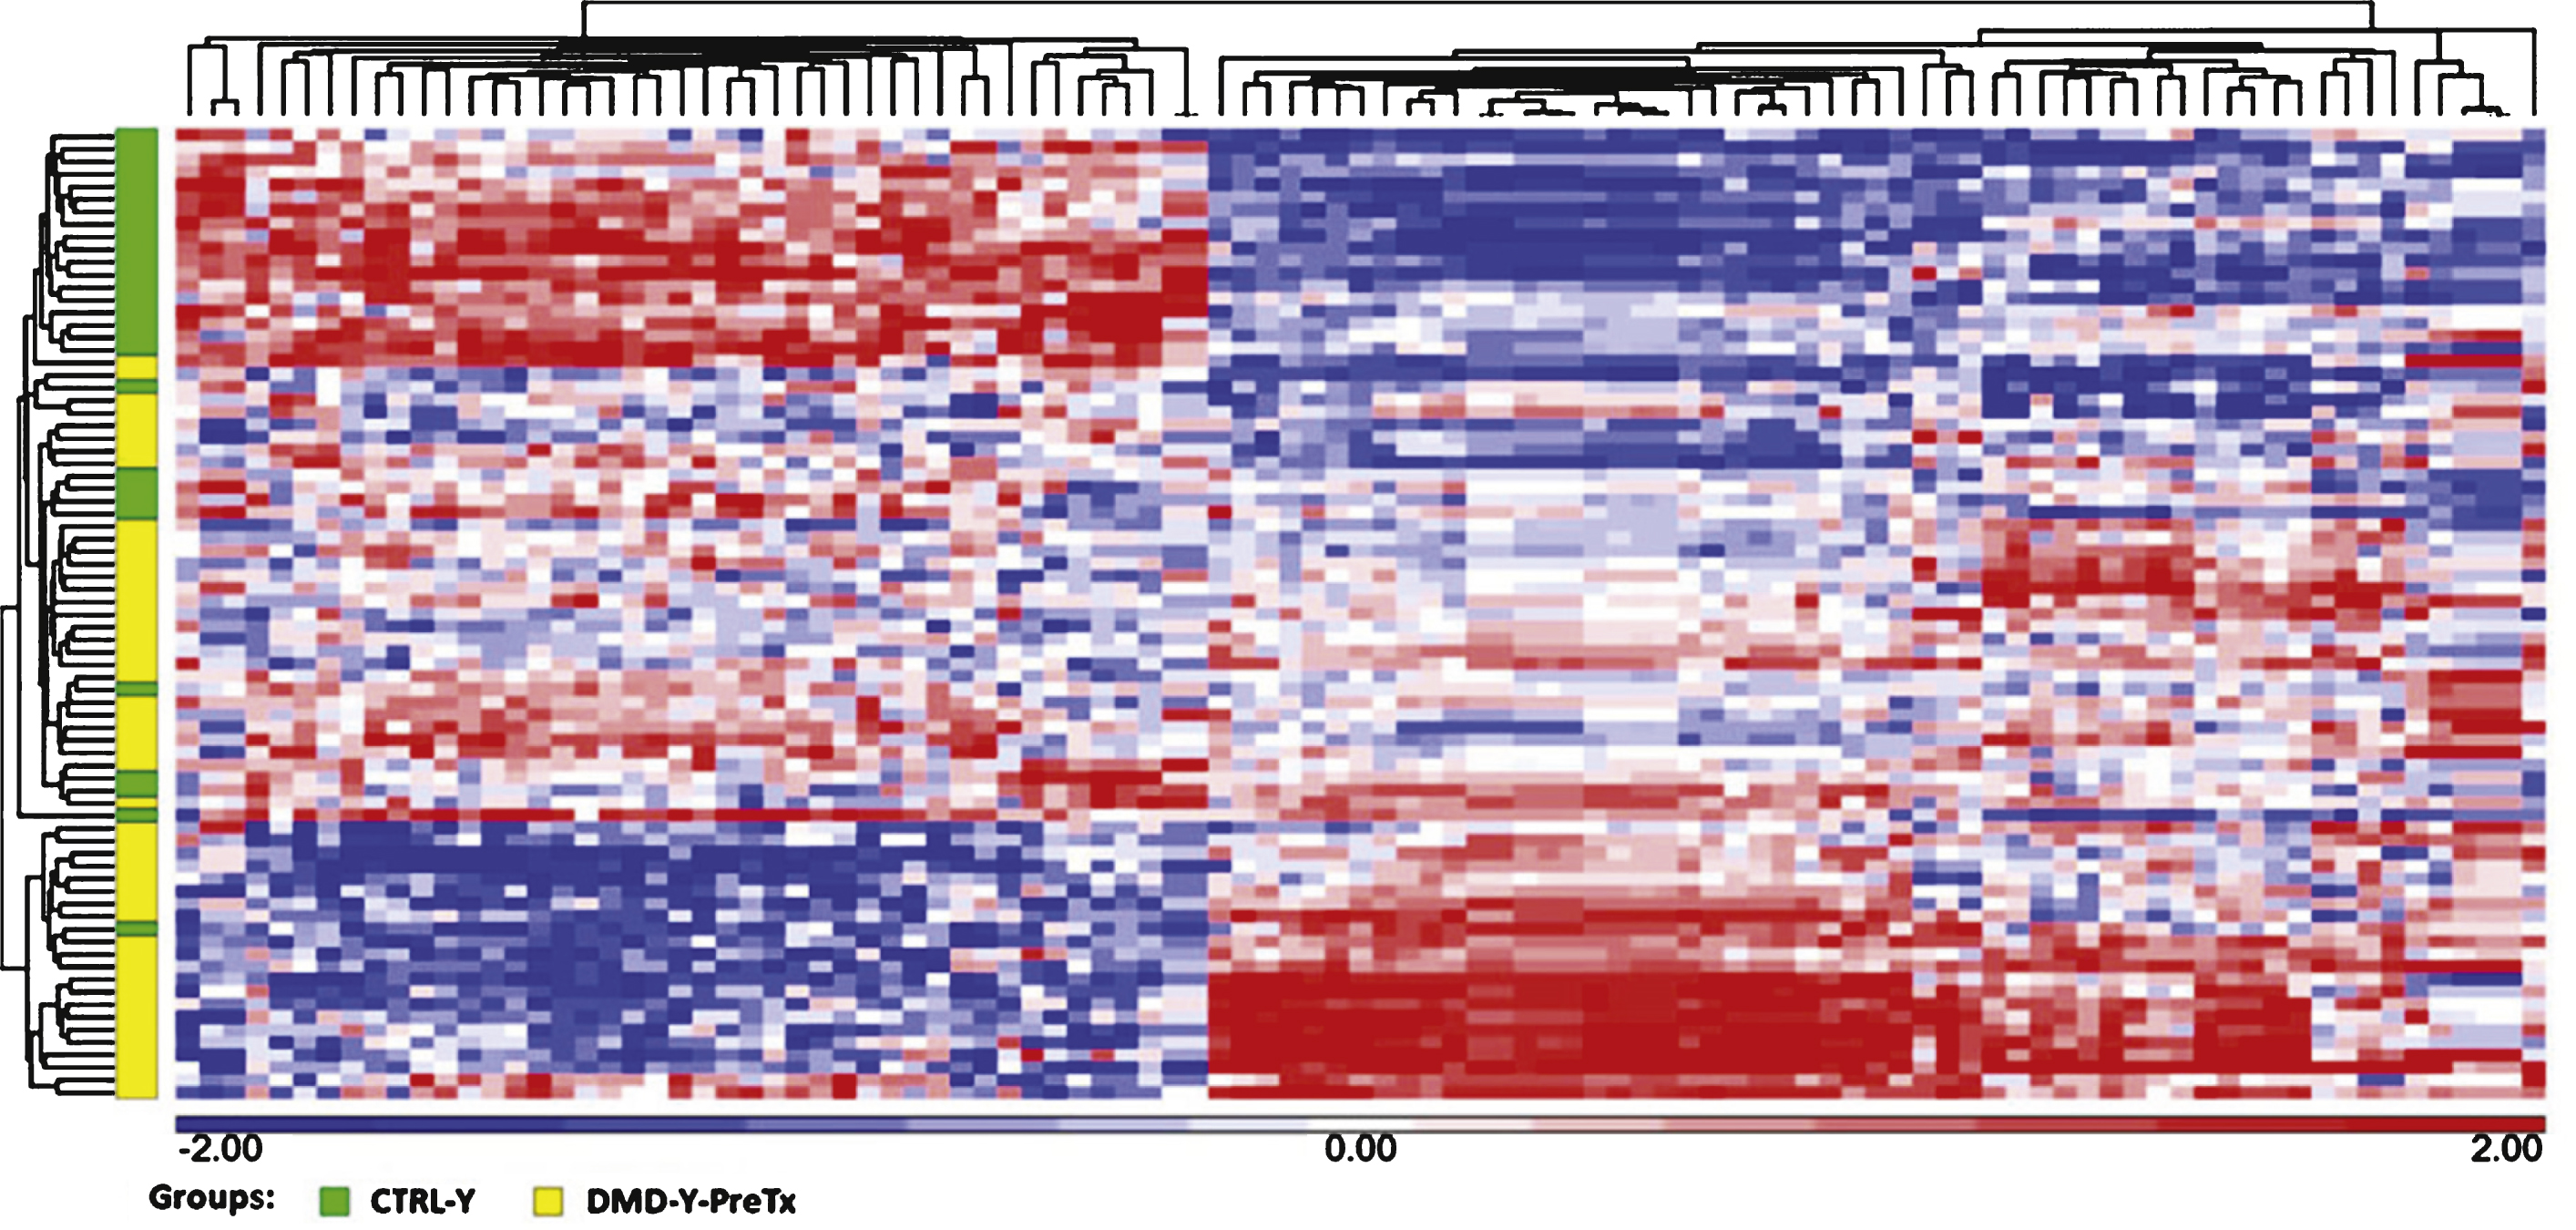
Fig.2
Steroid treatment reversed expression patterns of several miRNAs (miR-206, miR-181a, miR-4538, miR-4539, miR-606, and miR-454) that were altered in young DMD patients as compared to young healthy controls ( *P < 0.05 vs. CTRL-Y; # P < 0.05 vs.DMD-YpreTx).
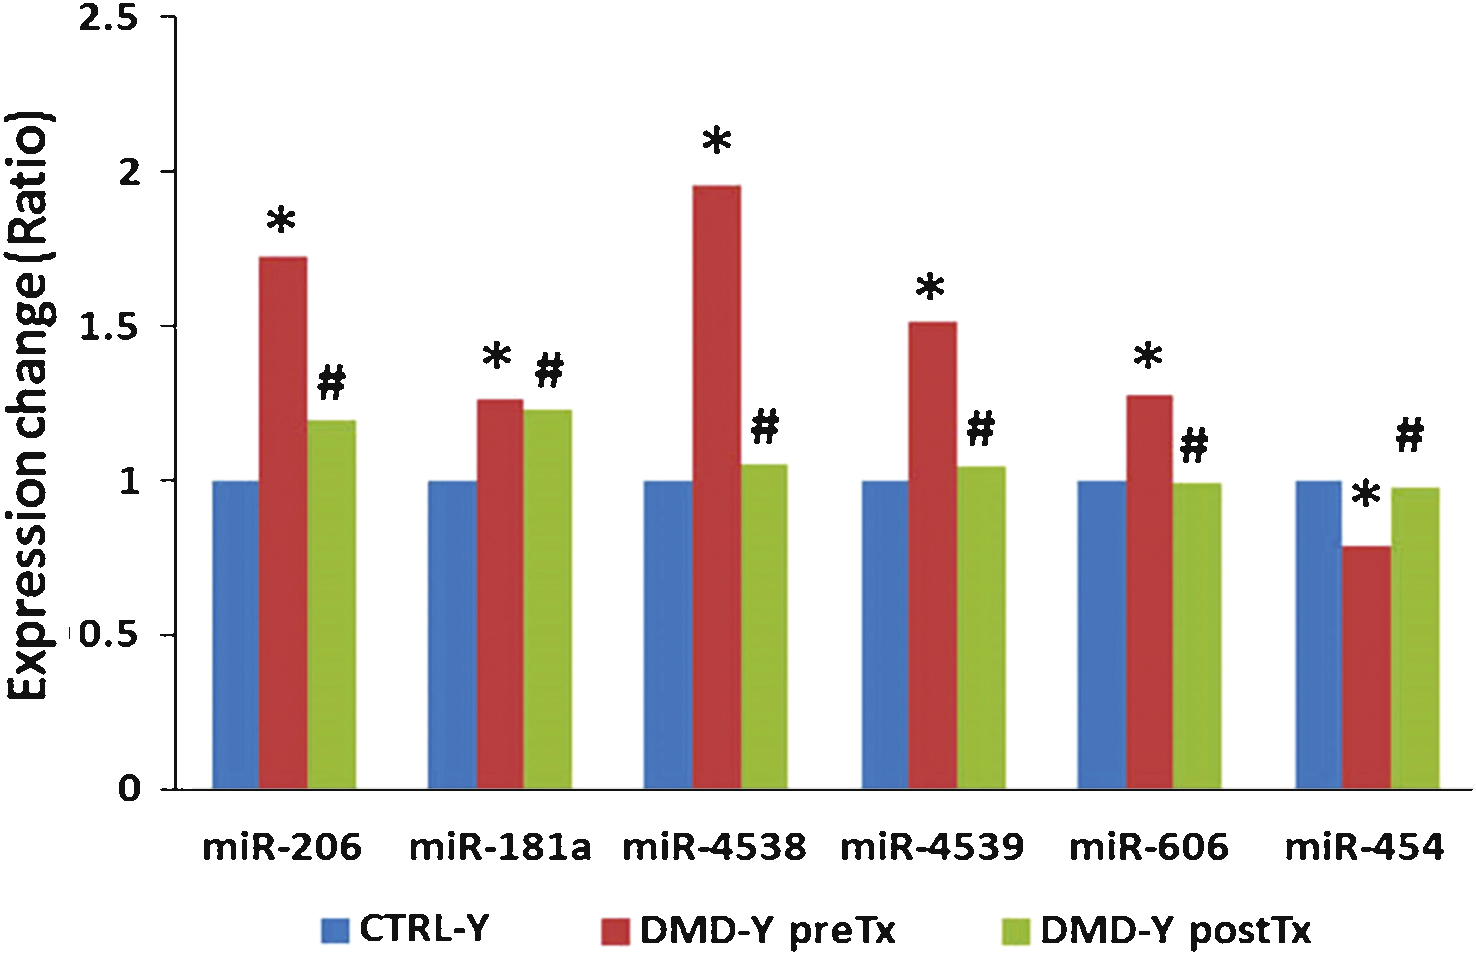
Fig.3
Integrated mRNA-miRNA functional analysis showing the network between under-expressed mRNAs and over-expressed miRNAs in DMD-YpreTx as compared to CTRL-Y, and associated functions (such as locomotion) of the mRNAs-miRNAs network.
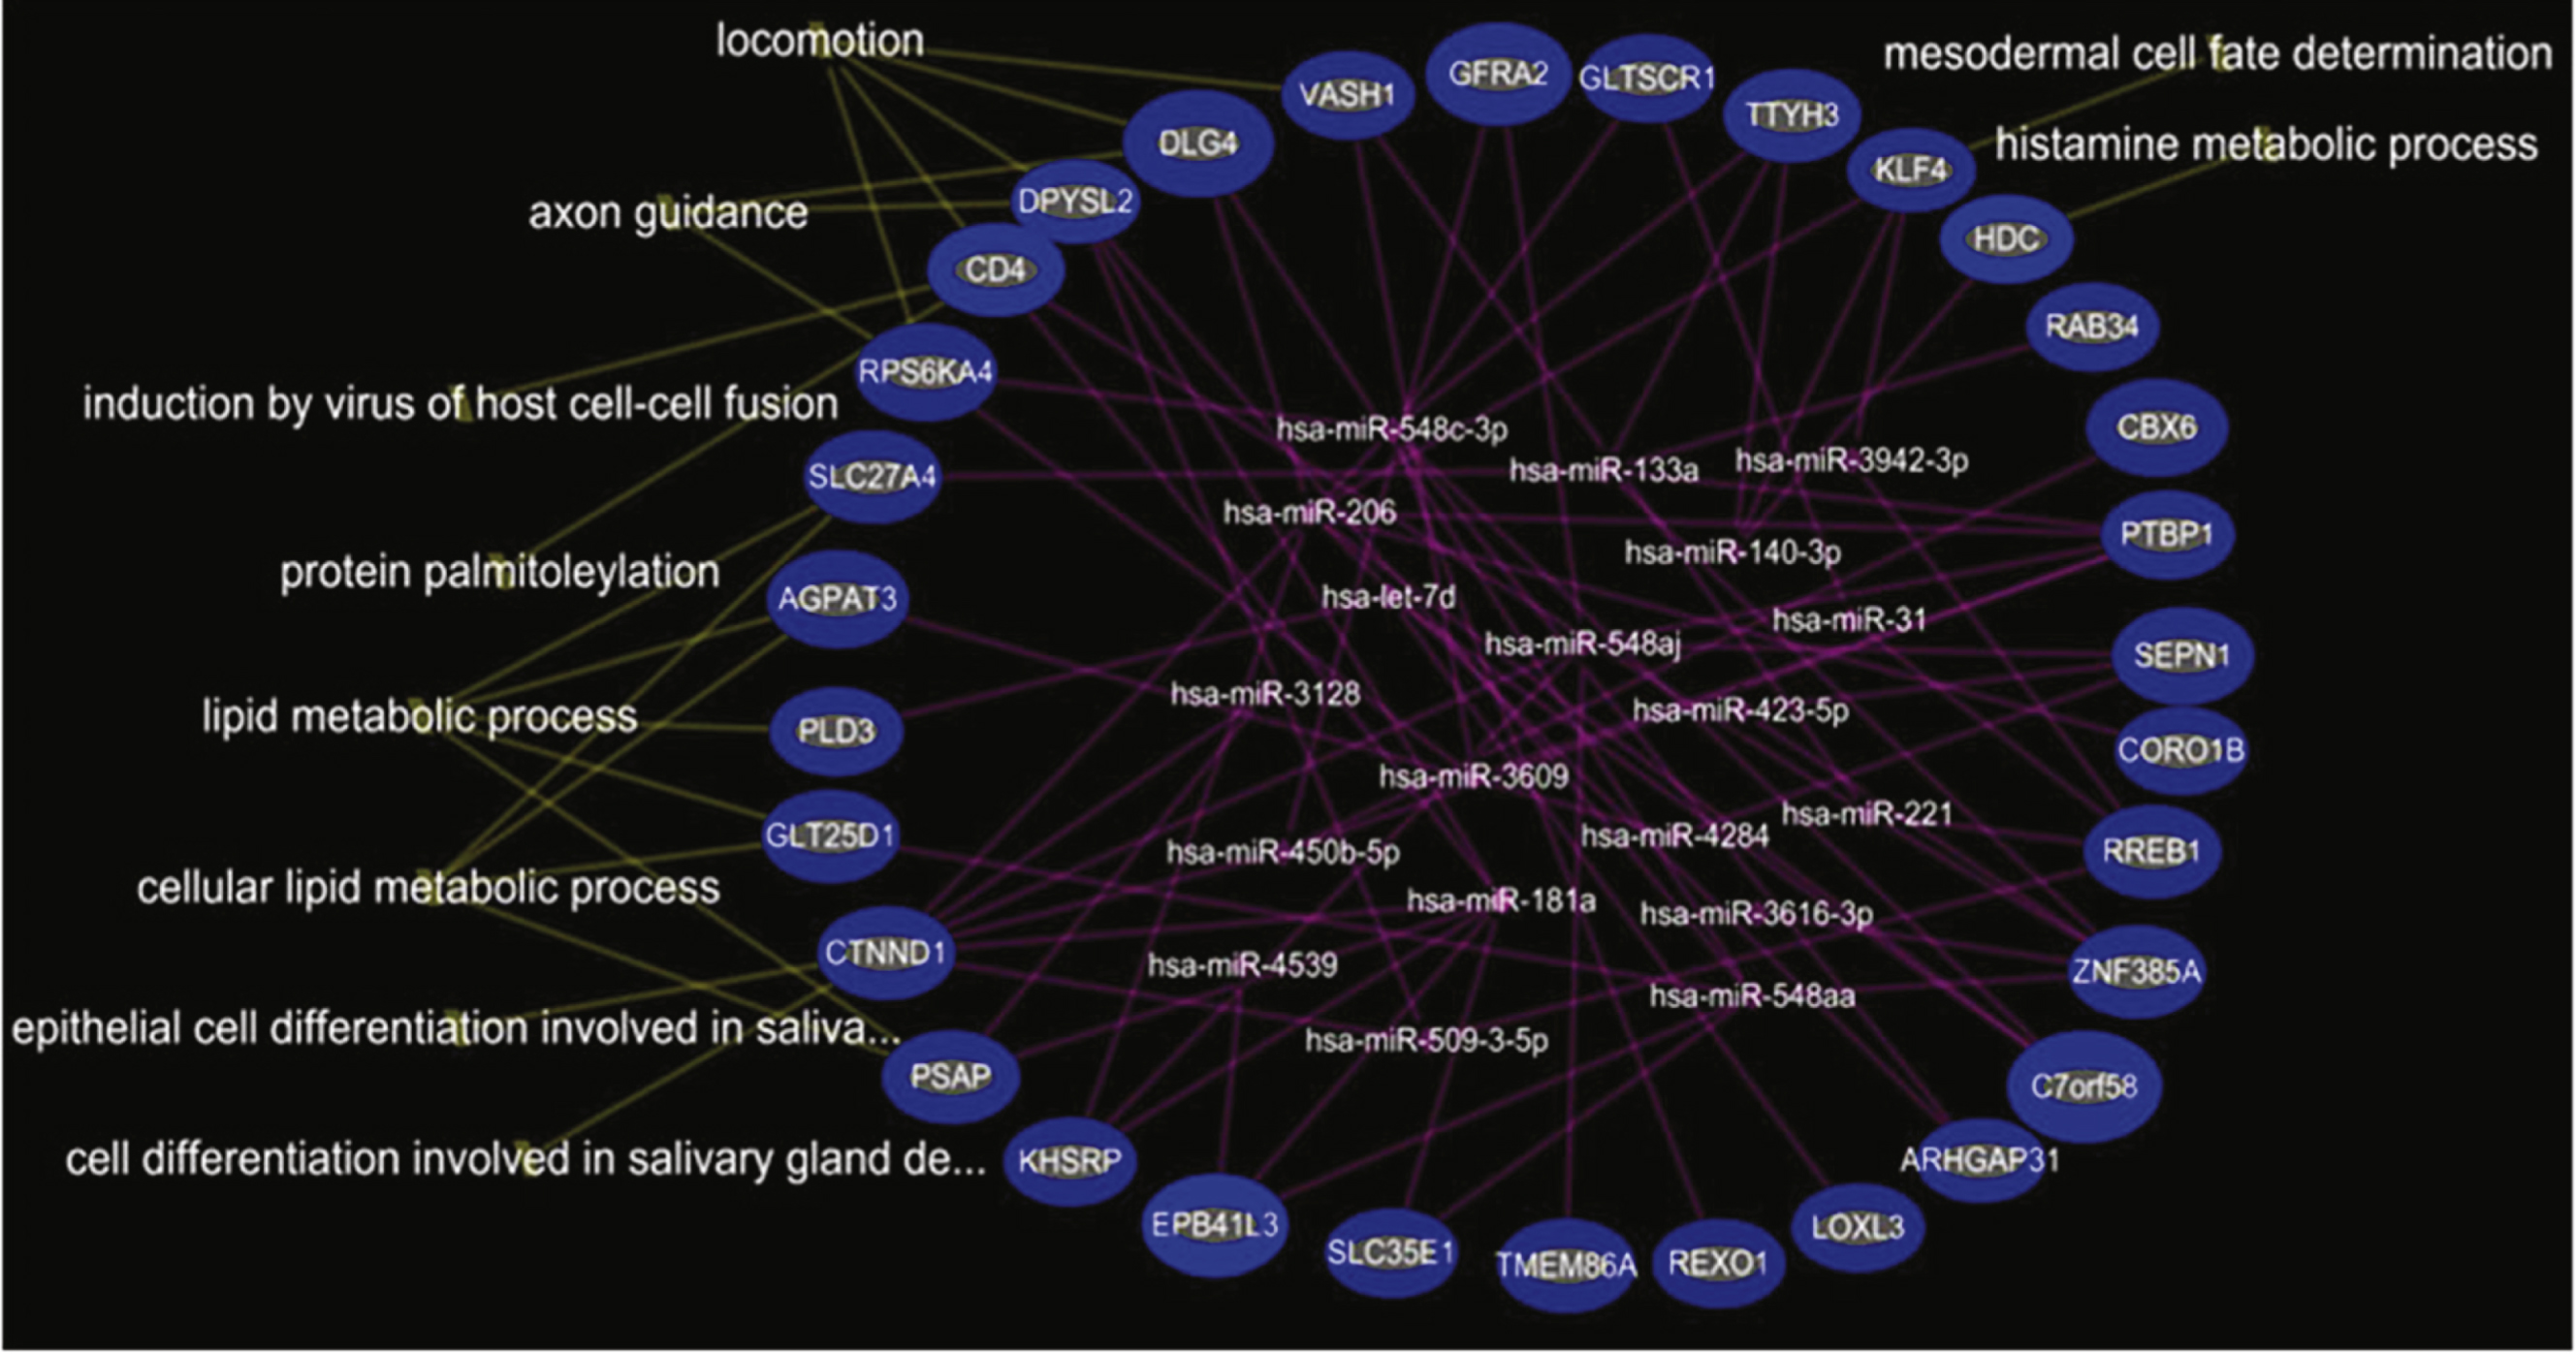
Fig.4
Integrated mRNA-miRNA functional analysis showing the network between under-expressed mRNAs and over-expressed miRNAs in DMD-YpostTx as compared to DMD-YpreTx, and associated functions (such as muscle organ development) of the mRNAs-miRNAs network.
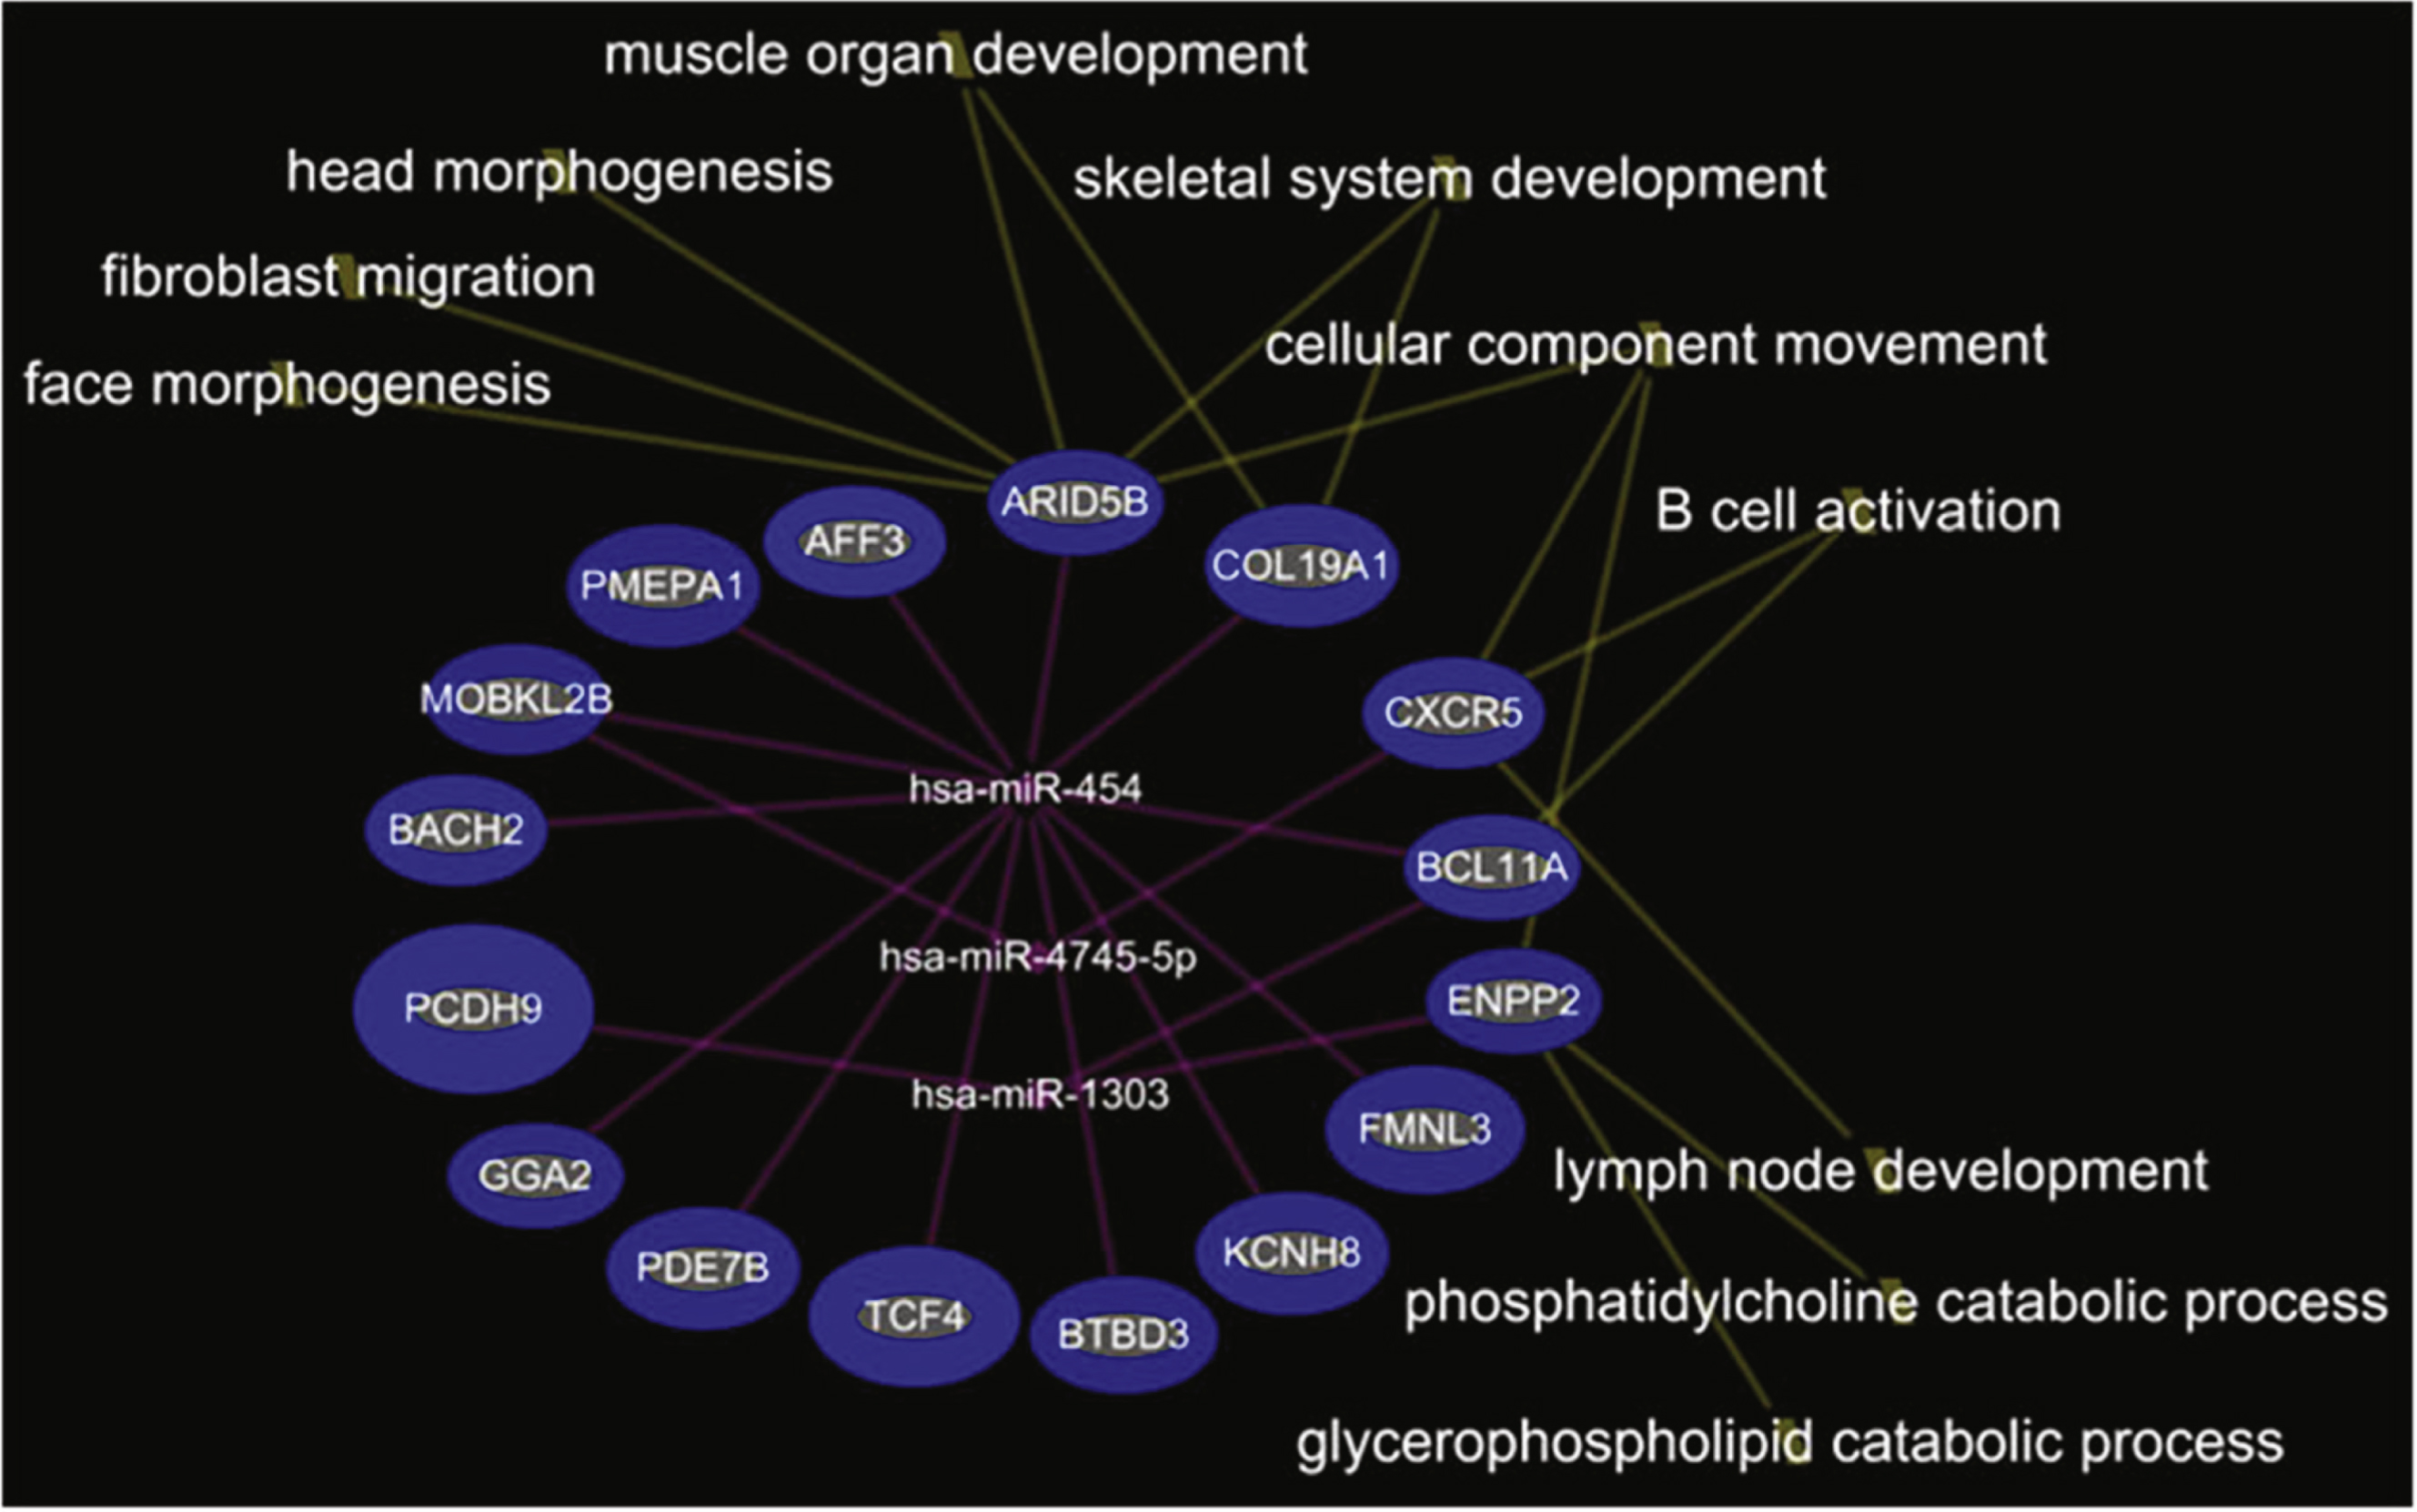
Fig.5
Integrated mRNA-miRNA functional analysis showing the network between over-expressed mRNAs and under-expressed miRNAs in DMD-YpostTx as compared to DMD-YpreTx, and associated functions (such as regulation of glucose metabolism) of the mRNAs-miRNAs network.
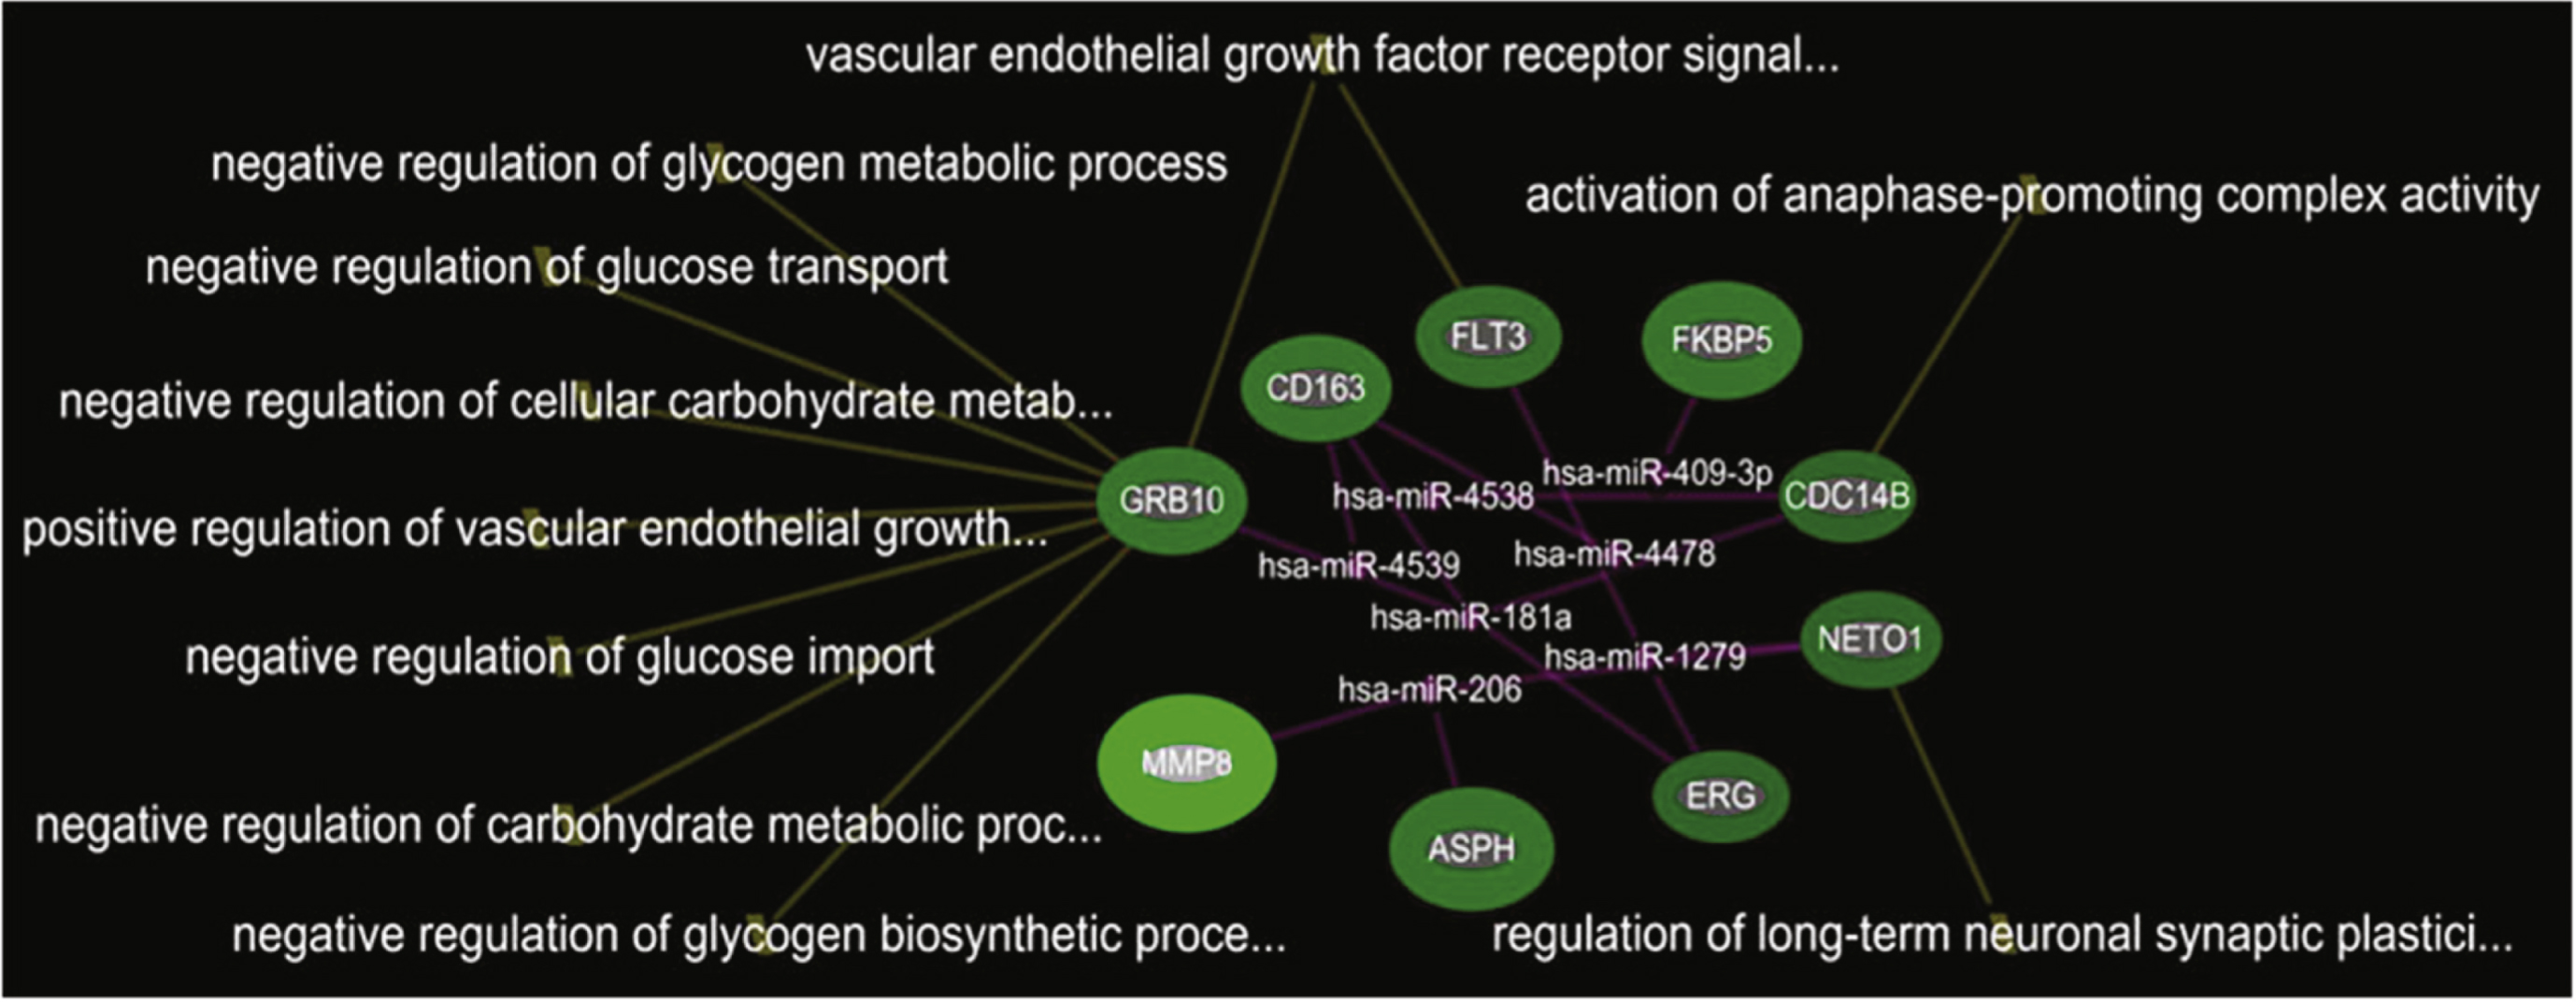
Table 1
Summary patient characteristics data
| Cohorts | Young DMD patients pre-and post-steroid | Older DMD patients steroid naïve | Young healthy controls | Older healthy controls |
| N of subjects | 49 | 17 | 28 | 18 |
| N of samples | 98 | 17 | 28 | 18 |
| Mean age at enrollment | 5.41 ± 1.55 | 16.33 ± 2.45 | 6.61 ± 1.93 | 15.95 ± 3.25 |
| Age range at enrollment | 3.16–9.65 | 12.14–19.95 | 3.19–9.16 | 11.96–20.76 |
| Mean age at 2nd blood collection | 6.15 ± 1.55 | N/A | N/A | N/A |
| Mean time period between 2 blood collections | 0.74 ± 0.26 | N/A | N/A | N/A |
| Mean time period b/t 2nd blood draw and steroid initiation | 0.57 ± 0.12 | N/A | N/A | N/A |
| Mean CK at enrollment | 24788 ± 11081 (n = 49) | 1368 ± 829 (n = 16 *) | 142 ± 75 (n = 27) | 160 ± 106 (n = 17) |
| Mean CK at 2nd blood collection | 14717 ± 7555 (n = 47) | N/A | N/A | N/A |
| BMI at enrollment | 16.69 ± 1.49 (n = 48) | 20.47 ± 7.70 (n = 15) | ||
| BMI at 2nd blood collection | 17.1 ± 1.99 | |||
| Gowers at enrollment (seconds) | 2.63 ± 1.19 | |||
| (range 1.2–7.9) | ||||
| Gowers at 2nd blood collection (seconds) | 1.95 ± 0.68 | |||
| (range 1.2–5) | ||||
| 30-feet run at enrollment (seconds) | 5.32 ± 1.32 | |||
| (range 3.16–10.41) | ||||
| 30-feet run at 2nd blood collection | 4.29 ± 0.76 (n = 48 | |||
| range 3.1–5.9) |
*One patient with erroneous CK data excluded.
Table 2
Changes in BMI, CK, Gowers and 30 ft Run at 6 month post-steroid treatment in DMD-Y group
| Post – Pre (Mean ± SD) | Direction | p-value | ||
| Paired T | Signed Rank | |||
| BMI | 0.41 ± 1.09 | Post>Pre | 0.0132 | 0.0322 |
| CK | –9849 ± 10054 | Post<Pre | <0.0001 | <0.0001 |
| Gowers (s) | –0.68 ± 0.72 | Post<Pre | <0.0001 | <0.0001 |
| 30 ft Run (s) | –1.01 ± 0.92 | Post<Pre | <0.0001 | <0.0001 |


