
Functional Characterization of a Central Core Disease RyR1 Mutation (p.Y4864H) Associated with Quantitative Defect in RyR1 Protein
Abstract
Background:
Central Core Disease (CCD) is a congenital myopathy often resulting from a mutation in RYR1 gene. Mutations in RyR1 can increase or decrease channel activity, or induce a reduction in the amount of protein. The consequences of a single mutation are sometimes multiple and the analysis of the functional effects is complex.
Objective:
The consequences of the p.Y4864H mutation identified in a CCD patient have been studied regarding both RyR1 function and amount.
Methods:
The amount of RyR1 in human and mouse muscles was evaluated using qRT-PCR and quantitative Western blot, and calcium release was studied using calcium imaging on primary cultures. The results were compared between human and mouse.
Results:
The p.Y4864H mutation induced an alteration of calcium release, and in addition was associated to a reduction in the amount of RyR1 in the patient’s muscle. This suggests two possible pathophysiological mechanisms: the alteration of calcium release could result from a modification of the channel properties of RyR1 or from a RyR1 reduction. In order to discriminate between the two hypotheses, we used the heterozygous RyR1 knockout (RyR1+/–) mouse model showing a comparable RyR1 protein reduction. No reduction in calcium release was observed in primary muscle culture from these mice, and no muscle weakness was measured.
Conclusions:
Because the reduction in the amount of RyR1 protein has no functional consequences in the murine model, the muscle weakness observed in the patient is most likely the result of a modification of the calcium channel function of RyR1 due to the p.Y4864H mutation.
ABBREVIATIONS
CCD | central core disease |
CmC | 4-chloro-m-cresol |
CTRL | control |
He | heterozygous |
KO | knockout |
MH | Malignant Hyperthermia |
MHN | MH Negative |
MHS | MH Susceptible |
RyR | ryanodine receptor |
SERCA | SarcoEndoplasmic reticulum Ca2+-ATPase |
SR | Sarcoplasmic reticulum |
INTRODUCTION
The sarcoplasmic reticulum (SR) calcium channel ryanodine receptor RyR1 is encoded by the RYR1 gene (MIM#180901). In association with the voltage gated calcium channel dihydropyridine receptor (DHPR) and numerous regulating proteins, they form the skeletal muscle calcium release complex responsible for the excitation-contraction coupling process in skeletal muscle [1].
Mutations in the RYR1 gene have been associated with congenital myopathies such as Central Core Disease (CCD; OMIM#117000) [2–4] and Multiminicore Disease (MmD; OMIM# 255320) [5–7]. CCD has been named after anatomo-pathological muscle analysis, and is characterized by the presence of cores in type 1 muscle fibers, which are large areas of abnormal myofibrillar architecture with sarcomeric disorganization and absence of mitochondria [2, 8]. CCD presents either an autosomal dominant or a recessive transmission pattern. Clinical presentations are heterogeneous ranging from mild phenotype, with moderate hypotonia during early childhood, delayed motor abilities, and slowly progressive proximal muscle weakness, to severe phenotype, including fetal akinesia, respiratory insufficiency at birth and generalized muscle weakness [9, 10].
Dominantly inherited RYR1 mutations have been extensively studied to identify the pathophysiological mechanism. Two mechanisms have been proposed so far: either a gain of function of RyR1 (hyperactivity) leading to a calcium leak or a loss of RyR1 function with impaired calcium conductance [11–14].
It has been observed that recessive mutations in RYR1 can also result in a reduction in the amount of protein [15, 16], which leads to muscle weakness and altered calcium release [17]. In the present work, we studied the pathological mechanisms leading to a moderate CCD in which a missense dominant mutation in RyR1 was associated with a 25% decrease in the amount of protein. Until now the effect of such a RyR1 reduction has never been explored. Using an animal model presenting with a similar reduction in the amount of RyR1, we showed no alteration of muscle calcium release or of muscle strength. We concluded that the consequence of this RyR1 mutation in the patient’s muscle was not related to the reduction in the amount of protein, but rather to the direct effect of the mutation on the channel function. These results provide new insights into the pathogenesis of RYR1-related myopathies with RyR1 deficiency.
Materials and Methods
Ethics statement
Investigations on patient material were performed after signature of an informed consent according to the French regulation and have received approval from the local ethical committee (Comité de Protection des Personnes-Sud-Est, France). All procedures using animals were approved by the Institutional Ethics Committee and followed the guidelines of the National Research Council Guide for the care and use of laboratory animals.
Muscle biopsy and IVCT
Part of the muscle biopsy realized in vastus lateralis has been directly processed for in vitro contracture test (IVCT) according to the European Malignant Hyperthermia Group Guidelines (http://www.emhg.org/emhg/mh-diagnosis/). Another part was used for cell culture and Western blot, and the remaining muscle was frozen in liquid nitrogen cooled isopentane for histological and mRNA analyses.
Molecular genetic studies
RYR1 mutations screening was performed using cDNA obtained after reverse transcription of total RNA extracted from muscle biopsy as previously described [2]. The cDNA was amplified in overlapping fragments. Sequencing reactions were analyzed on an ABI 3130 DNA Analyzer (Life Technologies, Saint Aubin, France). The presence of the mutation identified in the transcript was confirmed in genomic DNA by direct sequencing of the corresponding exon and intron-exon junctions.
Mouse lines
RyR1 knock out mice (RyR1–/–), heterozygous mice (RyR1+/–) and wild type (RyR1+/+) were obtained by crossing heterozygous Ryr1tm1Alle mice (http://www.informatics.jax.org/allele/key/637575). In this mouse line, the insertion of a neomycin selection cassette in the KPN site at nt840 in exon10 of the RYR1 gene leads to disruption of gene expression [27].
Mouse muscle homogenate preparation
Skeletal muscles were collected from the hind limbs of adult (6-7 months old) male mice. Crude homogenates were prepared by homogenization in 200 mM sucrose, 20 mM HEPES (pH 7.4), 0.4 mM CaCl2, 200 μM phenylmethylsulfonyl fluoride, 1 mM diisopropyl fluorophosphate, as described previously [18]. Protein concentration was measured using a modified Folin assay in presence of SDS.
Quantitative western blot analysis
The amount of RyR1 present in muscle samples (20–40 μg of muscle homogenate) was determined by quantitative Western blot analysis using antibodies directed against RyR1 [19] and normalized to the amount of myosin heavy chain as described previously [16]. Briefly, after electrophoretic separation on a 5–15% gradient acrylamide gel and electrotransfer to Immobilon P (Biorad, Marnes la Coquette, France) during 4h at 0.8A to ensure a complete transfer of the loaded proteins, the membrane was incubated with anti-RyR1 antibodies and then HRP-labelled secondary antibodies. Variation in protein loading or in muscle protein content due to heterogeneity of the sample, e.g. muscle fibrosis, was evaluated as the amount of myosin in each lane determined by Coomassie staining of the Immobilon membrane after immunorevelation (measured as the surface of the myosin band). The total amount of RyR1 in each experiment (total signal on the two or three bands) was thus corrected from the amount of myosin and normalized to the amount of RyR1 present in the control referred as 100% . Quantification was also performed using anti-desmin antibody (Dakocytomation, Les Ulis, France) for normalization compared to the amount of desmin, and similar results were obtained. Signal quantification was performed using a ChemiDoc XRS apparatus (Biorad, Marnes la Coquette, France) and the Quantity One software (Biorad).
q RT-PCR
Human muscle
Total RNA was extracted from frozen muscle biopsy using TRIzol reagent (Life Technologies, Saint Aubin, France) as previously described [16]. First strand cDNA synthesis from 500ng total RNA was realized using random priming with the High Capacity cDNA Reverse Transcription kit (Life Technologies, Saint Aubin, France). Real time quantification of mRNAs of target gene RYR1 and of reference genes (hRPL27 and ACTB) was performed with Power SYBR Green PCR Master Mix (Life Technologies, Saint Aubin, France) using a STEPONEPLUS (Life Technologies, Saint Aubin, France) detection system. The following primers were used (5′→3′): RYR1_pcr1 forward: CAT GGC TTC GAG ACT CAC AC, RYR1_pcr1 reverse: CTC CTG ACC CGT GTG TTC T, RYR1_pcr2 forward: GAC TCA CAC GCT GGA GGA G, RYR1_pcr2 reverse: TCC AGA CAT AAG ACT CCT GAC C, ACTB forward: CTC CTG AGC GCA AGT ACT CC, ACTB reverse: TGT TTT CTG CGC AAG TTA GG, hRPL27 forward: CGC AAA GCT GTC ATC GTG, hRPL27 reverse: GTC ACT TTG CGG GGG TAG. The following experimental protocol was used: denaturation 95°C for 10 min and 40 cycles of 95°C for 15 sec and 60°C for 60 sec. Melting curve analysis showed specific melting temperatures.
Mouse muscle
Total RNA from skeletal muscle (tibialis anterior) of 2-month-old WT (RyR1+/+) and heterozygous (RyR1+/–) mice (3 animals in each group) was extracted using TRIzol reagent (Life Technologies, Saint Aubin, France) and PureLink RNA Mini Kit (Life Technologies, Saint Aubin, France). First strand cDNA was obtained using oligo(dT) primed reverse transcription from 500ng of RNA. Real time quantification of mRNAs of target gene RYR1 and of reference gene (GAPDH) was performed by iQ SYBR Green supermix (BioRad, Marnes la Coquette, France) using an IQ iCycler (BioRad, Marnes la Coquette, France) detection system. The following primers were used (5′→3′): RYR1, forward - ATG ACC GTA GGG CTC CTG GCC GTA G, reverse - GGG TCC TCG ATC TCG TCC CCG A; GAPDH forward - GTA TGA CTC CAC TCA CGG CAA A, reverse - TTC CCA TTC TCG GCC TTG. The following experimental protocol was used: denaturation 95°C for 3 min and 40 cycles of 95°C for 10 sec and 55°C for 45 sec. Melting curve analysis showed specific melting temperatures.
Data were analyzed with the comparative threshold cycle (Ct) relative-quantification method. Relative gene expression was quantified as follows: fold change = 2− Δ (ΔCt) where ΔCt = Cttarget − Ctreference and Δ (ΔCt) = ΔCtsample − ΔCtcontrol. Ct is the fractional cycle number at which the fluorescence passes the fixed threshold. The target gene represents RYR1 gene, reference genes are the hRPL27 and ACTB gene in human and the GAPDH gene in mouse, “sample” refers to patient or heterozygous mice and “control” to control human or wild type mice.
Production of human and mouse primary cultures
Human satellite cells were produced from a muscle biopsy of a 25-year-old donor without neuromuscular disorder (CTRL cells) and from the biopsy of the patient (Y4864H cells). These cells were immortalized and cloned as previously described [20, 21]. Primary cultures of skeletal muscle from WT, RyR1+/– and RyR1–/– E19 mouse embryos were produced as described previously [22].
Cell culture
Immortalized human satellite cells or mouse satellite cells were amplified in proliferation medium composed of Ham’s F-10 (Life technologies, Saint Aubin, France) supplemented with 20% FBS (Life technologies, Saint Aubin, France), 2% Ultroser G (Pall Biosepra, St Germain en Laye, France) and 2% Penicillin-Streptomycin (Life technologies, Saint Aubin, France). Differentiation into myotubes was induced by a shift to differentiation medium: DMEM (Life technologies, Saint Aubin, France) supplemented with 2% Heat Inactivated Horse Serum (Life technologies) and 1% Penicillin-Streptomycin. Human myotubes were cultured for seven to eight days and mouse myotubes for two to three days before intracellular calcium measurements.
Intracellular calcium measurements
Changes in intracellular calcium were evaluated using the calcium-dependent fluorescent dye Fluo-4 AM (Life Technologies, Saint Aubin, France), as described previously [23]. Calcium imaging was performed in Krebs buffer (136 mM NaCl, 5 mM KCl, 2 mM CaCl2, 1 mM MgCl2, 10 mM HEPES, pH 7.4, 6 mM D-Glucose). To obtain a calcium-free Krebs solution, CaCl2 was left out, while 1mM EGTA, 10 μM La3 +, and 50 μM Cd2+ were added. Thapsigargin (Life technologies, Saint Aubin, France) was diluted at 1 μM in this medium and applied simultaneously with caffeine (40 mM) as described previously [24, 25]. 4-chloro-m-cresol (4-CmC) (Sigma-Aldrich) was diluted at 500 μM in Krebs buffer and 140 mM KCl solution was prepared in 2 mM CaCl2, 1 mM MgCl2, 10 mM HEPES, pH 7.4 and 6 mM D-Glucose. Fluorescence was measured by confocal laser scanning microscopy using a Leica TCS-SPE microscope in the xyt mode. Changes in intracellular Ca2+ concentrations were presented as the ratio of fluorescence intensities with respect to the initial fluorescence intensity prior to drug addition (ΔF/F0). Data are given as mean ± SEM, and n represents the number of myotubes studied in each condition.
Evaluation of muscle strength
Muscle strength was evaluated in patients using manual muscle testing according to the Medical Research Council scale [26]. Muscle strength was evaluated in mice using a hang test as described previously [18]. Two months old male mice were positioned on a cross-wired surface turned upside down, and time before fall (up to 300 s) was measured.
Statistical analysis
Data were pooled over animals or cells within the same group and are presented as means ± SEM. Differences between CTRL and Y4864H cells were assessed using Student’s t-test. Differences between WT, RyR1+/– (He) cells, and RyR1–/– (KO) cells were assessed using Student’s t-test with Bonferroni correction for multiple comparison, and GraphPad Prism 6 software, assuming significance at p < 0.05.
RESULTS
Clinical and genetic reports
The proband (Figs. 1A, III:3) was a 28-year-old female who presented with a moderate muscle weakness since childhood, a slightly delayed motor development and a stable axial muscle deficiency. Muscle strength evaluation showed no distal deficiency, no reduction in cervical or hamstring muscles strength, a slight reduction in pectoralis major and deltoid muscles strength (level evaluated at 4/5), and a marked reduction in abdominal muscles strength (level evaluated at 2/5). Creatine kinase (CK) levels were normal (75 U/L, Table 1, III:3). A muscle biopsy demonstrated the presence of central cores using NADH staining and an in vitro contracture test (IVCT) indicated susceptibility to Malignant Hyperthermia (MHS) (Table 1, III:3) because of hypersensitivity of RyR1 to both caffeine and halotane. The genetic analysis performed on the mRNA extracted from the muscle biopsy identified the c.14590T>C; p.Tyr4864His variation at heterozygous state in the RYR1 gene, resulting in the substitution of the tyrosine in position 4864 by a histidine (p.Y4864H) in the RyR1 protein. A diagnosis of CCD was proposed.
The proband’s father (Figs. 1A, II:2) presented with a late onset moderate muscle weakness, and did not report any muscle weakness during childhood and adolescence. A clinical examination at age 60 demonstrated a mild quadriceps amyotrophy, right scapular winging and scoliosis. Muscle strength evaluation indicated a slight reduction in biceps, pectoralis major and hamstring muscles strength (evaluated at 4/5), and an important axial deficiency (abdominal muscles 2/5, cervical muscles 3/5). His CK levels were normal (168 U/L, Table 1, II:2). Muscle biopsy displayed an aspect of congenital myopathy with the presence of atypical cores using NADH staining. He was also diagnosed as being susceptible to Malignant Hyperthermia (MHS) by IVCT (Table 1, II:2), and a genetic analysis confirmed that he was carrying the same RYR1 heterozygous variant c. 14590T>C; p.Tyr4864His as his daughter.
The patient’s uncle (II:1) who was tested MH Negative (MHN) by IVCT did not present with any clinical sign of myopathy and did not have the variant (Fig. 1A and Table 1). Therefore, the two individuals of the family carrying the p.Y4864H mutation were affected by a moderate CCD associated to MH, suggesting a dominant transmission.
Using quantitative RT-PCR, the amount of RYR1 transcripts in the muscle of the proband (III.3) was evaluated at 52.6% ± 3.2% of the control muscle (Fig. 1B), pointing to either the absence of transcript produced from one of the two RYR1 alleles or a reduction in both transcripts. The presence of the c.14590T>C variation at a heterozygous state in the mRNA transcripts detected by Sanger sequencing, suggested that most probably both transcripts were reduced. High Resolution Melting (HMR) analysis on cDNA of the patient confirmed that 2 transcripts were present in equivalent amount when amplifying a region encompassing the c.14590 position (data not shown). No other variation in the RyR1 mRNA was found to explain the global transcript reduction.
Using quantitative Western blot, we determined that the amount of RyR1 present in the muscle of the proband (Ind. III.3) was 75.3 ± 6.4% (n = 7) of the amount of RyR1 in a control muscle from a 25 years old female patient without any muscle disease (Fig. 1B). To confirm that the amount of RyR1 in age-related control biopsies do not present similar variation and to validate our quantitative Western blot analysis, a quantitative Western blot was performed on four different 20–23 years-old non affected women, with normal physical activity (Fig. 1C). The quantification of the amount of RyR1 compared to desmin in 11 blots performed from these 4 controls result in a relative amount of RyR1 of 100% ± 6.3% .
Consequences of the mutation
To determine the physiological effects of the mutation, primary cultures were produced from the muscle biopsy of the patient, and were immortalized by double retroviral transduction using telomerase and Cdk4 [20, 21]. Calcium imaging studies were performed on myotubes produced from the proband’s immortalized cells (Y4864H cells) or from immortalized cells of a volunteer of 25 years with no muscle disease (CTRL cells), to assess their ability to release calcium after stimulation (Fig. 2). In response to the membrane depolarization induced by addition of 140 mM KCl in presence of extracellular calcium, Ca2+ release was significantly reduced in Y4864H myotubes (Fig. 2A, white circles) compared to CTRL (Fig. 2A, black circles) (p < 0.0001). Similarly calcium release induced by a direct stimulation of RyR1 by 4-CmC (Fig. 2B) was also significantly decreased (p < 0.0001). The amount of Ca2+ in the SR stores was evaluated after caffeine stimulation in presence of thapsigargin with or without extracellular calcium (Fig. 2C and D). In all cases, the maximal amplitude of calcium released was significantly reduced in Y4864H myotubes compared to CTRL myotubes (Fig. 2E, p < 0.0001). The area under the curve (Fig. 2F) reflecting the amount of calcium released was also significantly reduced except for the caffeine stimulation in presence of thapsigargin and extracellular calcium. The latter indicates that the reduction in the free SR calcium rapidly releasable upon stimulation could be compensated by an influx of external calcium (Fig. 2C).
These results could be explained either i) by a reduction in the amount of calcium stored due to the p.Y4864H mutation leading to a “leaky” RyR1 channel, as usually observed with MH mutations leading to RyR1 hypersensitivity or ii) by defects in the RyR1-DHPR coupling leading to impaired calcium conductance [11, 12], or iii) by the decreased quantity of RyR1 protein [17].
RyR1 expression in RyR1+/– heterozygous mice
So far, the effect on calcium release of a small RyR1 protein decrease such as the one measured for the patient has not been evaluated. To test this effect, we used cells from heterozygous mice of a RyR1 KO model [27]. Muscle homogenates were prepared from WT and heterozygous RyR1+/– mice to measure the amount of RyR1 transcript and protein. Only one allele of the RYR1 gene is expressed in RyR1+/– heterozygous mice, and we first confirmed using quantitative RT-PCR that the mRNA of RyR1 was reduced by about 50% compared to WT (42.6% ± 7% for RyR1+/– mice compared to 100% ± 4.8% for WT, n = 3) (Fig. 3C). Using quantitative Western blot, the amount of RyR1 at the protein level detected in RyR1+/– mice muscles was estimated to be 83.4 ± 2.6% of WT muscle (n = 9) (Fig. 3A and B).
These results showed that both the amount of RyR1 transcript and protein were decreased in RyR1+/– heterozygous mice compared to WT mice, although to a lesser extent at the protein level. The relative protein amount of RyR1 measured in the patient with the p.Y4864H mutation compared to control (75.3 ± 6.4% , n = 7) was not statistically different from the one found in RyR1+/– mice compared to WT mice (83.4 ± 2.6% , n = 9), and the relative amounts of transcript were also not different (52.6% ± 3.2% , n = 12 in the patient and 42.6% ± 7% , n = 3 in the mouse). In both case, the alteration in the amount of RyR1 at the protein level is milder than the 50% lowering of transcription. Therefore the RyR1+/– mouse line constitutes a good model to study the effect of such a RyR1 reduction.
Measure of muscle strength in RyR1+/– mice
To evaluate the overall muscle performance of RyR1+/– heterozygous mice, a hang test was performed. Two-month-old male mice were allowed to grip on a cross-wired surface placed upside down. Time spent hanging on the surface before fall was measured and no significant difference was observed between WT (182 ± 43 s; n = 7) and RyR1+/– (168 ± 36 s; n = 9) mice (supplementary data, Figure S1). This hang test thus showed that the decrease in RyR1 protein in RyR1+/– mice did not modify muscle strength.
Effect of RyR1 reduction on calcium fluxes
To check whether the decrease in the quantity of RyR1 protein in RyR1+/– mice induced defects on the calcium release, calcium imaging studies were performed on RyR1+/+ (WT), RyR1+/– (He) and RyR1–/– (KO) myotubes (Fig. 4). In agreement with some previous results [28] we observed that, compared to WT (Fig. 4A and B, black circles) and He myotubes (Fig. 4A and B, gray squares), the calcium release was greatly depressed in KO myotubes (Fig. 4A and B, white circle) whether it be after a membrane depolarization (140mM KCl) or after a direct RyR1 stimulation (500 μM 4-CmC). Both stimuli induced calcium release in WT myotubes (Fig. 4A and B, black circles) and He myotubes (Fig. 4A and B, gray squares). The amplitude of the peak in WT and He myotubes using RyR1 direct stimulation was similar (Fig. 4C). The peak was significantly increased in He compared to WT when KCl stimulation was used (Fig. 4C). These data demonstrated that the 16% decrease in RyR1 protein observed in He mice did not impair their ability to release calcium upon stimulation compared to the WT mice, consistent with the lack of muscle weakness observed during the hang test.
Discussion
Functional studies of common dominant RYR1 mutations associated with CCD have suggested two main mechanisms responsible for a disturbed function of the mutant RyR1 channel, namely either the presence of a leaky and hyperactive calcium channel associated with a reduction of SR calcium stores [13], or an “uncoupled” channel with reduced permeability of RyR1 to Ca2+ [29]. In the present situation, the p.Y4864H mutation resulted in the presence of a calcium channel with altered properties which is associated with a reduction of the protein amount. A 50% reduction in the RyR1 mRNA in the patient biopsy was also observed, but the mechanisms leading to in this reduction in the RyR1 mRNA was not identified. In vitro calcium imaging showed that with all the stimulations used the amount of calcium released in Y4864H cells was significantly reduced. A reduction in the amplitude of the calcium store was observed using caffeine stimulation in the absence of external calcium influx and in the absence of calcium re-uptake in the sarcoplasmic reticulum (caffeine plus thapsigargin, Cd2+ and La3 +, Fig. 2D). This reduction in the amount of stored calcium, which could reflect a leaky calcium channel, was compensated by an influx of external calcium when present (caffeine stimulation in presence of thapsigargin with Ca2+, Fig. 2C), leading to equivalent amounts of calcium released in Y4864H cells compared to control cells (Fig. 2F). This reduction in the amount of stored calcium could account for the muscle weakness observed in the patient, but as it can be compensated in some conditions, it can only be a partial explanation. In order to identify another mechanism for the muscle weakness observed, we focused our studies on the impact of the reduction of RyR1 quantity. As RyR1 deficiency has been proposed to result in disruption of EC coupling [17], we studied calcium release in a mouse model expressing a normal RyR1 but with a similar reduction in the amount of protein. This model was the heterozygous RyR1+/– mouse line that has only one functional RYR1 allele. We first confirmed the presence of RyR1 transcript at about a 50% level of a WT mouse. Noticeably, the RyR1 protein level was higher, reaching 85% of a WT mouse, suggesting a post-transcriptional regulation of the protein amount, identical to the situation in observed in the patient. In the heterozygous mouse myotubes, no reduction in the amount of released calcium was observed either after KCl membrane depolarization mimicking EC coupling or after direct RyR1 stimulation by CmC. In addition, RyR1+/– mice showed no muscle weakness. Those results confirmed that this degree of RyR1 reduction was not sufficient to result in muscle weakness or to alter calcium release. Therefore, muscle weakness and alteration of calcium release observed in the patient expressing the p.Y4864H mutation is most probably not related to the reduction of RyR1 amount, but rather to the presence of mutant monomers into the tetrameric channel. As the mutation induced a reduction in the amount of calcium stored in the sarcoplasmic reticulum, and as this channel is most probably hyperactive as observed by the hypersensitivity evaluated in IVCT, it could be hypothesized that this mutation resulted in a hyperactive and leaky calcium channel. Calcium leak would explain the reduction in the stored calcium and muscle weakness, and the hyperactive channel would explain the increased sensitivity observed in IVCT leading to the MHS status of the patient.
The 4864 position mapped within the last luminal loop of RyR1 monomer, which is involved in the selectivity pore for calcium permeation (P-loop), and is close to several other sites already found mutated in association with Central core Disease. A CCD family has previously been described with a mutation at the same position but leading to the substitution of tyrosine for cysteine instead of histidine (p.Y4864C) [30]. The affected patients of this family presented with a moderate myopathy, not associated to MH. Noteworthy, another mutation in position 4898 (p.I4898T), localized only 34 amino acids further away in the same intracellular loop, resulted in a severely uncoupled RyR1 [3]. It can therefore be postulated that the Y4864 and the I4898 amino acids belong to different functional domains although they are in close vicinity along the primary sequence of RyR1. A steric inhibition in the movement of the luminal loop has been proposed as a consequence of the p.I4898T mutation, but due to a different outcome on muscle physiology, cannot account for the effect of p.Y4864H. Looking at the structure of RyR1 recently published [31, 32] (Fig. 5), these two residues are on both side of the so-called P-loop or pore-helix between transmembrane segments S5 and S6. Because of the alteration of RyR1’s channel function found in the patient one can hypothesize that the p.Y4864H mutation disrupts a binding site specific of a modulator of RyR1 function. Triadin could be such a modulator, as 3 amino acids in position 4878, 49707 and 49708 have been shown to be involved in the RyR-triadin interaction [33], D4878 being very close to Y4864. Nevertheless, mutation for Ala of this single Asp in position 4878 induced a slight reduction in the RyR-triadin binding, but no modification in the calcium release [34]. Therefore the effect of a mutation in position 4864 should most probably not be related to an alteration of the interaction RyR-triadin. Mutation on amino acid 4861 has also been frequently associated with CCD, often as a neo-mutation [35], with no or only a slight reduction in the amount of protein [35] and small alteration in calcium release (reduction in the amount of calcium stored, measured on immortalized B-cells, [36]). The effects of mutation in position 4861 are quite similar to those observed for mutation in position 4864, and a similar physiopathological mechanism could be hypothesized for mutations at these two positions.
Overall, our study reports a CCD case where the effect of the RyR1 Y4864H mutation was explored. The reduction of total RyR1 mRNA in the patient muscle could not be explained but the fact that the amount of RyR1 protein was at 75% of a control suggested the presence of post transcriptional or epigenetic controls. This hypothesis is strengthened by the study of mRNA and protein in a RYR1 KO heterozygous mouse model, that shows the same level of RyR1 produced with a 50% reduction of mRNA. Our work also showed that the pathophysiological mechanisms linked to defects in calcium release in cells of the patient could not be attributed to a reduction in RyR1 protein levels, but rather to a direct effect of the p.Y4864H mutation on the channel properties.
CONFLICT OF INTEREST
The authors have no conflict of interest to report.
ACKNOWLEDGMENTS
We thank all family members for their contribution to this study. This work was supported by grants from the “Association Française contre les Myopathies” (AFM), the “Fondation Daniel Ducoin", the “Institut National de la Santé et de la Recherche Médicale” (INSERM), and the “Vivier de la Recherche de la Faculté de Médecine de Grenoble “. We thank Dr A.F. Delmas and Mrs. I. Stix for their help with the muscle biopsies, and the Myocastor study’s group (MSG) for fruitful discussions.
Appendices
Supplementary Figure S1 is available in the electronic version of this article: http://dx.doi.org/10.3233/JND-150073.
REFERENCES
1 | Lanner JT, Georgiou DK, Joshi AD, Hamilton SL (2010) Ryanodine receptors: Structure, expression, molecular details, and function in calcium release Cold Spring Harb Perspect Biol 2: a003996 |
2 | Monnier N, Romero NB, Lerale J, Landrieu P, Nivoche Y, Fardeau M, Lunardi J (2001) Familial and sporadic forms of central core disease are associated with mutations in the C-terminal domain of the skeletal muscle ryanodine receptor Hum Mol Genet 10: 2581 2592 |
3 | Lynch PJ, Tong J, Lehane M, Mallet A, Giblin L, Heffron JJ, Vaughan P, Zafra G, MacLennan DH, McCarthy TV (1999) A mutation in thetransmembrane/luminal domain of the ryanodine receptor isassociated with abnormal Ca2+ release channel function and severecentral core disease Proc Natl Acad Sci USA 96: 4164 4169 |
4 | Davis MR, Haan E, Jungbluth H, Sewry C, North K, Muntoni F, Kuntzer T, Lamont P, Bankier A, Tomlinson P, Sánchez A, Walsh P, Nagarajan L, Oley C, Colley A, Gedeon A, Quinlivan R, Dixon J, James D, Müller CR, Laing NG (2003) Principal mutationhotspot for central core disease and related myopathies in theC-terminal transmembrane region of the RYR1 gene Neuromuscul Disord 13: 151 157 |
5 | Ferreiro A, Monnier N, Romero NB, Leroy JP, Bonnemann C, Haenggeli CA, Straub V, Voss WD, Nivoche Y, Jungbluth H, Lemainque A, Voit T, Lunardi J, Fardeau M, Guicheney P (2002) A recessive form of central core disease, transiently presenting as multi-minicore disease, is associated with a homozygous mutation in the ryanodine receptor type 1 gene Ann Neurol 51: 750 759 |
6 | Jungbluth H, Muller CR, Halliger-Keller B, Brockington M, Brown SC, Feng L, Chattopadhyay A, Mercuri E, Manzur AY, Ferreiro A, Laing NG, Davis MR, Roper HP, Dubowitz V, Bydder G, Sewry CA, Muntoni F (2002) Autosomal recessive inheritanceof RYR1 mutations in a congenital myopathy with cores Neurology 59: 284 287 |
7 | Monnier N, Ferreiro A, Marty I, Labarre-Vila A, Mezin P, Lunardi J (2003) A homozygous splicing mutation causing a depletion of skeletalmuscle RYR1 is associated with multi-minicore diseasecongenital myopathy with ophthalmoplegia Hum Mol Genet 12: 1171 1178 |
8 | De Cauwer H, Heytens L, Martin JJ (2002) Workshop report of the 89th ENMC International Workshop: Central Core Disease, 19th-20th January Hilversum, The Netherlands Neuromuscul Disord 12: 588 595 |
9 | Romero NB, Monnier N, Viollet L, Cortey A, Chevallay M, Leroy JP, Lunardi J, Fardeau M (2003) Dominant and recessive central core diseaseassociated with RYR1 mutations and fetal akinesia Brain 126: 2341 2349 |
10 | Jungbluth H (2007) Central core disease Orphanet J Rare Dis 2: 25 |
11 | Dirksen RT, Avila G (2002) Altered ryanodine receptor function in central core disease: Leaky or uncoupled Ca(2+) release channels? Trends Cardiovasc Med 12: 189 197 |
12 | Treves S, Jungbluth H, Muntoni F, Zorzato F (2008) Congenital muscle disorders with cores: The ryanodine receptor calcium channel paradigm Curr Opin Pharmacol 8: 319 326 |
13 | Ghassemi F, Vukcevic M, Xu L, Zhou H, Meissner G, Muntoni F, Jungbluth H, Zorzato F, Treves S (2009) A recessive ryanodine receptor 1 mutation in a CCD patient increases channel activity Cell Calcium 45: 192 197 |
14 | Loy RE, Orynbayev M, Xu L, Andronache Z, Apostol S, Zvaritch E, MacLennan DH, Meissner G, Melzer W, Dirksen RT (2011) Muscle weakness inRyr1IT/WT knock-in mice as a result of reduced ryanodinereceptor Ca2+ ion permeation and release from the sarcoplasmicreticulum J Gen Physiol 137: 43 57 |
15 | Zhou H, Yamaguchi N, Xu L, Wang Y, Sewry C, Jungbluth H, Zorzato F, Bertini E, Muntoni F, Meissner G, Treves S (2006) Characterization ofrecessive RYR1 mutations in core myopathies Hum Mol Genet 15: 2791 2803 |
16 | Monnier N, Marty I, Faure J, Castiglioni C, Desnuelle C, Sacconi S, Estournet B, Ferreiro A, Romero N, Laquerriere A, Lazaro L, Martin JJ, Morava E, Rossi A, Van der Kooi A, Verschuuren C, Lunardi J (2008) Null mutations causing depletion of the type 1ryanodine receptor (RYR1) are commonly associated withrecessive structural congenital myopathies with cores Hum Mutat 29: 670 678 |
17 | Zhou H, Rokach O, Feng L, Munteanu I, Mamchaoui K, Wilmshurst JM, Sewry C, Manzur AY, Pillay K, Mouly V, Duchen M, Jungbluth H, Treves S, Muntoni F (2013) RyR1 deficiency in congenital myopathies disrupts excitation-contraction coupling Hum Mutat 34: 986 996 |
18 | Oddoux S, Brocard J, Schweitzer A, Szentesi P, Giannesini B, Brocard J, Fauré J, Pernet-Gallay K, Bendahan D, Lunardi J, Csernoch L, Marty I (2009) Triadin deletion induces impaired skeletal muscle function J Biol Chem 284: 34918 34929 |
19 | Marty I, Robert M, Villaz M, Lai Y, De Jongh KS, Catterall WA, Ronjat M (1994) Biochemical evidence for a complex involving dihydropyridine receptor and ryanodine receptor in triad junctions of skeletal muscle Proc Natl Acad Sci USA 91: 2270 2274 |
20 | Zhu CH, Mouly V, Cooper RN, Mamchaoui K, Bigot A, Shay JW, DiSanto JP, Butler-Browne GS, Wright WE (2007) Cellular senescence inhuman myoblasts is overcome by human telomerase reversetranscriptase and cyclin-dependent kinase Consequences in agingmuscle and therapeutic strategies for muscular dystrophies Aging Cell 64: 515 523 |
21 | Mamchaoui K, Trollet C, Bigot A, Negroni E, Chaouch S, Wolff A, Kandalla PK, Marie S, Di Santo J, St Guily JL, Muntoni F, Kim J, Philippi S, Spuler S, Levy N, Blumen SC, Voit T, Wright WE, Aamiri A, Butler-Browne G, Mouly V (2011) Immortalized pathological human myoblasts: Towards a universal tool for the study of neuromuscular disorders Skelet Muscle 1: 34 |
22 | Marty I, Thevenon D, Scotto C, Groh S, Sainnier S, Robert M, Grunwald D, Villaz M (2000) Cloning and characterization of a new isoform of skeletal muscle triadin J Biol Chem 275: 8206 8212 |
23 | Rezgui SS, Vassilopoulos S, Brocard J, Platel JC, Bouron A, Arnoult C, Oddoux S, Garcia L, De Waard M, Marty I (2005) Triadin (Trisk 95) overexpression blocks excitation-contraction coupling in rat skeletal myotubes J Biol Chem 280: 39302 39308 |
24 | Lee EH, Cherednichenko G, Pessah IN, Allen PD (2006) Functional coupling between TRPC3 and RyR1 regulates the expressions of key triadic proteins J Biol Chem 281: 10042 10048 |
25 | Shen X, Franzini-Armstrong C, Lopez JR, Jones LR, Kobayashi YM, Wang Y, Kerrick WG, Caswell AH, Potter JD, Miller T, Allen PD, Perez CF (2007) Triadins modulate intracellular Ca(2+) homeostasis but are not essential for excitation-contraction coupling in skeletal muscle J Biol Chem 282: 37864 37874 |
26 | Medical Research Council. Aids to the investigation of the peripheral nervous system. London: Her Majesty’s Stationary Office; 1943 |
27 | Buck ED, Nguyen HT, Pessah IN, Allen PD (1997) Dyspedic mouse skeletal muscle expresses major elements of the triadic junction but lacks detectable ryanodine receptor protein and function J Biol Chem 272: 7360 7367 |
28 | Moore RA, Nguyen H, Galceran J, Pessah IN, Allen PD (1998) A transgenicmyogenic cell line lacking ryanodine receptor protein forhomologous expression studies: Reconstitution of Ry1R protein andfunction J Cell Biol 140: 843 851 |
29 | Avila G, O’Brien JJ, Dirksen RT (2001) Excitation-contraction uncoupling by a human central core disease mutation in the ryanodine receptor Proc Natl Acad Sci U S A 98: 4215 4220 |
30 | Quinlivan RM, Muller CR, Davis M, Laing NG, Evans GA, Dwyer J, Dove J, Roberts AP, Sewry CA (2003) Central core disease: Clinical, pathological, and genetic features Arch Dis Child 88: 1051 1055 |
31 | Zalk R, Clarke OB, des Georges A, Grassucci RA, Reiken S, Mancia F, Hendrickson WA, Frank J, Marks AR (2015) Structure of a mammalian ryanodine receptor Nature 517: 44 49 |
32 | Yan Z, Bai XC, Yan C, Wu J, Li Z, Xie T, Peng W, Yin CC, Li X, Scheres SH, Shi Y, Yan N (2015) Structure of the rabbit ryanodine receptor RyR1 at near-atomic resolution Nature 517: 50 55 |
33 | Lee JM, Rho SH, Shin DW, Cho C, Park WJ, Eom SH, Ma J, Kim DH (2004) Negatively charged amino acids within the intraluminal loop of ryanodine receptor are involved in the interaction with triadin J Biol Chem 279: 6994 7000 |
34 | Lee EH, Song DW, Lee JM, Meissner G, Allen PD, Kim DH (2006) Occurrenceof atypical Ca2+ transients in triadin-binding deficient-RYR1 mutants Biochem Biophys Res Commun 351: 909 914 |
35 | Zhou H, Jungbluth H, Sewry CA, Feng L, Bertini E, Bushby K, Straub V, Roper H, Rose MR, Brockington M, Kinali M, Manzur A, Robb S, Appleton R, Messina S, D’Amico A, Quinlivan R, Swash M, Müller CR, Brown S, Treves S, Muntoni F (2007) Molecular mechanisms andphenotypic variation in RYR1-related congenital myopathies Brain 130: 2024 2036 |
36 | Tilgen N, Zorzato F, Halliger-Keller B, Muntoni F, Sewry C, Palmucci LM, Schneider C, Hauser E, Lehmann-Horn F, Müller CR, Treves S (2001) Identification of four novel mutations in the C-terminal membrane spanning domain of the ryanodine receptor association with central core disease and alteration of calcium homeostasis Hum Mol Genet 10: 2879 2887 |
Figures and Tables
Fig.1
Case description. (A). Pedigree of the family. Circles represent females and squares males. Filled symbols indicate affected individuals. The proband is indicated by the black arrow. Segregation of alleles is indicated below each individual. MH = Malignant Hyperthermia; MHN = MH Negative; MHS = MH Susceptible. (B). Quantitative analysis of RyR1 expression (protein and mRNA) in the skeletal muscle of the proband (Individual III.3). Twenty μg muscle homogenate from control (CTRL, lane 1) or proband (Y4864H, lane 2) were loaded on a 4–15% polyacrylamide gel. The amount of RyR1 protein is expressed as the percentage of RyR1 present in the control muscle, which relative expression compared to myosin was set at 100% . The central bars graph presents RyR1 protein mean amount ± SEM from seven different Western blots. The bar graph on the right is the Q-RT-PCR analysis of levels of RyR1 mRNA expressed as a percentage of control (which relative expression compared to reference genes was set to 100%). The data are presented as mean ± SEM of 9–12 different amplifications. **p < 0.01, ****p < 0.0001, Student’s t-test. (C) Representative Western blot of different controls (C1-C4), non-affected women between 20 and 23 years.
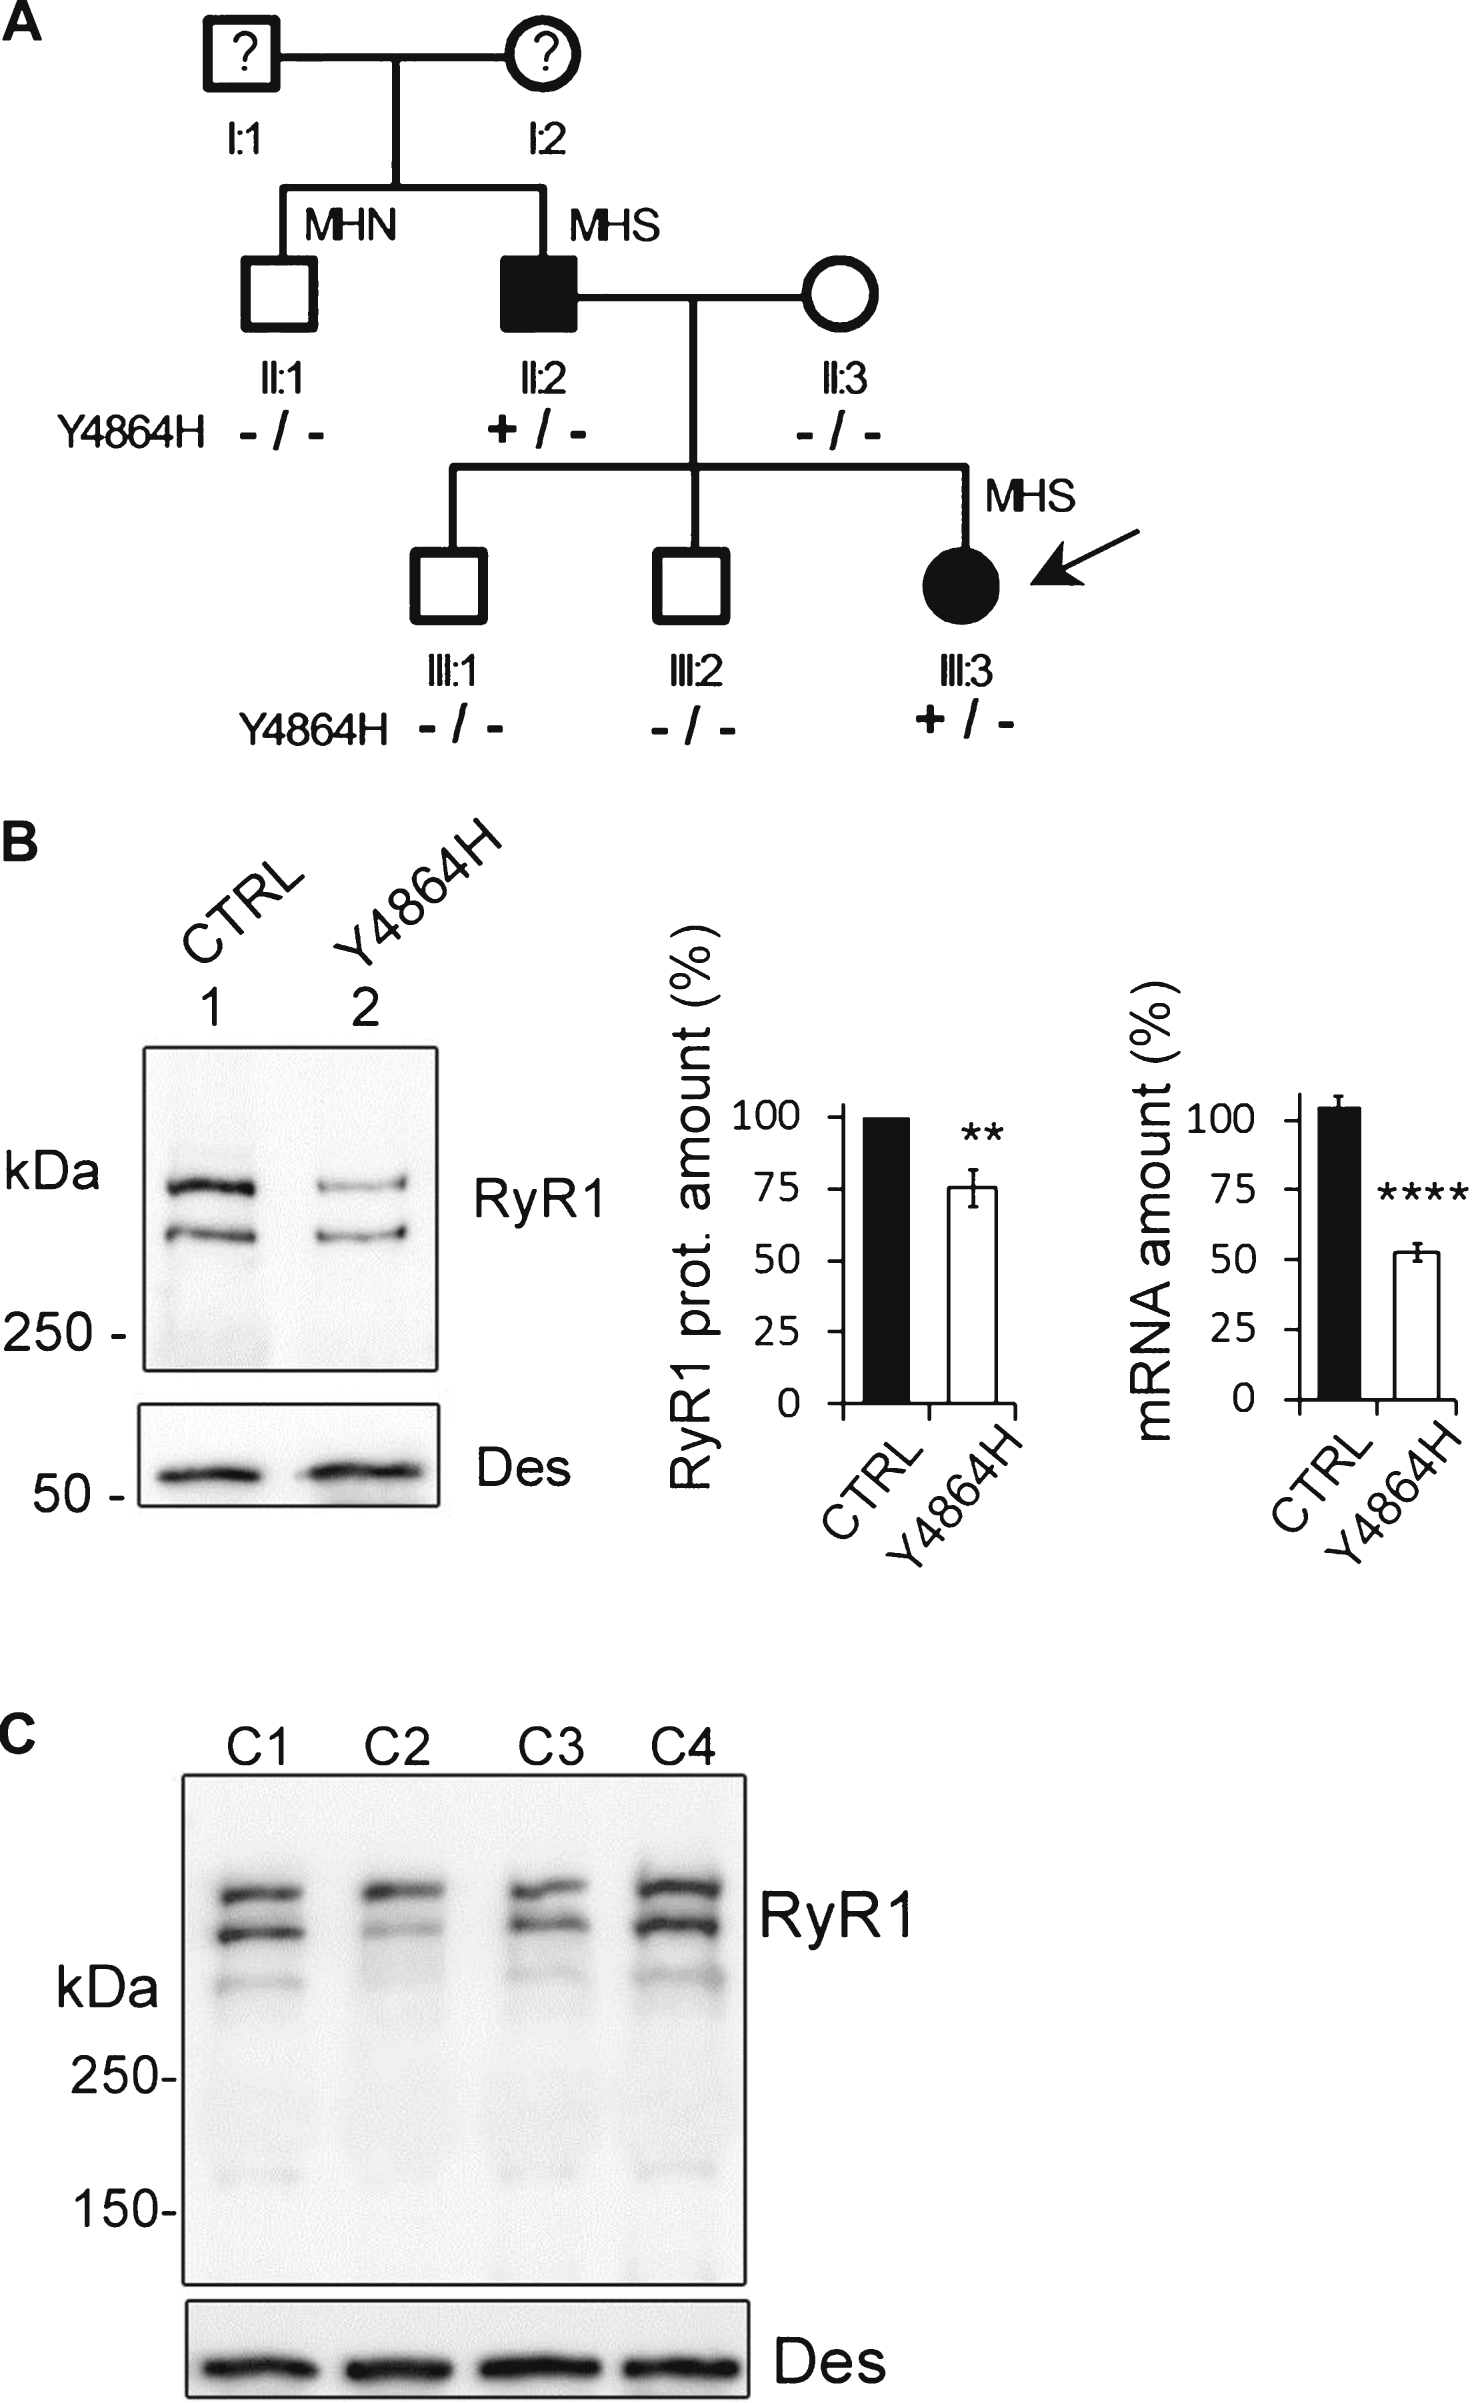
Fig.2
Calcium release in immortalized patient cells. Calcium imaging performed on control CTRL cells (black circle), and on patient’s Y4864H cells (white circle) differentiated for 7 to 8 days before calcium imaging. (A) Fluorescence variation curves induced by membrane depolarization (KCl 140 mM) applied during 60 s (black bar) in the presence of 2 mM external calcium, presented as mean (symbols) ± SEM. (B) Fluorescence variation curves induced by application of 4-Chloro-m-Cresol (CmC) 500 μM during 60 s (black bar) in the presence of 2 mM external calcium, presented as mean (symbols) ± SEM. (C) Fluorescence variation curves induced by application of caffeine 40 mM plus thapsigargin 1 μM (Caf+Thapsigargin) during 60 s (black bar) in the presence of 2 mM external calcium, presented as mean (symbols) ± SEM. (D) Fluorescence variation curves induced by application of caffeine 40mM plus thapsigargin 1 μM in absence of extracellular calcium (Caf+Thapsigargin - Ca2+) during 60 s (black bar) in the presence of Cd2+ and La3 +, presented as mean (symbols) ± SEM. (E) The maximal amplitude of the peak for each curve is presented in the bar plots, with the number of myotubes analyzed in each bar. ****p<0.0001, Student’s t test comparisons between CTRL and Y4864H cells, for each stimulation. (F) The area under each curve (A.U.) has been calculated for each stimulation, in control myotubes (black bars) and Y4864H myotubes (white bars) and is presented as mean ± SEM of the number of myotubes indicated in each bar. Statistics: Student’s t-test of Y4864H myotubes compared to control myotubes ****p < 0.0001, ***p < 0.001, ns: non significant.
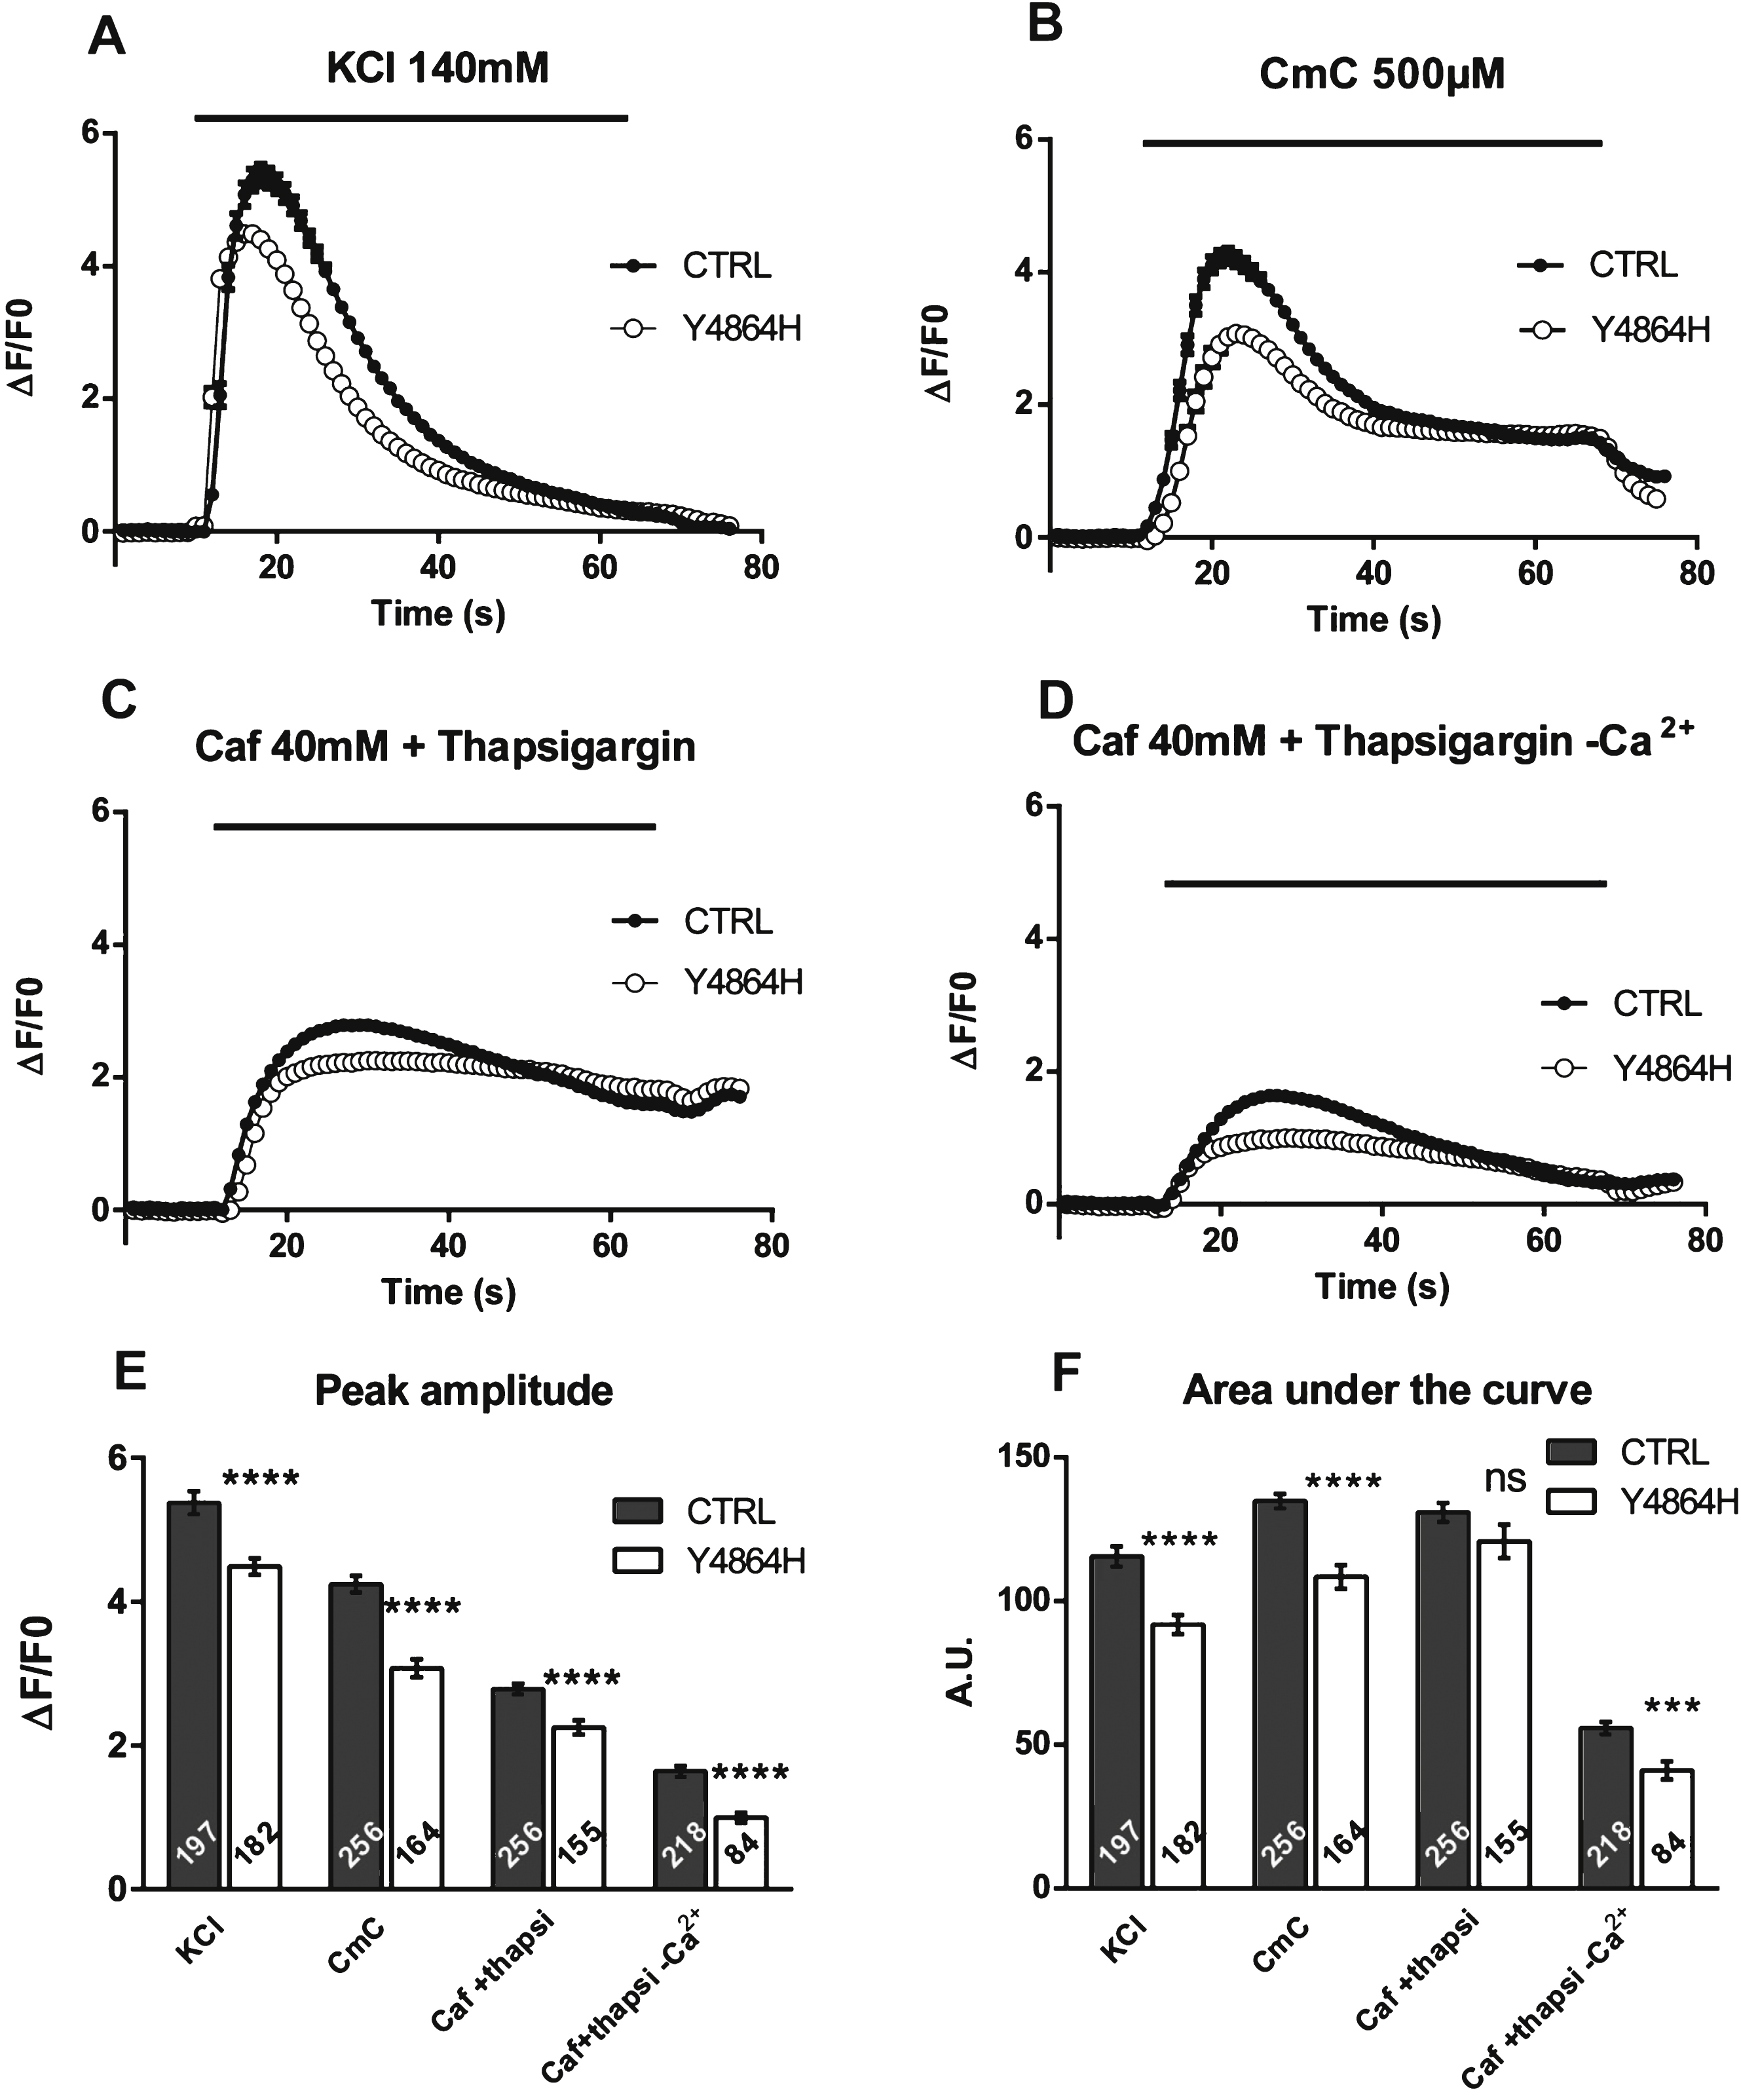
Fig.3
Expression of RyR1 in heterozygous RyR1+/– mouse muscles. (A) Quantitative Western blot analysis of RyR1 expression in skeletal muscle homogenates from WT mice (WT) or from heterozygous RyR1+/– mice (He). (B) The relative amount of RyR1 at the protein level compared to myosin was set to 100% in WT mice. The amount of RyR1 in He mice is presented as mean ± SEM of 9 experiments performed in 3 different mice. ***p < 0.001 Student’s t-test between WT and He. (C) Q-RT-PCR analysis of levels of RyR1 mRNA expressed as a percentage of WT mice (which relative expression compared to GAPDH was set to 100%). The data are presented as mean ± SEM of 3 different mice. **p < 0.01 Student’s t-test between WT and He.
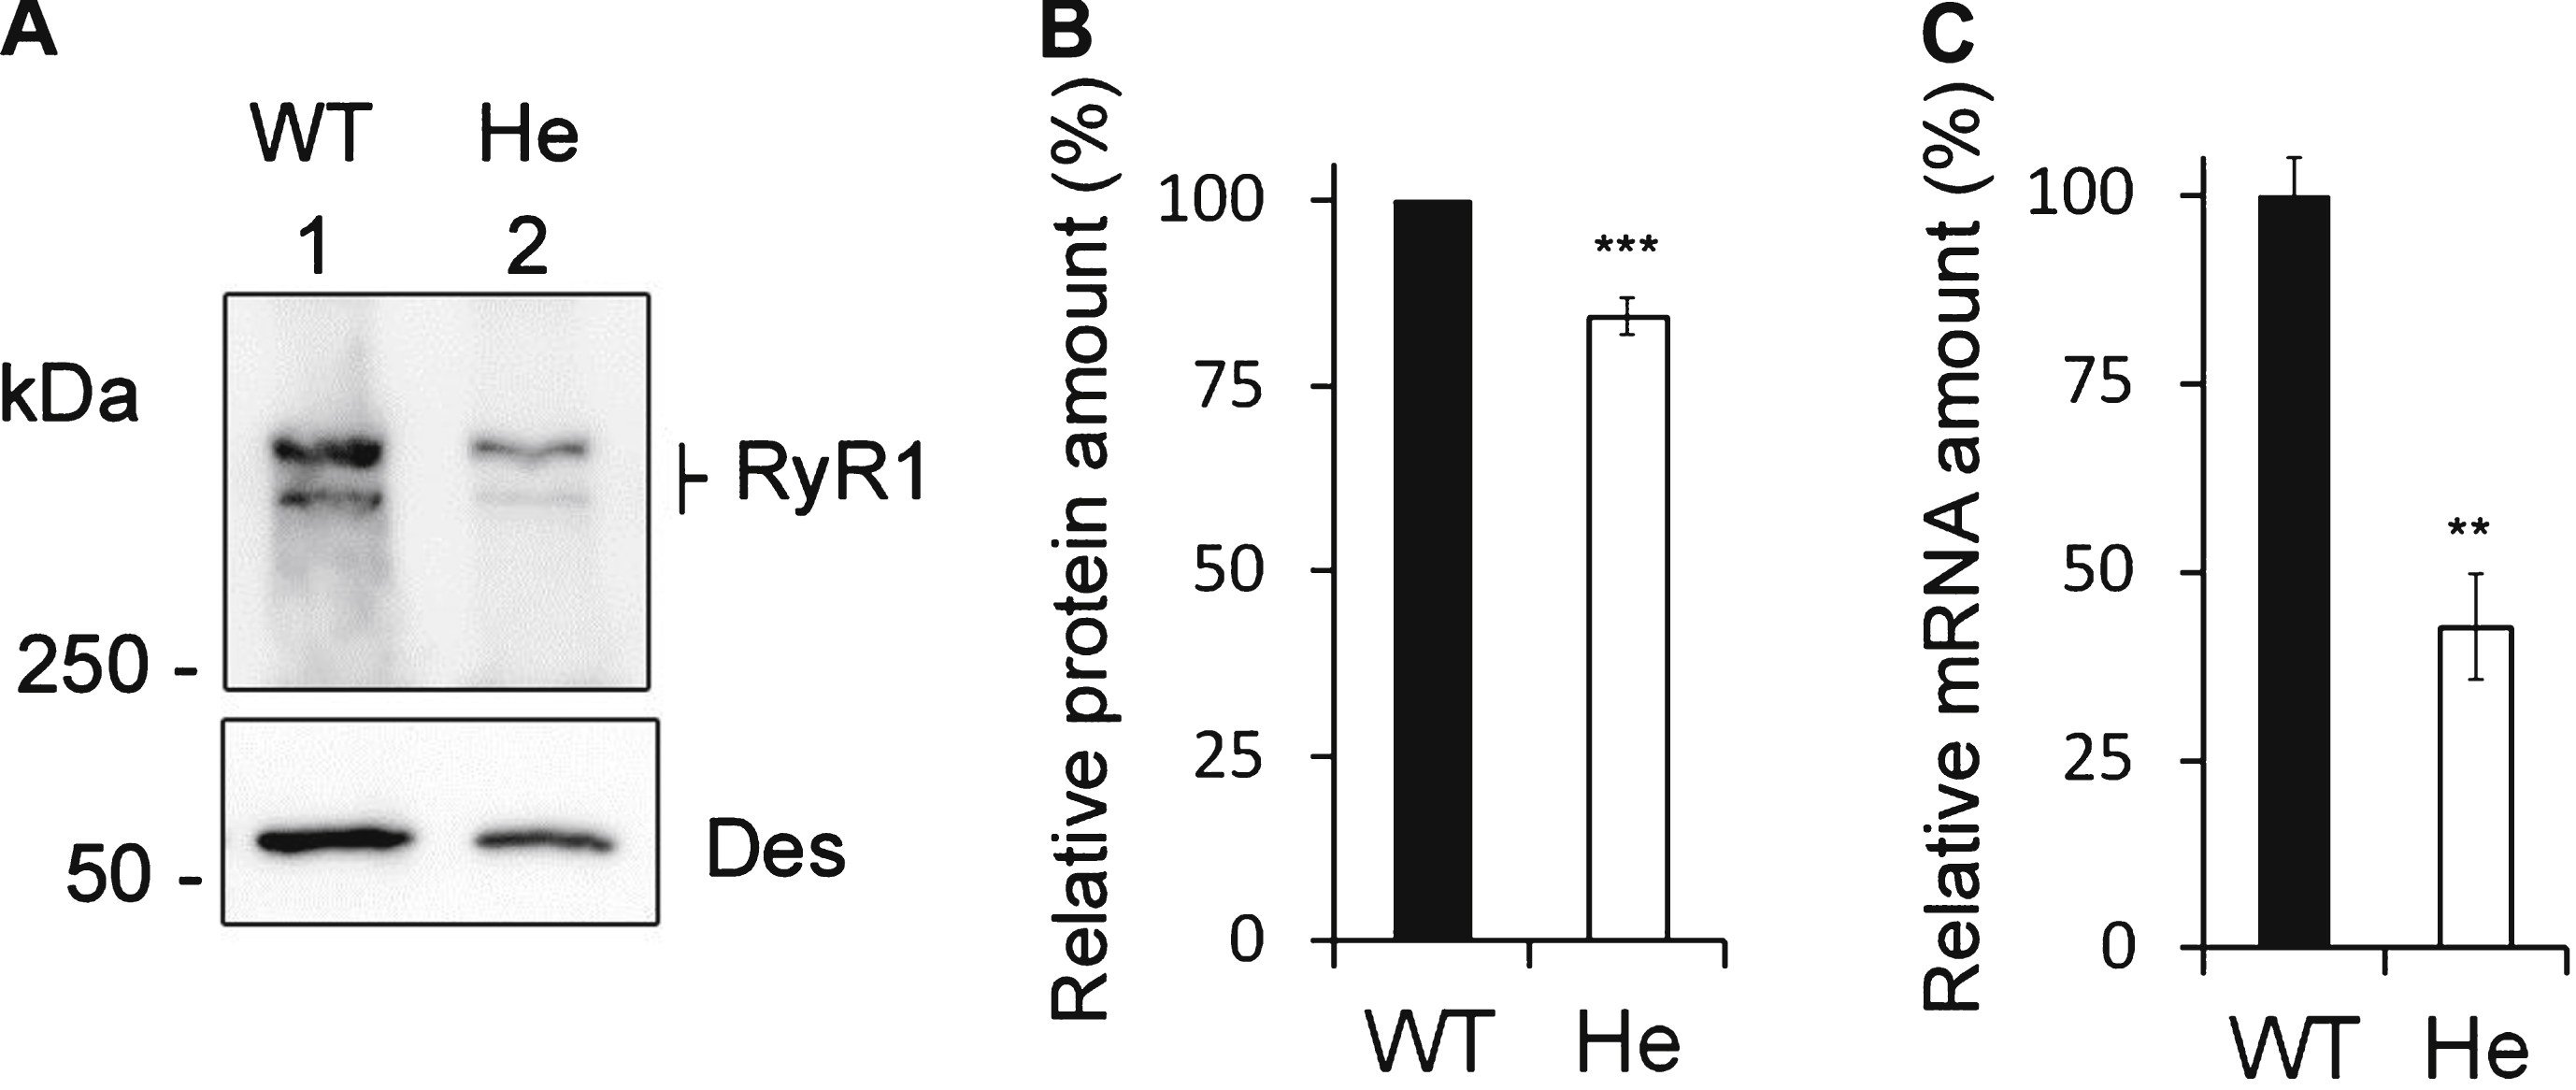
Fig.4
Calcium release in mouse cells. Calcium imaging performed on WT satellites cells (black circle), on RyR1+/– heterozygous mouse cells (gray square) and on RyR1–/– KO mouse cells (white circle) differentiated for 2 to 3 days before calcium imaging. (A) Fluorescence variation curves induced by membrane depolarization (KCl 140 mM) applied during 40 s (black bar) in the presence of 2 mM external calcium, presented as mean (symbols) ± SEM. (B) Fluorescence variation curves induced by application of 4-Chloro-m-Cresol (CmC) 500 μM during 40 s (black bar) in the presence of 2 mM external calcium, presented as mean (symbols) ± SEM. (C) The maximal amplitude of the peak for each curve is presented in the bar plots, with the number of myotubes analyzed in each bar. ****p < 0.0001, Student’s t test followed by Bonferroni correction for multiple comparison, compared to WT. (D) The area under each curve (A.U.) has been calculated for each stimulation, in WT myotubes (black bars), He myotubes (gray bars) and KO myotubes (white bars) and is presented as the mean ± SEM of the number of myotubes indicated in each bar. ****p < 0.0001, Student’s t test followed by Bonferroni correction for multiple comparison, compared to WT.
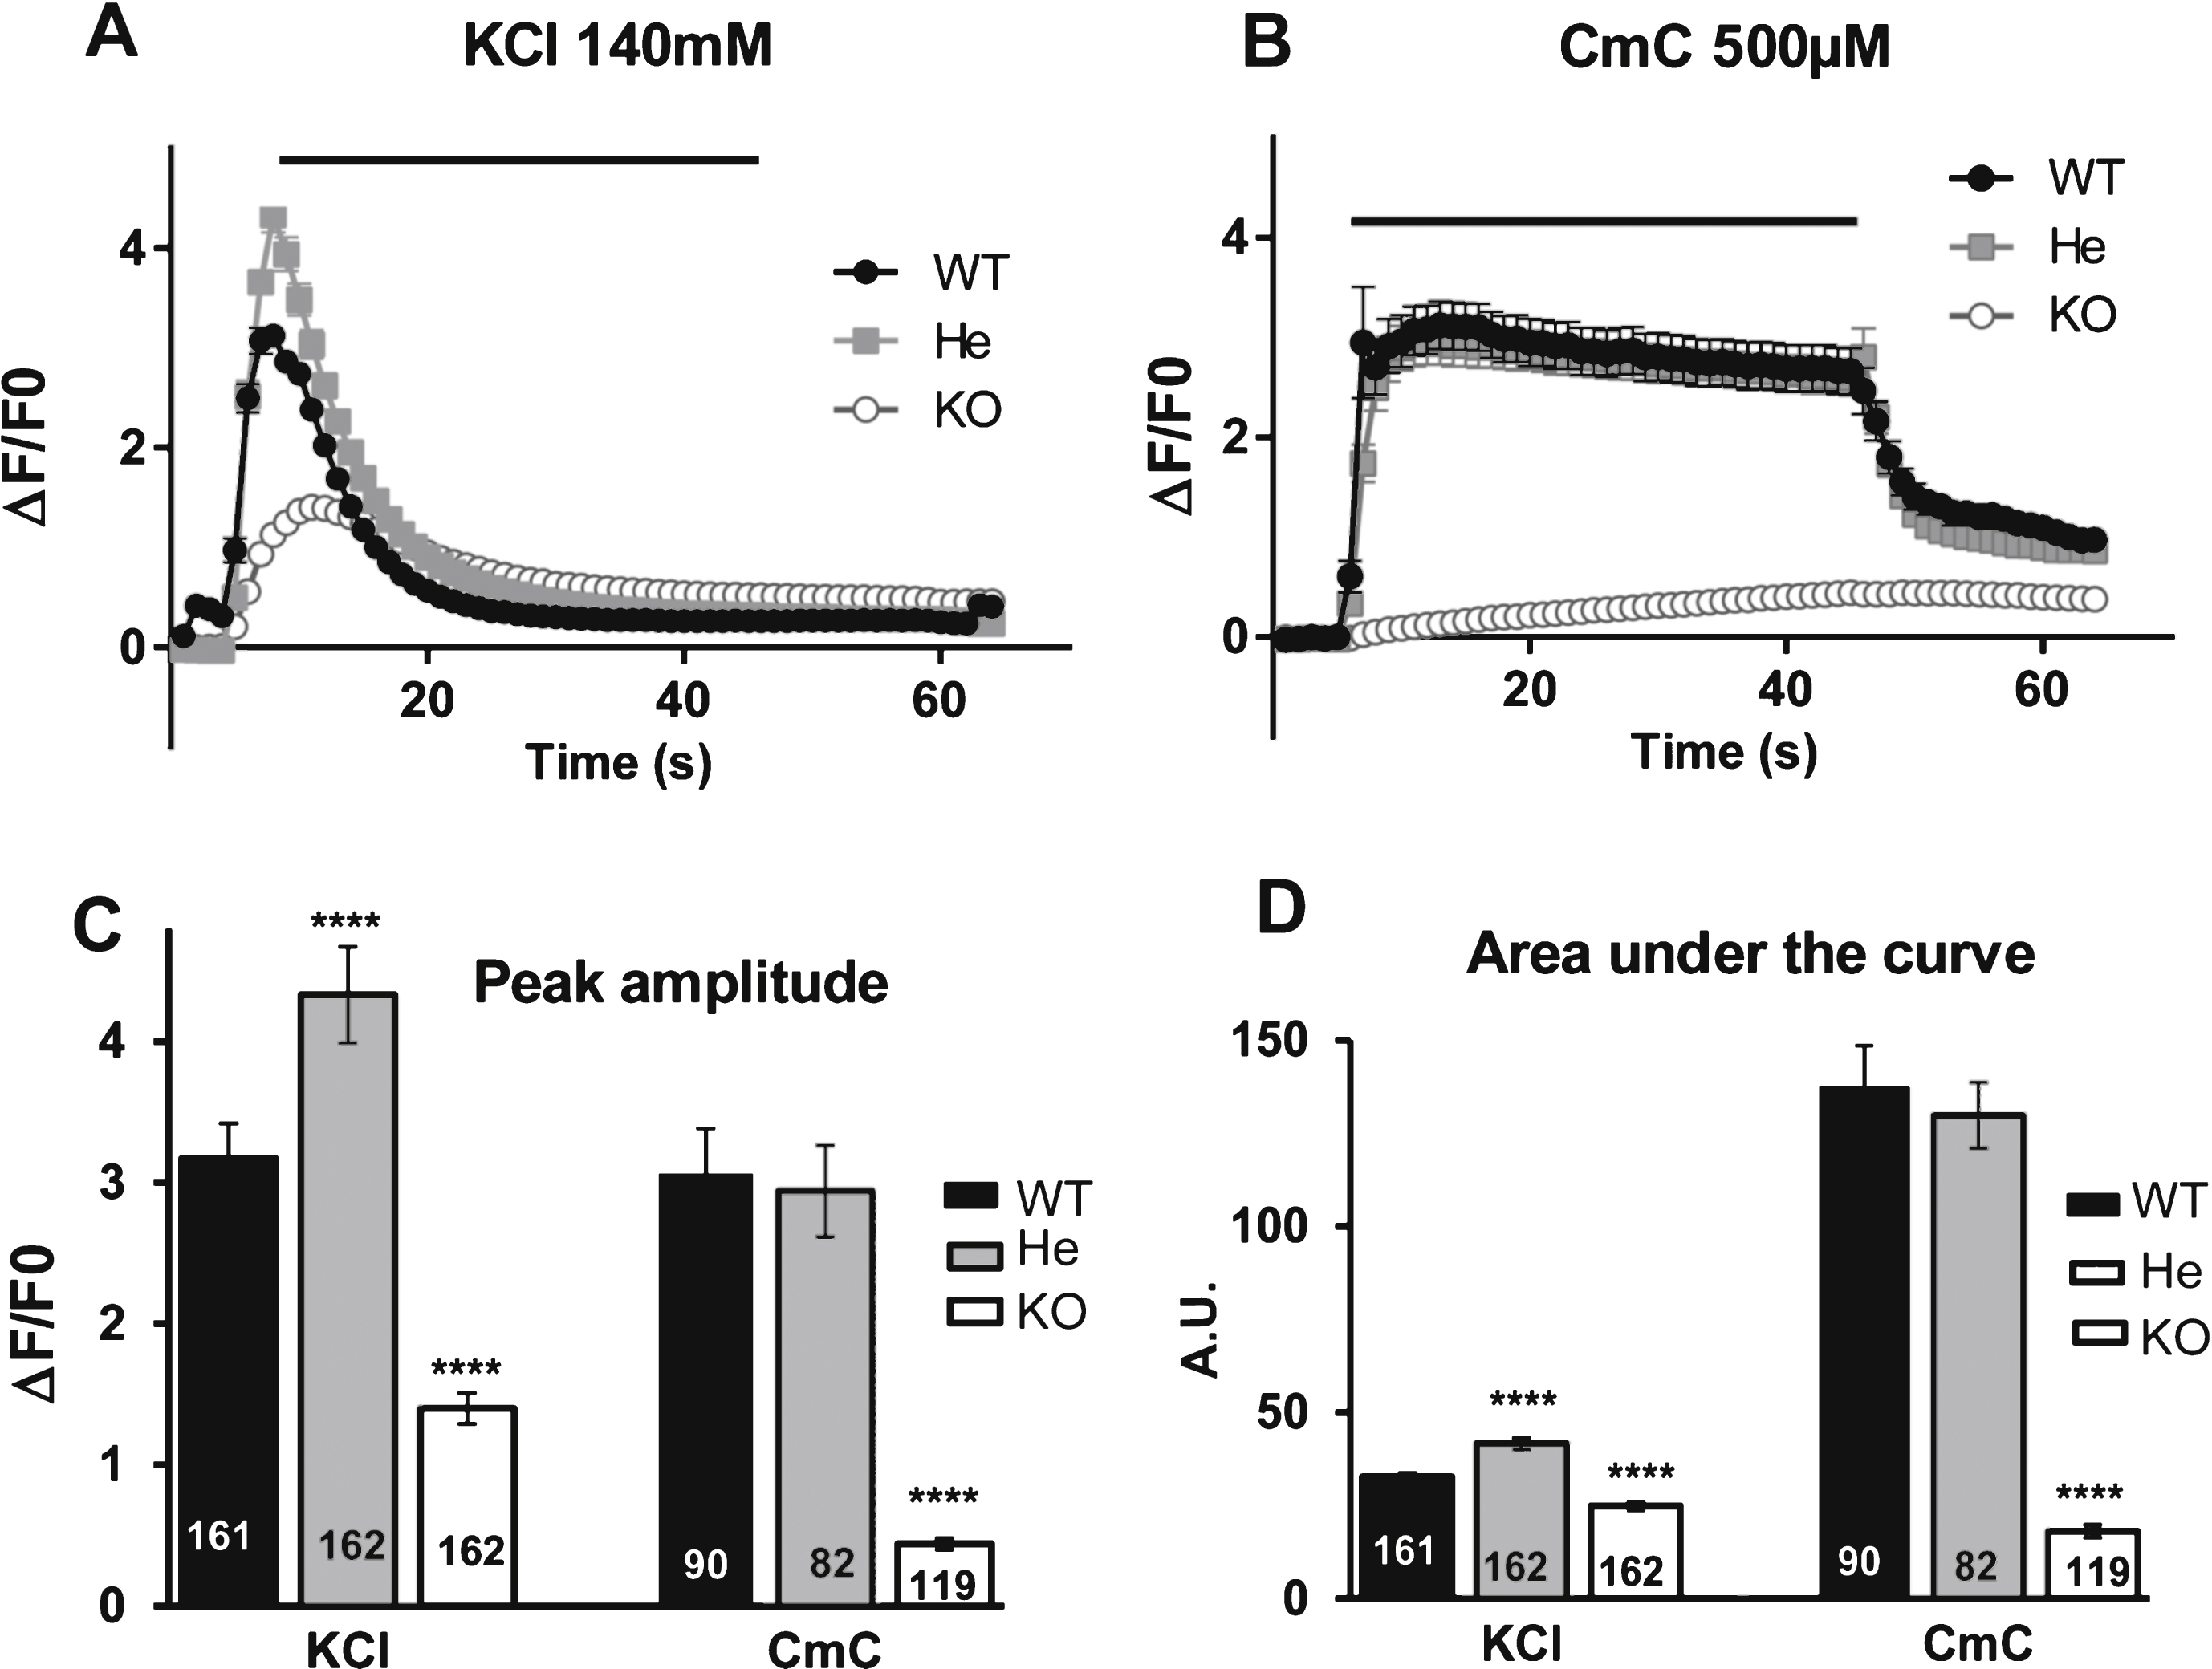
Fig.5
Localization of the mutation in the structure of the protein. The localization of the mutation presented in this study, p.Y4864H, as well as two close amino acids R4864 and I4898 both involved in CCD, are reported on the structure of RyR1 recently proposed from single particle electron cryomicroscopy [31, 32]. These amino acids are in the luminal loop between transmembrane helixes S5 and S6, which contain the pore helix (P-helix) involved inpore formation.
![Localization of the mutation in the structure of the protein. The localization of the mutation presented in this study, p.Y4864H, as well as two close amino acids R4864 and I4898 both involved in CCD, are reported on the structure of RyR1 recently proposed from single particle electron cryomicroscopy [31, 32]. These amino acids are in the luminal loop between transmembrane helixes S5 and S6, which contain the pore helix (P-helix) involved inpore formation.](https://content.iospress.com:443/media/jnd/2015/2-4/jnd-2-4-jnd150073/jnd-2-4-jnd150073-g005.jpg)
Table 1
Analysis of patients
| CK | IVCT data | ||
| Hal 2% | Caf 2 mM | ||
| III: 3 | 75 | 6N | 5N |
| II: 2 | 168 | 10N | 6N |
| II: 1 | 51 | <2N | <2N |
CK levels and IVCT data of the proband (III.3) and two individuals from the family (II.2 and II.1). CK = Creatine Kinase activity is expressed in international units per liter (IU/L; normal <205). IVCT = In Vitro Contracture Test. Hal = tension in Newton (N) at 2% halothane, the normal value being <2N. Caf = tension at 2 mM Caffeine, the normal value being <2N.


