
Muscle-Derived Proteins as Serum Biomarkers for Monitoring Disease Progression in Three Forms of Muscular Dystrophy
Abstract
Background: Identifying translatable, non-invasive biomarkers of muscular dystrophy that better reflect the disease pathology than those currently available would aid the development of new therapies, the monitoring of disease progression and the response to therapy.
Objective: The goal of this study was to evaluate a panel of serum protein biomarkers with the potential to specifically detect skeletal muscle injury.
Method: Serum concentrations of skeletal troponin I (sTnI), myosin light chain 3 (Myl3), fatty acid binding protein 3 (FABP3) and muscle-type creatine kinase (CKM) proteins were measured in 74 Duchenne muscular dystrophy (DMD), 38 Becker muscular dystrophy (BMD) and 49 Limb-girdle muscular dystrophy type 2B (LGMD2B) patients and 32 healthy controls.
Results: All four proteins were significantly elevated in the serum of these three muscular dystrophy patient populations when compared to healthy controls, but, interestingly, displayed different profiles depending on the type of muscular dystrophy. Additionally, the effects of patient age, ambulatory status, cardiac function and treatment status on the serum concentrations of the proteins were investigated. Statistical analysis revealed correlations between the serum concentrations and certain clinical endpoints including forced vital capacity in DMD patients and the time to walk ten meters in LGMD2B patients. Serum concentrations of these proteins were also elevated in two preclinical models of muscular dystrophy, the mdx mouse and the golden-retriever muscular dystrophy dog.
Conclusions: These proteins, therefore, are potential muscular dystrophy biomarkers for monitoring disease progression and therapeutic response in both preclinical and clinical studies.
INTRODUCTION
The muscular dystrophies are a heterogeneous group of genetic disorders that result in progressive skeletal muscle weakness and wasting [1]. There are nine major forms of muscular dystrophy that differ clinically in many respects including age of onset, spectrum of muscle groups affected, severity of muscle injury and lethality [1]. Duchenne muscular dystrophy (DMD) is one of the most severe and common forms of muscular dystrophy with a prevalence of approximately 1 in 3,500–6,000 live male births [2]. DMD results from mutations in the DMD gene that results in an absence of dystrophin protein expression [3]. Becker muscular dystrophy (BMD) is caused by mutations that lead to partial dystrophin deficiency resulting in a milder form of the disease with later onset and greater life expectancy [3]. Limb-girdle muscular dystrophy type 2B (LGMD2B) is an autosomal recessive disorder resulting from mutations in the DYSF gene that lead to dysferlin deficiency [4]. Clinically, LGMD2B results in progressive proximal muscle weakness, diagnosed when patients are in their 20’s and 30’s, but, unlike DMD and BMD, typically does not affect the cardiac and respiratory muscles [4, 5].
There are very few pharmacological treatment options for muscular dystrophy [6]. For DMD and BMD patients corticosteroid treatment is the only intervention consistently shown to delay disease progression, but with potentially treatment limiting side effects of weight gain, loss of bone density and behavioral problems with long-term use [7, 8]. For LGMD2B corticosteroid treatment has proven ineffective [5]. Fortunately, a number of therapeutics with different modes of action are currently in late pre-clinical development or early clinical trials offering hope that new treatment options for muscular dystrophy will become available [6, 9].
The progression of new therapeutics toward clinical testing has highlighted the need for improved outcome measures and biomarkers to support regulatory approval [10–12]. A number of clinical assessments are available for evaluating functional improvement in muscular dystrophy patients including the 6 minute walk test, timed functional tests, forced vital capacity (FVC) and the North Star Ambulatory Assessment (NSAA), among others [11]. Total serum creatine kinase (CK) is the standard clinical chemistry test that is used to diagnose muscular dystrophy [13]. This test is based on measuring the enzymatic activity of CK present in the serum after release from damaged muscle tissue [13]. While this widely available test is useful for detecting muscle injury, serum CK activity does not correlate well with disease severity in muscular dystrophy patients [11]. This is due to a number of confounding factors affecting a patient’s serum CK level including age, the level of physical activity and the amount of muscle mass [11, 14], as well as factors that affect CK enzyme activity such as serum glutathione levels and treatment with certain drugs [15].
Numerous research teams have described novel potential biomarkers for monitoring disease progression and drug efficacy in muscular dystrophy patients, particularly DMD, including circulating microRNA [16–19] and proteins identified in serum and urine [20–22]. Two recent reports utilized proteomics approaches to comprehensively profile the proteome of serum from DMD and BMD patients [14, 23]. Both groups identified a number of proteins involved in muscle function and metabolism that were significantly elevated in the serum of muscular dystrophy patients when compared to healthy controls. Promisingly, a number of these identified muscle-derived proteins were common to both studies and correlated with disease severity in DMD and BMD patients. While the experimental approaches used in these reports were semi-quantitative it suggested that the strategy of measuring serum concentrations of muscle-derived proteins could provide useful biomarkers for monitoring disease progression in muscular dystrophy patients.
Here we report on the results of a multiplexed electrochemiluminescent enzyme-linked immunosorbent assay (ELISA) approach to quantitatively measure the serum concentrations of four proteins, abundant in skeletal muscle tissue, in serum from DMD, BMD and LGMD2B patients. The four proteins measured are the myofibrillar proteins skeletal troponin I (sTnI) and myosin light chain 3 (Myl3), creatine kinase muscle-type (CKM) and the lipid transport protein fatty acid binding protein 3 (FABP3). Using clinical assessments, such as FVC, NSAA score, ambulatory status and cardiac function, we sought to determine if measuring serum concentrations of these muscle-derived proteins better reflected the patients’ disease state than CK activity.
MATERIALS AND METHODS
Subjects
Serum samples from 38 BMD and 49 LGMD2B patients and 100 serum samples from 74 DMD patients were obtained from Newcastle University and the Jain Foundation through the MRC Centre for Neuromuscular Diseases Biobank. Collection of samples from patients and their use in research have been ethically approved by the NRES Committee North East – Newcastle and North Tyneside 1. For the healthy controls 18 serum samples were purchased from BioreclamationIVT (Nassau, NY) and 14 serum samples were obtained from the Pfizer Research Support Program (Groton, CT). Collection of samples through the Pfizer Research Support Program was ethically approved by Pfizer’s Institutional Review Board and conducted by the Pfizer Global Occupational Health and Wellness Clinic.
Muscle protein immunoassay and clinical chemistry
sTnI, FABP3, Myl3 was quantified in serum samples using the Meso Scale Discovery (MSD, Rockville, MD) Muscle Injury Panel 1 reagent kit (catalog # K15181C). CKM was measured using the MSD Muscle Injury Panel 2 reagent kit (catalog # K15180C). Both assays were run and measured as per the manufacturer’s instructions. Subject samples were diluted to be within the dynamic range of the assay. For sTnI, FABP3, Myl3 testing, the muscular dystrophy patients’ samples were diluted 1:8 while control subject samples were diluted 1:4. CKM measurement for the DMD, BMD and LGMD2B patients required samples to be diluted from 1:200 to 1:800 to be within the dynamic range of the assay while normal control subjects required dilution of 1:25. ALT, AST and total serum CK were analyzed by standard clinical chemistry techniques on the Siemens Advia 2400 platform.
Statistical analysis
Data were transformed and tested for the normality assumption using the Shapiro-Wilk Test. Comparisons between groups were made using ANOVA (parametric) and Kruskal-Wallis (nonparametric) Tests. Correlation analyses were performed using Spearman’s Correlation (order statistics). Data from a subject with two serial samples were evaluated with ANOVA on paired differences and repeated measures ANOVA. All analyses were performed using SAS version 9.2, Cary, N. Carolina. All graphs were generated using Graphpad Prism version 6.03.
RESULTS
Validation of assay performance
Numerous recent reports have demonstrated the potential utility of measuring the serum concentrations of muscle-derived proteins as biomarkers of muscle injury [14, 23, 24]. We have extensively used a multiplexed immunoassay to monitor serum and plasma concentrations of the muscle-derived proteins sTnI, Myl3, FABP3 and CKM in preclinical muscle disease and muscle injury studies in rodents. While these assays were developed and validated using rat muscle proteins and homogenates, the highly conserved amino acid sequence of the target proteins between all species, including human, suggested these assay could be applied to other species without modification (Table S1). To validate the assays for use with human serum samples, purified recombinant full-length FLAG-tagged human sTnI, CKM, Myl3 and FABP3 were tested. SDS-PAGE analysis followed by silver staining (Figure S1A) and Western blot analysis (Figure S1B) to detect the FLAG tag confirmed both the purity and expected molecular weights of the target proteins. These proteins were subsequently tested in the muscle protein immunoassays as part of the assay validation.
Dilution linearity of the recombinant human proteins was observed between the concentrations of 160 and 5 ng/ml with FABP3, 320 and 5 ng/ml with Myl3, 250 and 2 ng/ml with sTnI and 200 and 6 ng/ml with CKM (Figure S1C). No cross-reactivity of the assays with the other purified proteins tested was observed (data not shown). The CKM assay did not detect the human creatine kinase B-type (CKB) protein (data not shown). Taken together this data confirms that these assays can be used to accurately and specifically measure human proteins sTnI, Myl3, FABP3 and CKM. All serum samples were diluted into the linear detection range of each assay for subsequentanalysis.
Circulating biomarker levels in muscular dystrophy
To begin to assess the utility of the muscle injury panel for monitoring disease progression in muscular dystrophy serum samples from 74 DMD, 38 BMD and 49 LGMD2B patients and 32 healthy controls were obtained (Table 1). While the control population included juveniles as well as younger and older adults to cover the range of the muscular dystrophy cohorts, it should be noted that the average age of the DMD and BMD cohorts is significantly different (P < 0.05) from the healthy controls while the LGMD2B cohort was not (data not shown). Standard clinical chemistry testing for total serum CK revealed significantly elevated average total CK levels for all three muscular dystrophy patient groups compared to healthy controls for this assay (Fig. 1A). The DMD patients showed the highest mean total serum CK (7443 ± 6357 U/L). This is consistent with the severe muscle damage and more rapid disease progression observed in DMD patients [1, 25]. This was followed by the LGMD2B (4342 ± 3518 U/L) and the BMD (3108 ± 4007 U/L) patient groups, whereas the healthy volunteers group had an average serum CK activity of 109 ± 57.61 U/L. Compared to the healthy control group the mean total serum CK activity was elevated 28 fold over controls in BMD patients, 40 fold in LGMD2B patients and 68 fold in DMD patients. Also, as has previously been reported, average serum AST and ALT levels were also elevated above the healthy volunteer controls for these analytes in all three patient populations [26, 27].
The serum concentrations of sTnI, Myl3, CKM and FABP3 were determined in the muscular dystrophy patients’ samples and healthy controls. While measurable amounts of FABP3 and CKM were detected in the serum of all the healthy controls, the serum concentrations were below the lower limit of quantitation for all of the subjects for sTnI and 22 of the subjects for Myl3. In these cases, the concentration for the lower limit of quantitation of the assays was reported for the samples. The mean serum concentrations of all four proteins were significantly elevated in the muscular dystrophy patient cohorts when compared to controls (Fig. 1B). Consistent with the total serum CK levels, the serum concentrations of all four markers were most elevated in the DMD patient group, followed by LGMD2B and BMD. Because the sTnI and Myl3 levels in many of the controls were below the limit of quantitation of the assay we could not accurately calculate the fold change over controls for those markers. For CKM the fold-change in mean serum levels over controls were 17-fold for BMD, 88-fold for DMD and 37-fold for LGMD2B. Similarly FABP3 levels were ninefold over mean controls levels in BMD, 13-fold in DMD and 12-fold in LGMD2B. Comparisons among the different types of muscular dystrophy (Table S2) revealed significantly elevated mean serum concentrations of sTnI (P < 0.0001) and CKM (P < 0.01) in DMD patients relative to the levels measured in BMD patients, but when comparing the levels between the DMD and LGMD2B cohorts only sTnI showed a statistically significant (P < 0.05) difference. With the LGMD2B patients, however, both sTnI and FABP3 levels were significantly elevated (P < 0.05) over that measured in BMD patients.
As noted previously the amino acid sequences of sTnI, Myl3, FABP3 and CKM are highly conserved between rodent, canine and human. This suggested these biomarker assays may also be directly applicable to the most commonly used preclinical models of muscular dystrophy, the mdx mouse and the golden retriever muscular dystrophy (GRMD) canine model [28]. In the mdx model all four biomarker concentrations were significantly elevated (P < 0.001) in serum from adult mdx mice (N = 10) when compared to age-matched wild-type controls (N = 9, Figure S2). sTnI had the greatest fold increase in the mean serum concentration in the mdx mouse when compared wild-type controls (124 fold), followed by Myl3 (9.7-fold), CKM (8.8-fold) and FABP3 (3-fold,). All marker serum levels were significantly increased (P < 0.0001) in GRMD affected dogs (Supplementary Figure S3), but a comparison of the mean biomarker serum concentrations in GRMD canines (N = 5) to unaffected controls (N = 7) revealed that CKM had the greatest fold increase (1,331-fold), followed by sTnI (727-fold), Myl3 (98.7-fold) and FABP3 (3.1-fold).
Effect of disease progression and treatment in DMD patients
In DMD patients loss of ambulation typically occurs between 7 and 12 years old [1]. The effect of ambulatory status of the DMD patients on the biomarker levels was investigated. Twenty-nine of the DMD patients (39%) in this study were non-ambulant. The non-ambulant DMD patients had significantly lower levels of total serum CK activity and sTnI, Myl3, FABP3 and CKM concentrations when compared to the 46 ambulant DMD patients (Fig. 2A). BMD and LGMD2B patients can remain ambulant into late adulthood [1, 5] so the number of non-ambulant BMD (N = 9) and LGMD2B (N = 16) patients was small, but like the DMD patients, the non-ambulant patients had significantly lower biomarker levels and total serum CK activity when compared to the ambulant patients (data not shown).
As DMD patients get older the majority eventually develops cardiomyopathy [29]. Twenty-eight of the DMD patients (38%) were classified as having cardiac symptoms based on a reduction in ejection fraction (<55%) or ongoing treatment for cardiomyopathy. The mean serum levels of all four muscle protein biomarkers and total serum CK levels were significantly lower in the patients with cardiac symptoms when compared to those without (Fig. 2B). It should be noted that 82% (N = 23) of the patients with cardiac symptoms were also non-ambulant. Also, for those patients with cardiac symptoms where respiratory function was measured at the time of blood draw (N = 26) the mean FVC was 46.9 ± 25.4% compared to 84.2 ± 23.0% for the DMD patients with no noted cardiac symptoms (N = 35).
Corticosteroids are the most commonly prescribed drugs for the treatment of DMD and BMD [30]. Sixty-two of the DMD patients (83%) in the sample set were being treated with either deflazacort or prednisolone. There was no significant difference in the mean serum levels of the muscle protein biomarkers or serum CK activity between the patients being treated with steroids and those not taking steroids at the time of evaluation (Figure S4). This data suggests steroid treatment does not have a strong effect on the circulating levels of the investigated muscle proteins, but it should be noted that the number of DMD patients in this study not actively being treated with steroids was small (N = 11).
A subset of the DMD patients (N = 26) in this study had a follow-up evaluation an average of 11.2 ± 3.3 months after the initial examination and serum samples were taken again. Of these patients 20 had FVC measurements and 24 had NSAA scores measured at the time of the follow-up. We analyzed these repeated measures both as a single group (data not shown) and after separating the samples into three age groups (Fig. 3). While the age groups show a trend of decreasing circulating levels of all the biomarkers there were no significant changes in the biomarker levels or total serum CK (data not shown) between the times of the serial blood collection in either the single cohort or age group analysis. Additionally, correlation analysis of the paired differences in serum muscle protein biomarker levels and FVC and North Star score between the two timepoints indicated no statistically significant associations (data not shown).
Correlation of serum biomarkers with clinical evaluations
Numerous clinical tests are used to evaluate disease progression in muscular dystrophy patients [12]. FVC is a clinical measure of respiratory function that has been shown to be a prognostic indicator in DMD [31]. The NSAA is a clinical scale designed to measure the functional ability of ambulant DMD patients [32]. These two clinical assessments were conducted at the time of blood collection for the majority of the patients comprising the DMD sample set. To assess the utility of sTnI, Myl3, CKM or FABP3 as serum biomarkers of disease progression in DMD patients the correlation of the serum concentrations of these markers and the total CK activity to FVC and the NSAA score was determined. The serum concentrations of all four muscle protein biomarkers and the total serum CK activity showed statistically significant (p < 0.0001) and biologically relevant (r > 0.6) positive correlation with FVC (Fig. 4A). There was no significant correlation with the NSAA score when only ambulant patients (N = 32) were analyzed (Fig. 4B). If, however, the non-ambulant patients, whose NSAA score would be classified as zero, were included in the analysis (N = 61) there was a strong and statistically significant positive correlation (r > 0.6, p < 0.0001) between the NSAA score and the serum concentrations of the biomarkers (Figure S5).
FVC was also measured for the BMD patients at the time of blood sampling. Analysis of this data, however, revealed no statistically significant correlation between FVC and sTnI, CKM or total serum CK activity(Figure S6). There was a weak correlation between FVC and Myl3 (r = –0.35, p = 0.04) and FABP3 (r = –0.36, p = 0.033), but, interestingly, this correlation was negative, in contrast to the strong positive correlation observed in the DMD patients.
For a majority of the LGMD2B patients numerous clinical evaluations were conducted at the time of blood sampling evaluation, including FVC (N = 47) and the time required to walk ten meters (N = 31). Like for the BMD patients, none of the serum concentrations of the biomarkers or the serum CK activity correlated with the FVC in the LGMD2B patients (Fig. 5A). Similarly, sTnI, FABP3 and CKM serum concentrationsand serum CK activity did not correlate with the time to walk 10 m in these patients (Fig. 5B). The correlation Myl3 with the time to walk 10 m was stronger (r = 0.36, p = 0.045) than those determined for the other markers, but was still a weak association.
Effect of age on biomarker levels
Previous reports have noted a consistent decline in serum CK activity with age in dystrophinopathy patients [25, 33, 34]. Serum CK levels peak in early childhood for both DMD and BMD patients and then decline at a rate of approximately 18% per year in DMD patients and 6% per year in BMD patients [25]. Analysis of CK activity versus age for the DMD, BMD and LGMD2B patient populations assayed here closely match these previously reported observations (Fig. 6 A, B and C). It should be noted that age or birthdate information was not available for thirteen DMD patients, leaving sixty-one subjects for this analysis. All four muscle protein biomarkers also followed a similar trend of steady decline that significantly correlated with age (data not shown) in DMD, BMD and LGMD2B patients. Two possible exceptions to this trend were Myl3 and FABP3 in BMD patients over sixty years of age, where serum concentrations of these proteins remained elevated, but the number of patients in this age range was very small (N = 4). Finally, the approximate annual rates of decline for each biomarker were calculated (Table S3). The annual rate of decrease in total serum CK activity of approximately 18.2 ± 1.4% per year in the DMD patients closely matched that reported previously [25]. All the biomarkers and CK showed the most rapid rate of decline in DMD patients followed by LGMD2B and BMD patients. Serum CK activity and CKM had the most rapid rate of decline in all three patient populations. FABP3 showed the slowest annual rate of decline in DMD and BMD patients, at 10.2 ± 1.2% and 0.1 ± 0.5% , respectively. In LGMD2B patients, however, Myl3 levels declined at the slowest rate at approximately 2.0 ± 0.5% per year.
DISCUSSION
To aid the development of the next generation of therapies for muscular dystrophy new clinical tools are needed to monitor disease progression and the response to treatment. Recent reports have used proteomics approaches to identify serum biomarkers of muscular dystrophy [14, 23]. Interestingly, but, perhaps not surprisingly, most of the proteins identified by these previous studies as significantly different between healthy control and muscular dystrophy patient cohorts were of muscle origin. Here we have investigated the serum concentrations of four proteins that are abundantly expressed in skeletal muscle in DMD, BMD and LGMD2B patients as potential biomarkers of muscular dystrophy.
Serum concentrations of sTnI, Myl3, FABP3 and CKM were all significantly elevated in DMD, BMD and LGMD2B patients when compared to serum from healthy controls. The fold increase in average serum concentrations for all markers when comparing the muscular dystrophy patients to the healthy controls suggests they would provide a good dynamic range for non-invasively measuring the outcome of a therapeutic intervention. The fact that significantly elevated serum concentrations were also observed in the mdx mouse and GRMD canine suggest these biomarkers could be used as translational biomarkers for drug development. We did not have ready access to an animal model of dysferlinopathy for this study, but future testing of these biomarkers in the SJL or A/J mouse could extend these observations to a relevant preclinical model of LGMD2B [35].
Total serum CK activity was also significantly elevated in all three muscular dystrophy patient populations, but there are a number of potential advantages the markers presented here afford. First, based on the pattern of tissue expression, CKM and sTnI, in particular,are potentially more specific markers of skeletal muscle injury than total serum CK. This is because cytosolic CK is a dimer composed of either the creatine kinase, muscle type (CKM) or creatine kinase, brain type (CKB). The total serum CK assay measures the enzymatic activity of all CK isoenzymes including the CK-MM homodimer, predominately expressed in skeletal muscle, the CK-MB homodimer, principally released from cardiomyocytes, and CK-BB, expressed in the brain and at lower levels in numerous other tissues [13, 36]. Therefore, as has been noted by other researchers and clinicians, total serum CK cannot be used to independently distinguish between skeletal muscle and cardiac damage or can be elevated due to medical conditions not directly related to muscle disease [37]. Additionally, whereas serum CK activity can be affected by low serum glutathione levels and interactions with certain classes of drugs [15, 38], these factors would, most likely, have less of an impact on an ELISA-based assay.
The clinical information available for the DMD patients allowed further analysis of the effect of disease progression and treatment on the biomarker levels. Ambulant patients had significantly higher serum concentrations of all four biomarkers and total serum CK activity than non-ambulant patients. This is consistent with the long-standing observation that serum CK level increase with physical activity in ambulant DMD patients [39]. This could be due to an increase in the rate of release due to contraction or the presence of relatively more muscle mass in ambulant versus non-ambulant patients [25]. DMD patients without cardiomyopathy also had significantly higher serum concentrations of all four biomarkers and serum CK. But since the majority of patients with cardiomyopathy were also non-ambulant it wasn’t possible to determine if cardiomyopathy alone was a factor in the serum biomarker levels observed. Finally, there was no significant difference in the serum biomarkers or CK activity of DMD patients on or off corticosteroid therapy, which is perhaps surprising given the improvement in muscle pathology and rate of disease progression observed with treatment [30]. A limiting factor in this analysis, however, is the fact that the number of DMD patients not being treated with corticosteroids was small (N = 11). Also, the multiple mechanisms of action proposed for corticosteroid therapy [40] could conceivably be expected to both increase (i.e. increased muscle mass) and decrease (i.e. reduced inflammation) the release of muscle-derived proteins into circulation. Ultimately, the utility of these biomarkers for monitoring the response to a therapy will have to be determined on a case-by-case basis.
While it was a bit surprising there was no significant change detected in the biomarker levels in the subset of DMD patients where serial samples were collected, there are a number of possible reasons for this. First, although the average time between blood samples was approximately a year the range was wide (3.9–18.4 months). Also, although our data indicates the average serum concentrations of the biomarkers decrease approximately 10–19% per year there is probably a wide range in this rate of decline in individual patients and, as our data suggests, at different stages of the disease. A follow-up longitudinal study where blood samples are consistently collected a year or more apart will be needed to address this aspect of the study more thoroughly.
FVC is a clinical measure that provides a quantitative assessment of weakness in the respiratory muscles and is a prognostic biomarker in DMD patients [31]. We showed that sTnI, Myl3, FABP3 and CKM have a significant positive correlation with FVC in the DMD patient population, supporting their utility as a non-invasive biomarker for monitoring respiratory muscle weakness. Interestingly, this correlation with FVC did not extend to the BMD, indicating the serum biomarkers may not have utility in monitoring progressive muscle weakness in this patient population. It should be noted, though, that disease progression and the involvement of the respiratory muscles is much slower and more variable in BMD than DMD [41]. The same lack of correlation between the biomarker levels and FVC was also seen in the LGMD2B patients, but this result fits with the clinical observation that LGMD2B does not typically affect the respiratory muscles [4].
Correlation analysis of other functional clinical endpoints also gave mixed results. The NSAA score is a clinical test that measures the ability of DMD patients to independently perform a series of mobility tests [32]. In the DMD patients, there was no significant correlation of the biomarker levels or total serum CK with the NSAA score, but this only allowed the analysis of a minority (N = 32) of the DMD patients in the study. It’s worth noting that a similar lack of correlation between this NSAA and other proposed muscular dystrophy serum biomarkers has been reported including multiple miRNA [18], MMP-9 and TIMP-1 [21], which may indicate that this clinical assessment has limited utility when evaluating the value of serum biomarkers. Similarly, sTnI, CKM and FABP3 did not correlate with the clinical test of the time to walk 10 m in the LGMD2B patients. The correlation of Myl3 with the 10 m walk test, though weak, suggests it might have utility as a non-invasive biomarker of muscle performance in LGMD2B patients. Future studies with a larger sample size and, ideally, longitudinal data would be needed to confirm this observation.
A person’s muscle mass is one significant factor influencing total serum CK levels [36], in that the total mass would impact the amount of creatine kinase protein available for release into circulation upon muscle injury. Although we have not specifically analyzed the effect of muscle mass on sTnI, CKM, FABP3 and Myl3 serum concentrations here it would be expected to have a similar impact. It is indirectly reflected in the observation that the serum concentrations of the biomarkers decrease with age within the three muscular dystrophy populations, since muscle mass decreases with disease progression [1]. Age is also a potential confounding factor for these biomarkers. We evaluated age as a covariate and found it collinear with the clinical endpoints. The clinical endpoints are more relevant to disease status and biomarker changes so age was excluded from the models to avoid confounding. These observations have implications for the interpretation of changes in the serum concentrations of the biomarkers in monitoring disease progression or the response to therapeutic intervention since a reduction in the levels in a particular patient could reflect improved muscle integrity and the slowing of disease progression or, conversely, the continued loss of muscle mass due to disease progression or aging. Also, recent physical activity can rapidly and dramatically increase total serum CK activity [36]. The observation that ambulant patients have significantly higher serum concentrations of all four biomarkers suggests that physical activity is a factor for them as well, although further work will be needed to understand the magnitude and timing of the release of the proteins into circulation after exercise.
There were some notable differences in the characteristics of the serum biomarker in the different forms of muscular dystrophy. First, in DMD patients CKM showed the greatest fold increase in serum concentration relative to the healthy controls, whereas in BMD and LGMD2B it was Myl3. The strong correlation between the four biomarkers and FVC in DMD, but the lack of correlation in BMD, while puzzling, suggest disease-dependent differences in the release or elimination of the biomarker proteins in circulation despite a decline in muscle function. Also, the analysis of the annual rate of decline of the biomarkers serum concentrations with age showed that while CKM declined the most rapidly and FABP3 the least rapidly in DMD and BMD, in the LGMD2B patient population FABP3 declined at a rate slightly greater than CKM. A follow-up longitudinal study would be needed to investigate this observation further.
The different biomarker profiles in the three muscular dystrophies studied here suggest different mechanisms regulating the release of the proteins into circulation. As has been suggested by other researchers, the release of myofibrillar proteins, such as myosin light chain and the troponins, likely involves proteolytic cleavage during inflammation and necrosis, whereas cytoplasmic proteins, such as FABP3 and CK, could be more directly released into circulation through a rupture in the sarcolemma [23]. Also, the common assumption is that muscle-derived proteins are released into circulation from membrane tears caused by mechanical injury during muscle contraction. It follows, then, that the contents of muscle tissue with diminished integrity due to a lack of dystrophin or dysferlin expression would passively leak into circulation in greater amounts than healthy muscle. This “leaky” muscle argument has, however, been challenged by a number of researchers [13, 42]. In fact, studies comparing the repair of mdx and control wild-type muscle fibers showed no difference in their ability to reseal sarcolemma damage, whereas membrane resealing in muscle fibers from dysferlin deficient mice was delayed [43]. Recently it has been shown that myosin light chain 1 and 3 (MLC1-3), is exported from skeletal muscle via LAMP-1 positive vesicles in dystrophic muscle [44]. Taken together, this indicates the rate and mechanism by which muscle-derived proteins are released into circulation may be both biomarker and disease dependent.
Here we investigated the utility of measuring serum concentrations of sTnI, Myl3, FABP3 and CKM in DMD, BMD and LGMD2B patients. While this analysis revealed that these serum biomarkers still display some of the potential disadvantages of total serum CK activity, the potentially increased specificity for skeletal muscle injury and the correlation with clinical end-points in DMD and LGMD2B patients suggested that these biomarkers could be a valuable non-invasive tool for monitoring disease progression and therapeutic response, particularly when cardiomyopathy is present. Future work will be directed at determining if one or a panel of these biomarkers is particularly valuable for monitoring clinical outcomes in a subset of patients or for a particular therapeuticintervention.
CONFLICTS OF INTEREST
The authors have no conflicts of interest to report.
ETHICAL STANDARDS
All human and animal studies have been approved by the appropriate ethics committees. All persons gave their informed consent prior to inclusion in the study and all information about the participants was provided as anonymized data.
ACKNOWLEDGMENTS
We thank Dr. H. Lee Sweeney for the contribution of the GRMD serum samples. We also thank the Jain foundation for providing the LGMD2B patient samples and their helpful comments. We would also like to thank Dr. Lori Fitz, Dr. Peter Bialek, Dr. Michael Binks and Richard Giovanelli for guidance and helpful discussions. We would also like to thank Pfizer’s Worldwide Comparative Medicine Group and Shelli Schomaker for technical and logistical support for the mouse serum collection. The EU funded projects BIO-NMD (No.241665), Neuromics (No. 305121) and RD-Connect (305444) supported this work. The study was supported by the Medical Research Council (MRC) Centre for Neuromuscular Diseases Biobanks (Newcastle) which are part of EuroBioBank; we are grateful to Dan Cox and Mojgan Reza for technical support at the biobank and Karen Bettinson for support with phenotype data.
Appendices
The supplementary material is available in the electronic version of this article: http://dx.doi.org/10.3233/JND-140066.
REFERENCES
1 | Flanigan KM(2012) The muscular dystrophiesSeminars in Neurology32: 3255263 |
2 | Mendell JR, Shilling C, Leslie ND, Flanigan KM, al-Dahhak R, Gastier-Foster J(2012) Evidence-based path to newborn screening for Duchenne muscular dystrophyAnnals of Neurology71: 3304313 |
3 | Davies KE(1997) Challenges in Duchenne muscular dystrophyNeuromuscular disorders: NMD7: 8482486 |
4 | Laval SH, Bushby KM(2004) Limb-girdle muscular dystrophies–from genetics to molecular pathologyNeuropathology and Applied Neurobiology30: 291105 |
5 | Walter MC, Reilich P, Thiele S, Schessl J, Schreiber H, Reiners K(2013) Treatment of dysferlinopathy with deflazacort: A double-blind, placebo-controlled clinical trialOrphanet Journal of Rare Diseases8: 26 |
6 | Leung DG, Wagner KR(2013) Therapeutic advances in muscular dystrophyAnnals of Neurology74: 3404411 |
7 | McDonald CM, Henricson EK, Abresch RT, Han JJ, Escolar DM, Florence JM(2013) The cooperative international neuromuscular research group Duchenne natural history study–a longitudinal investigation in the era of glucocorticoid therapy: Design of protocol and the methods usedMuscle & Nerve48: 13254 |
8 | Ricotti V, Ridout DA, Scott E, Quinlivan R, Robb SA, Manzur AY(2013) Long-term benefits and adverse effects of intermittent versus daily glucocorticoids in boys with Duchenne muscular dystrophyJournal of Neurology, Neurosurgery, and Psychiatry84: 6698705 |
9 | Malik V, Rodino-Klapac LR, Mendell JR(2012) Emerging drugs for Duchenne muscular dystrophyExpert Opinion on Emerging Drugs17: 2261277 |
10 | Bushby K, Connor E(2011) Clinical outcome measures for trials in Duchenne muscular dystrophy: Report from International Working Group meetingsClinical Investigation1: 912171235 |
11 | Govoni A, Magri F, Brajkovic S, Zanetta C, Faravelli I, Corti S(2013) Ongoing therapeutic trials and outcome measures for Duchenne muscular dystrophyCellular and molecular life sciences: CMLS70: 2345854602 |
12 | Lynn S, Aartsma-Rus A, Bushby K, Furlong P, Goemans N, De Luca A(2014) Measuring clinical effectiveness of medicinal products for the treatment of Duchenne muscular dystrophyNeuromuscular Disorders: NMD |
13 | Ozawa E, Hagiwara Y, Yoshida M(1999) Creatine kinase, cell membrane and Duchenne muscular dystrophyMolecular and Cellular Biochemistry190: 1-2143151 |
14 | Ayoglu B, Chaouch A, Lochmuller H, Politano L, Bertini E, Spitali P(2014) Affinity proteomics within rare diseases: A BIO-NMD study for blood biomarkers of muscular dystrophiesEMBO Molecular Medicine6: 7918936 |
15 | Gunst JJ, Langlois MR, Delanghe JR, De Buyzere ML, Leroux-Roels GG(1998) Serum creatine kinase activity is not a reliable marker for muscle damage in conditions associated with low extracellular glutathione concentrationClinicalChemistry44: 5939943 |
16 | Cacchiarelli D, Legnini I, Martone J, Cazzella V, D’Amico A, Bertini E(2011) miRNAs as serum biomarkers for Duchenne muscular dystrophyEMBO Molecular Medicine3: 5258265 |
17 | Hu J, Kong M, Ye Y, Hong S, Cheng L, Jiang L(2014) Serum miR-206 and other muscle-specific microRNAs as non-invasive biomarkers for Duchenne muscular dystrophyJournal of Neurochemistry129: 5877883 |
18 | Zaharieva IT, Calissano M, Scoto M, Preston M, Cirak S, Feng L(2013) Dystromirs as serum biomarkers for monitoring the disease severity in Duchenne muscular DystrophyPloS One8: 11e80263 |
19 | Li X, Li Y, Zhao L, Zhang D, Yao X, Zhang H(2014) Circulating Muscle-specific miRNAs in Duchenne Muscular Dystrophy PatientsMolecular Therapy Nucleic Acidse3: 177 |
20 | Cynthia Martin F, Hiller M, Spitali P, Oonk S, Dalebout H, Palmblad M(2014) Fibronectin is a serum biomarker for Duchenne muscular dystrophyProteomics Clinical Applications8: 3-4269278 |
21 | Nadarajah VD, van Putten M, Chaouch A, Garrood P, Straub V, Lochmuller H(2011) Serum matrix metalloproteinase-9 (MMP-9) as a biomarker for monitoring disease progression in Duchenne muscular dystrophy (DMD)Neuromuscular Disorders: NMD21: 8569578 |
22 | Rouillon J, Zocevic A, Leger T, Garcia C, Camadro JM, Udd B(2014) Proteomics profiling of urine reveals specific titin fragments as biomarkers of Duchenne muscular dystrophyNeuromuscular Disorders: NMD24: 7563573 |
23 | Hathout Y, Marathi RL, Rayavarapu S, Zhang A, Brown KJ, Seol H(2014) Discovery of serum protein biomarkers in the mdx mouse model and cross-species comparison to Duchenne muscular dystrophy patientsHuman Molecular Genetics |
24 | Dowling P, Holland A, Ohlendieck K(2014) Mass Spectrometry-Based Identification of Muscle-Associated and Muscle-Derived Proteomic Biomarkers of DystrophinopathiesJournal of Neuromuscular Diseases1: 11540 |
25 | Zatz M, Rapaport D, Vainzof M, Passos-Bueno MR, Bortolini ER, Pavanello Rde C(1991) Serum creatine-kinase (CK) and pyruvate-kinase (PK) activities in Duchenne (DMD) as compared with Becker (BMD) muscular dystrophyJournal of the Neurological Sciences102: 2190196 |
26 | McMillan HJ, Gregas M, Darras BT, Kang PB(2011) Serum Transaminase Levels in Boys With Duchenne and Becker Muscular DystrophyPediatricse127: 1e132e136 |
27 | Veropalumbo C, Del Giudice E, Esposito G, Maddaluno S, Ruggiero L, Vajro P(2012) Aminotransferases and muscular diseases: A disregarded lesson. Case reports and review of the literatureJournal of Paediatrics and Child Health48: 10886890 |
28 | Willmann R, Possekel S, Dubach-Powell J, Meier T, Ruegg MA(2009) Mammalian animal models for Duchenne muscular dystrophyNeuromuscular Disorders: NMD19: 4241249 |
29 | Spurney C, Shimizu R, Morgenroth LP, Kolski H, Gordish-Dressman H, Clemens PR(2014) Cooperative International Neuromuscular Research Group Duchenne Natural History Study demonstrates insufficient diagnosis and treatment of cardiomyopathy in Duchenne muscular dystrophyMuscle & Nerve50: 2250256 |
30 | Angelini C, Peterle E(2012) Old and new therapeutic developments in steroid treatment in Duchenne muscular dystrophyActa myologica: Myopathies and cardiomyopathies: Official journal of the Mediterranean Society of Myology / edited by the Gaetano Conte Academy for the Study of Striated Muscle Diseases31: 1915 |
31 | Phillips MF, Quinlivan RC, Edwards RH, Calverley PM(2001) Changes in spirometry over time as a prognostic marker in patients with Duchenne muscular dystrophyAmerican Journal of Respiratory and Critical Care Medicine164: 1221912194 |
32 | Scott E, Eagle M, Mayhew A, Freeman J, Main M, Sheehan J(2012) Development of a functional assessment scale for ambulatory boys with Duchenne muscular dystrophyPhysiotherapy research international: The Journal for Researchers and Clinicians in Physical Therapy17: 2101109 |
33 | Brooke MH, Fenichel GM, Griggs RC, Mendell JR, Moxley R, Miller JP(1983) Clinical investigation in Duchenne dystrophy: 2Determination of the “power” of therapeutic trials based on thenatural history. Muscle & Nerve6: 291103 |
34 | Pernice W, Guggolz MA, Guggolz M, Beckmann R, Wais U(1986) Amathematical analysis of creatine kinaseactivity in the course of Duchenne muscular dystrophyMuscle &Nerve9: 4333340 |
35 | Kobayashi K, Izawa T, Kuwamura M, Yamate J(2012) Dysferlin and animal models for dysferlinopathyJournal of Toxicologic Pathology25: 2135147 |
36 | Brancaccio P, Maffulli N, Limongelli FM(2007) Creatine kinase monitoring in sport medicineBritish Medical Bulletin 81-82: 209230 |
37 | Walker DB(2006) Serum chemical biomarkers of cardiac injury for nonclinical safety testingToxicologic Pathology34: 194104 |
38 | Rosalki SB(1998) Low serum creatine kinase activityClinical Chemistry44: 5905 |
39 | Florence JM, Fox PT, Planer GJ, Brooke MH(1985) Activity, creatine kinase, and myoglobin in Duchenne muscular dystrophy: A clue to etiology? Neurology35: 5758761 |
40 | Angelini C(2007) The role of corticosteroids in muscular dystrophy: A critical appraisalMuscle & Nerve36: 4424435 |
41 | Shahrizaila N, Kinnear WJM, Wills AJ(2006) Respiratory involvement in inherited primary muscle conditionsJournal of Neurology, Neurosurgery, and Psychiatry77: 1011081115 |
42 | Allen DG, Whitehead NP(2011) Duchenne muscular dystrophy–what causes the increased membrane permeability in skeletal muscle? The International Journal of Biochemistry & Cell Biology43: 3290294 |
43 | Bansal D, Miyake K, Vogel SS, Groh S, Chen CC, Williamson R(2003) Defective membrane repair in dysferlin-deficient muscular dystrophyNature 423168172 |
44 | Duguez S, Duddy W, Johnston H, Laine J, Le Bihan MC, Brown KJ(2013) Dystrophin deficiency leads to disturbance of LAMP1-vesicle-associated protein secretionCellular and Molecular Life Sciences: CMLS70: 1221592174 |
Figures and Tables
Fig.1
Scatter plots of the serum clinical chemistry and protein serum concentrations in muscular dystrophy patients. (A) Total serum CK, AST and ALT levels and (B) serum concentrations of sTnI, Myl3, FABP3 and CKM for the DMD, BMD, LGMD2B patient groups and healthy controls are shown. The line and error bars represent the mean and standard deviation of each group. *** P < 0.001; **** P < 0.0001.
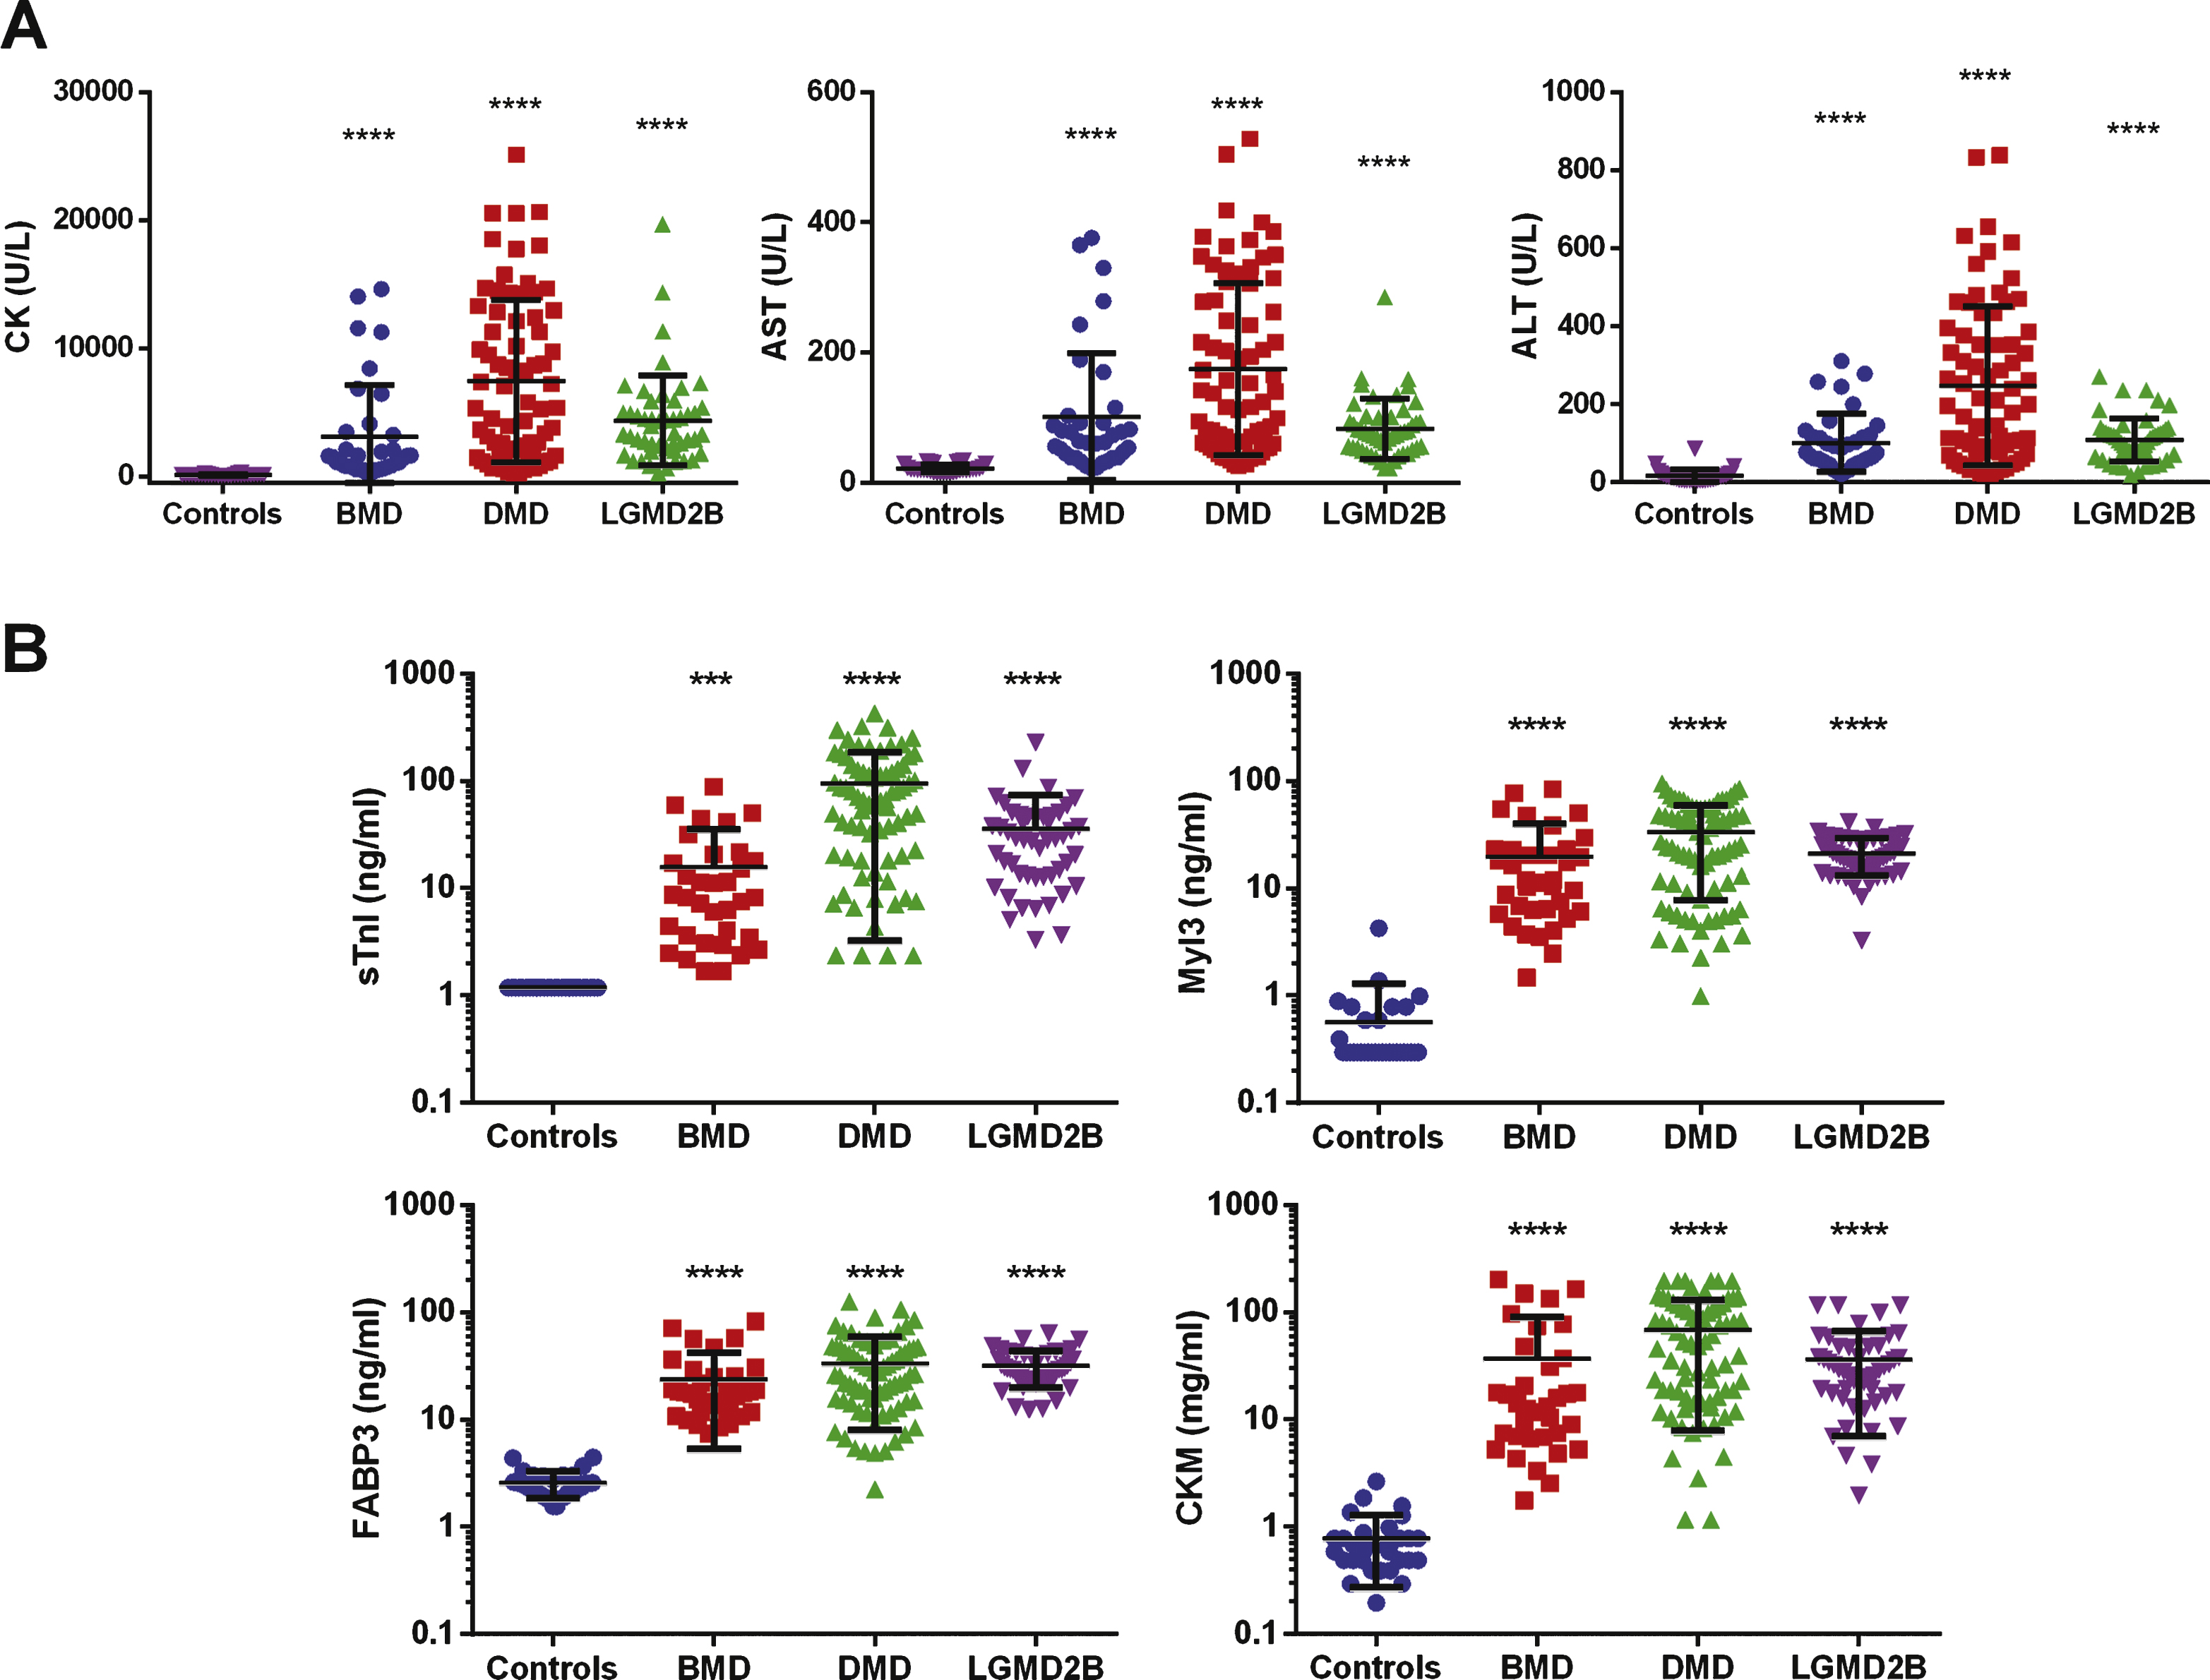
Fig.2
Scatter plots of the protein serum concentrations in DMD patients based on clinical status. Serum concentrations of sTnI, Myl3, FABP3, CKM and total CK in (A) ambulant (N = 46) and non-ambulant (N = 29) DMD patients or (B) those classified as with (N = 25) and without (N = 50) cardiomyopathy are shown. The line and error bars represent the mean and standard deviation of each group. **** P < 0.0001.
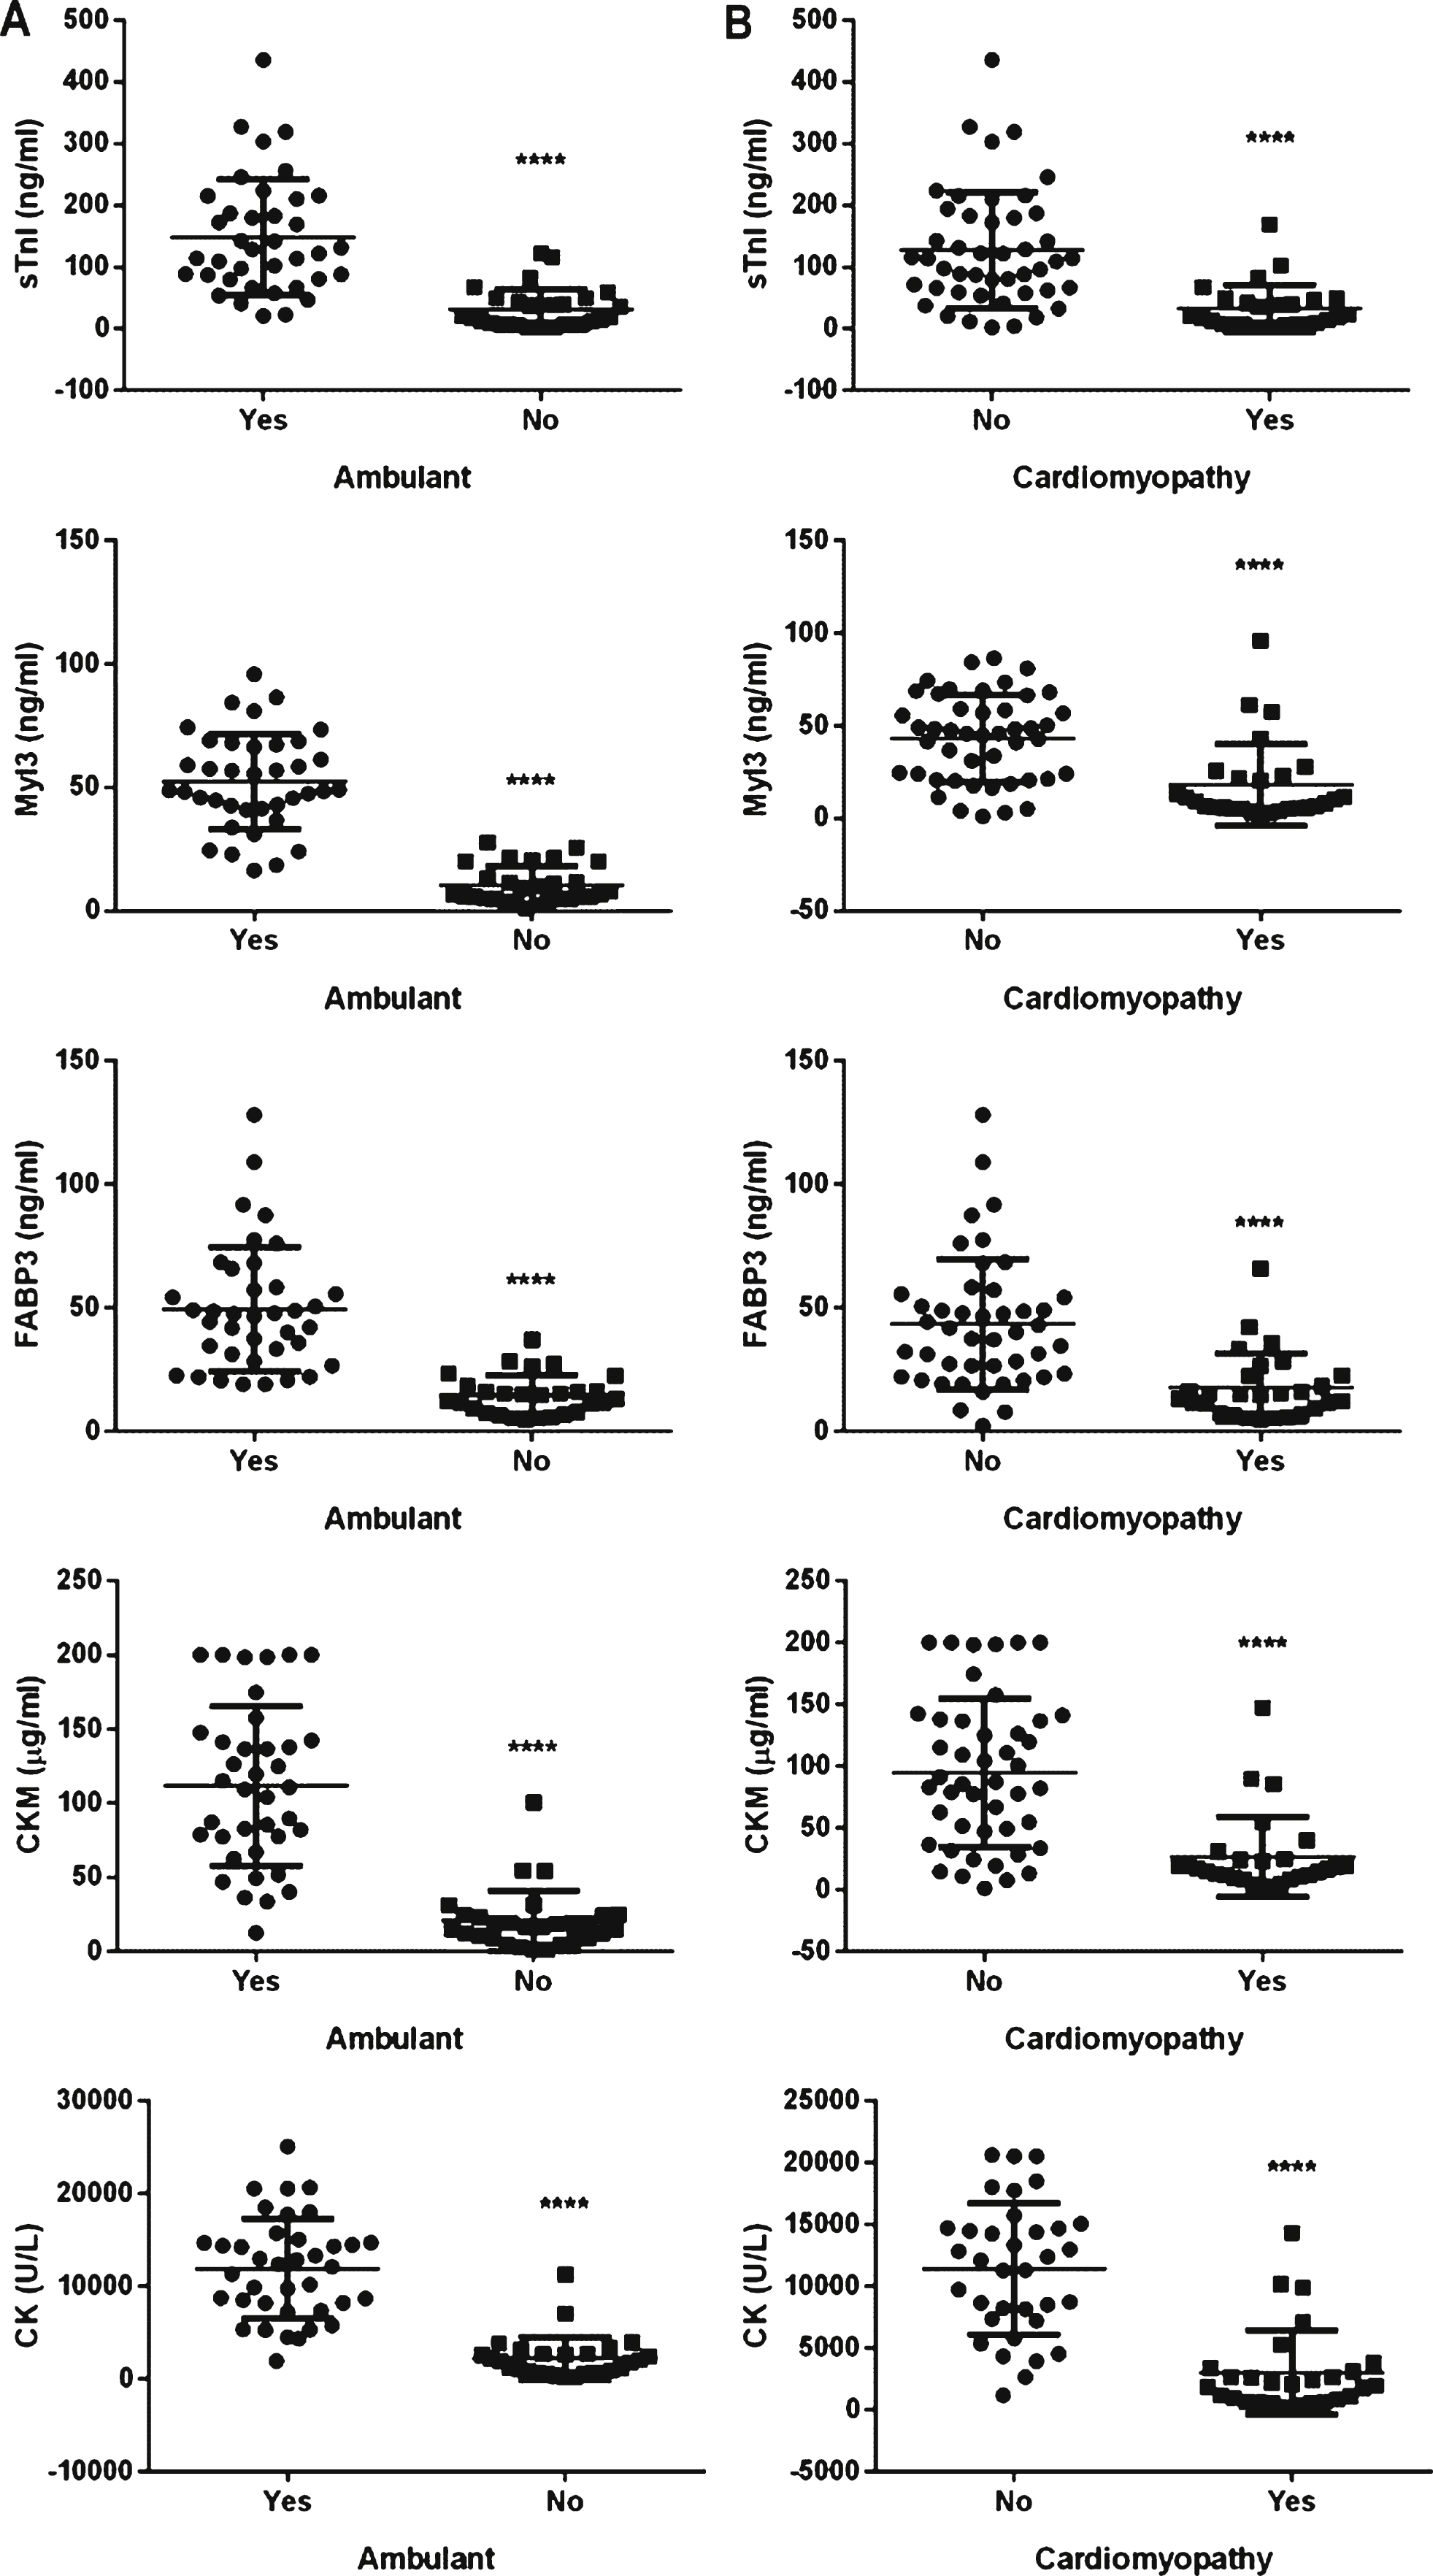
Fig.3
No significant change in patient’s serum biomarker concentrations taken approximately one year apart. Serum biomarker concentrations in serial blood samples from DMD patients (N = 26). Patients were grouped by age and individual serum biomarker concentrations from the initial (circles) and follow-up samples (squares) were plotted. P values (P) were calculated by two-way ANOVA. For age groups where no P values is given then P > 0.99 for that comparison.
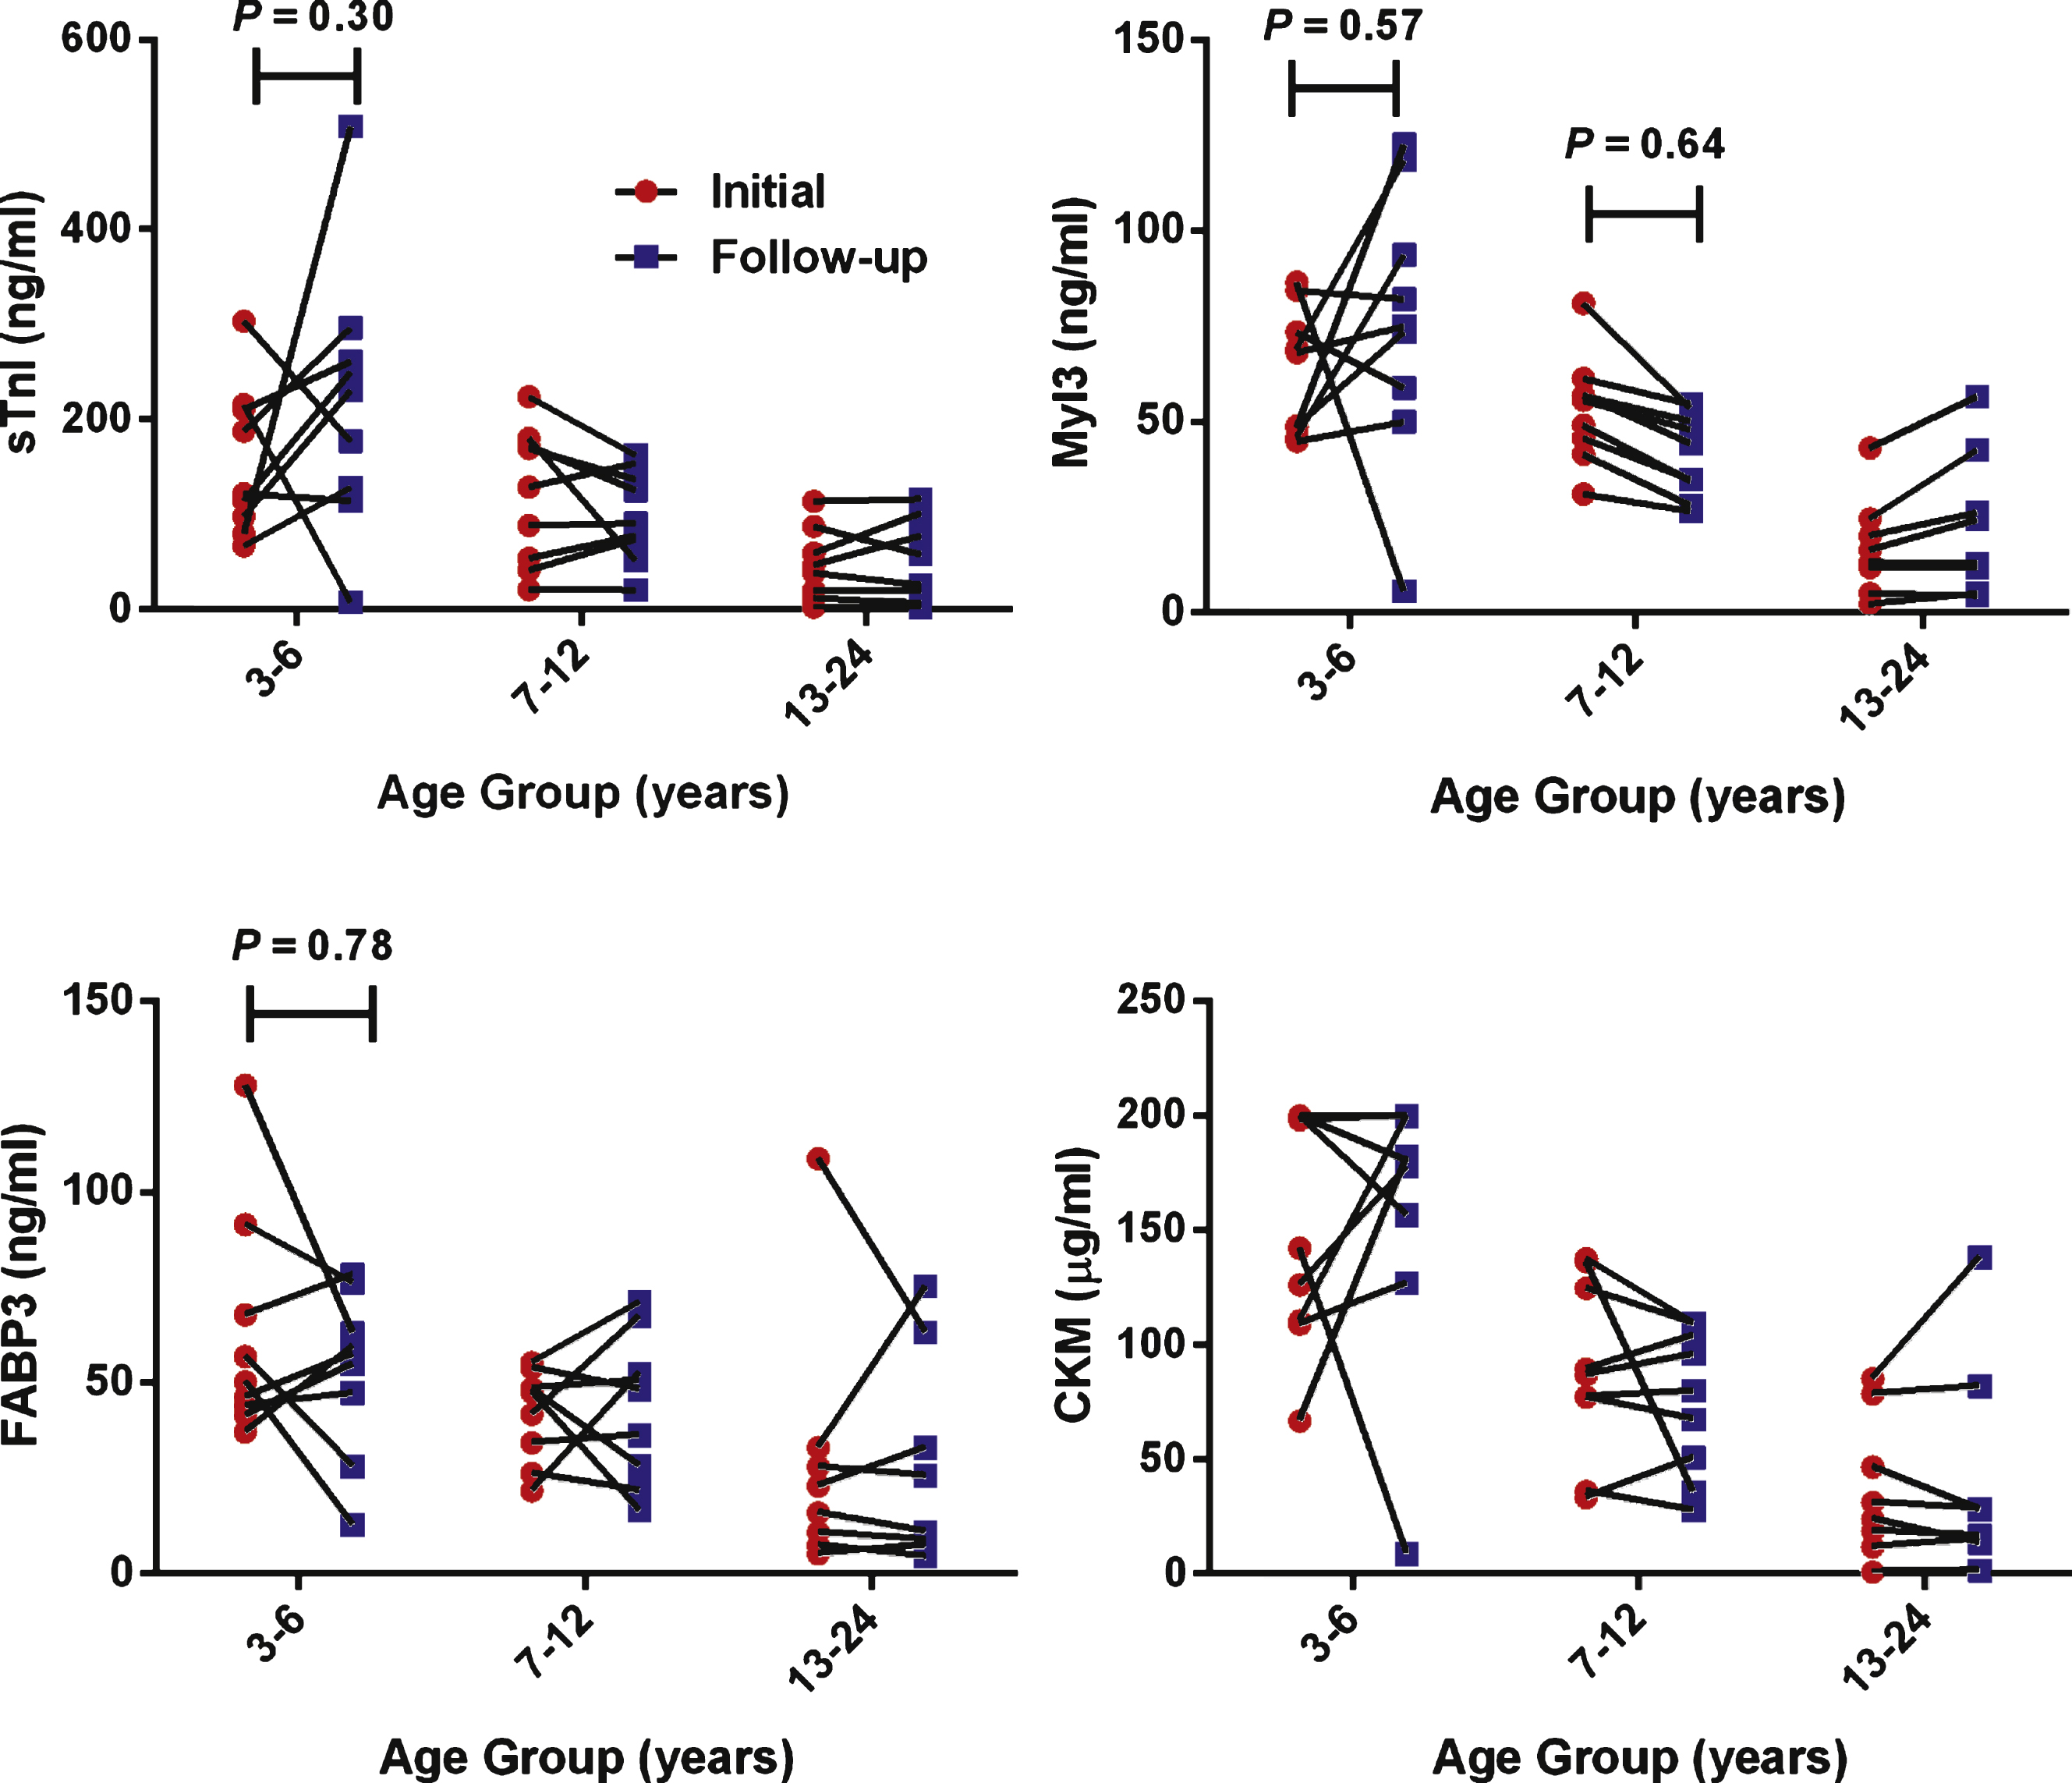
Fig.4
Correlations of protein serum concentration and clinical measures in DMD patients. A graph of (A) FVC measurement and (B) NSAA score versus the serum concentrations of sTnI, Myl3, FABP3, CKM and total serum CK for each DMD patient. The Spearman’s rank-order correlation coefficient (r), P value (P) and number of patients in the sample set (N) is shown for each analysis.
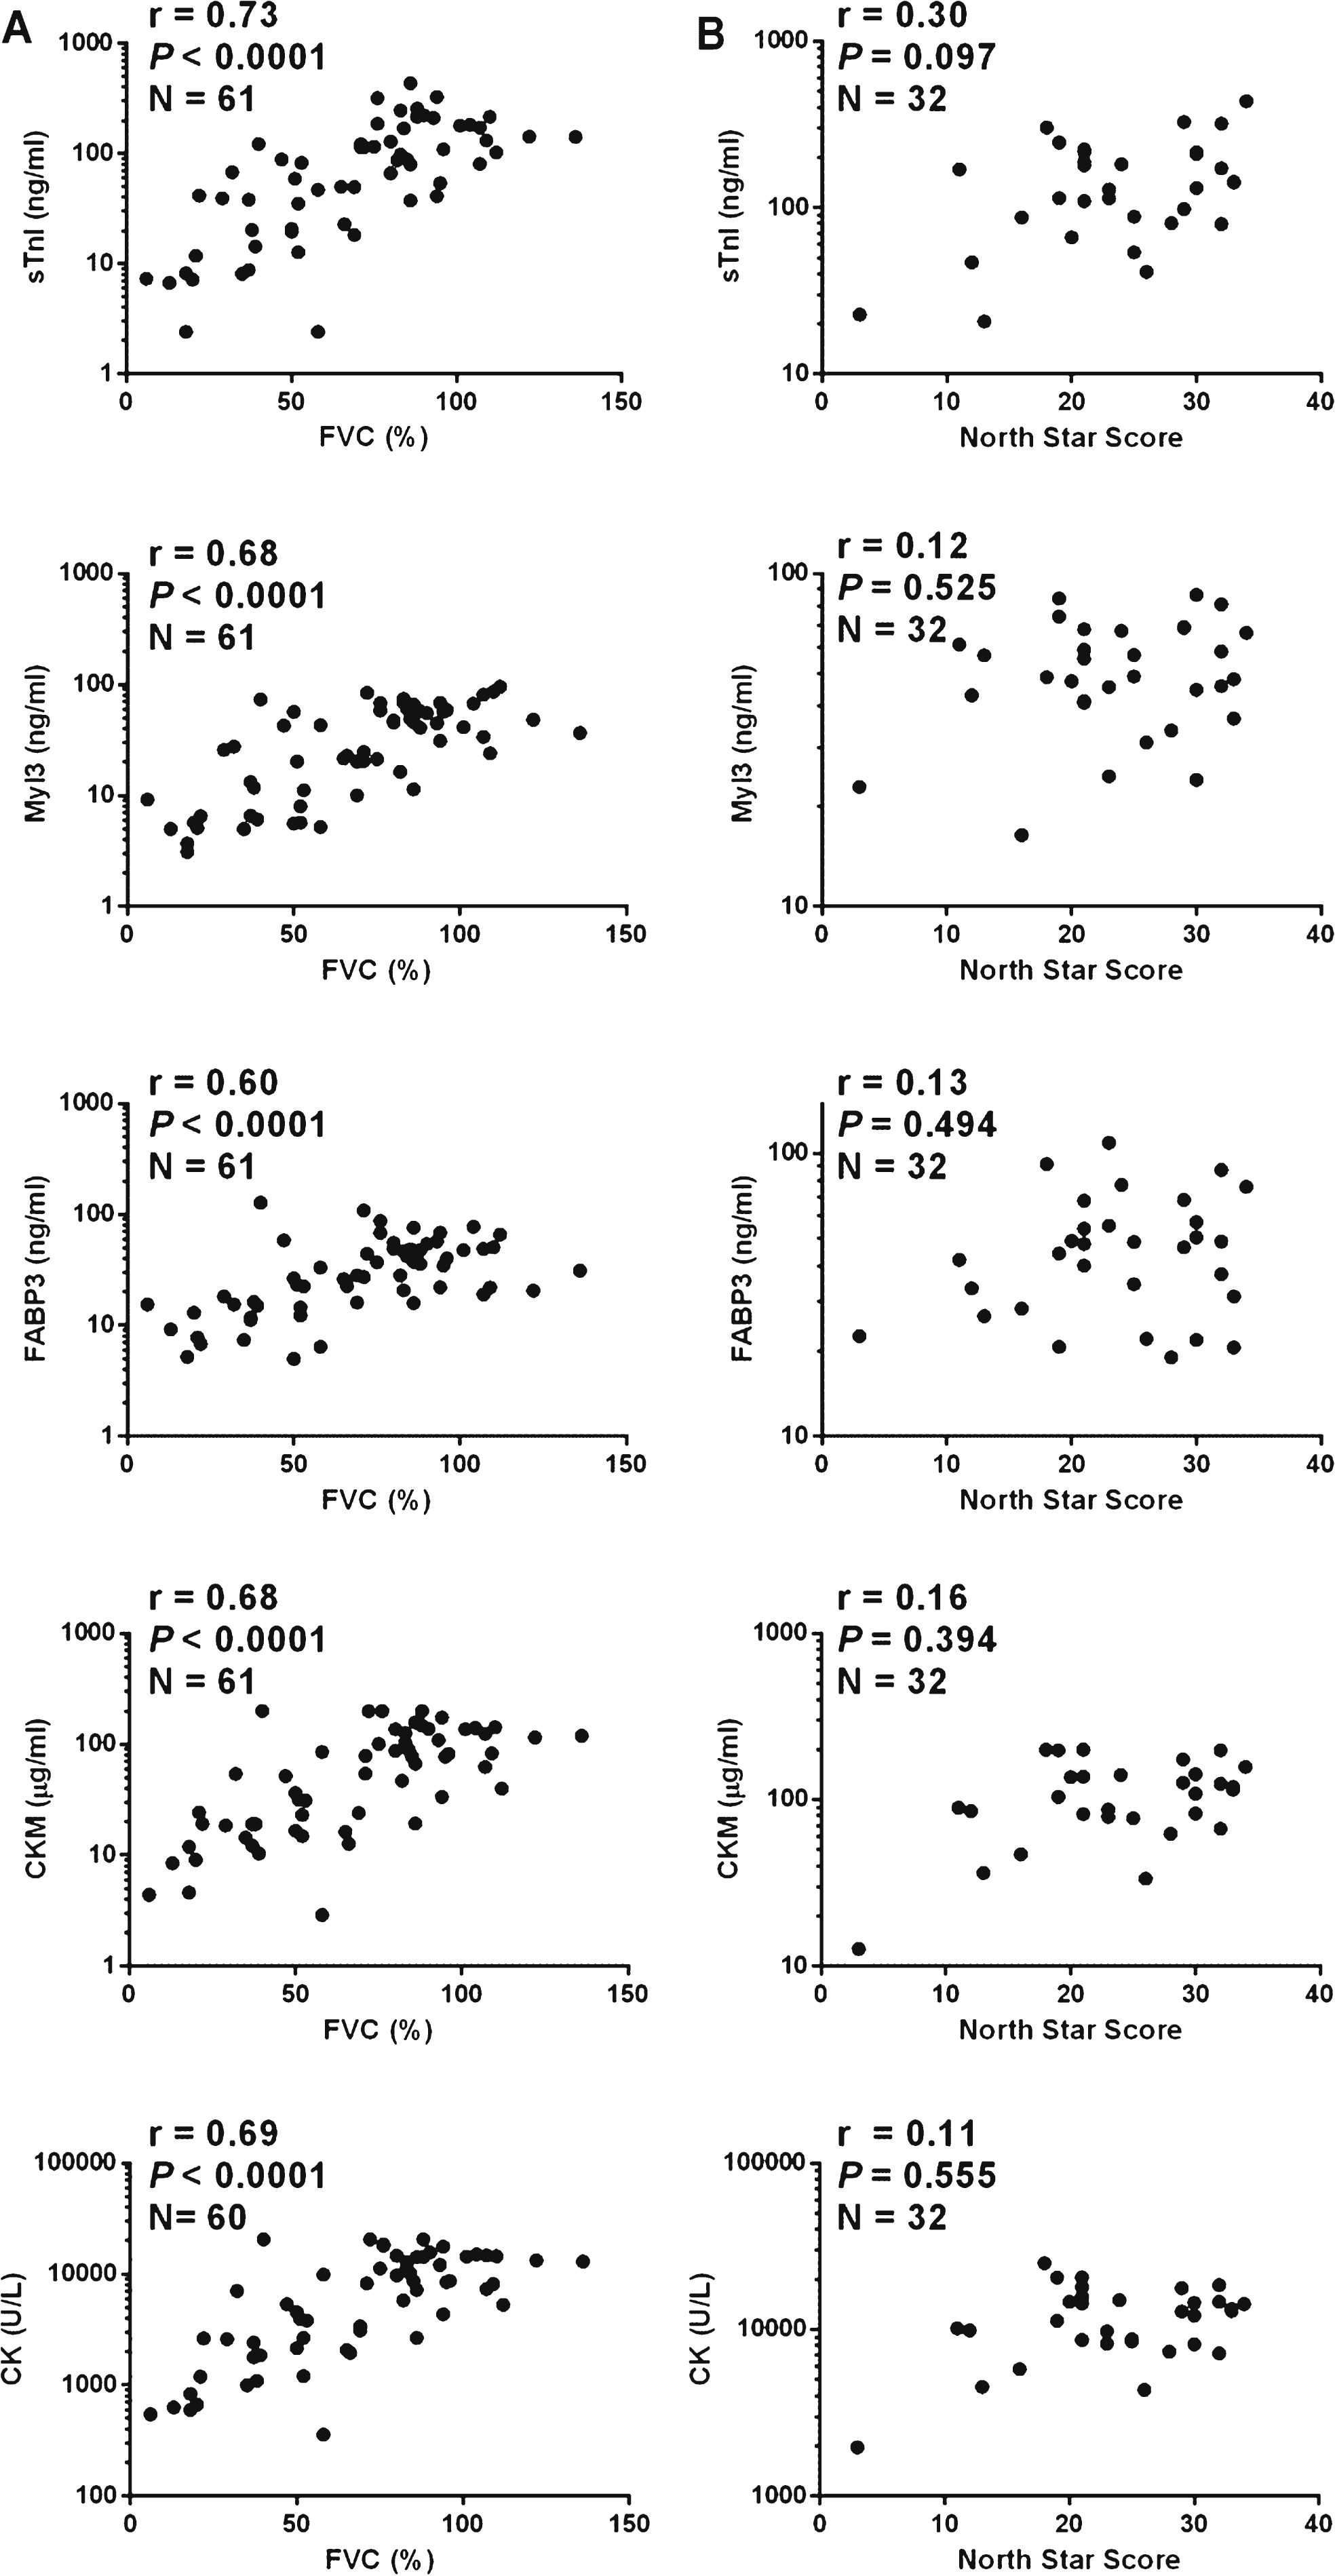
Fig.5
Correlations of protein serum concentrations and clinical measures in LGMD2B patients. A graph of the (A) FVC measurement and (B) the time to walk 10 m test versus serum concentrations of sTnI, Myl3, FABP3, CKM and total serum CK for each LGMD2B patients is shown. The Spearman’s correlation coefficient (r), P value (P) and number of patients in the sample set (N) is shown for each analysis.
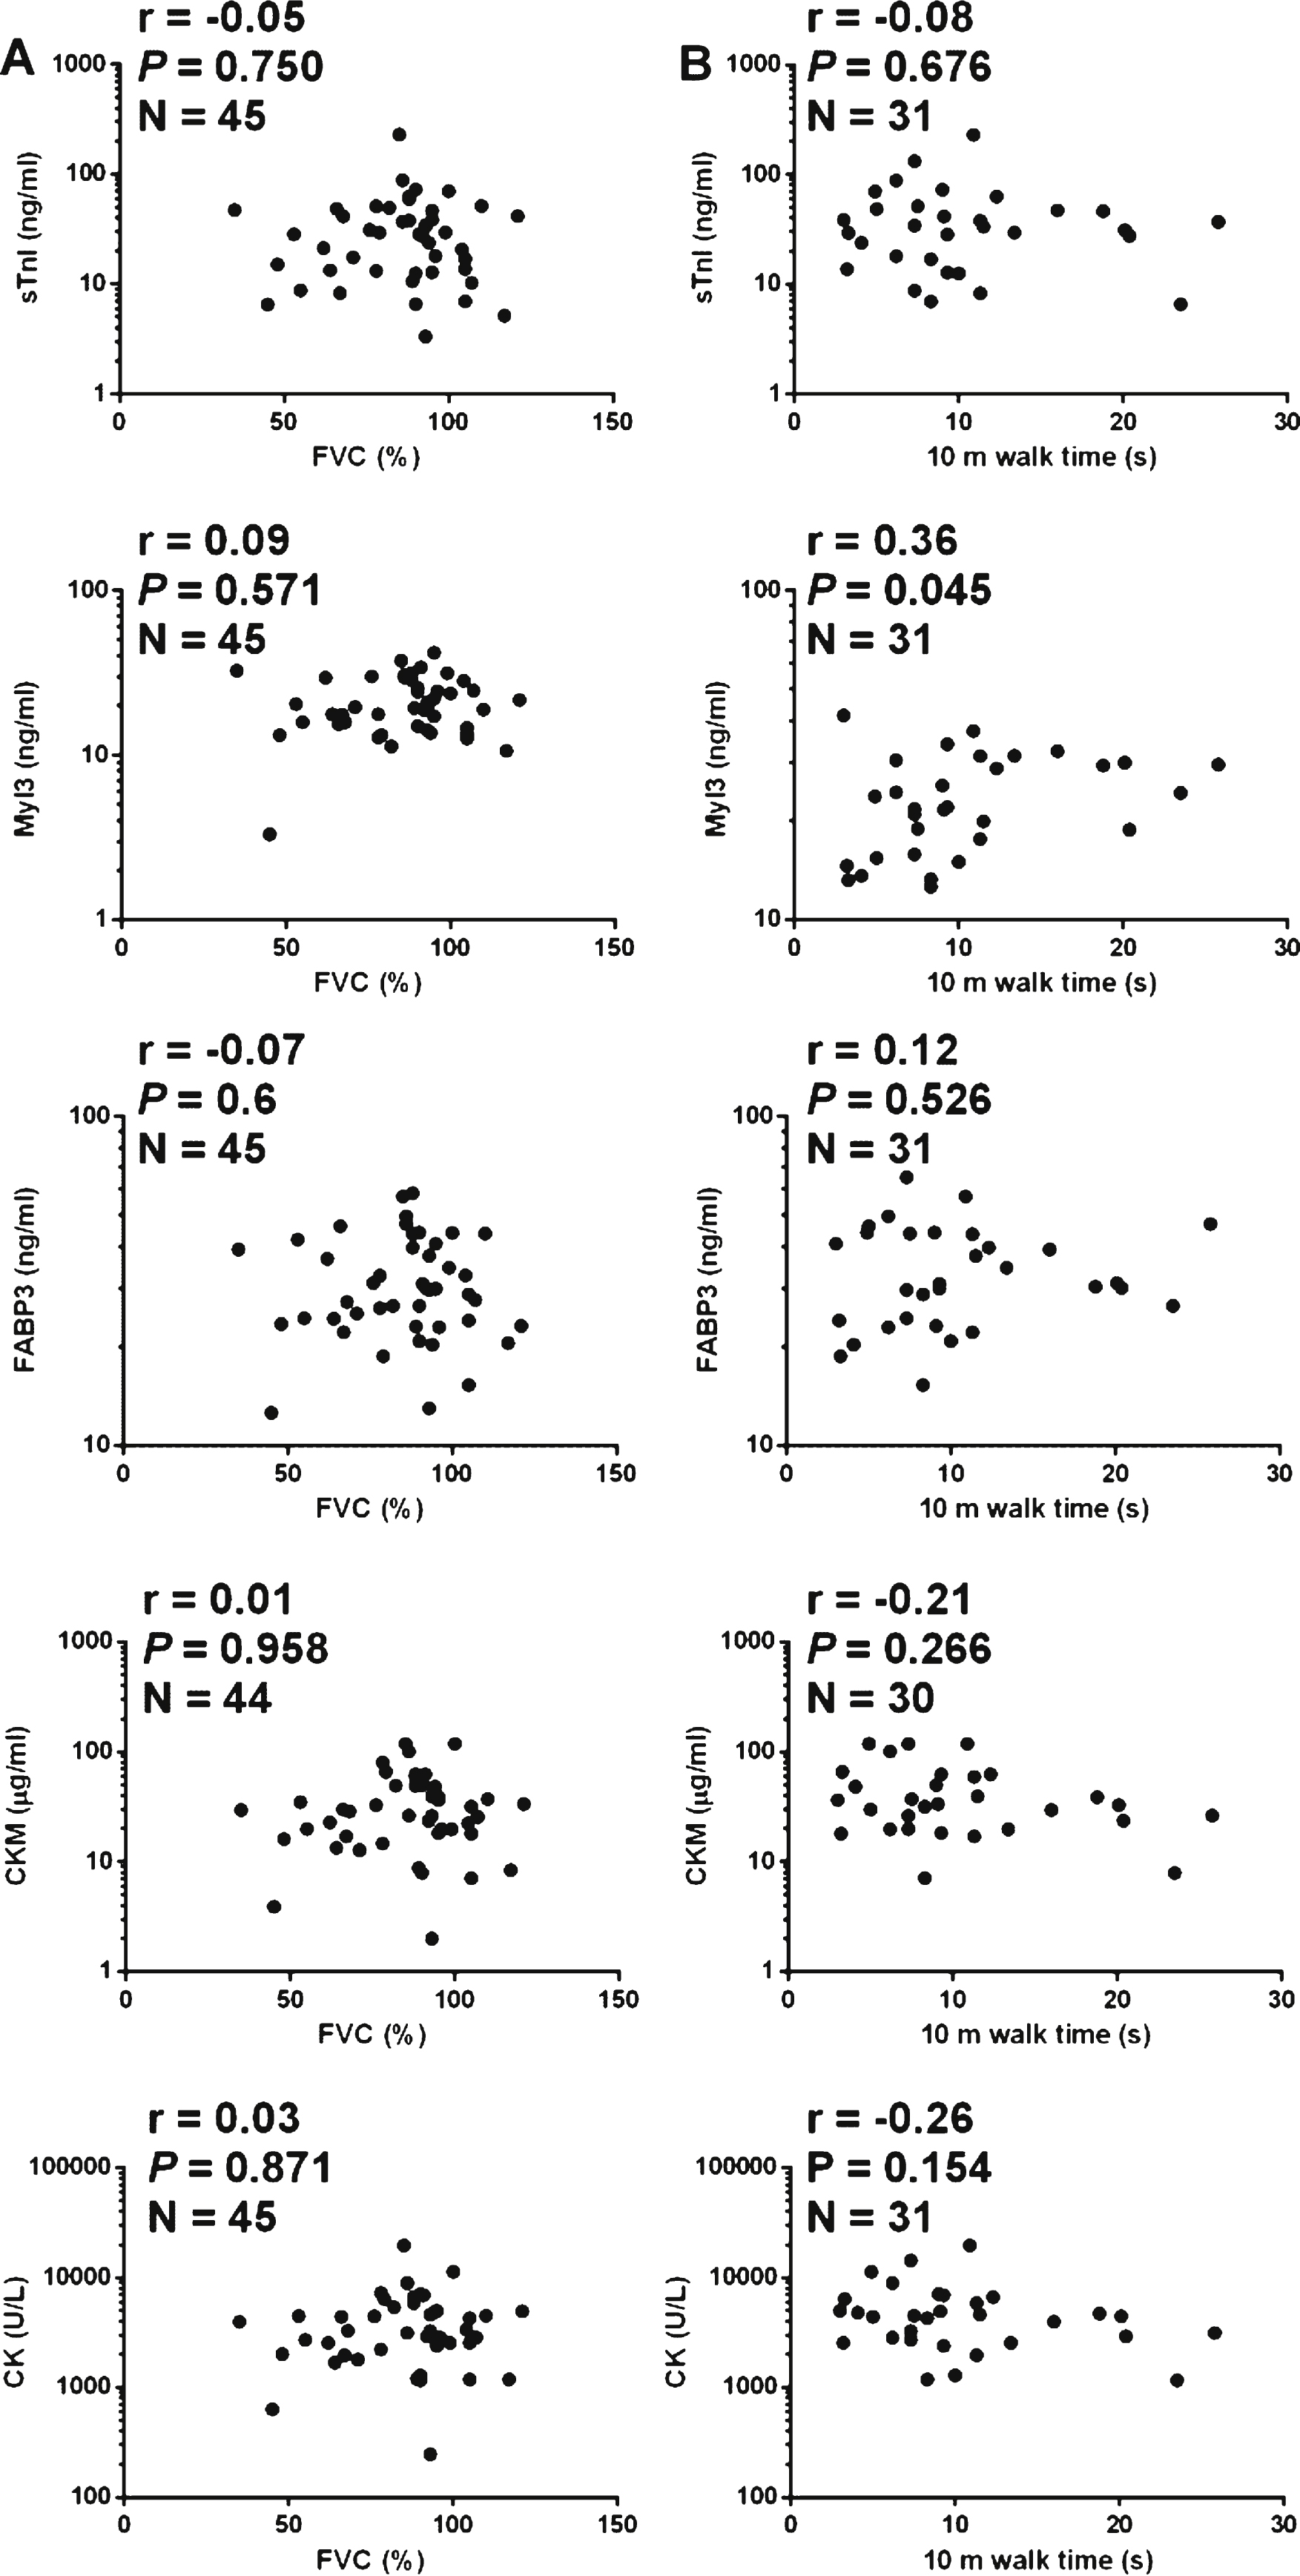
Fig.6
Scatter plots of protein serum concentrations and age in DMD, BMD and LGMD2B patients. A graph of the serum concentrations of sTnI, Myl3, FABP3, CKM and total serum CK are shown versus the age of the patient for the (A) DMD (N = 61), (B) BMD (N = 38) and(C) LGMD2B (N = 49) samples.
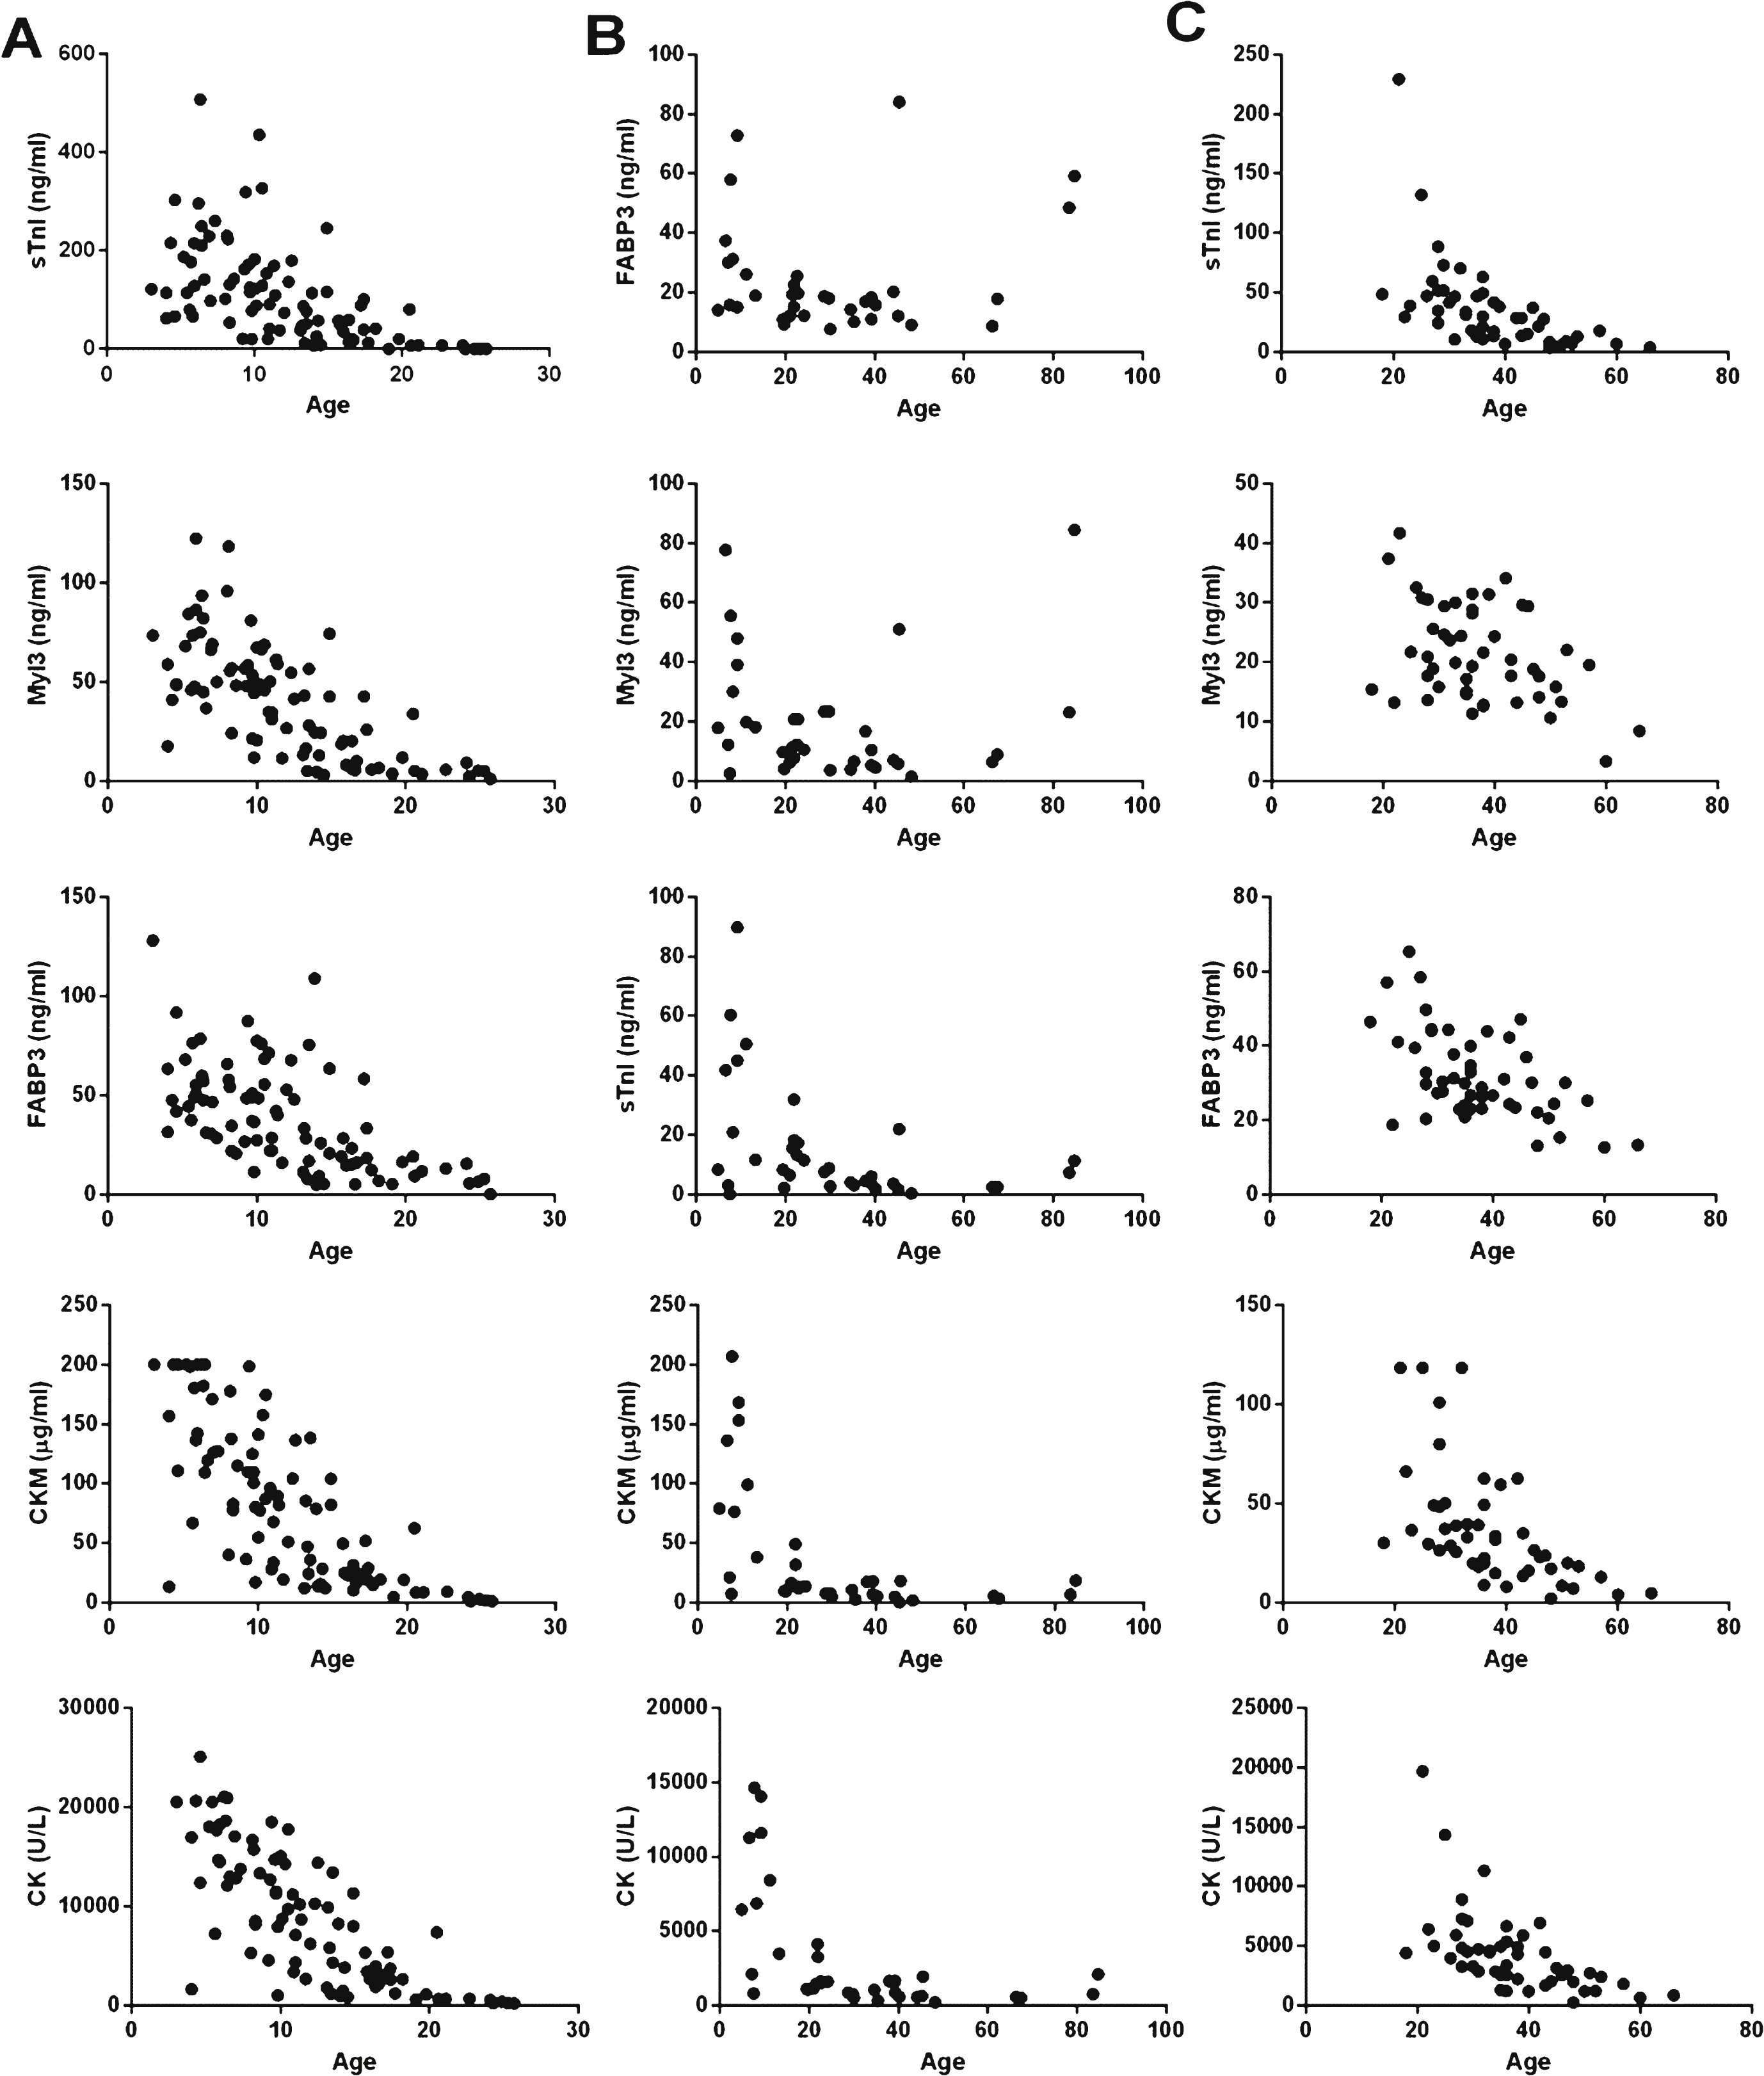
Table 1
Characteristics of muscular dystrophy patients and healthy controls
| Control (n = 32) | BMD (n = 38) | DMD (n = 74) | LGMD2B (n = 49) | |
| Age (years) | 21.1 ± 15.2 | 29.6 ± 20.4 | 12.6 ± 5.8 | 37.3 ± 10.5 |
| Age range (years) | 5–53 | 4–85 | 3–25 | 18–66 |
| Sex - Male | 32 (100%) | 38 (100%) | 74 (100%) | 20 (41%) |
| Non-ambulant | 9 (24%) | 29 (39%) | 16 (33%) | |
| Treated with corticosteroids | 62 (84%) | |||
| Treated for cardiomyopathy | 28 (38%) | |||
| Follow-up sample available | 26 (35%) |
Data are mean ± standard deviation, age range or number of individuals (% of the cohort).


