
Preliminary Evaluation of Clinician Rated Outcome Measures in Mitochondrial Disease
Abstract
Background: Currently there are no known cures and few effective treatments for mitochondrial disorders. It is also true there is a lack of knowledge about suitable clinician rated outcomes and how these change over time in this patient cohort.
Objective: We sought to evaluate the validity and responsiveness to change of clinician rated outcome measures in patients with m.3243A>G-related mitochondrial disease.
Methods: We assessed the six minute timed walk (6MTW), 10 meter walk / test (10MWT), Timed up and Go (TUG) and the 5 times sit to stand (5XSTS), in 18 patients (12 sedentary controls), at baseline and a subgroup of 10 control-matched patients following a 16-week structured aerobic exercise intervention program.
Results: All outcome measures assessed were valid and able to differentiate between patients and controls. Disease severity, as measured by the Newcastle Mitochondrial Disease Adult Scale, correlated with TUG (r = 0.54, p = 0.020) and 10MWT (r = 0.47, p = 0.050). Receiver Operating Curve analysis revealed 5XSTS to be the most responsive measure (AUC 0.931; 95% CI 0.84– 1.00) with responsiveness to change, post intervention, emulating disease burden variance.
Conclusions: The 5XSTS can be used to discriminate between mitochondrial patients and sedentary controls with high accuracy. The 10MWT and TUG may serve as suitable and clinically relevant clinician rated measures to track disease progression and assess intervention.
INTRODUCTION
Mitochondrial disorders are the most prevalent group of inherited neurometabolic diseases with significant morbidity and mortality. Recording the natural history and evaluating therapeutic interventions in this group of diseases has proven problematic due to their inherent genotypic and phenotypic heterogeneity, multi-system involvement, and the historical lack of validated outcome measures meaningful to both clinicians and patients. Comprehensive natural history data and disease progression are now being captured in specialist centres using the Newcastle Mitochondrial Disease Adult Scale (NMDAS) [1]. NMDAS is a validated rating scale and consists of four domains that incorporate clinician rated measures (system specific involvement), patient rated measures (current function, quality of life) and a combination of both (current clinical assessment). Although a consistent and reliable scale, its use is often limited to highly specialised centres with expertise in the care of patients with mitochondrial disease. However, quick and easily applicable clinician rated outcome measures might also prove useful in a wider range of clinical settings. We aimed to 1) assess four clinician rated outcome measures that have been validated and widely used in other neuromuscular disorders; 2) determine if any of these measures would be robust, responsive, and valid and potentially serve as an additional, easily performed clinician rated measure of disease severity in patients with mitochondrial disease.
MATERIALS AND METHODS
Subjects and study design
Eighteen adults with mitochondrial disease due to the m.3243A>G MELAS mutation were recruited from consecutive attendees at a specialist outpatient clinic and formed part of a larger study into cardiac adaptations to exercise in mitochondrial disease [2] (Supplementary table 1). Twelve sedentary age-matched control subjects were also recruited through local advertisement. Ten patients and 10 control subjects were invited to participate in a 16 week structured aerobic exercise program, cycling 3 times a week (30 minutes/session) and achieving a heart rate corresponding to 70– 80% of the peak exercise test as previously reported [2]. All clinician rated measures were performed pre and post intervention as detailed below by a single, experienced assessor were appropriate (5XST, TUG, 10MWT, 6MWT: JN; NMDAS: GSG). Institutional ethical approval and written informed consent wereobtained.
Demographic and clinical measures
Assessment of disease burden, cardiopulmonary fitness, habitual physical activity levels and muscle strength
Disease burden was assessed using the NMDAS, a validated rating system [1]; whilst mtDNA mutation load was determined in urinary epithelial cells [3]. Cardiopulmonary exercise testing was performed in all participants at baseline and 20 subjects (10 mitochondrial disease; 10 controls) post intervention. Physical activity and energy expenditure were assessed at baseline using a multi-sensor array (SenseWear Pro3, Bodymedia Inc, Pennsylvania, USA) and completion of the International Physical Activity Questionnaire (IPAQ) for 7 days [4]. Hip flexor and extensor strength measurements were performed by a single investigator (JN) using an isokinetic dynamometer (Cybex, HUMAC ®/NORM, NY, USA) at a speed of 60° per second. Participants underwent familiarization with six sub-maximal contractions and then performed six maximal repetitions with consistent verbalencouragement.
Clinician rated outcome measures
All subjects undertook five times sit to stand (5XSTS), Timed up and Go test (TUG), timed 10 meter walk test (10MWT) and the six minute timed walk (6MTW)[5, 6].
Statistical analysis
Data are presented as mean ± SD for continuous data. Continuous data were tested for normality using the Kolmogrov-Smirnov test, and group comparisons at baseline were made using two-tailed Student’s t-tests or Mann-Whitney U tests. Correlations were executed as two-tailed tests using Pearson’s or Spearman’s method dependent on normality. Pre and post intervention data were analyzed using paired t-tests or a Related-Samples Wilcoxin Signed Rank Test as appropriate. All analysis was performed using SPSS version 19 (SPSS Inc, Chicago, Illinois). Statistical significance was assumed at p < 0.05. Accuracy of tests was determined by Receiver Operating Curve analysis. The proposed study sample size was calculated as follows: nine participants will have 80% power at 0.05 alpha to detect a mean change of 0.15 in peak oxygen consumption post exercise intervention, as previously shown [7].
RESULTS
Thirty participants completed baseline evaluations (18 patients; 12 controls) and 20 participants (10 patients) completed all assessments post intervention (Table 1). Demographic and clinical details of mitochondrial participants are summarised in supplementary Table 1. No patients with mitochondrial disease demonstrated signifcant cognitive or respiratory dysfunction. All patients remained clinically stable throughout the study, and there were no changes in medication. 5XSTS and TUG showed significant differences between patients and controls (Table 1). Disease burden determined by total NMDAS correlated with 10MWT (r = 0.47, p = 0.050) and TUG(r = 0.54, p = 0.021), but not with VO2 peak (r =−0.372, p = 0.128); peak workload (r =−0.306, p = 0.217); 5XSTS (r = 0.197, p = 0.432); 6MTW (r =−0.252, p = 0.313); Hip flexion strength (r =−0.203, p = 0.469); Hip extension strength r =−0.0258, p = 0.354).
Proximal muscle strength correlated with all exercise parameters and the 6MTW (Supplementary Table 2). 5XSTS was the most responsive (Area Under the Curve (AUC) 0.94;95% CI 0.84– 1.00) outcome measure to discern patients from controls. Walk assessments showed high specificity (10MWT; 92% ) and greatest sensitivity (6MTW; 100% ) (Fig. 1). Both groups showed improvements in exercise capacity post exercise intervention (Table 1) (Supplementary Figure 1).
DISCUSSION
This preliminary study used both formal exercise testing and other clinician rated outcome measures to assess exercise capacity and physical performance of patients harbouring the m.3243A>G MELAS mutation. These measures have been shown to be reliable and sensitive in many neurological conditions but have not been validated to our knowledge in patients with mitochondrial disease. Moreover, as these measures are non-invasive and are quick and easy to administer, their use could prove beneficial in furthering our understanding of the impact of these diseases on patients over time, enable detection of deterioration and facilitate standardized evaluation of potential therapeutic interventions, which is currently lacking [8]. All clinician rated outcome measures assessed showed good sensitivity and specificity. Consistent with a previous case– control study in patients with mitochondrial disease [9], peak exercise and workload capacity were significantly decreased in patients compared to untrained, sedentary controls (Table 1; Supplementary Figure 1). The congruity of results between walking tests and exercise capacity is a convincing argument for revision of the exercise assessments requested in clinical practice, substituting formal exercise testing with simple, inexpensive and clinically relevant walking tests.
Muscle strength was reduced by 50% in patients compared to controls. Although strength was significantly lower, and correlated with the 6MTW only, there was no correlation with disease severity, as assessed by NMDAS; again suggesting skeletal myopathy is not the primary impairment in our patient cohort, and confirming that muscle power can be markedly reduced without affecting the clinician rated outcomes under investigation. Proximal muscle strength strongly correlated to peak exercise capacity and this should be taken into account when formally testing exercise capacity in patients with mitochondrialdisease.
STUDY LIMITATIONS
A wide range of clinician rated outcome measures currently exist that if carried out would be too burdensome for patients. Therefore, in this study we selected measures that related to symptoms commonly experienced in patients with mitochondrial disease. As this investigation formed part of a larger study into cardiac adaptations to exercise in mitochondrial disease [2] numbers involved were small, and limited in respects of genotypic and phenotypic heterogeneity. Despite these constraints, the study demonstrated that relevant and easy to perform clinician rated outcome measures can robustly discriminate between patient and control subjects, and their magnitude of change correlated with disease severity (NMDAS), following an exercise intervention.
CONCLUSION
Measuring the multitude of symptoms present in patients with mitochondrial disease can be time consuming and expensive. Clinician rated outcome measures are global assessments that are easily transferred to the clincal and home environment. Our findings are promising, but future work is required to assess how valid these measures are between different sites and within a larger cohort of patients with phenotypic and genotypic heterogeneity. In this preliminary study we have demonstrated that the 5XSTS is the most robust measure that is able to discriminate between patients and controls; whilst 10MWT and TUG serve as potential measures to track disease progression and assess potential interventions in patients with mitochondrial disease.
FINANCIAL DISCLOSURES
This work was supported by the Wellcome Trust [BH092142 to MGDB, 096919Z/11/Z and 074454/Z/04/Z to DMT]; the Medical Research Council [G0601943 to DMT and G0800674 to DMT]; the UK National Institute for Health Research Biomedical Research Centre for Ageing and Age-related Diseases award to Newcastle upon Tyne Hospitals NHS Foundation Trust [for DMT, GSG and JN] and the UK NHS Highly Specialized Services and Newcastle upon Tyne Hospitals NHS Foundation Trust that support the ‘Rare Mitochondrial Disorders of Adults and Children’ Diagnostic Service [http://www.mitochondrialncg.nhs.uk].
CONFLICT OF INTEREST
None disclosed.
ACKNOWLEDGMENTS
We thank all patients and volunteers involved in this study. We would also like to acknowledge Flexibility and Sustainability Funding from the Newcastle upon Tyne Hospitals NHS Foundation Trust, and the UK NIHR Biomedical Research Unit and Centre for Ageing and Age-Related Disease award to the Newcastle upon Tyne Hospitals NHS Foundation Trust. The research was also supported by NIHR Newcastle CRF Infrastructure funding. The views expressed are those of the authors and not necessarily those of the NHS, the NIHR or the Department of Health.
REFERENCES
1 | Schaefer AM, Phoenix C, Elson JL, McFarland R, Chinnery PF, Turnbull DM(2006) Mitochondrial disease in adults: A scale to monitor progression and treatmentNeurology66: 1219321934 |
2 | Bates MGD, Newman JH, Jakovljevic DG, Hollingsworth KG, Alston CL, Zalewski P(2013) Defining cardiac adaptations and safety of endurance training in patients with m.3243A<G-related mitochondrial diseaseInternational Journal of Cardiology16835993608 |
3 | Whittaker RG, Blackwood JK, Alston CL, Blakely EL, Elson JL, McFarland R(2009) Urine heteroplasmy is the best predictor of clinical outcome in the m.A>G mtDNA mutationNeurology72: 6568569 |
4 | Craig CL, Marshall AL, Sjöström M, Bauman AE, Booth ML, Ainsworth BE(2003) International physical activity questionnaire: 12-country reliability and validityMed Sci Sports Exerc8: 3513811395 |
5 | Flansbjer U, Lexell J(2010) Reliability of Gait Performance Tests in IndividualsWith Late Effects of PolioPM&R2: 2125131 |
6 | Guralnik JM, Simonsick EM, Ferrucci L, Glynn RJ, Berkman LF, Blazer DG(1994) A short physical performance battery assessing lower extremity function: Association with self-reported disability and prediction of mortality and nursing home admissionJ Gerontol49: 28594 |
7 | Taivassalo T, Gardner JL, Taylor RW, Schaefer AM, Newman J, Barron MJ(2006) Endurance training and detraining in mitochondrial myopathies due to single largescale mtDNA deletionsBrain129: 1233913401 |
8 | Pfeffer G, Majamaa K, Turnbull D, Thorburn D, Chinnery PTreatment for mitochondrial disorders (Review)Cochrane Library2012 |
9 | Jeppesen TD, Schwartz M, Olsen DB, Wibrand F, Krag T, Duno M(2006) Aerobic training is safe and improves exercise capacity in patients with mitochondrial myopathyBrain129: 1234023412 |
Figures and Tables
Fig.1
Area under the curve plots for functional outcome measures and peak exercise capacity. Cut off chosen at the point of maximum accuracy. Peak VO2 (sensitivity 67% , specificity 83% , accuracy 78% (p = 0.009); sit to stand (sensitivity 94% , specificity 75% , accuracy 89% (p<0.001); timed up and go (sensitivity 72% , specificity 83% , accuracy 75% (p = 0.009); 10MWT(sensitivity 61% , specificity 92% , accuracy 72% (p = 0.057); 6MTW (sensitivity 100% , specificity 44% , accuracy 81% (p = 0.103).
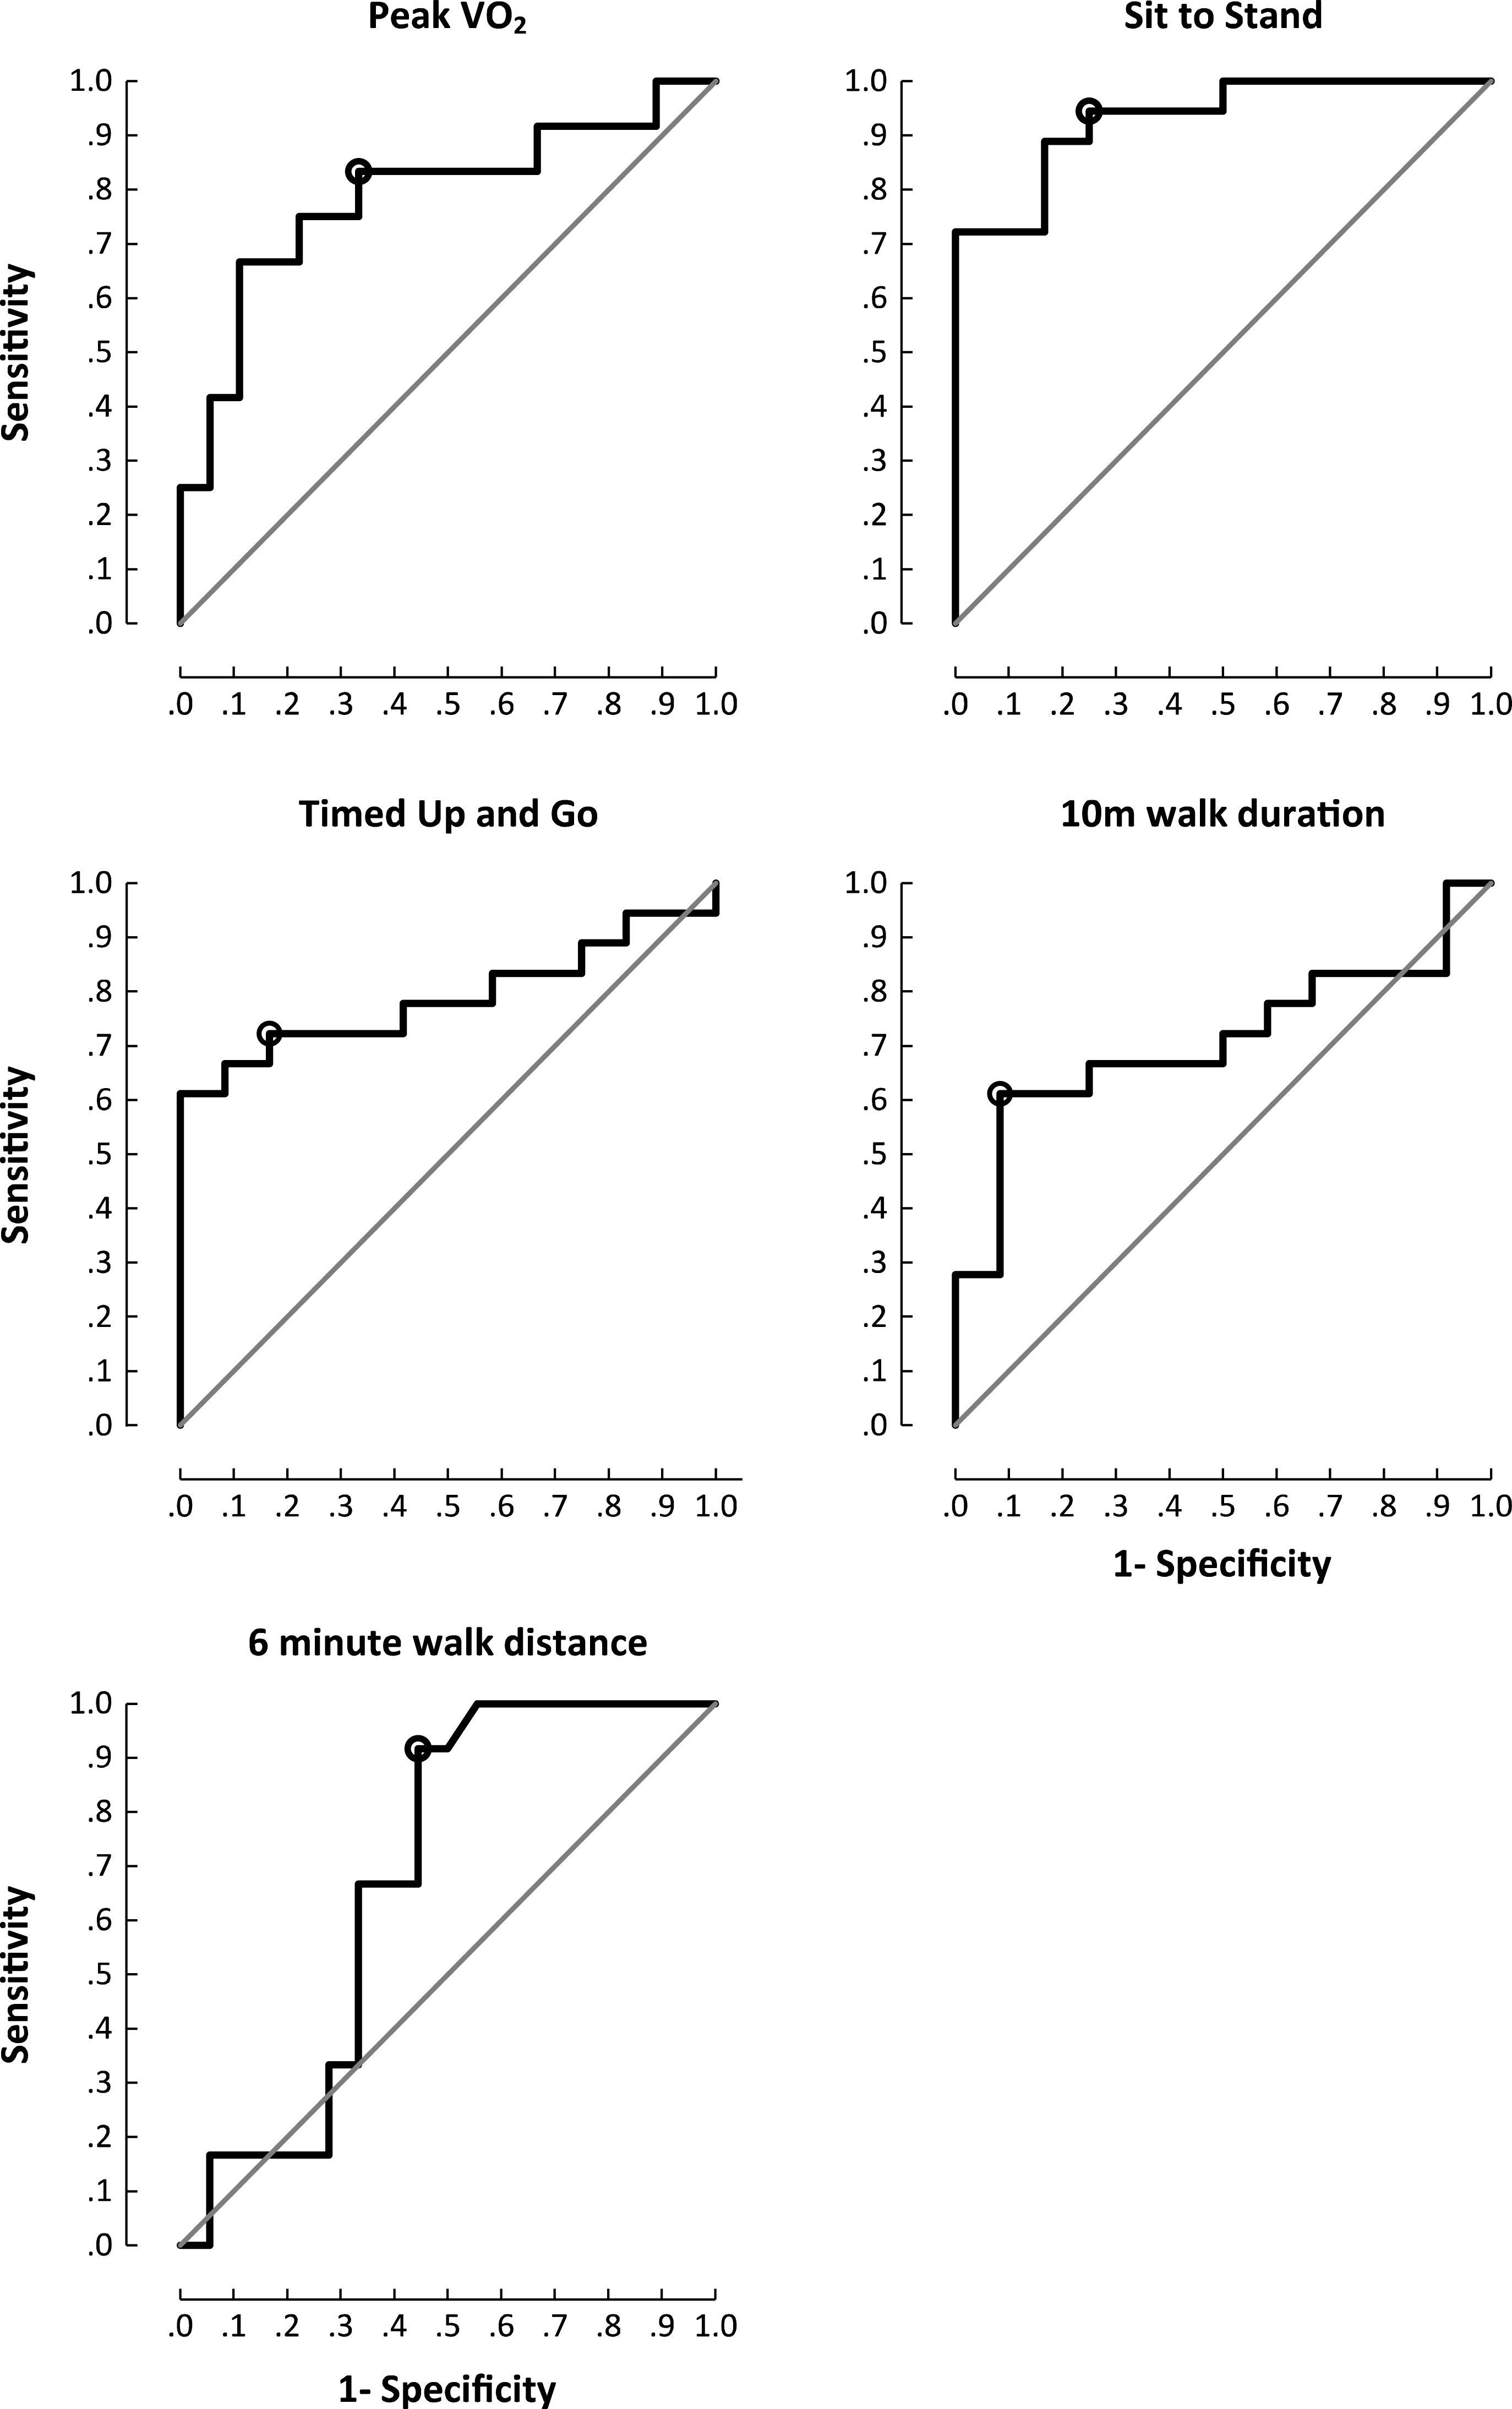
Table 1
Disease burden, activity levels, physiological capacity and functional capacity of patients and control subjects pre (n = 30) and post aerobic exercise (n = 20) intervention
| Domain | Variable | m.3243A> G (Mean ± SD) Baseline (n = 18; 9 F) | m.3243A> G (Mean ± SD) Post exercise (n = 10; 4 F) | p value a | Controls (Mean ± SD) Baseline (n = 12; 5 F) | Controls (Mean ± SD) Post exercise (n = 10; 4 F) | p value a |
| Disease Severity | NMDAS | 16 ± 8 | 15 ± 8 | 0.539 | n/a | n/a | n/a |
| Activity level | Energy expenditure (calories) | 2097 ± 547 * | n/a | n/a | 2602 ± 480 | n/a | n/a |
| Steps taken per day | 7819 ± 4859 | n/a | n/a | 10,094 ± 3841 | n/a | n/a | |
| Physiological capacity | Peak exercise capacity (ml/kg/min) | 20.8 ± 5.8 ** | 24.8 ± 8.9 | 0.009 | 27.9 ± 6.6 | 30.4 ± 5.6 | 0.073 |
| Anaerobic threshold (ml/kg/min) | 13.0 ± 4.1 * | 16.5 ± 6.4 | 0.014 | 16.3 ± 4.6 | 18.7 ± 3.9 | 0.017 | |
| Peak workload (w/kg) | 1.5 ± 0.4 ** | 1.7 ± 0.6 | 0.09 | 2.2 ± 0.5 | 2.5 ± 0.5 | 0.002 | |
| Arterial venous difference (ml O 2 /dl) | 9.4 ± 2.7 | 10.5 ± 3.1 | 0.025 | 11.2 ± 4.8 | 11.8 ± 1.8 | 0.205 | |
| Hip flexor strength (nm/kg) | 0.7 ± 0.4 * | 0.7 ± 0.3 | 0.859 | 1.1 ± 0.5 | 1.1 ± 0.5 | 0.283 | |
| Functional capacity | 5 times sit to stand (secs) | 11.3 ± 2.5 ** | 10.6 ± 4.5 | 0.631 | 7.2 ± 1.6 | 6.9 ± 1.5 | 0.832 |
| Timed up and go (secs) | 7.9 ± 1.5 ** | 7.6 ± 1.3 | 0.68 | 6.6 ± 0.5 | 6.8 ± 0.6 | 0.221 | |
| 10 meter timed walk (secs) | 7.4 ± 1.2 | 7.1 ± 1.3 | 0.842 | 6.7 ± 0.6 | 6.6 ± 0.8 | 0.796 | |
| 6 minute walk distance (m) | 486 ± 107 | 471 ± 68 | 0.63 | 513 ± 52 | 539 ± 54 | 0.051 |
a p value represents the within group comparison of paired before and follow up time points. * p < 0.05 and ** p < 0.01 for patients vs controls at equivalent baseline time points.

