
Micro-premature infants in New Jersey show improved mortality and morbidity from 2000–2018
Abstract
BACKGROUND:
Micro-premature newborns, gestational age (GA) ≤ 25 weeks, have high rates of mortality and morbidity. Literature has shown improving outcomes for extremely low gestational age newborns (ELGANs) GA ≤ 29 weeks, but few studies have addressed outcomes of ELGANs ≤ 25 weeks.
OBJECTIVE:
To evaluate the trends in outcomes for ELGANs born in New Jersey, from 2000 to 2018 and to compare two subgroups: GA 23 to 25 weeks (E1) and GA 26 to 29 weeks (E2).
METHODS:
Thirteen NICUs in NJ submitted de-identified data. Outcomes for mortality and morbidity were calculated.
RESULTS:
Data from 12,707 infants represents the majority of ELGANs born in NJ from 2000 to 2018. There were 3,957 in the E1 group and 8,750 in the E2 group. Mortality decreased significantly in both groups; E1, 43.2% to 30.2% and E2, 7.6% to 4.5% over the 19 years. The decline in E1 was significantly greater than in E2. Most morbidities also showed significant improvement over time in both groups. Survival without morbidity increased from 14.5% to 30.7% in E1s and 47.2% to 69.9% in E2s. Similar findings held for 501–750 and 751–1000g birth weight strata.
CONCLUSIONS:
Significant declines in both mortality and morbidity have occurred in ELGANs over the last two decades. These rates of improvements for the more immature ELGANs of GA 230 to 256 weeks were greater than for the more mature group in several outcomes. While the rates of morbidity and mortality remain high, these results validate current efforts to support the micro-premature newborn.
1Introduction
Prematurity, gestational age (GA) less than 37 weeks has remained relatively constant over the past two decades [1] and contributes significantly to neonatal mortality [1–6] and morbidity [1–3, 5–8]. Consequently, this has engendered discussion within the healthcare community regarding the economic costs [9], and ethical [10–12] issues of providing intensive care for this population.
Prior studies have focused on outcomes of very low birth weight neonates (VLBW, BW < 1500 g) and extremely low gestational age newborns (ELGANS, GA ≤ 29 weeks) [1–3, 5, 6, 12–20]. Most studies demonstrated improvements in mortality and morbidity. However, few have focused on the neonate ≤ 25 weeks [14, 16, 17, 21]. Seaton et al. showed increased survival at 23–25 weeks gestation from 1991 to 2010 [17]. Shah et al. reported no significant differences in mortality for infants < 29 weeks gestation from 1997 to 2007 [18]. Horbar et al. evaluated mortality and morbidity among infants 501–1500 g [15]. They showed significant declines in morbidities in survivors of BW 501–750 g and 751–1000 g from 2000 to 2009. However, outcomes for micro-premature neonates (< 25 weeks) continue to show high rates of mortality and morbidity [14, 16, 17, 21].
Our study compares the most immature ELGANs (GA 230–256 weeks) to the more mature ELGANs (GA 260–296) and reports the mortality and morbidity in New Jersey (NJ) from 2000 to 2018. Our aim was to evaluate the rates of change in outcomes for these two groups of ELGANs, GA 230–256 weeks (E1) and 260–296 weeks (E2).
2Methods
In 2008, 14 level III/IV NICUs formed the New Jersey NICU Collaborative (NJNC) to improve outcomes of premature neonates. Thirteen of the centers chose to participate in this study and pool their data on ELGANs. For this study, we excluded 22 week infants as many centers did not resuscitate at this gestational age. Variables in this database were selected from those submitted to the Vermont Oxford Network (VON). The definitions of morbidities are those specified by VON [15]. Each participating NICU submitted de-identified data to investigators at Children’s Hospital of NJ (CHoNJ). The combined database contained information about the majority of ELGANs born in NJ between 1/1/2000 and 12/31/2018. The de-identified database was approved for use in this study by the Institutional Review Board at CHoNJ/Newark Beth Israel Medical Center.
Data from 13,127 inborn infants were evaluated. We excluded infants with major congenital anomalies. The remaining 12,707 ELGANs were divided into two groups, E1 (GA 230–256 weeks, n = 3957) and E2 (GA 260–296 weeks, n = 8750). The number of infants in each GA is given in Table 1. We calculated mortality and morbidity rates for the two ELGAN groups over the 19 years. Mortality was defined as death after admission to the NICU and before discharge. The morbidity rate was based on the occurrence of any one of seven morbidities in patients without missing data: (1) severe retinopathy of prematurity (sROP, grade III-V, n = 10,349), (2) any late infection (LI, n = 11,818), (3) severe intraventricular hemorrhage (sIVH, grades III and IV, n = 11,814), (4) periventricular leukomalacia (PVL, generally defined by ultrasound, n = 11,959), (5) pneumothorax (PnT, n = 12,432), (6) necrotizing enterocolitis (NEC, n = 12,432) and (7) chronic lung disease (CLD, n = 10,494). CLD was defined as oxygen use at corrected GA of 36 weeks. Patients discharged before 36 weeks without oxygen were defined as having no CLD.
Table 1
Number of ELGAN 1 (E1, n = 3957) and ELGAN 2 (E2, n = 8750) subjects in each of their respective GA and study year groups
| Year | E1 | E2 | |||||||
| (GA’s 23–25 Weeks) | (GA’s 26–29 Weeks) | ||||||||
| 23 | 24 | 25 | E1 total | 26 | 27 | 28 | 29 | E2 total | |
| 2000 | 44 | 69 | 79 | 192 | 95 | 113 | 92 | 119 | 419 |
| 2001 | 44 | 79 | 54 | 177 | 89 | 112 | 128 | 112 | 441 |
| 2002 | 49 | 80 | 85 | 214 | 103 | 86 | 121 | 109 | 419 |
| 2003 | 53 | 79 | 83 | 215 | 119 | 121 | 112 | 141 | 493 |
| 2004 | 66 | 77 | 87 | 230 | 130 | 75 | 105 | 118 | 428 |
| 2005 | 37 | 79 | 81 | 197 | 102 | 127 | 120 | 163 | 512 |
| 2006 | 57 | 92 | 93 | 242 | 95 | 107 | 119 | 158 | 479 |
| 2007 | 57 | 78 | 101 | 236 | 85 | 123 | 137 | 127 | 472 |
| 2008 | 37 | 109 | 77 | 223 | 109 | 121 | 144 | 159 | 533 |
| 2009 | 59 | 72 | 84 | 215 | 87 | 114 | 118 | 159 | 478 |
| 2010 | 46 | 86 | 73 | 205 | 111 | 94 | 127 | 130 | 462 |
| 2011 | 55 | 75 | 83 | 213 | 104 | 111 | 116 | 139 | 470 |
| 2012 | 51 | 78 | 91 | 220 | 98 | 109 | 102 | 137 | 446 |
| 2013 | 49 | 80 | 85 | 214 | 104 | 98 | 109 | 129 | 440 |
| 2014 | 51 | 65 | 90 | 206 | 87 | 101 | 120 | 144 | 452 |
| 2015 | 49 | 64 | 86 | 199 | 98 | 140 | 112 | 119 | 469 |
| 2016 | 67 | 53 | 62 | 182 | 93 | 109 | 128 | 147 | 477 |
| 2017 | 62 | 66 | 58 | 186 | 88 | 94 | 120 | 125 | 427 |
| 2018 | 31 | 66 | 94 | 191 | 87 | 95 | 121 | 130 | 433 |
We computed rates of mortality, overall morbidity in survivors, survival without morbidity, and the seven individual morbidities for each study year. Linear regression analyses were performed for each measure to obtain predicted values in the years 2000 and 2018 and rates of change over the 19 years. Correlation coefficients for each regression analysis were tested for statistical significance. In addition, for each variable, we computed a difference in prevalence score; i.e. the percent for E1 minus the percent for E2. Linear regression analyses were performed for these difference scores.
3Results
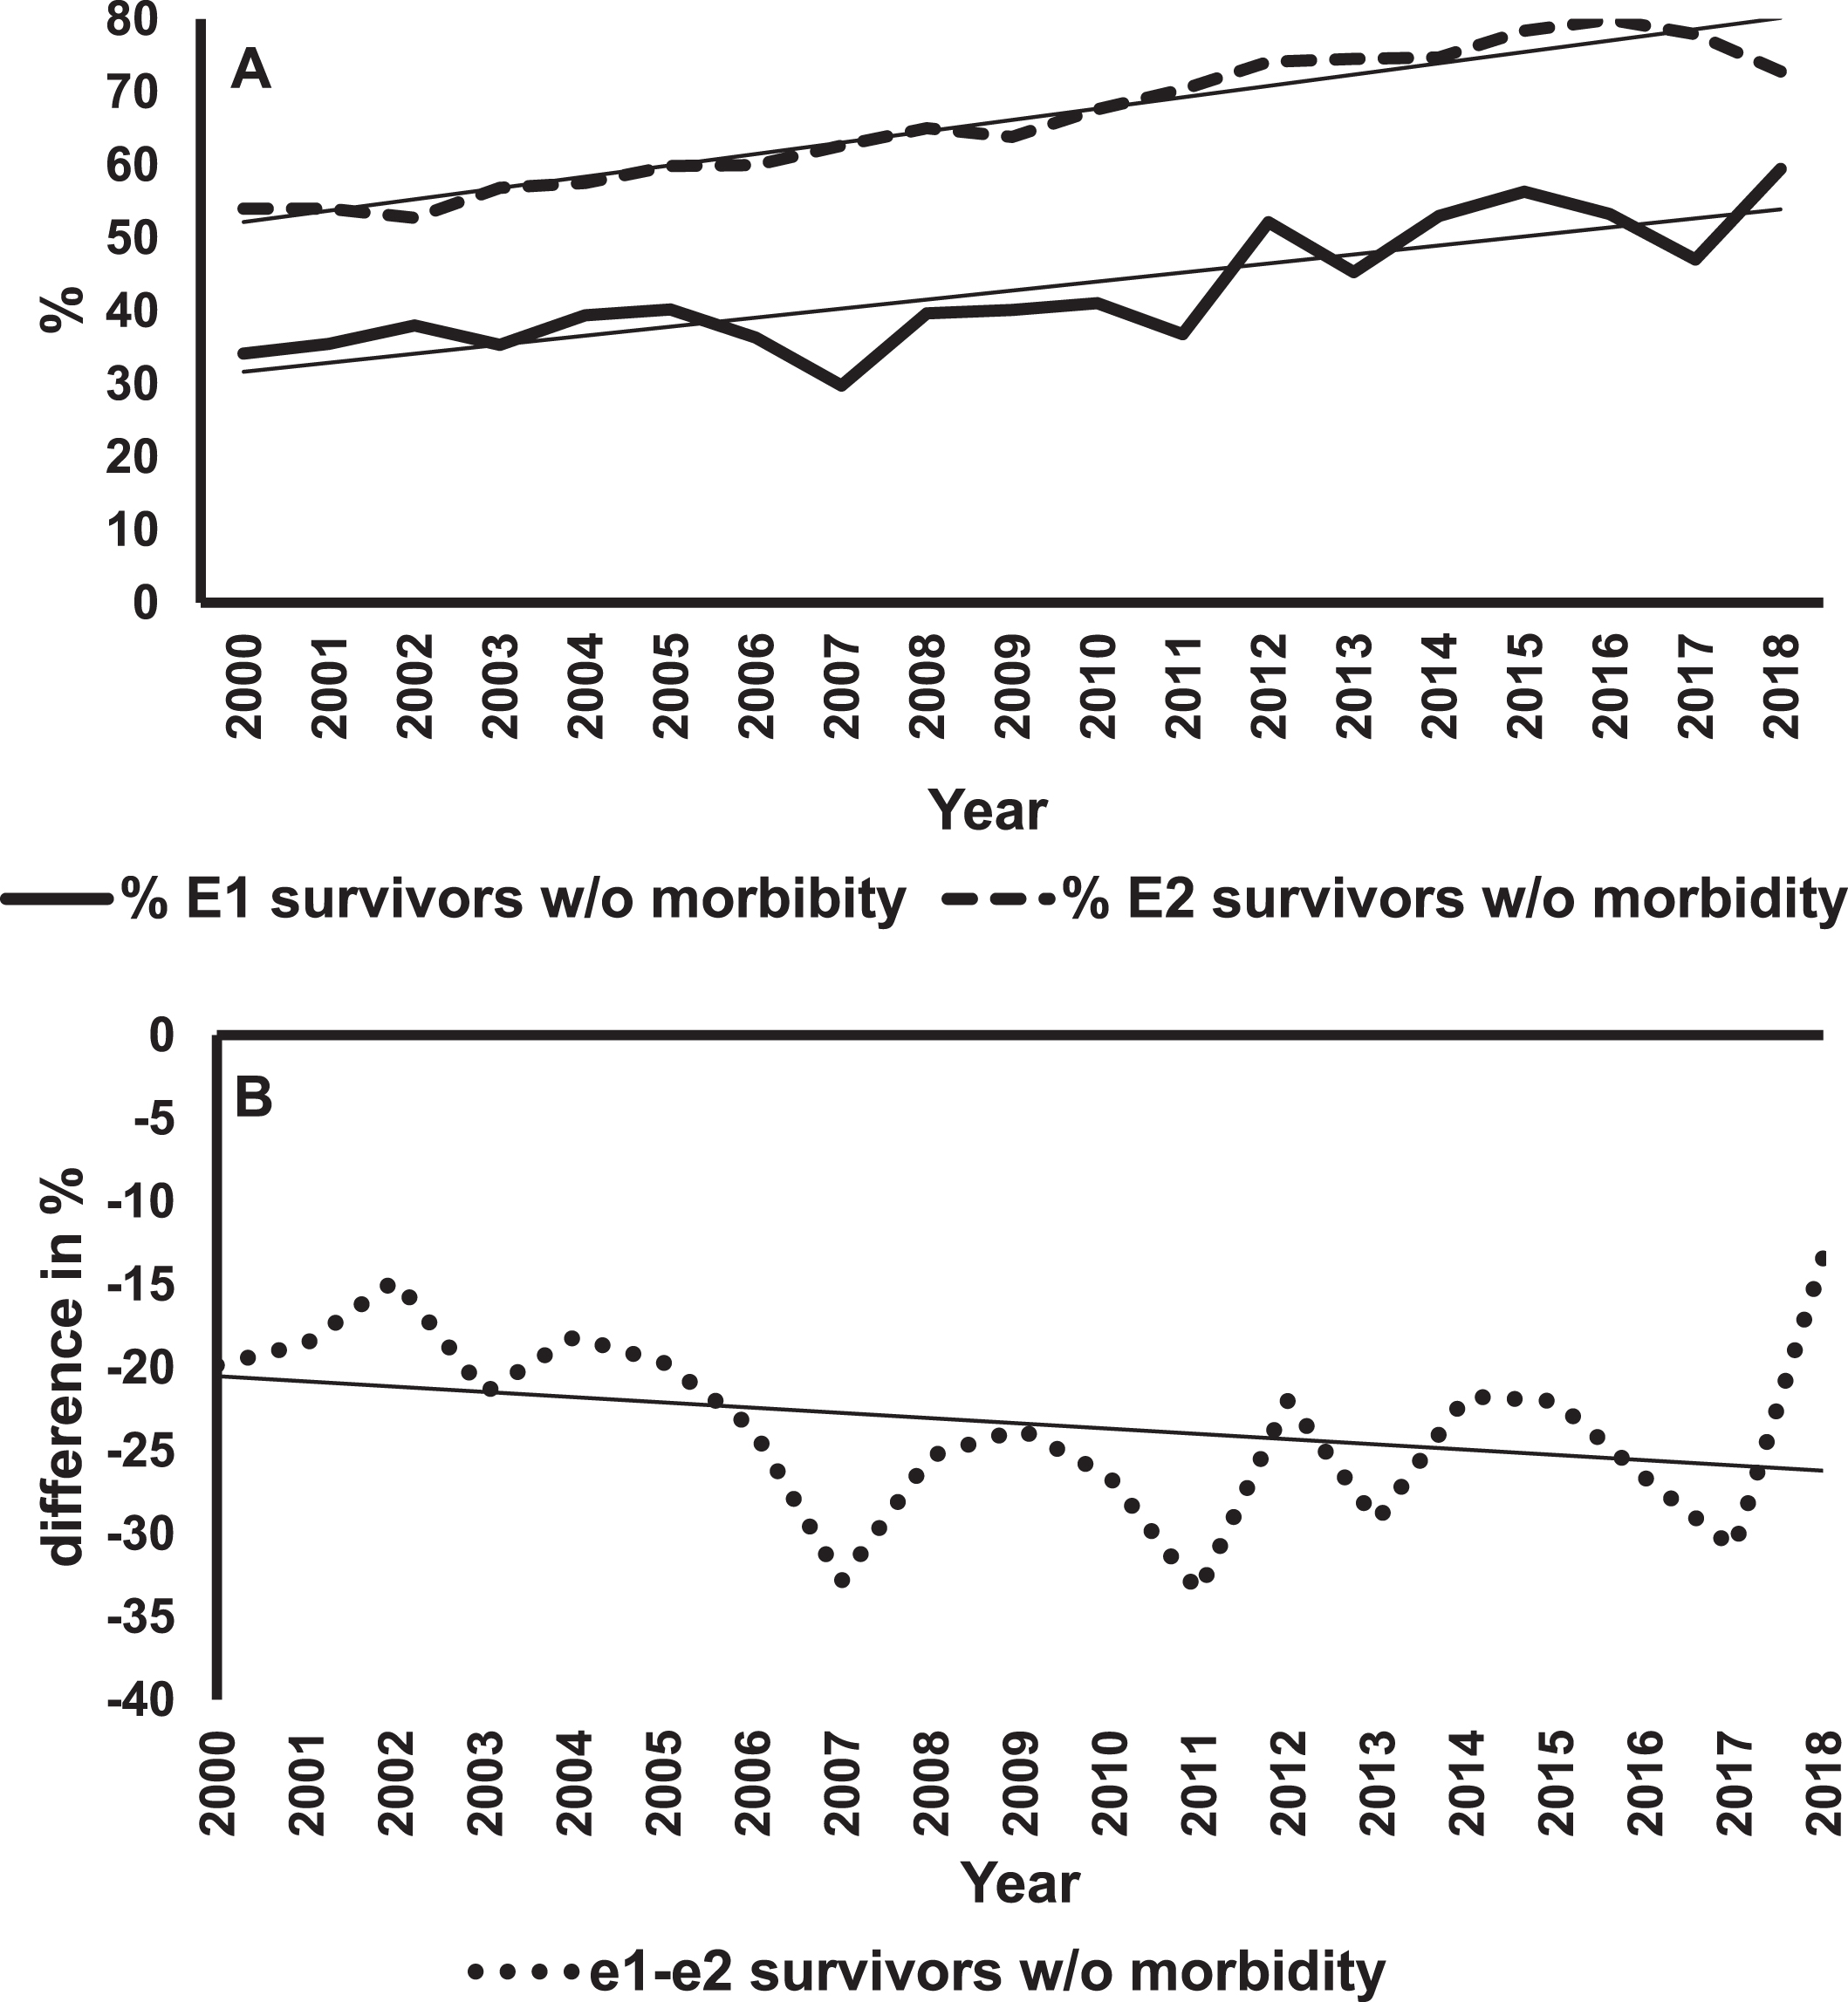
Figure 1A shows mortality rates and regression lines for E1 and E2 infants. The mortality rates for E1 infants were always greater than for E2s. However, improvement in mortality rates were statistically significant for both groups (E1, p < 0.001; E2, p = 0.02). Figure 1B shows differences in the rates of decline in mortality between E1 and E2 infants. The negative slope of the regression line means that these differences in percentages were getting smaller over the years, indicating a greater rate of change in E1 infants. This difference was statistically significant (p = 0.006). The rates of survival without major morbidity are shown in Fig. 2. The improvement in survival without morbidity was significant for E1 and E2. The relative rates were not significantly different between the two groups.
Fig. 1
Mortality trends of E1 and E2 infants. Panel A shows the percent mortality for E1 (solid line) and E2 (dashed line) infants over 19 years with the best fitting regression lines superimposed on the data for each group of infants. The slope for E1 = –0.72% /year, p < 0.001. The slope for E2 = –0.17% /year, p = 0.02. Panel B is a plot of the difference in percent mortality (E1 minus E2) for each year, and the best fitting regression line. The slope is = –0.55% /year, p < 0.006.
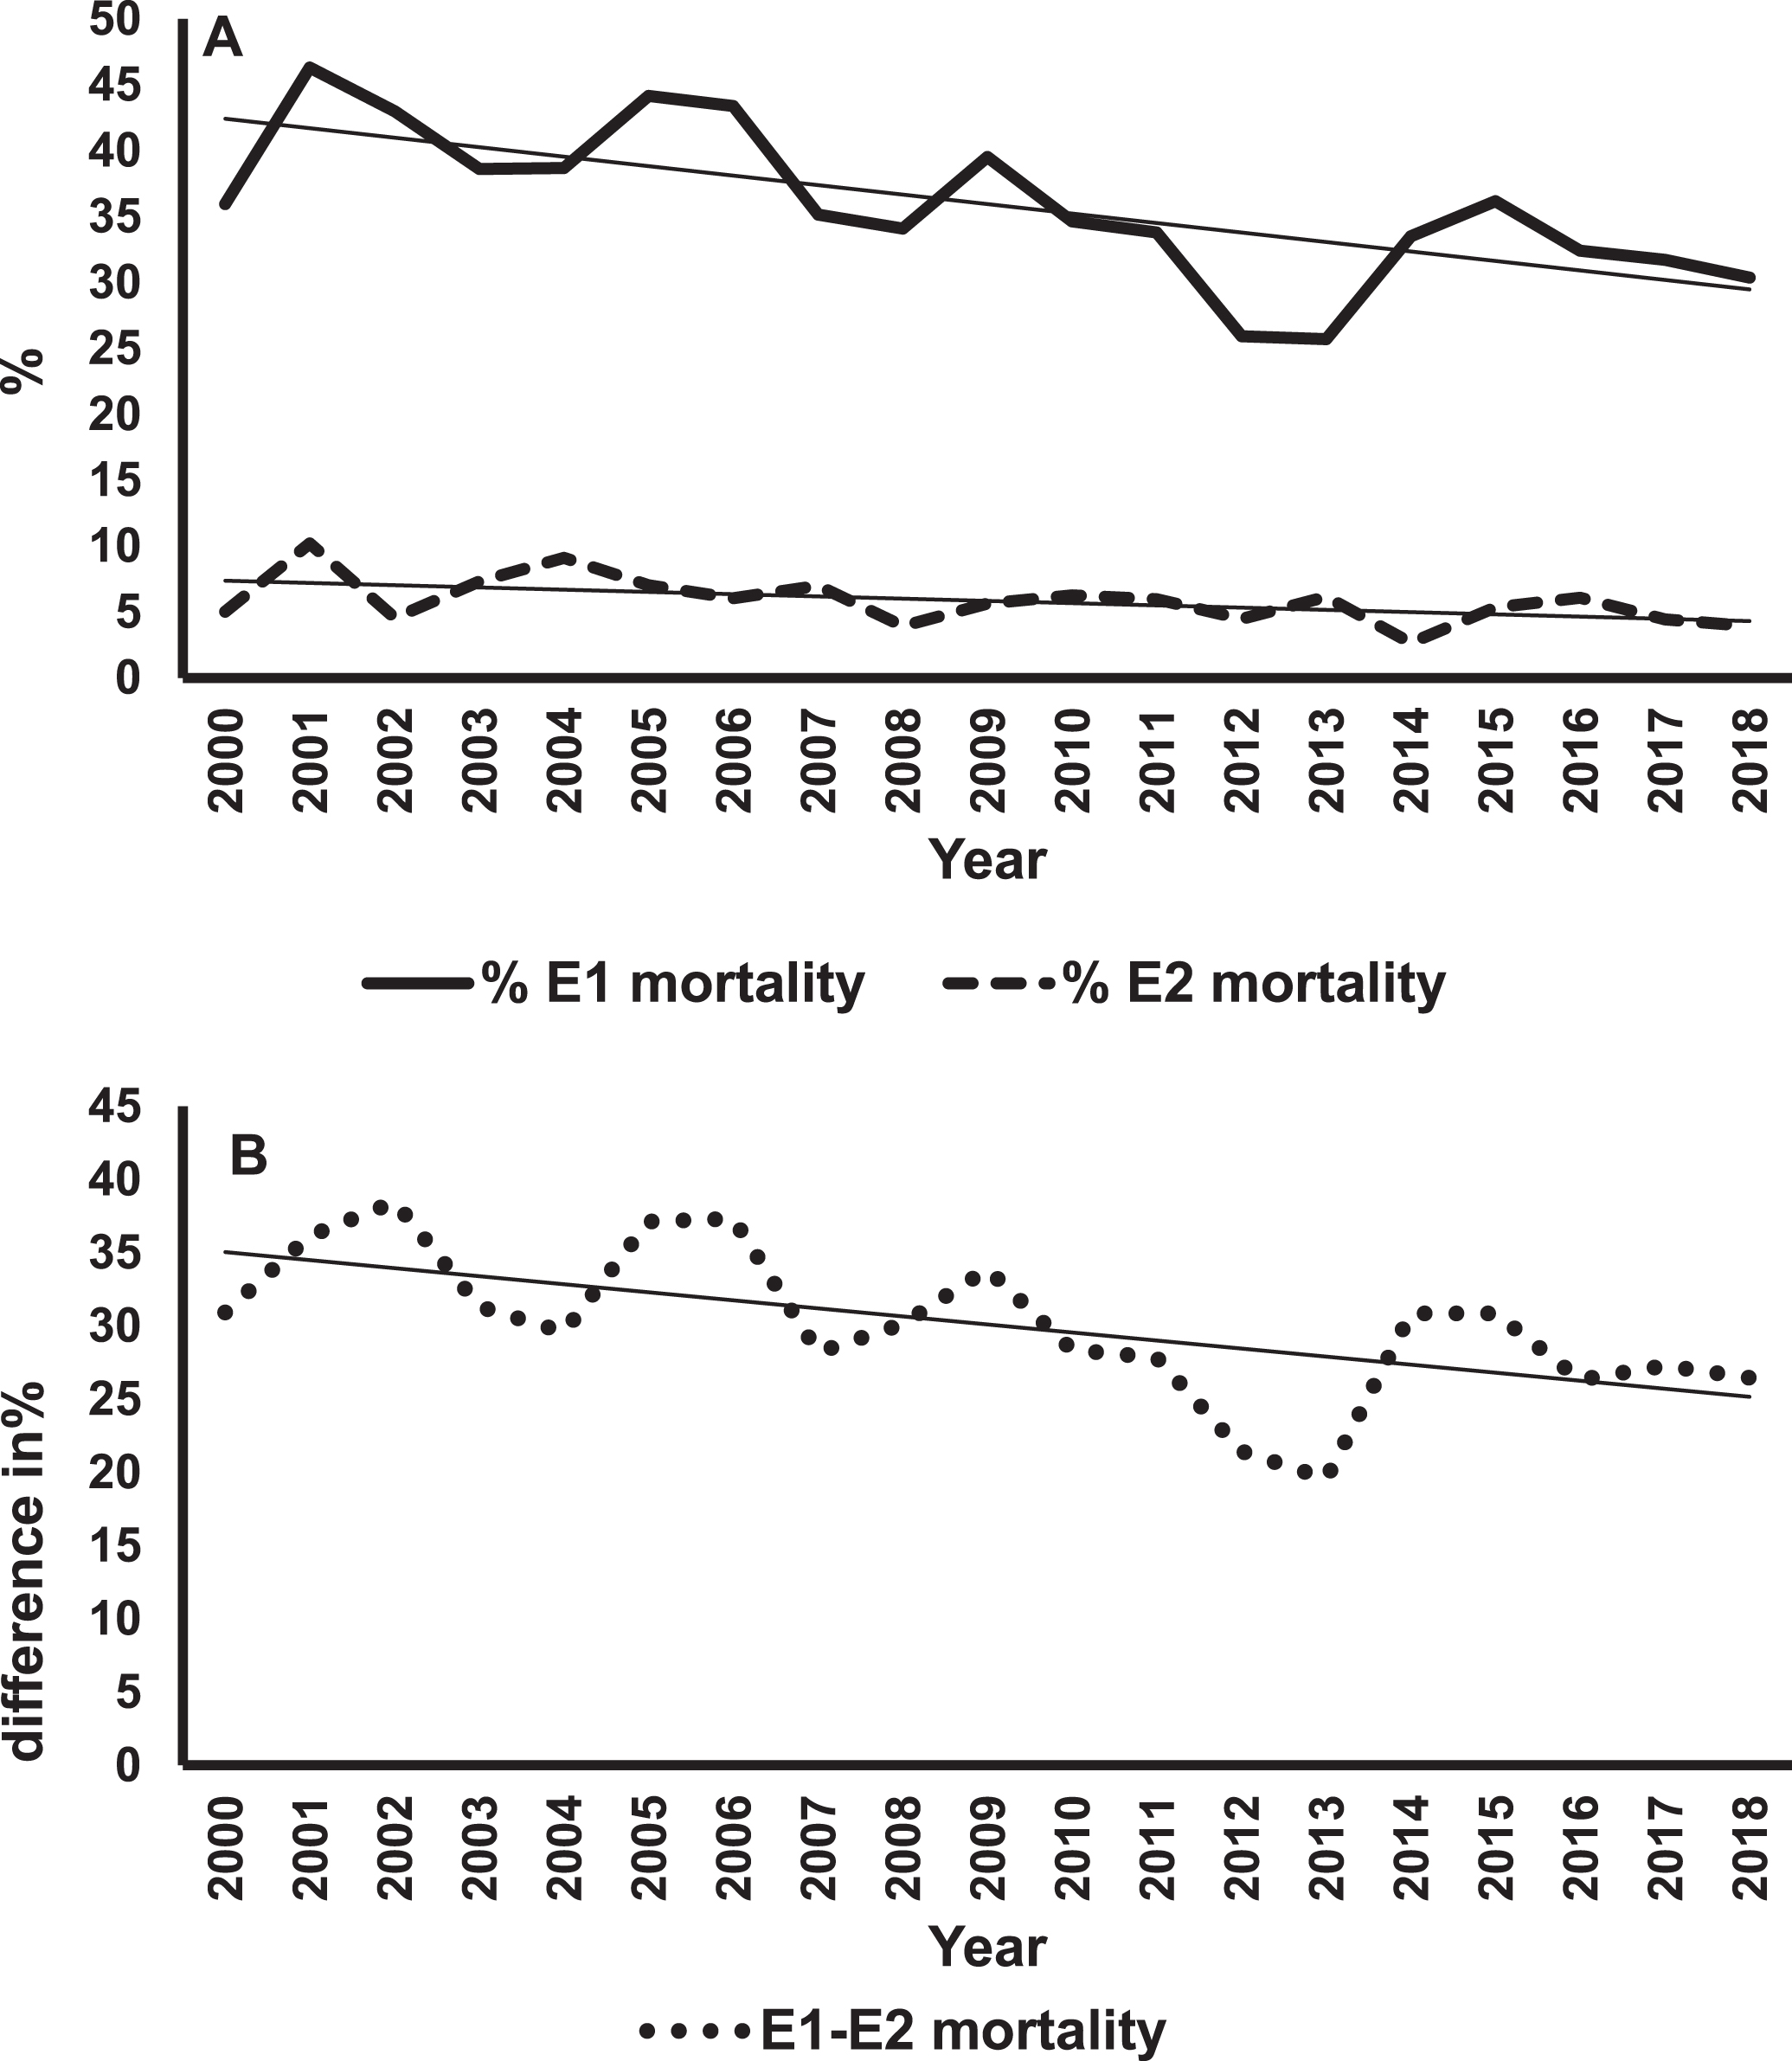
Fig. 2
Survival of E1 and E2 infants without any major morbidity. Panel A shows the percent survival without major morbidity for E1 (solid line) and E2 (dashed line) infants over 19 years with the best fitting regression lines superimposed on the data for each group of infants. The slope for E1 = 0.90% /year, p < 0.001. The slope for E2 = 1.26% /year, p < 0.001. Panel B is a plot of the difference in percent survival without major morbidity (E1 minus E2) for each year and the best fitting regression line. The slope is –0.36% /year, p < 0.013.
The major findings in the study are summarized in Table 2. The column labeled “2000” is the y-intercept of the regression equation and represents the calculated value in year 2000. The column labeled “slope” is the x coefficient and represents the change per year in the study variable percent. The last two columns are the regression coefficient and p-value for the particular study variable. The section of Table 2 labeled E1-E2 shows the regression analyses of the difference between the values for the more premature infants (E1) after subtracting the values for the less premature infants (E2). A negative slope, except for survival without morbidity, means that these differences in the percentages are getting smaller over time, indicating a greater change over time in E1 compared to E2. A positive value means the differences are getting larger, indicating a greater change in E2 compared to E1.
Table 2
Summary statistics for mortality, any morbidity, survival with no morbidity and individual morbidities for E1 infants (GA 230–256 weeks), E2 infants (GA 260–296 weeks) and the difference between E1 and E2 infants (E1 – E2). The column labelled 2000 contains the estimated values for the first year of the study period, the column labelled slope contains the rates of change in percent per year and the column labelled 2018 contains the estimate for the last year of the study. The last two columns contain the correlation coefficient between percent and year (r), and the p-value for the correlation coefficients. Morbidities shown are: Chronic Lung Disease (CLD, oxygen at 36 weeks post-conceptional age), any late infection (LI, infection occurring after day three of life), severe intraventricular hemorrhage (sIVH, grades III and IV), severe retinopathy of prematurity (sROP, grades III-V), pneumothorax (PnT), necrotizing enterocolitis (NEC), periventricular leukomalacia (PVL)
| E1 (230 – 256 weeks) | E2 (260 – 296 weeks) | E1 – E2 | |||||||||||||
| 2000a | slopeb | 2018c | r | p | 2000a | slopeb | 2018c | r | p | 2000a | slopeb | 2018c | r | p | |
| Mortality | 43.2 | –0.72 | 30.2 | 0.71 | < 0.001 | 7.6 | –0.17 | 4.5 | 0.53 | 0.020 | 35.6 | –0.55 | 25.7 | 0.61 | 0.006 |
| Morbidity in all patients | 90.1 | –0.83 | 75.2 | 0.84 | < 0.001 | 55.5 | –1.29 | 32.3 | 0.93 | < 0.001 | 34.6 | + 0.46 | 42.9 | 0.77 | < 0.001 |
| Survival with no morbidityd | 14.5 | + 0.9 | 30.7 | 0.82 | < 0.001 | 47.2 | +1.26 | 69.9 | 0.94 | < 0.001 | –32.7 | –0.36 | –39.2 | 0.56 | 0.013 |
| INDIVIDUAL MORBIDITIES (PERCENTAGE OF ALL PATIENTS EVALUATED FOR THE MORBIDITY) | |||||||||||||||
| CLD | 58.5 | –0.52 | 49.1 | 0.53 | 0.020 | 22.3 | –0.33 | 16.4 | 0.61 | 0.006 | 36.1 | –0.20 | 32.5 | 0.23 | 0.34 |
| LI | 49.2 | –1.33 | 25.3 | 0.87 | < 0.001 | 29.6 | –1.23 | 7.5 | 0.94 | < 0.001 | 19.6 | –0.10 | 17.8 | 0.17 | 0.49 |
| sIVH | 25.4 | –0.41 | 18.0 | 0.52 | 0.022 | 7.6 | –0.15 | 4.9 | 0.50 | 0.029 | 17.8 | –0.27 | 12.9 | 0.37 | 0.12 |
| sROP | 28.9 | –0.84 | 13.5 | 0.81 | < 0.001 | 6.0 | –0.24 | 1.7 | 0.85 | < 0.001 | 22.7 | –0.61 | 11.7 | 0.71 | < 0.001 |
| PnT | 11.1 | –0.08 | 9.6 | 0.20 | 0.41 | 4.7 | –0.10 | 2.9 | 0.50 | 0.029 | 6.5 | +0.02 | 6.9 | 0.05 | 0.84 |
| NEC | 10.9 | –0.09 | 9.3 | 0.28 | 0.25 | 7.6 | –0.20 | 4.0 | 0.75 | < 0.001 | 3.4 | +0.11 | 5.4 | 0.37 | 0.12 |
| PVL | 4.3 | +0.03 | 4.8 | 0.09 | 0.71 | 3.0 | –0.05 | 2.1 | 0.38 | 0.11 | 1.3 | +0.08 | 2.7 | 0.25 | 0.30 |
a% in 2000 estimated from y-intercept from linear regression. b% change/year. c% in 2018 estimated from y-intercept from linear regression + 18 x slope. dan increase in percentage from 2000 to 2018 is an improvement
Overall morbidity decreased from 2000 to 2018 in both groups although the rate of decline was faster in E2. Moreover, most of the individual morbidities showed significant (p < 0.05) decreases. In E1s all variables except PnT, NEC and PVL improved significantly. In E2s all variables except PVL improved significantly. Mortality and sROP improved more rapidly in E1s. Survival with no morbidity increased significantly in both E1s and E2s.
The above results show that for mortality and most individual morbidities, E1 infants demonstrated significant decreases in incidence over the 19 years. However, such trends may be related to factors that were not associated with clinical care. To investigate, we determined if there were significant trends over the years for a number of possible confounders.
We initially evaluated whether the average GA of E1 changed over the years. Regression analyses showed that there was no significant change in average GA over the study period (E1 average age = 24.1, slope = –0.0003 weeks/yr, r = –0.02, p = 0.93; E2 average age = 27.6, slope = 0.005 weeks/yr, r = 0.41, p = 0.08).
The percent of infants who were small for gestational age (SGA) in the E1 group did not change significantly over years (average over years = 5.9%, slope = –0.12% /yr, r = –0.24 p = 0.32) although the percent SGA in E2 infants increased significantly over years (average = 9.4%, slope = 0.22% /yr, r = 0.71, p < 0.001). We also evaluated the change in percentage of multiple gestations, and there was none (E1 average = 27.7%, slope = –0.26% /yr, r = –0.24, p = 0.32; E2 average = 31.2%, slope = –0.12% /yr, r = –0.25, p = 0.28).
To address the possibility that decreases over years in acute clinical status of infants at the time of birth might account for improvements in mortality and/or morbidity we also assessed the trend of the percent of infants with 1 and 5 minute Apgar scores less than 4. Analyses showed that for E1 infants, the percentage of Apgar scores less than 4 did not change significantly although for E2 this percentage increased significantly (E1 average = 46.4%, slope = + 0.19% /yr, r = 0.28, p = 0.25; E2 average = 16.3%, slope = 0.38% /yr, r = 0.74, p < 0.001). These same analyses for 5 minutes Apgar scores showed that for E1 infants, the percentage of infants with Apgar scores less than 4 also did not changes significantly over years (average = 19.9%, slope = + 0.12% /yr, r = 0.28, p = 0.25) while for E2 infants, this percentage increased significantly (average = 2.6%, slope = + 0.09, r = 0.61, p = 0.006).
It was possible that racial mix of the population changed with years and this might account for the trends in mortality and morbidity of E1 infants. For E1 infants, the percent of Black infants did not change significantly over the study period (E1 average = 40.4%, slope = –0.10% /yr, r = 0.17, p = 0.49). For E2 infants there was a significant decrease in the percentage of Black infants over years (E2 average = 34.5%, slope = 0.23% /yr, r = –0.55, p = 0.015).
The percent of Hispanics in both E1s and E2s groups increased significantly over years (E1 average = 21.2%, slope = + 0.48% /yr, r = 0.76, p < 0.001; E2 average = 19.8%, slope = 0.58% /yr, r = 0.891, p < 0.001). To determine if this change in ethnicity of E1s accounted for the trends in mortality and morbidity we excluded Hispanics and repeated the regression analyses. Results showed that both mortality and morbidity declined significantly over years after excluding Hispanics (mortality, slope = –0.79% /year, r = –0.77, p < 0.001; morbidity, slope = –1.09% /year, r = –0.79 p < 0.001). Thus, the trends in ethnic mix do not account for the overall trends in the E1s.
Finally, to make more direct comparisons to a previous study [7] looking at mortality and morbidity in survivors for infants born with birth weights between 501 and 750 g and those between 751 and 1000 g, we computed the changes in these outcomes over the 19 years for these two groups. For mortality, we saw a significant decline from 43.6 to 26.7% in the lower BW group (r = –0.82, p < 0.001), and from 12.3 to 7.6% in the higher BW group (r = –0.66, p = 0.002). There were also significant declines in major morbidity in survivors in both BW groups (501 to 750 g, 89.2% to 76.2%, r = –0.74, p < 0.001; 751 to 1000 g, 75.8% to 45.8%, r = –0.88, p < 0.001).
4Discussion
Since the 1960s neonatologists have expanded the limits of survival of preterm neonates. Availability of surfactant, the introduction of antenatal steroids, advances in ventilation, and other technologies have allowed us to extend the limit of viability to 22-23 weeks gestation. There is an ongoing need to know whether survival is improving and morbidity in survivors is decreasing over time.
In 2012 Shah et al. published data from the Canadian Neonatal Network comparing mortality and morbidities of preterm infants < 29 weeks gestation from 1996–1997 to 2006–2007 [18]. Their results raised serious concerns, suggesting that we may have reached “the threshold of neonatal intensive care provision.” Our study, which includes the next decade ending in 2018, shows more encouraging results. Shah et al. [18] showed no significant difference in mortality, whereas we found a decrease in mortality from 43.2% to 30.2% (p < 0.001) in infants 23–25 weeks GA, and from 7.6% to 4.5% (p = 0.020) in infants 26–29 weeks GA. There was a significant increase in bronchopulmonary dysplasia in the later cohort of the Canadian study whereas our study showed a significant decrease in CLD in both groups (E1 58.5% to 49.1%, p = 0.020 and E2 – 22.3% to 16.4%, p = 0.006). Most dramatically, in the Canadian study there was no difference in the number of infants with nosocomial infections, 31.9% vs. 31.8%, whereas we found marked improvement in LI in both groups, with E1 decreasing from 49.2% to 25.3% (p < 0.001) and E2 decreasing from 29.6% to 7.5% (p < 0.001).
Our data are comparable to Horbar et al. who used BW groupings and examined data from 669 hospitals in the VON data base over the years 2000 – 2009 [7]. They showed mortality decreased from 41.7% to 36.6% in infants with BW 501 to 750 grams, and from 13.0% to 11.7% in the 751–1000 grams BW group. Our mortality results for these groups of infants were 43.6% to 26.7% for the 501 to 750 g group and 12.3% to 7.6% for the 751–1000 g group. Major morbidity in survivors in the Horbar et al., study decreased slightly from 84.0% to 82.7% in their lowest BW group and from 62.1% to 57.4% in the 751–1000 grams BW group compared with a decrease from 89.2% to 76.2% in our 501 to 750 g infants and from 75.8% to 45.8% in our 751 to 1000 g infants. The decreases we observed in mortality and morbidity were more pronounced than in the Horbar et al. study perhaps because our data was from 2000 to 2018, a wider and more recent period.
Improvement in mortality and morbidity was seen in infants 22 to 29 weeks GA or less than 1500 g in a study of California NICUs between 2008 and 2017 [22]. It is important to note that ∼33.9% of their cohort was > 30 weeks GA, while none of our cohort were > 30 weeks GA. They found a decrease in mortality of 0.2% per year with rates of decline greatest in the youngest (< 27 week) babies. This is consistent with our findings that the decline in mortality for E1 infants was greater than that for E2 infant (–0.72% /year, –0.17% /year respectively) and that the difference in mortality rates was narrowing over the years. Lee et al., [22] also found that the number of morbidities declined over years, but they did not present these results by BW or GA strata. Thus, earlier studies and ours show decreases over time in all BW and GA groups, and our data suggest continuing improvement in mortality and morbidity in survivors in both GA groups through 2018.
Lee el al. did not find significant improvement in CLD in their cohort [22]. In our study, where CLD accounts for the majority of morbidity outcomes in survivors, E1s showed about a 16% reduction in CLD over the 19-year study period, which is encouraging. Our changes in CLD per year are small (∼0.5% per year) emphasizing the importance of collecting outcome data over many years.
The most robust improvements were seen in sROP and LI, with ∼50% decrease in E1s and ∼70% decrease in E2s, as also seen by Lee et al. [22]. This is encouraging, as these morbidities appear responsive to current clinical practices. However, similar to Lee et al. [22], we did not find a significant reduction in prevalence of PVL over the years.
Severe IVH declined significantly in both E1 and E2 infants with changes of –0.41% /year and –0.15% /year respectively. These changes are in agreement with those reported by Lee et al. who found a rate of –0.3% /year for their infants [22]. The cause of the decreased prevalence of sIVH is unclear. While the etiology of IVH is multifactorial [23], these decreases may reflect increasing experience in the care of ELGANs. Although Lee et al. reported a significant decline in NEC (–0.3% /year) we saw a significant decrease in the rate of NEC only in E2 infants (–0.2% /year). It is unclear why change did not occur in both groups, considering that the NJNC has focused on promoting breast milk as the preferred feeding for these infants since 2009. While the availability of donor human milk in NJ NICUs has gradually increased since 2009, it was only available in 9 units as of 2018.
In spite of wide use of surfactant, and gentler non-invasive ventilation, pneumothorax prevalence still remains high (9.6%) in the most premature infants (E1), most likely due to low compliance of anatomically and physiologically underdeveloped lungs. These factors may explain the statistically significant decrease for the more mature infants who have a rate of 2.9%.
NICUs have devoted an enormous amount of resources to caring for very immature infants. To some, these efforts seemed futile. Our results clearly demonstrate that we have improved care for ELGAN infants. There were significant improvements in the survival and morbidity of not only the more mature ELGANs, but also of those considered at the edge of viability.
In summary, although 70% survival in the most immature infants is still low, it is an impressive improvement in a population that as recently as 25 years ago was considered non-viable. More encouraging is the survival with no morbidity in E1s that increased from 14.5% to 30.7% which is similar to the results reported by Kaempf et al. [24]. Clearly, there is room for improvement as technology and expertise improve. Although limited to births in New Jersey, this study reinforces the need for systematic quality improvement to ensure that best practices are shared among all neonatal intensive care units.
Acknowledgments
Research Associates: Sankaranara Kaliappan and Amanda Lanter
Summer Students: D’nea Haggard, Alan Ho, Adanna Ibeku, Demi Rice, Precious Ubanwa
Disclosure statements
The authors have no financial relationships relevant to this article to disclose and the authors have no conflicts of interest relevant to this article to disclose. This research was conducted without any grant funding.
References
[1] | Glass HC , Costarino AT , Stayer SA , Brett CM , Cladis F , Davis PJ . Outcomes for extremely premature infants. Anesth Analg. (2015) ;120: (6):1337–51. |
[2] | Bernstein IM , Horbar JD , Badger GJ , Ohlsson A , Golan A . Morbidity and mortality among very-low-birth-weight neonates with intrauterine growth restriction. The Vermont Oxford Network. Am J Obstet Gynecol. (2000) ;182: (1 Pt 1):198–206. |
[3] | Fanaroff AA , Stoll BJ , Wright LL , Carlo WA , Ehrenkranz RA , Stark AR , et al. Trends in neonatal morbidity and mortality for very low birthweight infants. Am J Obstet Gynecol. (2007) ;196: (2):147.e1–8. |
[4] | Liu L , Johnson HL , Cousens S , Perin J , Scott S , Lawn JE , et al. Global, regional, and national causes of child mortality: An updated systematic analysis for 2010 with time trends since 2000. Lancet. (2012) ;379: (9832):2151–61. |
[5] | Stoll BJ , Hansen NI , Adams-Chapman I , Fanaroff AA , Hintz SR , Vohr B , et al. Neurodevelopmental and growth impairment among extremely low-birth-weight infants with neonatal infection. JAMA. (2004) ;292: (19):2357–65. |
[6] | Stoll BJ , Hansen NI , Bell EF , Walsh MC , Carlo WA , Shankaran S , et al. Trends in care practices, morbidity, and mortality of extremely preterm neonates, 1993-2012. JAMA. (2015) ;314: (10):1039–51. |
[7] | Horbar JD , Edwards EM , Greenberg LT , Morrow KA , Soll RF , Buus-Frank ME , et al. Variation in performance of neonatal intensive care units in the United States. JAMA Pediatr. (2017) ;171: (3):e164396. |
[8] | Rysavy MA , Li L , Bell EF , Das A , Hintz SR , Stoll BJ , et al. Between-hospital variation in treatment and outcomes in extremely preterm infants. N Engl J Med. (2015) ;372: (19):1801–11. |
[9] | Meadow W , Cohen-Cutler S , Spelke B , Kim A , Plesac M , Weis K , et al. The prediction and cost of futility in the NICU. Acta Paediatr. (2012) ;101: (4):397–402. |
[10] | Albersheim S . The extremely preterm infant: Ethical considerations in life-and-death decision-making. Front Pediatr. (2020) ;8: :55. |
[11] | Cuttini M , Casotto V , Orzalesi M . Ethical issues in neonatal intensive care and physicians’ practices: A European perspective. Acta Paediatr. Suppl. (2006) ;95: (452):42–6. |
[12] | Patel RM , Rysavy MA , Bell EF , Tyson JE . Survival of infants born at periviable gestational ages. Clin Perinatol. (2017) ;44: (2):287–303. |
[13] | Boghossian NS , Geraci M , Edwards EM , Horbar JD . Morbidity and mortality in small for gestational age infants at 22 to 29 weeks’ gestation. Pediatrics. (2018) ;141: (2):e20172533. |
[14] | Ehret DEY , Edwards EM , Greenberg LT , Bernstein IM , Buzas JS , Soll RF , et al. Association of Antenatal steroid exposure with survival among infants receiving postnatal life support at 22 to 25 weeks’ gestation. JAMA Netw Open. (2018) ;1: (6):e183235. |
[15] | Horbar JD , Carpenter JH , Badger GJ , Kenny MJ , Soll RF , Morrow KA , et al. Mortality and neonatal morbidity among infants 501 to 1500 grams from 2000 to 2009. Pediatrics. (2012) ;129: (6):1019–26. |
[16] | Mehler K , Grimme J , Abele J , Huenseler C , Roth B , Kribs A . Outcome of extremely low gestational age newborns after introduction of a revised protocol to assist preterm infants in their transition to extrauterine life. Acta Paediatr. (2012) ;101: (12):1232–9. |
[17] | Seaton SE , King S , Manktelow BN , Draper ES , Field DJ . Babies born at the threshold of viability: changes in survival and workload over 20 years. Arch Dis Child Fetal Neonatal Ed.F. (2013) ;98: (1):15–20. |
[18] | Shah PS , Sankaran K , Aziz K , Allen AC , Seshia M , Ohlsson A , et al. Outcomes of preterm infants < 29 weeks gestation over 10-year period in Canada: A cause for concern? J Perinatol. (2012) ;32: (2):132–8. |
[19] | Stoll BJ , Hansen NI , Bell EF , Shankaran S , Laptook AR , Walsh MC , et al. Neonatal outcomes of extremely preterm infants from the NICHD neonatal research network. Pediatrics. (2010) ;126: (3):443–56. |
[20] | Younge N , Goldstein RF , Bann CM , Hintz SR , Patel RM , Smith PB , et al. Survival and neurodevelopmental outcomes among periviable infants. N Engl J Med.. (2017) ;376: (7):617–28. |
[21] | Tyson JE , Stoll BJ . Evidence-based ethics and the care and outcome of extremely premature infants. Clin Perinatol. (2003) ;30: (2):363–87. |
[22] | Lee HC , Liu J , Profit J , Hintz SR , Gould JB . Survival without major morbidity among very low birth weight infants in California. Pediatrics. (2020) ;146: (1):e20193865. |
[23] | Ballabh P . Intraventricular hemorrhage in premature infants: Mechanism of disease. Pediatr Res. (2010) ;67: (1):1–8. |
[24] | Kaempf JW , Morris M , Austin J , Steffen E , Wang L , Dunn M . Sustained quality improvement collaboration and composite morbidity reduction in extremely low gestational age newborns. Acta Paediatr. (2019) ;108: (12):2199–207. |


