
Implementation of a quantum machine learning model for the categorization and analysis of COVID-19 cases
Abstract
Coronavirus is a new pathogen that causes both the upper and lower respiratory systems. The global COVID-19 pandemic’s size, rate of transmission, and the number of deaths is all steadily rising. COVID-19 instances could be detected and analyzed using Computed Tomography scanning. For the identification of lung infection, chest CT imaging has the advantages of speedy detection, relatively inexpensive, and high sensitivity. Due to the obvious minimal information available and the complicated image features, COVID-19 identification is a difficult process. To address this problem, modified-Deformed Entropy (QDE) algorithm for CT image scanning is suggested. To enhance the number of training samples for effective testing and training, the suggested method utilizes QDE to generate CT images. The retrieved features are used to classify the results. Rapid innovations in quantum mechanics had prompted researchers to use Quantum Machine Learning (QML) to test strategies for improvement. Furthermore, the categorization of corona diagnosed, and non-diagnosed pictures is accomplished through Quanvolutional Neural Network (QNN). To determine the suggested techniques, the results are related with other methods. For processing the COVID-19 imagery, the study relates QNN with other existing methods. On comparing with other models, the suggested technique produced improved outcomes. Also, with created COVID-19 CT images, the suggested technique outperforms previous state-of-the-art image synthesis techniques, indicating possibilities for different machine learning techniques such as cognitive segmentation and classification. As a result of the improved model training/testing, the image classification results are more accurate.
1Introduction
The severe acute respiratory syndrome coronavirus 2 (SARS-CoV-2) or 2019 novel coronavirus (2019-nCoV) is increasingly growing from its beginnings in Wuhan, Hubei Province, China, to the entire world [1]. Coronaviruses are encased positive vision RNA viruses with spike-like structures on their surfaces that have a crown-like structure underneath the optical microscopy, which is why the term Covid-19. Itsorts in size is around 60 nm to 140 nm size. HKU1, NL63, 229E, and OC43 are four corona infections that have already been found in humans and inflict moderate respiratory symptoms. People of every age are at risk. The virus is spread via massive particles produced by metastatic disease while coughing or sneezing, and they could also be spread by asymptomatic persons while a symptom arises [2]. According to studies, the mucous membrane has larger infection rates than the throat and without any change in virus weight among symptomatic and asymptomatic persons. Individuals could be pathogenic with as much as they have illnesses and even after they have recovered clinically. Certain persons might behave as extreme spreaders, spreading infectious particles up to 12 meters and depositing them on various surfaces. In suitable climatic circumstances, the virus could be detected on surfaces over weeks; however simple sanitizers that include sodium hypochlorite and hydrogen peroxide kill it in under a minute. Infections are transmitted by breathing such particles or by contacting infected objects and then touching the nose, mouth, and eyes. The infection is also found in the waste, and pollution of the groundwater resources, with subsequent transmission by aerosolization/fecooral pathway, is thought to be a possibility. COVID-19 causes a wide range of clinical indications, ranging from mild to severe respiratory distress syndrome and multi-organ dysfunction [3]. Fever, coughing, sore throat, migraine, weariness, nausea, muscle aches, and breathlessness are all commonly diagnosed symptoms. Conjunctivitis has been mentioned as well. As a result, it’s difficult to tell them from various breathing problems. In a small proportion of instances, the infection can quickly progress to pneumonia, respiratory arrest, and death. IL7, IL2, GCSF, IL10, MCP1, IP10, TNF, and MIP1A are all inflamed cytokine linked to that same progression [4]. Treatment and acute respiratory distress syndrome were the most common causes of dyspnea (ARDS). The affected patients required acute medical hospitalization. ARDS, severe lung injury, acute kidney injury and shock were among the consequences seen.
Covid 19 has a detrimental influence on the respiratory, causing destruction to the alveoli. The alveolus’ purpose is to carry oxygen from the lungs to the blood arteries [5]. The oxygen is delivered to the RBCs through those vascular systems, or capillaries (Red blood cells). RBCs are responsible for delivering oxygenation to all of the body’s internal organs. The infection causes damage to the alveolus and capillary walls and linings. Damaged material, such as plasma protein, collects on the alveolus wall, thickening the liner. The delivery of oxygenation to the red blood cells is hampered as the membranes swell [6]. The thicker the membrane becomes, the more challenging it would be to transmit oxygenation to red blood cells, resulting in respiratory problems as the body runs out of oxygenation. In addition, oxygen deprivation to the inner organs causes a deficiency in the system and inhibits immune functions. The system is fighting to enhance oxygen consumption at this point. And the body’s initial reaction is to eliminate the infection and prohibit it from replicating, but if the people have weakened resistance, the body refuses to budge, increasing the situation. When the air sacs were injured, an influx of fluid occurs, which is largely made up of inflammatory cells and proteins, and these fluids developand cause pneumonia. It reduces the amount of oxygen supplied to the lungs and obstructs oxygen diffusion. Because of the rarity of the Covid 19 variant, there is no quick medication to treat pneumonia in Covid patients diagnosed, which are instead treated with medical therapy [7].
The actual polymerase chain reaction (RT-PCR) technique is the typicalprocess for confirming COVID-19 infection, and most areas are experiencing a diagnostic material constraint because of the significant growth in the number of infected patients [8]. Furthermore, RT-PCR analysis seems to require a higher FNR as well as a long processing time. As a result, alternative analysis methods for detecting COVID-19-infected individuals should be considered in order to isolate individuals and reduce the pandemic’s influence on the lifestyle of so many others. Identification of COVID-19 pathologies in an individual that is quick, available, inexpensive, and accurate is critical to reducing the spread of COVID-19 infections. The goodmethod for detecting coronavirus is converse transcriptase quantitative polymerase chain reaction (RT-PCR) assays. CT is a non-invasive diagnostic imaging modality that has been adopted since it is predictable as a viable approach for enhanced interior permeability identification and evaluation [9].
To analyze features within the human body, healthcare professionals using computed tomography, generally known as a CT scan. A CT scan captures an image of a cross-section of the human body using X-rays and technology. It captures photographs of the skeletons, bones, lungs, bloodstream arteries as well as other organs within small “slices” such that medical providers mightdetect the body in extreme detail [10]. X-ray devices that employ permanent tubing to point X-rays at a particular place are known as traditional X-ray devices. X-rays are collected in differing proportions by different organs as they pass through the body. Against the black background of such an image, greater density tissue produces a brighter image than other layers. X-rays generate two-dimensional pictures. Doughnut-shaped tubing circulates the X-ray 360 degrees surrounding the body during a Computed tomography. Diagnostics therapy, image-guided treatment, and the monitoring of medicinal and surgical results all benefit from CT technology [11]. The advancement of CT technologies and applications strives to develop image resolution, reduce execution times, and drastically increase the therapeutic potential of conventional CT. Furthermore, a CT scan diagnostic could be more reliable than a blood sample like CRP (C-Reactive Protein Level). Many of the other cases have previously tested negative with CRP but were detected as important with a CT scan, as well as the ensuing CRP testing were certified positive, proving that CT scans are so much more accurate than blood sample. As a result, it might be hard to see the difference amongst different tissues and organs, either between normal and ill tissues inside the same organs. In this study, the Q-deformed entropy is employed to discriminate between the COVID-19 coronavirus and a regular CT scan [12].
Image analysis is necessary for a wide range of scientific and technological sectors, from diagnostic imaging to computer engineering and autonomous vision. Image analysis, which is used in a variety of applications and is dependent on continuous technological development, necessitates a variety of techniques and machine learning algorithms, as well as ongoing improvements and enhancements to existing techniques [13]. As a result, the scope of the assessments where it is involved is as broad as the potential future advancements. Acquiring useful info by extracting particular features from images stored in massive data sets or acquired in actual time is a difficulty in image processing. Face identification and verification, character segmentation, and parameterization calculations for virtual reality and other innovations are only a few of the difficulties that require feature extraction. The safe encryption and decryption of multimedia information is yet another issue. Such activities necessitate the use of advanced mathematical modeling techniques [14]. Entropy plays a key part in all of the activities. The texture feature is vital throughout many clinical image analyses, and it offers a major benefit in medical image categorization. Entropy has indeed been generalized and used in a wide variety of technical subjects. One of the most important features extraction approaches is entropy-based techniques, which are capable of identifying minor modifications to image pixel intensities and also refining textural features [15]. The Q-Deformed Entropy (QDE) feature extraction approach is presented for extracting texture features off CT images, which is influenced through the distortion principle in q-calculus, which that was extensively studied within numerous physical domains.
CT is an imaging modality which is non-invasive and is being used to identify lung infiltration and assess COVID-19 seriousness. COVID-19 has always been the subject of a great deal of research in the literature. The study’s major goal is to create a conceptual framework to address the current restrictions [16]. As a result, improved classification performance is suggested using a QDE model. Quantum neural networks were used to learn the intricate patterns found in the photos. A 4-qubit quantum circuit was used to create it. Purpose of provide substantial enhancement in the acquisition of intricate patterns, so the number of layers with the best learning parameters are chosen. Quantum machine learning is an application of study that looks at how quantum computing and machine learning theories interact [17]. Quantum computing uses quantum physics characteristics to solve issues that would be impossible to solve with traditional devices. Qubits are used in quantum computers. Qubits are similar to conventional computing bits in that they can be placed in a superposition and exchange interaction with others. The foundation of QML is quantum data and hybrid quantum-classical models. Every collected data that happens in a naturally or artificially quantum system is referred to as quantum data. Quantum data display combination and entangled, resulting in combined probabilistic which might take a significant portion of traditional computing resources to express or save. Information with a quantum mechanical source could be represented and generalized using a quantum framework. Quantum models could not generalize quantum data utilizing quantum computers only because near-term quantum processing is still limited and imprecise [18]. Quantum techniques could also convert data that aren’t 1s or 0s, including such complicated data or negative values. Figure 1 shows a typical model creation flow diagram, which explains the essential control flow of Quantum machine learning approaches [19].
Fig. 1
Block diagram of QML.
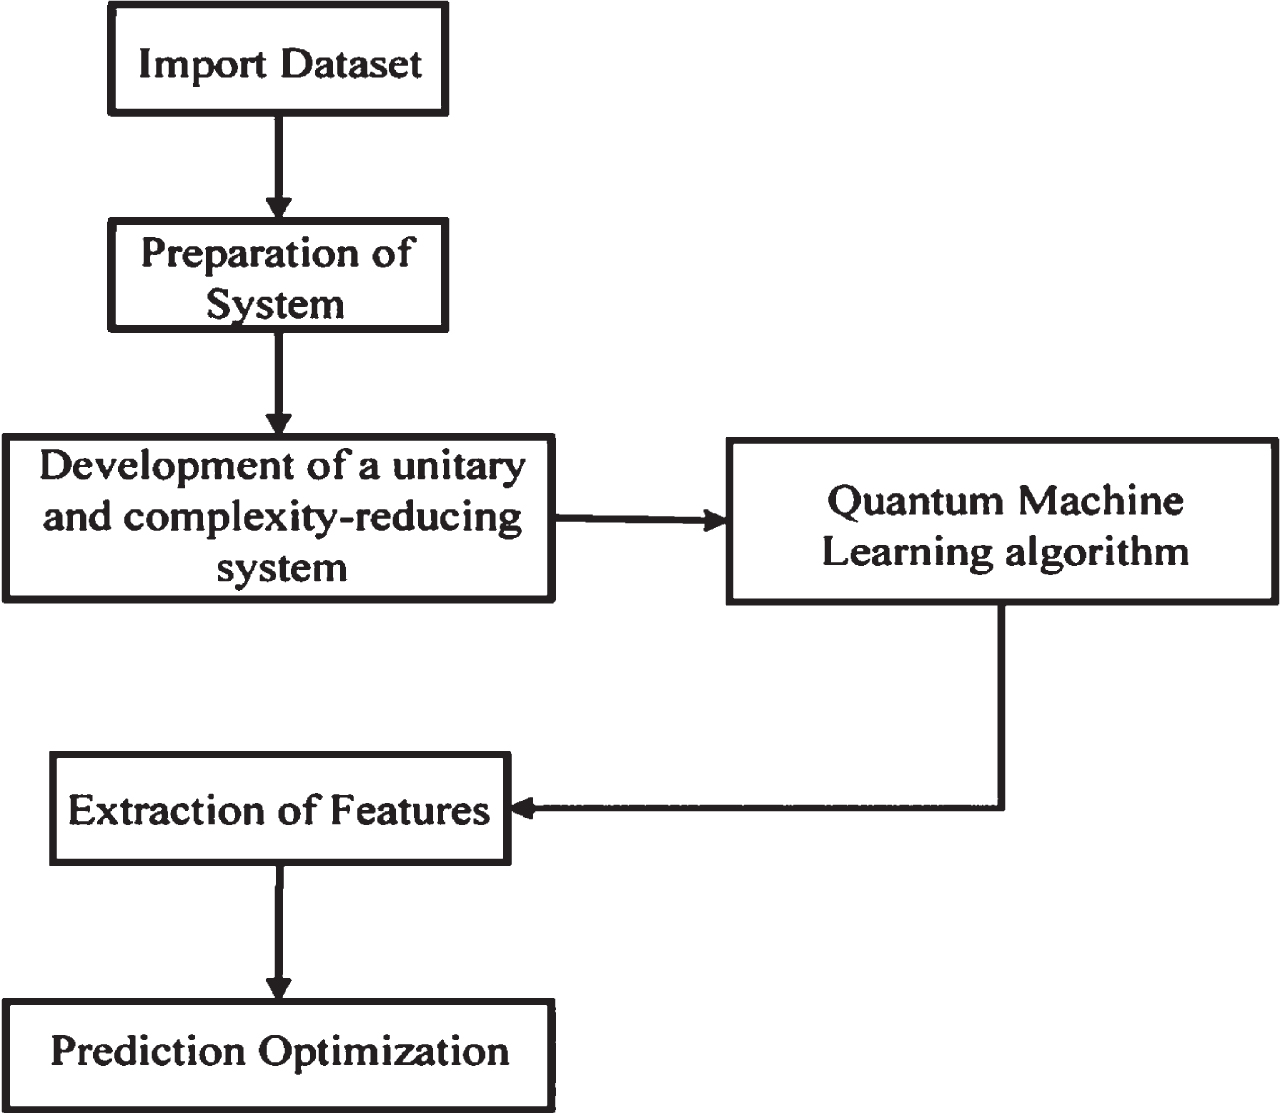
Quantum computers, in the modern environment, could be used and developed similarly to neural networks. To address an issue, physical control parameters can be changed systematically like electromagnetic field intensity or laser pulse speed. A parametric quantum mathematical model which is efficiently performed on a quantum system is described by a quantum neural network (QNN) [20]. Quanvolutional neural networks are a revolutionary way of extending the possibilities of convolutional neural networks (CNNs) by utilizing certain uniquely important characteristics of quantum processing. The quantum convolutional (or quanvolutional) layer is a different class of transformative phase added to the classic Convolution layer by QNNs. Quanvolutional stages are built up of a set of N quantum filtering that produces characteristics mappings by selectively modifying raw data, somewhat like its classical convolutional layer equivalents. The major distinction is that quanvolutional filtering retrieves characteristics from raw information by employing randomized quantum circuitry to modify temporally local subgroups of input. From the unifying framework, QNN will handle typical deep learning issues to be substantially quicker.
The remaining sections of the paper are arranged as follows: aIn section 2, the related work was presented. The statement of the problem is found in Section 3. The proposed Quantum machine learning for detecting and analyzing covid-19 is described in Section 4. Section 5 put the proposed methodology to the test in terms of performance and efficiency, with figures and charts displaying the findings. The final section summarises the paper’s conclusions.
2Related works
The recently discovered Coronavirus infection, dubbed COVID-19, is extremely transmissible and dangerous, and there is no medically licensed medication used to prevent or vaccine to treat it. COVID-19 is characterized by a persistent cough, hoarseness, and temperature. Peripheral embolism, Septicemia, multi-organ dysfunction, and severe respiratory distress syndrome could all occur if conditions develop into a catastrophic type of pneumonia. Although medical imaging is really not previously required for the requirements and procedures of COVID-19, computer-aided diagnosis tools can be utilized in the timely identification of COVID-19 anomalies as well as the monitoring of malignant transformation, thereby lowering rates of death. DenseNet, InceptionV3, VGGNet, ResNet, Xception, MobileNet, NASNet, and InceptionResNetV2 are picked from a collection of deep CNN to achieve more accurate characteristics, which would be a key factor in learning. The collected characteristics were again loaded inside a sequence of computer vision classifications to define whether the individuals are coronavirus cases or not. The methodology avoided task-specific data pre-processing methods in order to create a greater generalisation ability for different datasets. The publicly accessible coronavirus collection of lung X-ray and CT images, the suggested theory’s effectiveness was evaluated. The DenseNet121 learning algorithm combined with the Bagging classification model produced some of the best results with the highest classification results. The second-best learning was a mix of a ResNet50 learning algorithm training by LightGBM and a ResNet50 features extraction. This research, however, does have drawbacks. There are only a few training and testing samples available. Expanding the database size with different data resources could help comprehend the proposed method properly. Furthermore, using already trained systems as featuresextracts necessitates rescaling the input images to a specific dimension, which could result in the loss of essential information. A common DL based features extracting framework for COVID-19 classification is evaluated in this study [21].
Area under the receiver operating characteristic curve for the techniques for the entire OSR database varied between 0.73 to 0.80; for the COVID-specific database from 0.83 to 0.87; and for the CBC database from 0.74 to 0.86. The verifications likewise yielded positive findings, with AUC ranging from 0.75 to 0.78 and sensitivity ranging between 0.82 to 0.87. For the faster and expensive identification of COVID-19-positive individuals, ML could be used in genetic screening as a supplement or alternative to rRT-PCR. This is enormously beneficial in poor countries or countries where pathogenic organisms are on the rise The experiment, however, it is time-consuming, necessitates the usage of sophisticated equipment and reagents, necessitates the active participation of specialized and learning features for data gathering, and focuses on the appropriate biological preservation of the RNA sequences used to anneal the primer pairs [22].
It is incredibly useful in areas where rRT-PCR reagents and specialist laboratories are in short supply, such as developing countries. Researchers made a Web-based clinical referencing and assessment option available. However, the generalisability of the models is restricted by the need for more health professionals to verify the actual Decision Tree, as well as the fact that it is impossible to build a higher precise so only physicians could utilize it as a suitable decisions aid to perceive testing done in Coronavirus suspicious instances [23].
Researchers kept track of and plotted model damage and accuracy of the proposed for every training across to figure out whatever factors affect predictive accuracy, and researchers discovered that using the softmax layer and SGD optimization method gives higher accuracy and loss, while modifying the amount of ammunition gives higher prediction accuracy and failure. The suggested federated learning approach, on the other hand, takes longer to train than typical machine learning models [24].
Saliva offers several benefits as a mixed solution for detecting SARS-CoV-2 communicable disease, including the convenience of gathering, low supply and training requirements, and security. To assess the positives and the negatives of saliva-based screening, comprehensive verification in a significant number of deliberately obtained materials with undetermined SARSCoV-2 conditions should indeed be done. Utilizing real-time polymerase chain reaction (rt PCR (RT-PCR) and droplet virtual PCR (ddPCR) readings, researchers established a saliva-based diagnostics workflow for the identification of SARS-CoV-2 nucleotides and evaluated specimens from 137 outpatient clinics evaluated with curbside research capacity and 29 inpatient care hospitalized for COVID-19. However, lacking a standard graph, RT-PCR somehow doesn’t produce statistical results, that are not routinely performed among most diagnostics laboratories [25].
3Problem statement
COVID-19 identification is a tough task due to the clear lack of information and the complex picture elements. Utilizing computed tomography imaging, COVID-19 cases could’ve been found and studied. Computer Tomography imaging provides the advantages of rapid detection, low cost, and excellent sensitivity when it comes to detecting lung infection. The improved Q-Deformed Entropy (QDE) algorithm for CT image scanning is proposed as a solution to this problem. Quantum Machine Learning (QML) is used to assess techniques for improvement due to rapid advances in quantum mechanics. The classification of corona diagnosed and non-diagnosed images are done using a Quanvolutional Neural Network (QNN).
4Proposed methodology
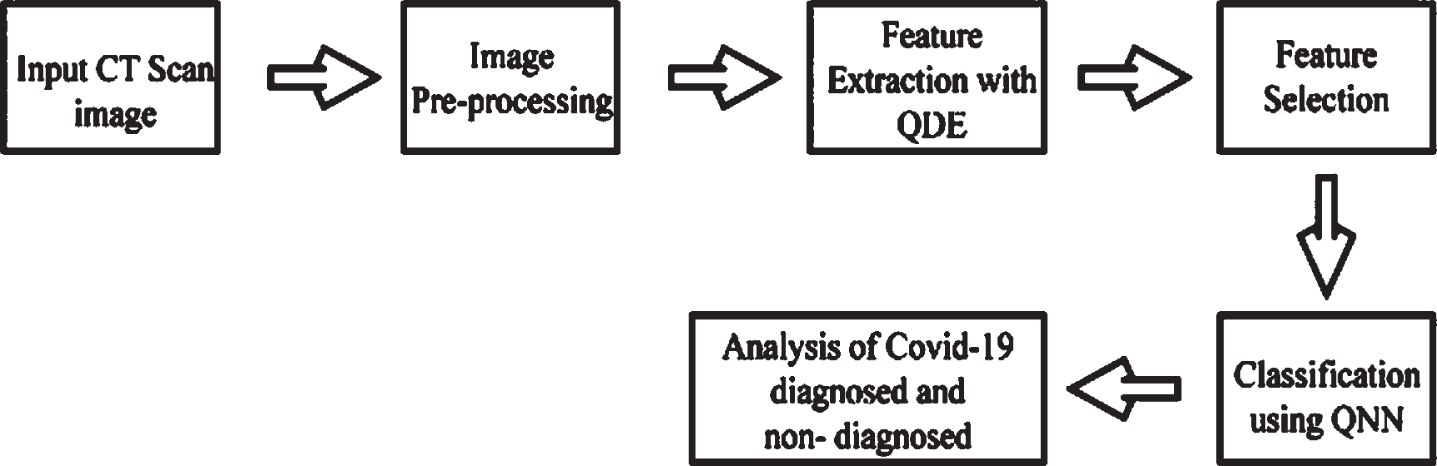
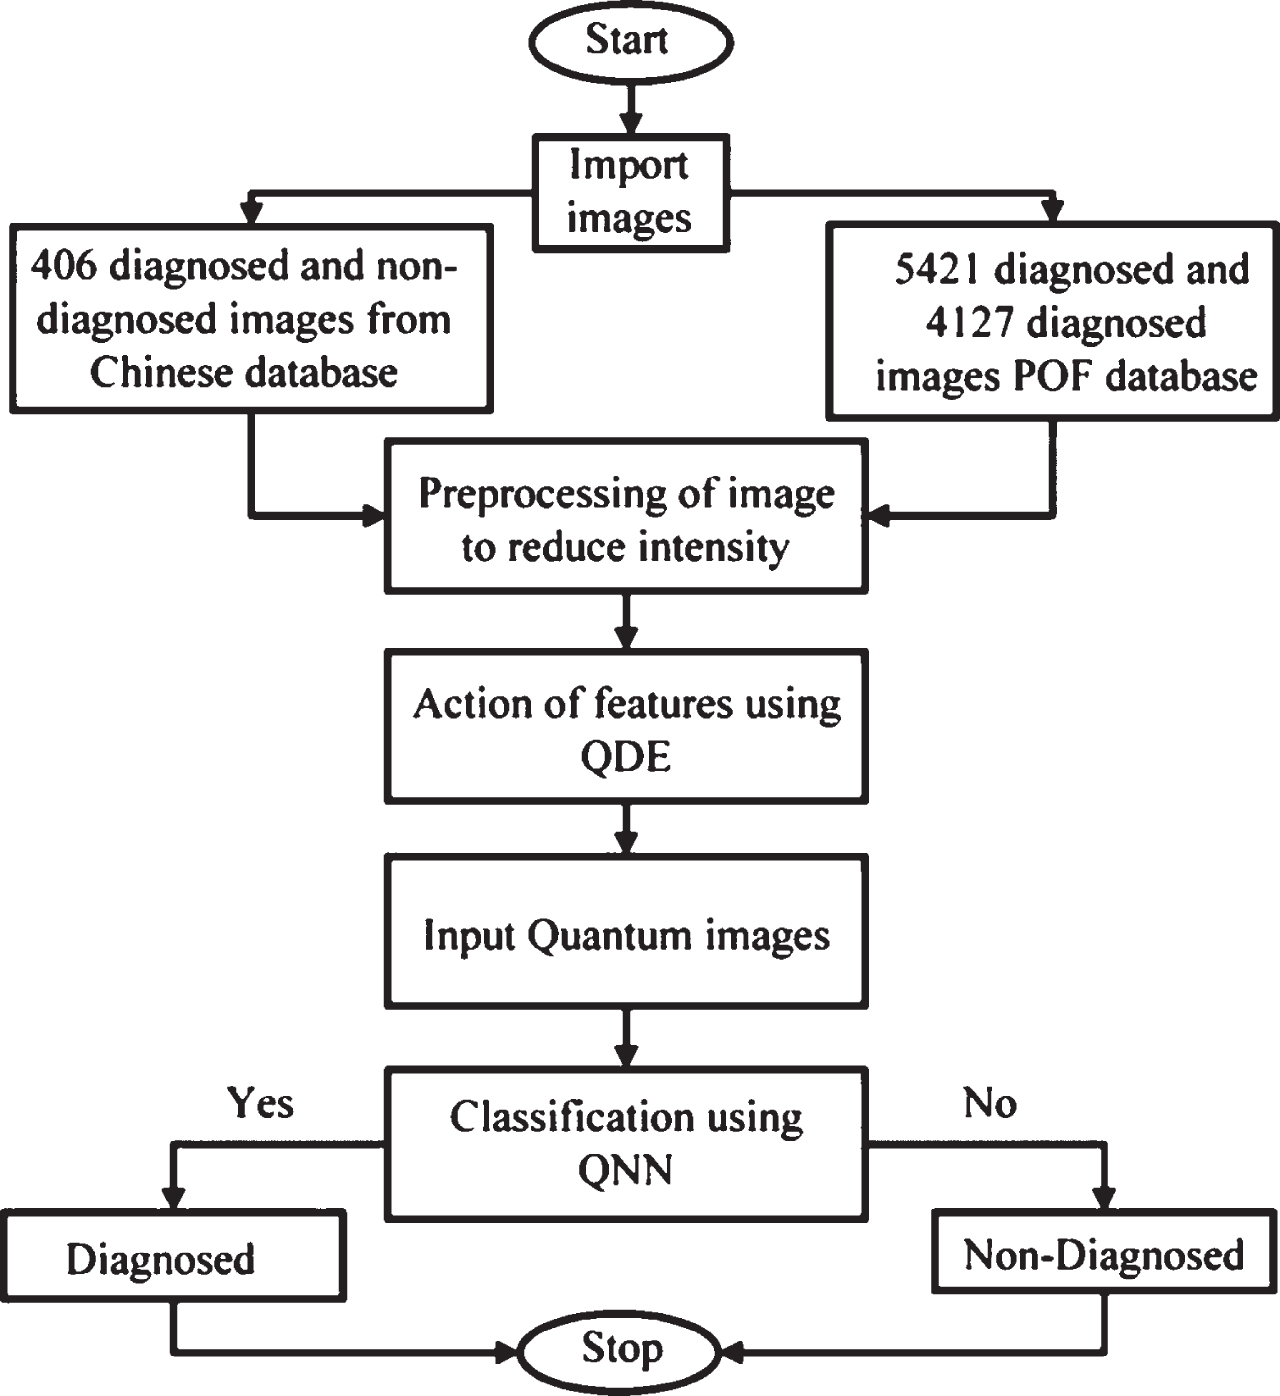
Images from CT scans are imported. The intensity of the images is lowered and normalized in the image pre-processing phase, which improves classification efficiency. The required features are extracted during the feature extraction method, which is a crucial part of several medical image studies and offers a substantial benefit in medical image analysis. The individuals that have been diagnosed as well as those that have not been diagnosed are next analyzed utilizing the classification procedure. Figure 2 depicts the analyzing process.
Fig. 2
Analysing process of Covid-19 diagnosis and non-diagnosis.
4.1Dataset acquisition
The suggested technique is tested on a benchmark dataset, which is the Chinese dataset collection, which includes 780Corona virus positive and negative images of 216 cases and is openly available. The second dataset comes from POF Hospital Pakistan, and it includes 4127 COVID-19-free CT images and 5421 COVID-19-affected CT images. Table 1 presents both the Chinese data collection and POF characterization. It has specific collection of pictures of 390 normal and 390 COVID-19 and POF with a total of 9548 mages. During classifier training and validation, 780 pictures from the Chinese dataset collection and 9548 images from the POF database were used. 0.4 & 0.5 hold-out verification is used to supply the photos to the training and test sets. 60% of the sample was used for training and 40% for assessment in 0.4 cross-validations. The dataset is generally split into two 0.5 cross-validation subsets, one for training and another for testing.
Table 1
Dataset description
| Database | Database 1 | Database 2 |
| Non diagnosed | 390 | 4127 |
| C-19 Diagnosed | 390 | 5421 |
| Overall images | 780 | 9548 |
4.2Pre-processing
The many forms of CT artifacts that result from the image reconstruction phase are determined by taking a thousand separate detection observations. Each and every error within those dimensions would then impair the scan and cause intensity difference among sequential slices of the recreated CT scan. As a consequence, before the extraction of features, a collection of image mechanisms is being utilized to normalize the intensity and decrease the impacts of intensity changes among both CT slices, as well as increase the speed of the QNN training and improve classification efficiency. Furthermore, because of its axial image of a CT scan that comprises a substantial percentage of unimportant pixels, such procedures aid in distinguishing the boundary of a lung from its neighboring thoracic tissues. By normalizing the intensity distribution by the average rating of every CT slice separately, histogram thresholding has been utilized to extract the backgrounds of a CT lung imaging. Following that, morphology techniques including dilatation and gap filler have been used to eliminate any holes that may have appeared in the segmentation process. The segmentation mechanism’ problems are therefore addressed by deleting all smaller linked items. As a result, the raw CT lung image is divided with a binary string with 1’s indicating the lungs and 0’s indicating the backdrop to recover just the relevant lung areas.
4.3Feature Extraction with Q-Deformed Entropy (QDE)
The research of precise parameters that are linked to dynamic outcomes is known as deformation theories. As a result of using the fractional derivative calculus approach to address a subject with constraints, the exact parameters are indeed the result. Quantum calculus, often known as calculus without limitations, is a type of reliable calculation that does not use the concepts of limitations. As demonstrated in Equation (1), quantum computing defines as a “q-calculus”.
(1)
(2)
Many modern notions, like entropy and probabilities density functions, are modified using the Box–Muller transformation. As seen in Equation (3), Equation (2) predicts the generalized d-deform Box–Muller transformation:
(3)
Through consuming the QDE for image extracting attributes, let’s deliberate the assessment of each of the pixels as a positive integer, thus using the radius (|d|) to avoid using numerical methods. As a result, by solving Equation 3 for |d| and accounting for the positive integer of a, we get |d|<3.
The proposed method calculates the above-mentioned d BM using the efforts image’s frequency data, which gives a reliability element for analyzing its development. The d BM fractions algorithm has been improved by the fact that it would be responsive to non-textured portions with low occurrence. Furthermore, it enhances certain patternsand particular variances in parts wherein pixels requirements are rapidly moving with high occurrence.
After that, Equation 4 is used to define the QDE (4). Initial is the entropy transform to a schemes imagery casing a sub-scheme. The following calculates the picture’s complete entropy using its pixel value. It approximately represents the likelihood of the picture’s organisms being in that condition. It effectively states the entropy regardless of its characteristics caused by changes, which could also include energy, throughout this case. Additionally, it contains logical conditions including visual information. Following the treatment described before, an entropy conversion is applied as shown in Equation (4).
(4)
Here 0 < d<3 denotes the image’s localized modification, I m is frequently known as the image’s energy, denoting the difference between brightness and darkness in grey images as well as the difference in colors in multi-colored pictures in the recommended range. The pixels probabilities and also the d BM were used to calculate the I m equation. In the figure, Equation (4) shows a comparable link between entropy and energy motion, indicating that the transformation is adaptable. The suggested QDE is based on picture quality and the brightness of the grey levels, which is determined by the textural quality of the image. To retrieve the QDE textures, the CT lung picture is retrieved into non-overlapping blocks of size q×q pixels, subsequently calculating the QDE for every block. Every CT lung image has a minimum of 15 QDE characteristics.
| Algorithm 1: QDE algorithm for Feature Extraction |
| Start |
| Import input mage, 0 < d<3 |
| for every input |
| f |
| do |
| (p1,p2, . . . pn) split into a number of blocks with q*q sizes |
| for x = 1 to n |
| x implies the ith block of q*q Equation 5 |
| end for |
| F=(1,2, . . . n) |
| end for |
4.4Classification with Quanvolutional Neural Network (QNN)
QNN works similarly to a traditional convolutional layer in that it takes a subset of the original image, passes it through the kernel, and afterward outputs a portion of the new image. Quanvolutional layers act on raw data by selectively changing the information using a set of random quantum circuitry, similarly to how random convolutional filtering levels modify information. The image data are separated into 4×4 square sections and implanted into the quantum circuitry in the suggested quantum machine learning algorithms. The quantum pictures were created via parameter revolutions with the quantum mechanical quantum bits initialized. The quantum parameter estimation circuits could be used to make the unitary throughout this procedure. Eventually, a conventional set of expectation values is used to calculate the quantum state. Those parameters are transferred into the output’s variation channels (single-pixel). The procedure is continued in different locations; for example, some would run the entire image and generate a multi-channel image. Using classical or quantum layers, quantum convolutional could be implemented.
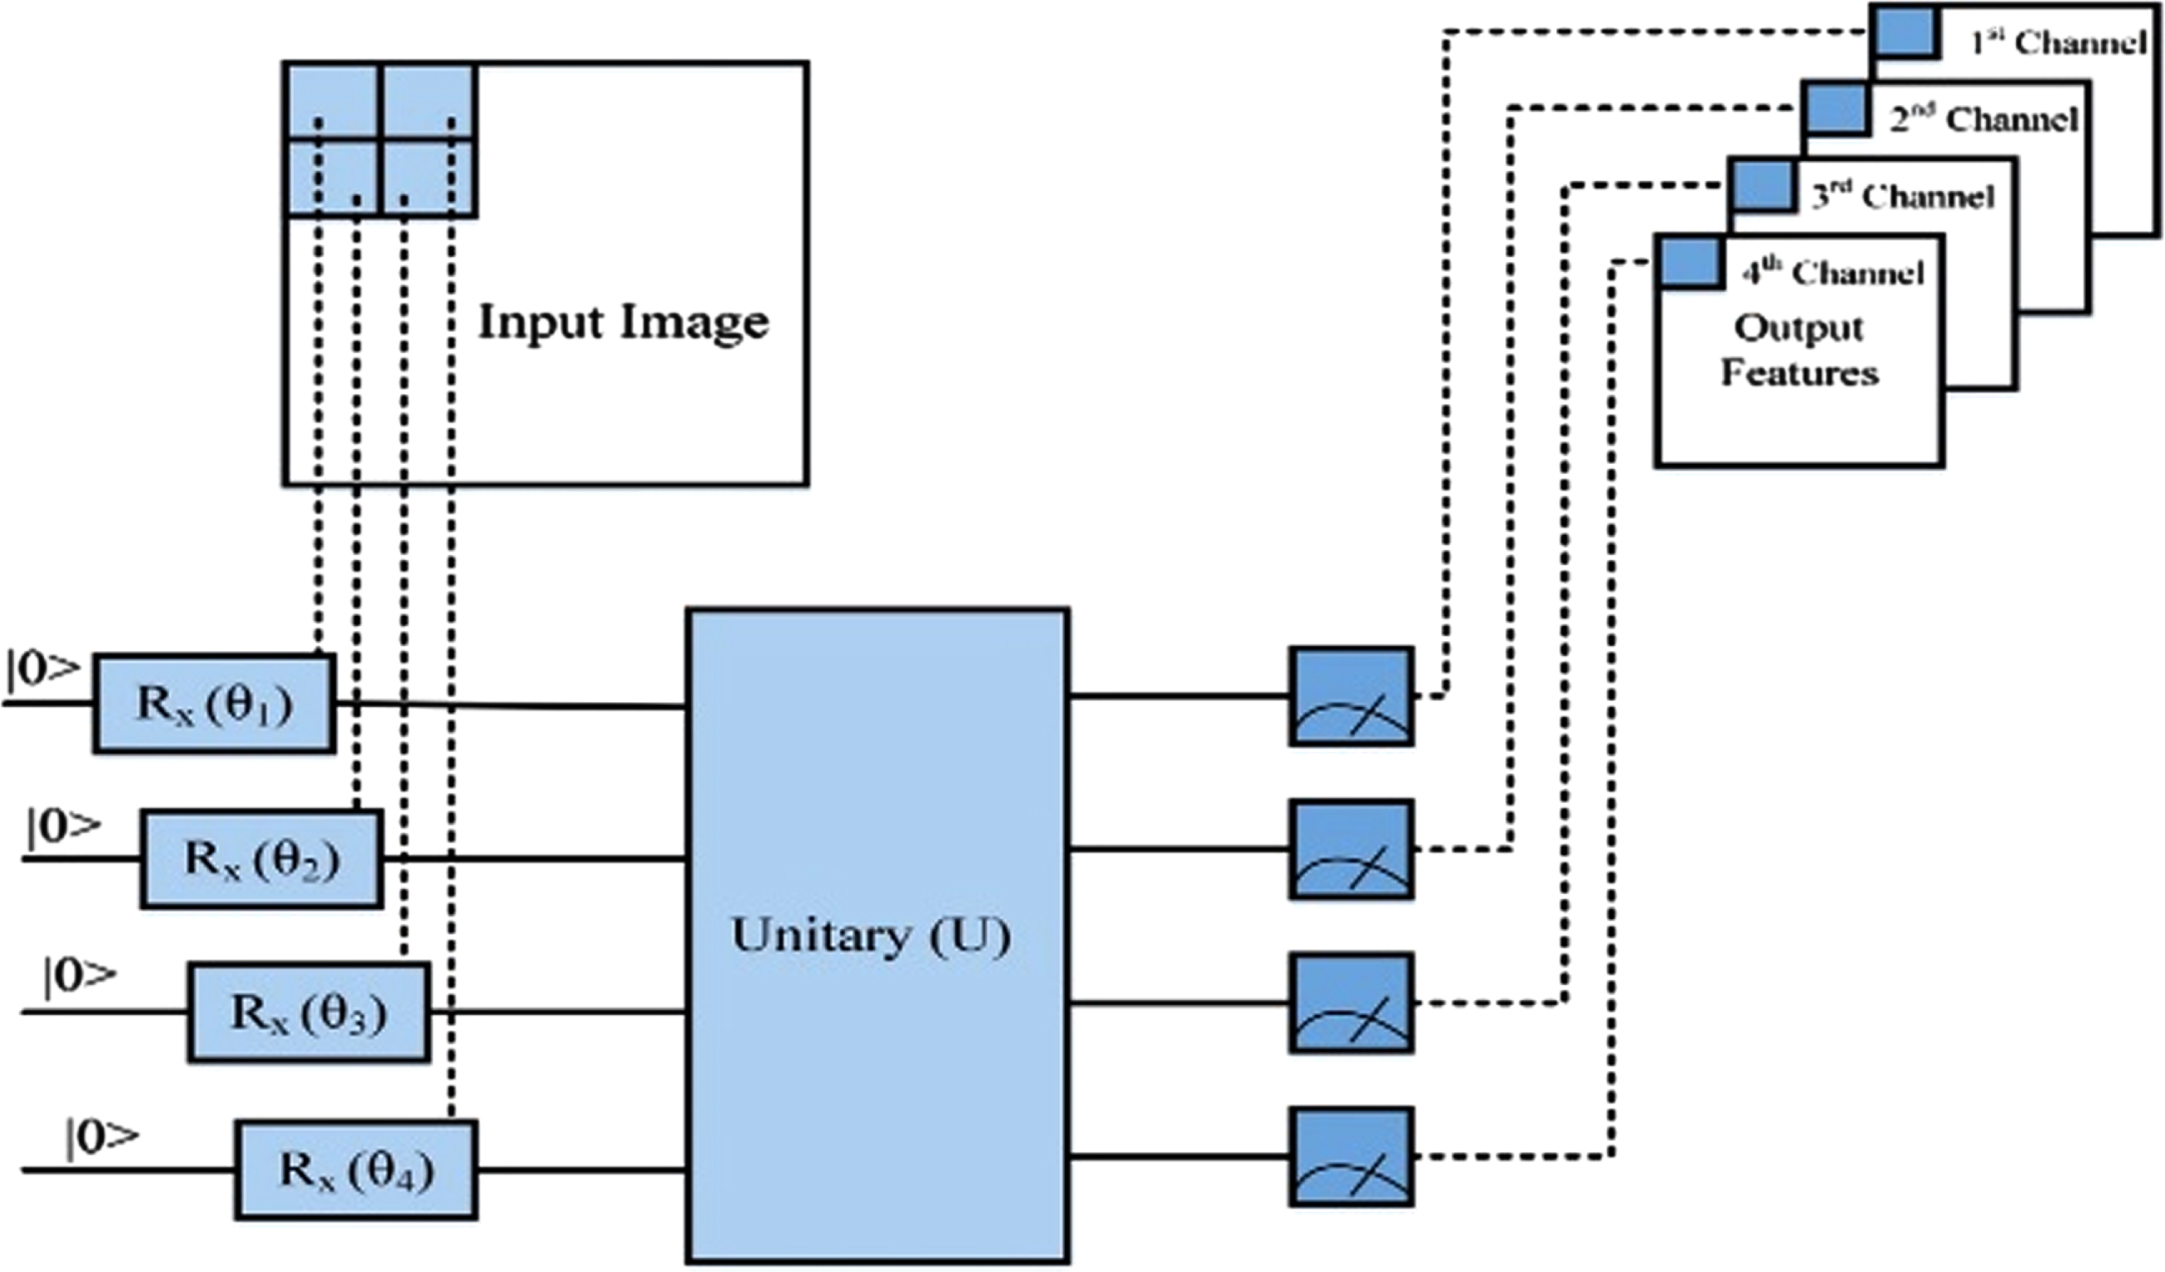
The penny lanes qubit system was set up to emulate a four-qubit computer. The term q-node refers to a quantum circuitry made up of Ry integrated localized levels, scaled by component and n random circuits levels. Four anticipation parameters are generated in the last computing evaluation. The input images are separated into 2×2 square pixels via a convolution method, but every square is analyzed throughout a quantum circuitry. Lastly, the four expectations variables are transferred onto four output channels in a single pixel. The approach might be useful for near-term quantum mechanics if such quantum modifications generate relevant features for supervised classification. It provides limited quantum circuitry with hardly any debugging. The QNN structure is depicted in Fig. 3, which aids in knowing the Quantum network modelling approach. And the pattern repeats until everything reaches the linear phase, that categorizes the image.
Fig. 3
Quanvolutional neural network’s structure.
The research used a novel iteration of a learning approach to undertake an experimental investigation in a position to take account of quantum operating systems to accomplish active learning utilizing quantum information. Figure 4 depicts the proposed QNN building blocks. From the framework model, Quanvolutional neural network (QNN) is hypothesized as would address standard deep learning tasks in a substantially quick and timely manner. The 4-Qubit quantum stages, 03-dense levels having specific activating modules, and drop-out levels are among the layers found in a novel QNN. To substitute the convolutional layer, the quantum layer is placed. The 20×20-dimension quantum samples are generated using the 4-bit quantum. A dense level via ReLU and softmax with distinct activating factors is added after the quantum-produced images are acquired in a process. The quantum pictures are sent to QNN, wherein 60, 500 neurons having ReLU AF and 2 neurons of softmaxutilize 3 dense layering and 2 neurons using softmax for feature mapping. The 0.5 drop-outs are factored into the equation.
Fig. 4
Proposed QNN’s building blocks.
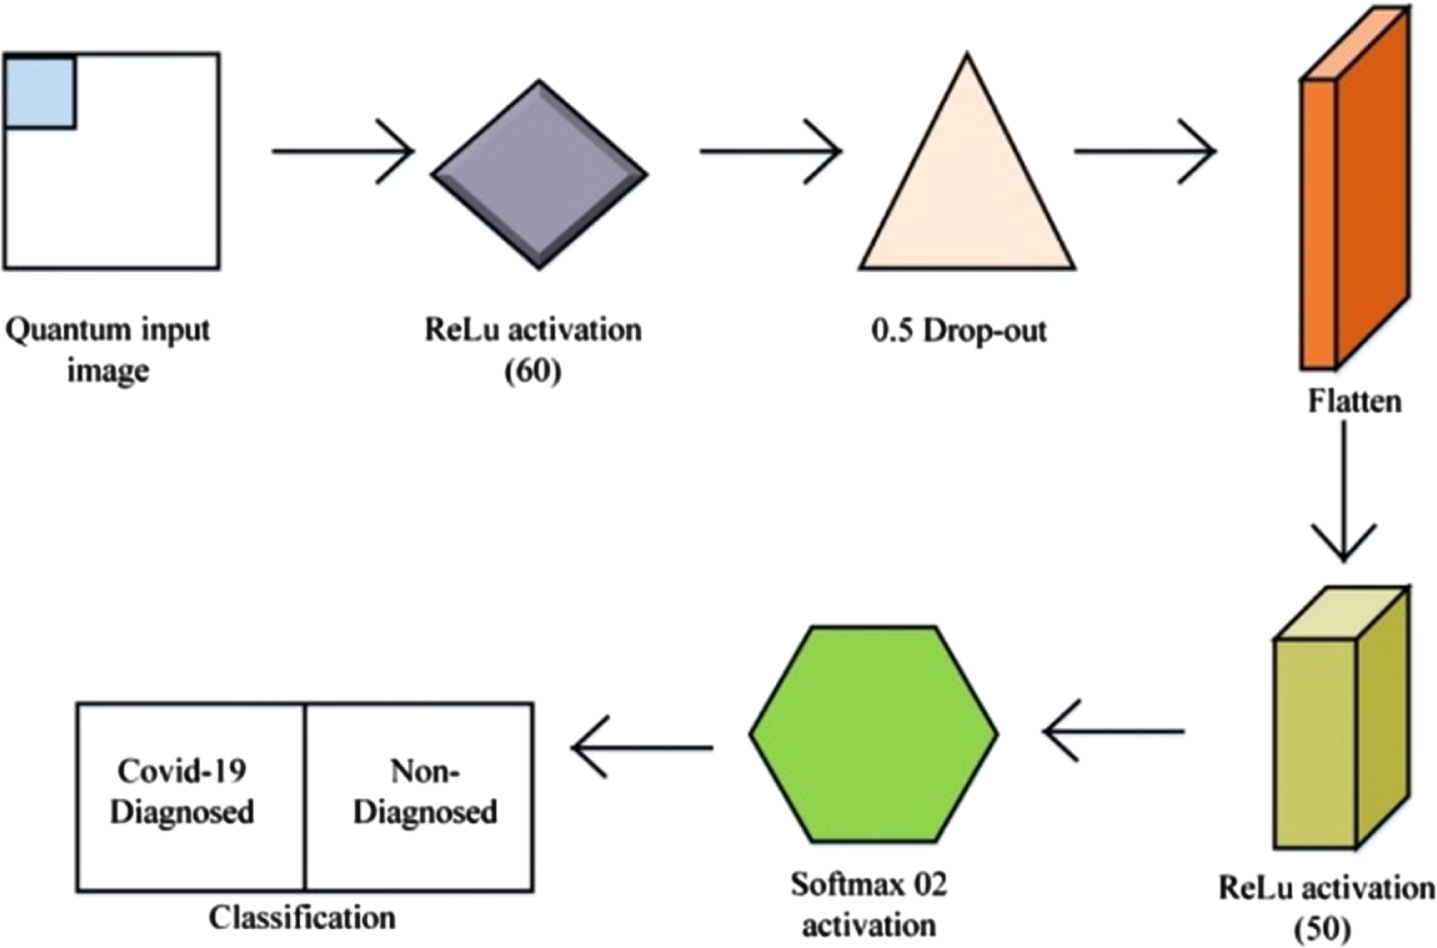
Figure 5 depicts the analyzing and classification process utilizing Quanvolutional Neural Network. First, start the process and import the CT scan images with 780 diagnosed and non-diagnosed of Chinese databases and 9548 images fromthe POF database. Then pre-process the imported image to reduce and normalize the intensity which speeds up the classification process. Later import the quantum image which is extracted to classify the image. Finally, stop the process. These steps help classifies and analyzes the Diagnosed and non-diagnosed images.
Fig. 5
Flowchart of the classification process.
5Result and discussions
The research uses a WINDOW-10 SSD, COREI7 CPU, an NVIDIA 2070, and GPU 16 GB RAM. To extract the feature, the QDE approach is formulated. The QNN algorithm is used to conduct image categorization. The findings of the classification are evaluated to those of other existing approaches. The proposed technique is tested on two benchmark datasets, one of which is publically available, the Chinese dataset, which have780 COVID-19/non-COVID-19 pictures of 216 patients. The second dataset comes from POF Clinical Pakistan, and it includes 4127 COVID-19-free CT images as well as 5421 COVID-19-affected CT images. 0.4 and 0.5 hold-out validating are used to supply the whole photos to the training and testing. 60% of the data has been utilized for training and 40% for testing in 0.4 cross-validations. Each sample is split into two distinct 0.5 cross-validation sections, including one for training and another for testing. The COVID-19 classification is achieved with 0.4 and 0.5 cross-validations using the QNN method.
Table 2 shows its classification performance of the QNN network on the Chinese data collection utilizing 0.4 cross-validations and Fig. 6 shows its graphical representation.
Fig. 6
Graphical representation ofthe classification of QNN in 0.4 CV.
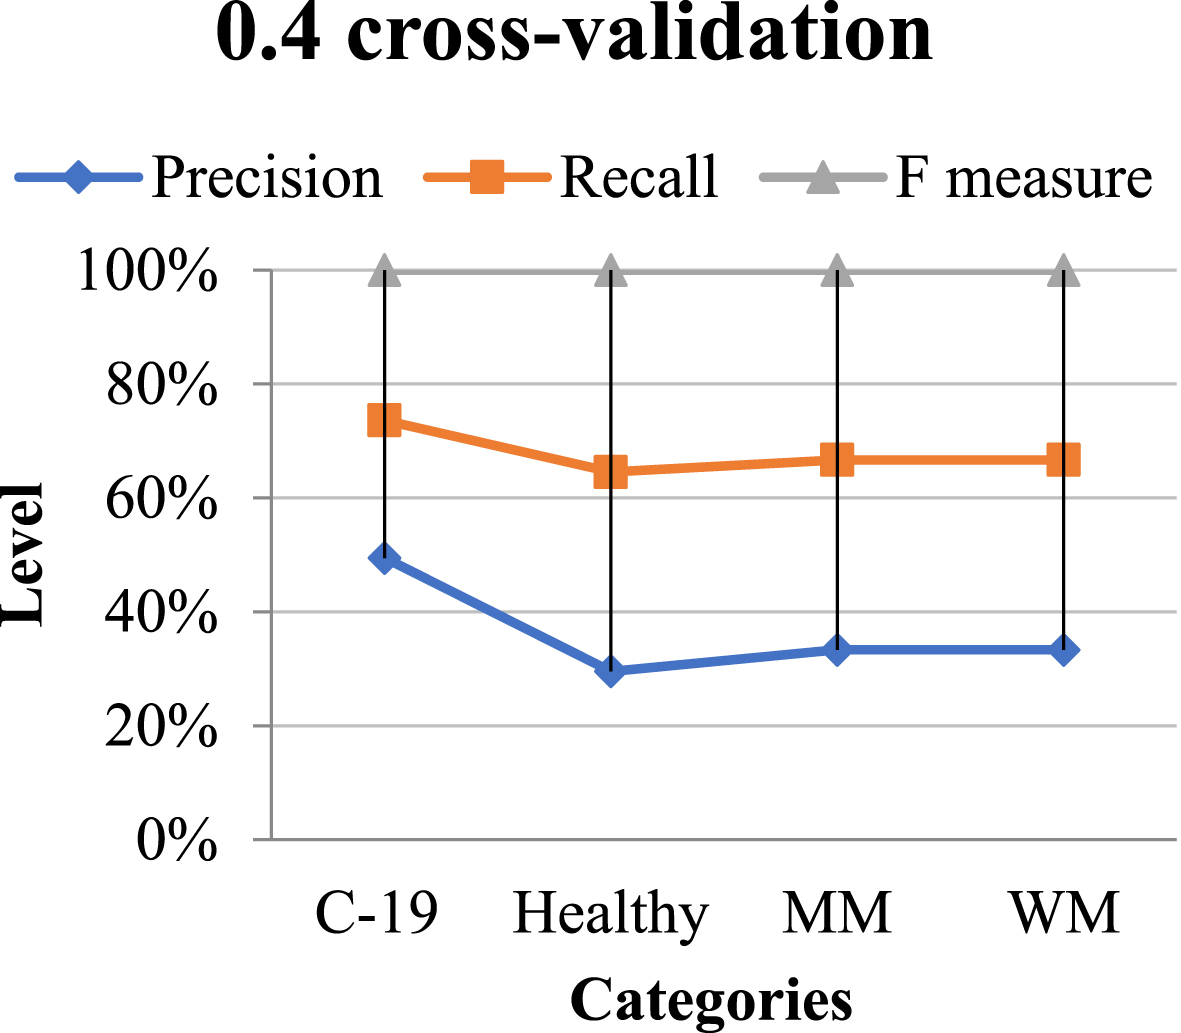
Table 2
Classification performance using 0.4 CV
| Categories | Pre | Re | F1 |
| C-19 Diagnosed | 0.45 | 0.22 | 0.24 |
| Non-Diagnosed | 0.60 | 0.71 | 0.72 |
| Macro-median | 60.79 | 60.79 | 60.79 |
| Weighted median | 60.79 | 60.79 | 60.79 |
Table 3 shows the effectiveness of the QNN system employing 0.5 cross-validationsupon the Chinese database and Fig. 7 depicts its graphical representation.
Fig. 7
Graphical representation of the classification of QNN in 0.5 CV.
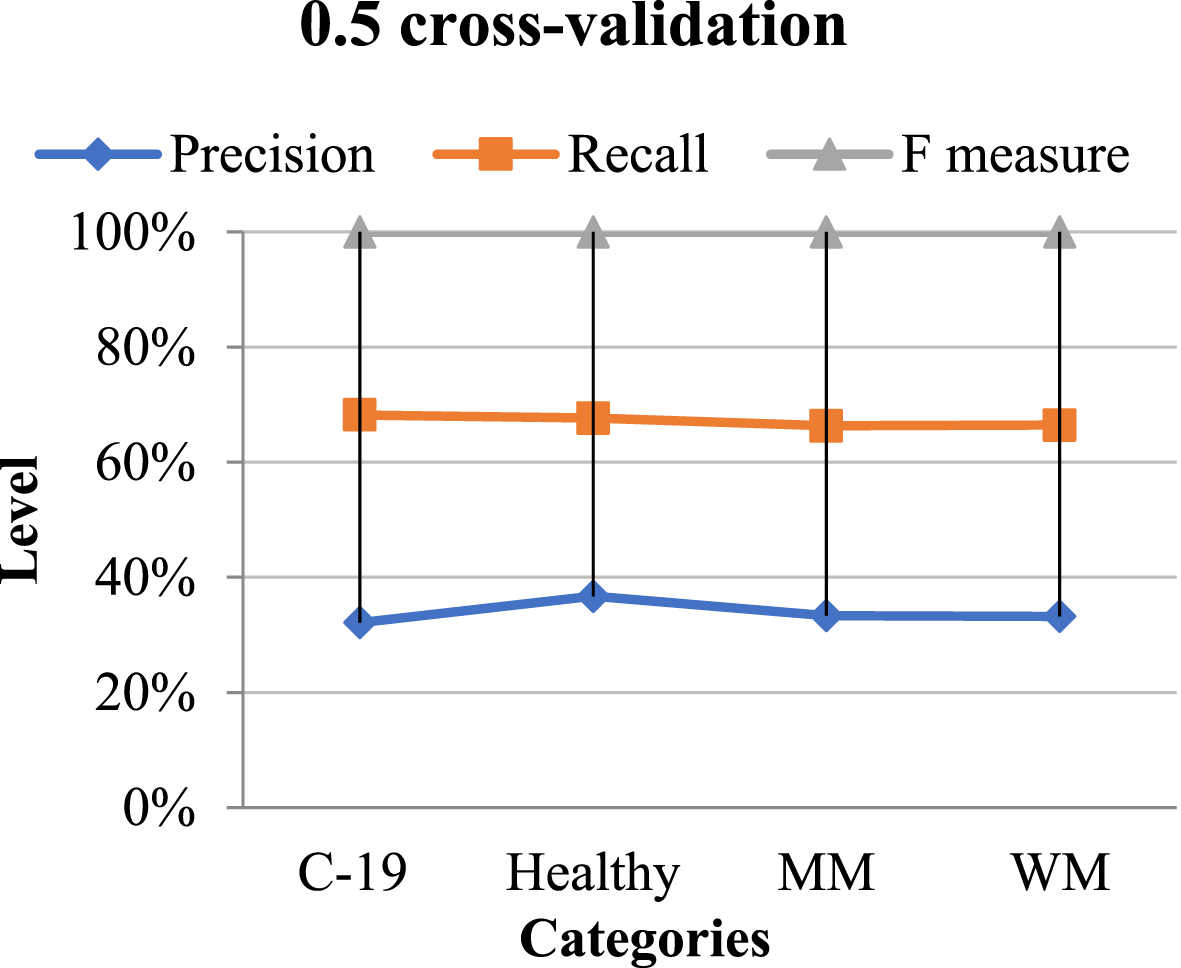
Table 3
Classification performance using 0.5 CV
| Categories | Precision | Recall | F-measure |
| C-19 Diagnosed | 0.98 | 1.10 | 0.97 |
| Non-Diagnosed | 1.09 | 0.92 | 0.96 |
| Macro-median | 0.97 | 0.96 | 0.98 |
| Weighted median | 0.97 | 0.97 | 0.98 |
Table 4 shows its classification results on the POF clinical database employing 0.4 cross-validations, with a graphical depiction in Fig. 8.
Fig. 8
Graphical representation of the classification of QNN in 0.4 CV.
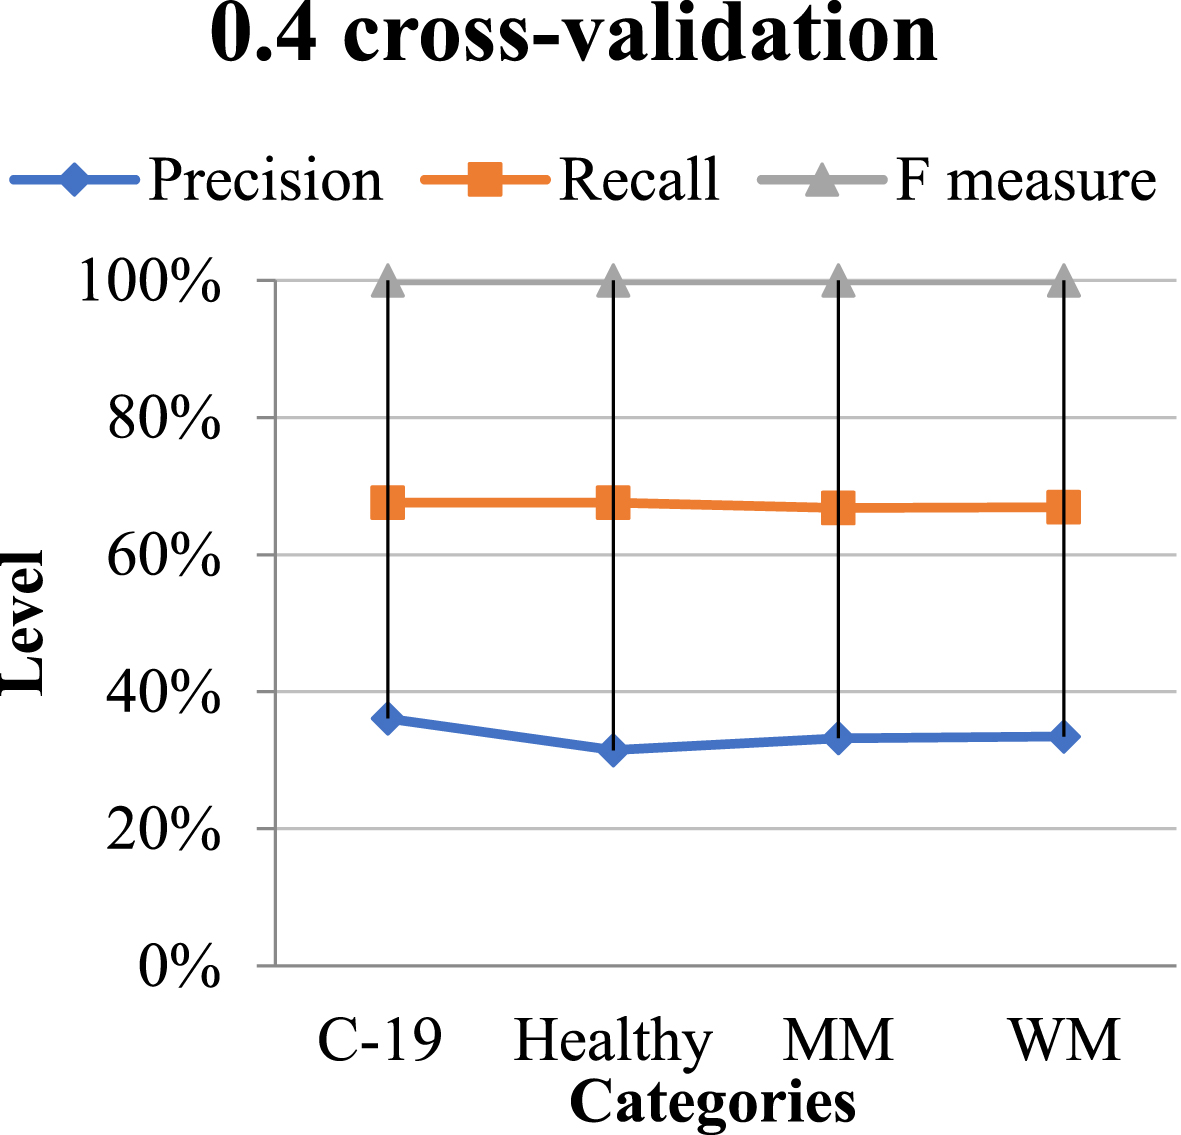
Table 4
Classification performance using 0.4 CV
| Categories | Precision | Recall | F measure |
| C-19 Diagnosed | 1.09 | 0.95 | 0.98 |
| Non-Diagnosed | 0.95 | 1.09 | 0.98 |
| Macro-median | 0.98 | 0.99 | 0.98 |
| Weighted median | 0.98 | 0.98 | 0.97 |
The classification result obtained using 0.5 cross-validation is presented in Table 5, along with their schematic diagram is on Fig. 9.
Table 5
Classification performance using 0.5 CV
| Categories | Precision | Recall | F-measure |
| C-19 Diagnosed | 1.11 | 1.09 | 1.10 |
| Non-Diagnosed | 1.00 | 1.01 | 1.10 |
| Macro-median | 1.01 | 1.09 | 1.10 |
| Weighted median | 1.11 | 1.00 | 1.01 |
Fig. 9
Graphical representation of the classification of QNN in 0.5 CV.
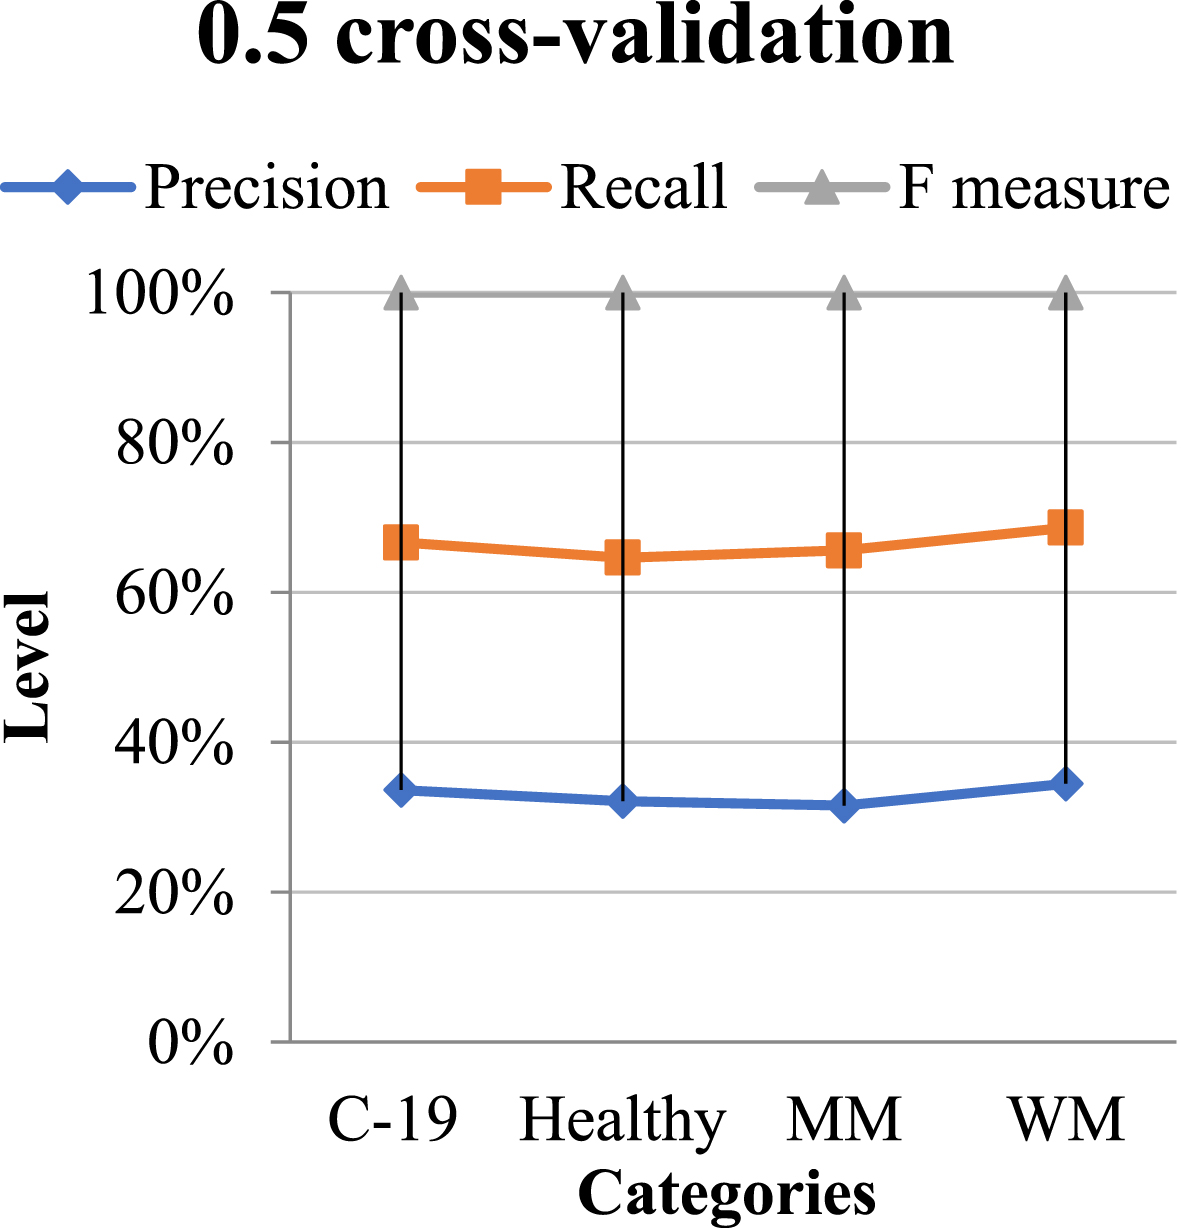
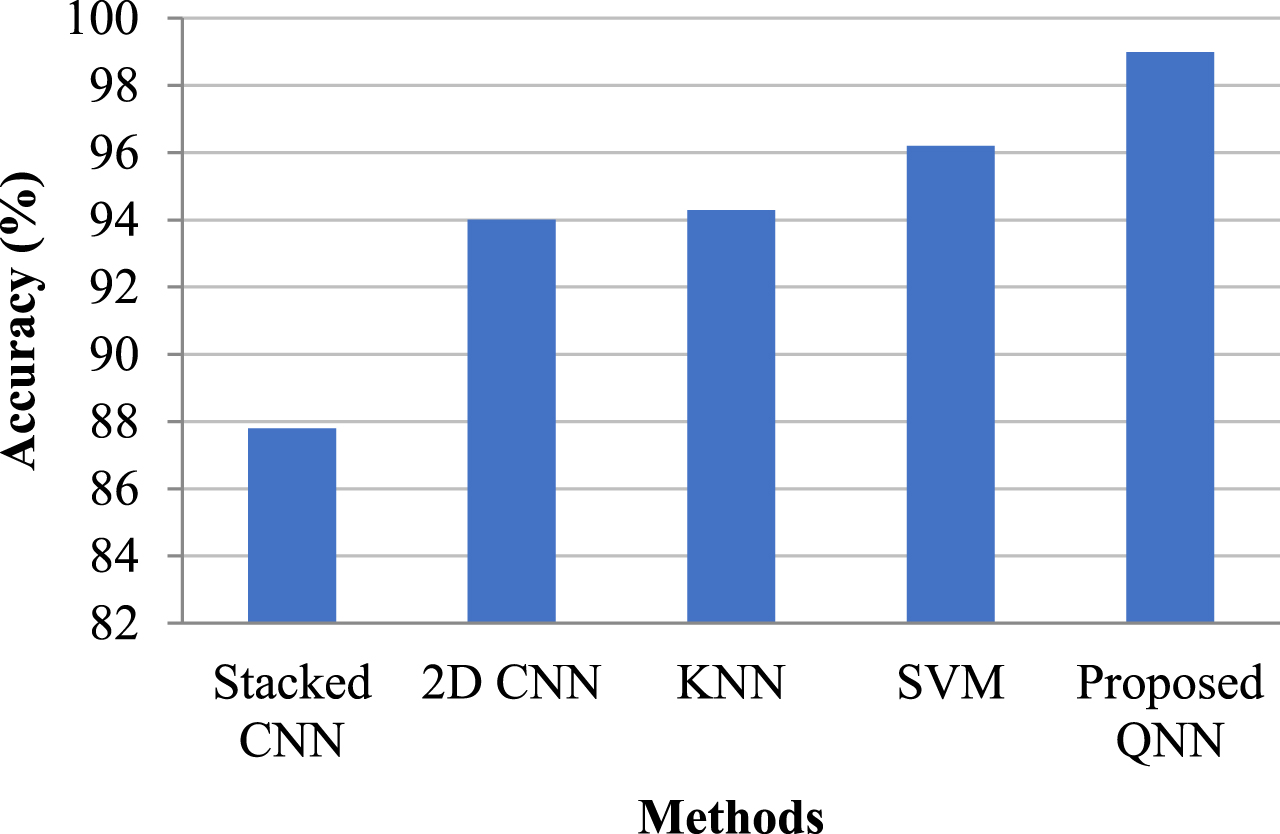
Table 6 compares the proposed QNN model to various current approaches, and Fig. 10 depicts its graphical representation. When comparing the existing model to the QNN, the latter received a 2.79 percent lift from the SVM model, which was trained on the image collection of Coronavirus positive individuals for classification issues. The study presents the whole system’s effectiveness in scaling classification models, with the proposed Quanvolutional Neural Network achieving a greater accuracy of 98.99 percent.
Table 6
Comparison tables of proposed and existing method
| Methods | Accuracy |
| Stacked CNN | 87.8 |
| 2D CNN | 94.01 |
| KNN | 94.29 |
| SVM | 96.20 |
| Proposed QNN | 98.99 |
Fig. 10
Graphical representation of comparing existing and proposed methods.
6Conclusion
Coronavirus is a recently discovered infection that affects both the upper and lower respiratory systems. The size, pace of infection, and amount of fatalities associated with the global COVID-19 epidemic have all been progressively increasing. Utilizing computed tomography scanning, COVID-19 cases could be found and studied. Chest CT imaging combines the benefit of early screening, low cost, and excellent accuracy when it comes to detecting lung infection. COVID-19 recognition is a tough task due to the clear lack of details and the complex picture elements. The improved Q-Deformed Entropy (QDE) algorithm for CT image scanning is proposed as a solution to this challenge. The suggested method uses QDE to create CT images to increase the amount of training data for efficient testing and training. The features that were retrieved are used to categorize the findings. Researchers have been using Quantum Machine Learning (QML) to assess techniques for improvement due to rapid advances in quantum mechanics. Furthermore, a Quanvolutional Neural Network is used to categorize corona diagnosed and non-diagnosed images (QNN). The study compares QNN to other known methods for processing COVID-19 imagery. When compared to other models, the suggested technique yielded better results. Using computed tomography scanning pictures in clinical conditions, a quantum machine learning model is presented to categorize individuals with COVID-19 infections in this work. The significance of this research is it not only validates QML’s capabilities but also provides an opportunity for medical researchers to use quantum hardware to develop diagnostic equipment for pharmaceutical research and disease detection difficulties.
Acknowledgement
This work is supported by Princess Nourah bint Abdulrahman University Researchers Supporting Project number (PNURSP2024R442), Princess Nourah bint Abdulrahman University, Riyadh, Saudi Arabia.
References
[1] | Wu P. et al. Real-time tentative assessment of the epidemiological characteristics of novel coronavirus infections in Wuhan, China, as at 22 January 2020, Eurosurveillance 25: (3) ((2000) ), 2000044,. doi: https://doi.org/10.2807/1560-7917.ES.2020.25.3.2000044 |
[2] | Oran D.P. , Topol E.J. Prevalence of Asymptomatic SARS-CoV-2Infection: A Narrative Review, Ann. Intern. Med. 173: (5) ((2020) ), 362–367. doi: https://doi.org/10.7326/M20-3012 |
[3] | Zhou P. et al. A pneumonia outbreak associated with a new coronavirus of probable bat origin, Nature 579: (7798) ((2020) ), Art. no. 7798. doi: https://doi.org/10.1038/s41586-020-2012-7 |
[4] | Amine Saddik* , Rachid Latif , Abdoullah Bella ECG signalmonitoring based on Covid-19 patients: Overview, Journal ofIntelligent Systems and Internet of Things 2: (2) ((2021) ), 45–54. |
[5] | Abedallah Zaid Abualkishik , The Application of Fuzzy CollaborativeIntelligence to Detect COVID-19 Minor Symptoms, Journal ofIntelligent Systems and Internet of Things 5: (2) ((2021) ), 97–109. |
[6] | Gorgieva S. , Hribernik S. Microstructured and Degradable Bacterial Cellulose–Gelatin Composite Membranes: Mineralization Aspects and Biomedical Relevance, Nanomaterials 9: (2) ((2019) ), Art. no. 2, doi: https://doi.org/10.3390/nano9020303 |
[7] | Noushini Nikeetha P. , Pavithra D. , Sivakarthiga K. , Karthika S. , Yashitha R. , Kirubasri G.V. A Survey on IoT based Wearable Sensor for Covid-19 Pandemic, International Journal of Wireless and Ad Hoc Communication 2: (2) ((2021) ), 77–87. |
[8] | Arevalo-Rodriguez I. et al. False-negative results of initial RT-PCR assays for COVID-19: A systematic review, PLOS ONE 15: (12) ((2020) ), e0242958. doi: https://doi.org/10.1371/journal.pone.0242958 |
[9] | Beyer T. et al. What scans we will read: imaging instrumentation trends in clinical oncology, Cancer Imaging 20: (1) ((2020) ), 38, doi: https://doi.org/10.1186/s40644-020-00312-3 |
[10] | Wang S. , Summers R.M. Machine learning and radiology, Med. Image Anal. 16: (5) ((2012) ), 933–951, doi: https://doi.org/10.1016/j.media.2012.02.005 |
[11] | Jaffray D. , Kupelian P. , Djemil T. , Macklis R.M. Review of image-guided radiation therapy, Expert Rev. Anticancer Ther. 7: (1) ((2007) ), 89–103. doi: https://doi.org/10.1586/14737140.7.1.89 |
[12] | Leach R.M. , Treacher D.F. The pulmonary physician in critical care ● 2: Oxygen delivery and consumption in the critically ill, Thorax 57: (2) ((2002) ), 170–177. doi: https://doi.org/10.1136/thorax.57.2.170 |
[13] | Navod Neranjan Thilakarathne , Rohan Samarasinghe , Mohan Krishna Kagita , Surekha Lanka , Hussain Ahmad Smart Grid: A Survey of Architectural Elements, Machine Learning and Deep Learning Applications and Future Directions, Journal of Intelligent Systems and Internet of Things 3: (1) ((2021) ), 32–42. |
[14] | Anwar S.M. , Majid M. , Qayyum A. , Awais M. , Alnowami M. , Khan M.K. Medical Image Analysis using Convolutional Neural Networks: A Review, J. Med. Syst. 42: (11) ((2018) ), 226, doi: https://doi.org/10.1007/s10916-018-1088-1 |
[15] | Chouhan S.S. , Kaul A. , Singh U.P. Image Segmentation Using Computational Intelligence Techniques: Review, Arch. Comput. Methods Eng. 26: (3) ((2019) ), 533–596. doi: https://doi.org/10.1007/s11831-018-9257-4 |
[16] | Lepri G. et al. The emerging role of lung ultrasound in COVID-19 pneumonia, Eur. J. Rheumatol. 7: (Suppl 2) ((2020) ), S129–S133. doi: https://doi.org/10.5152/eurjrheum.2020.2063 |
[17] | Schuld M. , Sinayskiy I. , Petruccione F. An introduction to quantum machine learning, Contemp. Phys. 56: (2) ((2015) ), 172–185. doi: https://doi.org/10.1080/00107514.2014.964942 |
[18] | Outeiral C. , Strahm M. , Shi J. , Morris G.M. , Benjamin S.C. , Deane C.M. The prospects of quantum computing in computational molecular biology, WIREs Comput. Mol. Sci. 11: (1) ((2021) ), doi: https://doi.org/10.1002/wcms.1481 |
[19] | Henderson M. , Gallina J. , Brett M. Methods for accelerating geospatial data processing using quantum computers, Quantum Mach. Intell. 3: (1) ((2021) ), 4. doi: https://doi.org/10.1007/s42484-020-00034-6 |
[20] | Schuld M. , Sinayskiy I. , Petruccione F. The quest for a Quantum Neural Network, Quantum Inf. Process 13: (11) ((2014) ), 2567–2586. doi: https://doi.org/10.1007/s11128-014-0809-8 |
[21] | Kassania S.H. , Kassanib P.H. , Wesolowskic M.J. , Schneidera K.A. , Detersa R. Automatic Detection of Coronavirus Disease (COVID-19) in X-ray and CT Images: A Machine Learning Based Approach, Biocybern. Biomed. Eng. 41: (3) ((2021) ), 867–879. doi: https://doi.org/10.1016/j.bbe.2021.05.013 |
[22] | Cabitza F. et al. Development, evaluation, and validation of machine learning models for COVID-19 detection based on routine blood tests, Clin. Chem. Lab. Med. CCLM 59: (2) ((2021) ), 421–431. doi: https://doi.org/10.1515/cclm-2020-1294 |
[23] | Brinati D. , Campagner A. , Ferrari D. , Locatelli M. , Banfi G. , Cabitza F. Detection of COVID-19 Infection from Routine Blood Exams with Machine Learning: A Feasibility Study, J. Med. Syst. 44: (8) ((2020) ), 135, doi: https://doi.org/10.1007/s10916-020-01597-4 |
[24] | Abdul Salam M. , Taha S. , Ramadan M. COVID-19 detection using federated machine learning, PLOS ONE 16: (6) ((2021) ), e0252573, doi: https://doi.org/10.1371/journal.pone.0252573 |
[25] | Abasiyanik M.F. et al. Sensitive detection and quantification of SARS-CoV-2 in saliva, Sci. Rep. 11: (1) ((2021) ), 12425, doi: https://doi.org/10.1038/s41598-021-91835-7 |


