
Learning resource recommendation via knowledge graphs and learning style clustering
Abstract
An e-learning system should recommend learners appropriate learning resources according to their actual needs and cognitive status for improving their learning performance. To overcome the deficiencies of existing approaches (e.g., poor interpretability, limited efficiency and accuracy of recommendation), we propose a new recommendation approach to learning resources via knowledge graphs and learning style clustering. In this approach, the knowledge graphs of an online learning environment are constructed based on a generic ontology model, and the graph embedding algorithm and graph matching process are applied to optimize the efficiency of graph computation for identifying similar learning resources. By introducing learning style theory, learners are clustered based on their learning styles. Based on the clustering results, the learners’ degrees of interest in similar learning resources are measured, and the recommendation results are obtained according to the degrees of interest. Finally, the experiments demonstrate that the proposed approach significantly enhances the computational efficiency and the quality of learning resource recommendation compared with the existing approaches in large-scale graph data scenarios.
1Introduction
1.1Motivations
Recently, with the rapid development of e-learning, the proliferation of online learning resources has led to information overload and information disorientation problems, making it hard for learners to obtain suitable learning resources more effectively and accurately. Therefore, it has become a research hotspot to help learners obtain appropriate learning resources to improve their learning effects [1, 2].
Existing research on learning resource recommendation is often carried out by exploiting learners’ learning interests [1, 2]. However, the process of learning is progressive, and the knowledge concepts are orderly. Thus, when recommending learning resources to learners, it is essential to consider both their learning interests and the inner semantic relationship between knowledge concepts. Besides, during recommendation, it is also necessary to consider the relationships between learners and between knowledge concepts, respectively. The knowledge graphs [3] could directly express the relationships between various entities, model the semantic relationships among the concepts and correlated knowledge, and support visualized interactions. Now knowledge graphs have been widely used in question-answering systems[4, 5] and recommender systems[6, 7]. However, learning resource recommendation is still under exploration, especially in large-scale data scenarios. There is an obvious computation efficiency problem in knowledge graph applications. Aiming at this problem, the graph embedding algorithm [8] maps the network structure of knowledge graphs to a low-dimensional space, and transforms the graphic computation into a numerical computation. Thus, it could significantly improve the computation efficiency of graphs [9].
Learners usually have different learning habits, preferences and learning methods. An excellent e-learning platform should provide an intelligent learning environment according to learners’ learning styles. By introducing the learning style theory, the learners’ learning styles could be recognized effectively for creating learners clusters [10]. Based on the clustering results, the appropriate learning paths might be recommended to different learners in terms of their learning styles, and the differences and similarities between learners in different clusters could be analyzed to simplify the recommendation process of learning resources. Obviously, the learning style theory is helpful in improving both the personalization and efficiency of learning resource recommendations.
To solve the problems of information overload and information disorientation, we propose a personalized learning resource recommendation approach via knowledge graphs and learning style clustering (denoted as PLRec-KL). In this approach, a generic ontology model is designed to construct a knowledge graph of the online learning environment. Then, an embedded model of the graph is trained via the graph embedding algorithm to improve the computation efficiency. Based on the model, similar learners are quickly identified via graph matching and the learning resources are also gained after filtering unrelated entities and relationships in the subgraphs. By introducing learning style theory, learners are divided into clusters based on their learning styles for calculating the learners’ degrees of interest in the matched learning resources. Then, the learning resources recommendation results can be sorted in descending order.
1.2Contributions
The major contributions of this paper are as follows:
(1) Aiming at the low computational efficiency problem of learning resource recommendation in large-scale data scenarios, a graph embedding algorithm is utilized to transform graphic computation into numerical calculation. Based on the embedded model, similar learners are quickly identified via the graph matching process for identifying similar learning resources. The experiments on real-world datasets illustrate that our approach significantly improves the computation efficiency of learning resource recommendation.
(2) To realize personalized recommendation based on learners’ learning habits, the learning style theory is used to model the learners in this paper. Learners are clustered based on their learning styles. Based on the clustering results, the learners’ degrees of interest in similar learning resources are measured, and the sorted recommendation results are obtained according to the degrees of interest. The experiments illustrate that the proposed approach significantly improves the performance of learning resource recommendation.
2Related work
2.1Traditional learning resource recommendation
The traditional recommendation algorithms could be divided into three categories [11]: 1) Content-based recommendation. It calculates the similarity between items by extracting the item features, and recommends items to users according to their preferences. 2) Collaborative filtering (CF)-based recommendation. It recommends items to the user by exploiting other users with similar tastes and finding out their interested items. The traditional CF could be divided into user-based CF and item-based CF. On the basis of users’ historical rating records, the user-based CF recommends items to users by calculating the similarity between them and other users, and the item-based CF recommends new items similar to their historical preferences according to the similarity between items. 3) Hybrid recommendation. It recommends items by leveraging the strengths of several different recommended methods.
Learning resources mainly consist of MOOC, instructional videos, slides, exercises, experimental projects and auxiliary information. Kong et al. [1] propose a user context-aware approach to MOOC recommendations. It utilizes the Kendall Rank correlation coefficient to improve the similarity calculation of CF recommendation, and mines the learners’ personal characteristics from multiple data types. Considering that existing research fails to deal with the possible complexity of knowledge concepts and the uncertainty of learners’ cognitive status, Ma et al. [12] present an exercise recommendation approach via a new fuzzy cognitive diagnosis method. This approach utilizes Neutrosophic set theory to diagnose learners’ knowledge status comprehensively, and suitable exercises are recommended to learners by combining the user-based CF method and the probability matrix factorization method. By analyzing the answer records of learners’ exercises, Lin [13] proposes an exercise recommendation algorithm based on hidden knowledge points and an exercise recommendation method based on the decomposition of learner-exercise weight matrix. Since the CF methods often suffer from a sparse rating matrix and cold start, Wang et al. [14] come up with a recommendation approach to learning resources based on an improved CF method. In this approach, the learners’ learning behaviors are expressed with the ratings about learning resources for alleviating the sparse problem of rating matrices, and the method of similarity calculation is also improved by adopting learners’ initial labels to ensure the accuracy of recommendation for a new learner. To enhance the user experience of multimedia content retrieval, Pouli et al. [15] rank retrieval results according to users’ searching intension, and design a relevant feedback algorithm to adjust the results based on users’ expectations and preferences. In consideration of the point of interest (POI) group recommendation, Zahra et al. [16] measure users’ influence by mining their history check-in data, and taking the influence value as weights in the aggregation of group members’ preferences to recommend POIs for the whole group.
Traditional recommendation approaches alleviate the problems of cold start and data sparsity to some extent by considering users’ behavior information, personalized demand information, and other multi-source heterogeneous information. However, there are still obvious limitations in scenarios with large-scale data, multiple data types, and complex data structures. Recently, with the extensive application of deep learning, personalized learning resource recommendations based on deep learning [17] break through the shortcomings of traditional models to a certain extent and obtain more accurate and efficient recommendation results. However, the deep learning-based methods also suffer from high training costs and the recommendation results need to be more interpretable.
2.2Learning resource recommendation via knowledge graphs
The traditional recommendation algorithms ignoring the semantic relationships among learning resources cannot ensure that a satisfactory recommendation result is obtained for the learners. To solve this problem, Xu et al. [18] design a personalized course recommendation system. They exploit knowledge graphs to get the semantic information of learning resources embedded into a low dimensional space, and fuse the semantic similarity between resources into the CF recommendation algorithms to improve the recommendation performance. Considering that the existing research on exercise recommendation only analyzes the learners’ cognitive ability and ignores the sequential relationship of knowledge concepts in the learning process, Lv et al. [19] present an exercise recommendation method based on weighted knowledge graphs, in which the knowledge concepts are modeled as nodes and weighted with the corresponding learner’s knowledge status. All the above approaches use a small volume of data to construct knowledge graphs and fail to discuss the calculation efficiency problem with graph data in real datasets [9]. By fusing information in knowledge graphs and deep CF algorithms, Qiu et al. [20] propose an online course recommendation approach based on enhanced knowledge graphs. They adopt a co-occurrence network to capture the learners’ explicit interest traits, and the courses in the co-occurrence network are modeled as entities of the knowledge graphs. However, the accuracy of recommendation results might be affected by the limited accuracy of the weights of relationships obtained by automatic training of the co-occurrence network.
Learning paths are a special type of learning resource, and have attracted the attention of researchers in recent years [2]. Assuming that each learner has different learning paths in various learning scenarios and different learners have similar learning paths in the same learning scenario, Zhu et al. [21] present a multi-constraint learning path recommendation model based on knowledge graphs considering only 4 basic learning contexts. Since the existing research only constructs knowledge graphs from only a single dimension, Shi et al. [22] design a learning path recommendation model based on multi-dimensional knowledge graphs, where the relationships between learning objects are classified into six categories. However, this model strongly relies on the scale and structure of the data in the knowledge graphs, and it is hard to ensure its effectiveness when facing small-scale datasets or the high complexity of the semantic relationships.
In practical applications, the direct graph operations on a graph network result in an obvious problem of poor efficiency because the data scale of knowledge graphs is usually large. Thus, the time efficiency of the above approaches decreases significantly in a large-scale data scenario.
2.3Learning resource recommendation via learning style theory
Psychological research shows that learners have different learning styles. The research on the brain and learning also proves that each individual differs greatly in the styles of inputting, organizing, absorbing and outputting information. Based on that, at least 70 theories or models of learning styles have been proposed by experts from different fields. Kolb’s Learning Style Inventory [23] describes the internal cognitive process of learners as a cycle with four stages of learning. The Myers-Briggs Type Indicator (MBTI) [24] could be used to show people’s psychological preferences in the aspect of awareness. Besides, the Felder-Silverman model is the most widely used theory [25] and is a compromised mix of other classical theories. In addition, it could also be applied to computer programs through its “learning style index”.
The learning style theory could be applied to optimize the recommendation effects of learning resources [25]. By introducing the learning style theory, Chen et al. [10] propose a learning resource recommendation approach (denoted as AROLS) by combining the traditional CF methods to improve the effects of recommendation results. The above approach provides a new solution to learning resource recommendation. However, some limitations still result from the traditional CF methods when it is applied to large-scale and sparse data applications scenarios.
3Knowledge graphs construction for e-learning environment
This paper designs a generic ontology model of e-learning environment for quickly generating knowledge graphs. The process of constructing knowledge graphs could be divided into three steps as follows: ontology modeling, data extraction, and data storage.
3.1Generic ontology model of e-learning environment
To ease the application of knowledge graphs in the mainstream e-learning environment, we summarize the key data types of an e-learning environment and then design a generic ontology model. The referenced online learning platforms or systems are shown in Table 1.
Table 1
Mainstream online learning platforms
| Name | URL |
| Canvas Network | https://www.canvas.net |
| Coursera | https://www.coursera.org |
| EdX | https://www.edx.org |
| FutureLearn | https://www.futurelearn.com |
| Iversity | https://iversity.org |
| Khan Academy | https://www.khanacademy.org |
| Knewton | https://www.knewton.com |
| NextThought | https://nextthought.com |
| Open2Study | https://www.open2study.com |
| OpenLearn | http://www.open.edu/openlearn |
| Smart Sparrow | https://www.smartsparrow.com |
The main types of interactive resources in mainstream online learning platforms or systems include: 1) Video courses. The videos for different types of courses are given by guest speakers or lecturers, and the length of each video is usually from 5 to 10 minutes. 2) Assessments. The learners’ assignments are evaluated in three common ways. The first way is to score automatically by the choice questions or programming questions, the second way is peer review, where the learners’ grades are judged by other learners in the same class based on a defined rule set, and the third is to let the professional instructors score manually. 3) Online forums. It provides various forms of discussions, including general discussion, discussion about a specific topic, course feedback, and technology feedback. 4) Reading materials. They are available online or provided by the course instructors, usually directly from the platforms. 5) Live video meetings. Since instructors cannot explain all the knowledge concepts in detail in a short course video, live video meetings on a specific topic are often organized. 6) Teaching activities. They improve learners’ cognitive status about concepts taught in the courses. The teaching activities can not only make learners know about each other, but also help learners understand various knowledge concepts further through cooperation. 7) Other video resources. Plenty of platforms provide various auxiliary or interactive script videos, and could help learners understand both knowledge concepts and their backgrounds.
To transform the data from an e-learning environment into knowledge graphs, we must identify the entities at first. The unconstructed information from an e-learning environment needed to be processed as structured information. Then, the entities will be recognized artificially. Considering the main resource types in a mainstream e-learning environment, we express the core concepts of interactive resources with four entity types, including courses, transcripts, assessments, and resource sites.
By analyzing the auxiliary concepts (e.g., registration information and personal background information) from the e-learning environment, 17 entity types are identified to build the ontology of the knowledge graphs. Then, according to the 17 entity types, 18 relationship types are identified by analyzing the relationships between them in an e-learning environment. The direction of edges is identified to indicate the affiliation relationship between entities. For example, a registration record consists of an enrolled student, an enrolled date, and an enrolled course. Based on the logical and realistic relationship of entity types, the ontology of the knowledge graphs is finally generated by combining them with manual tagging.
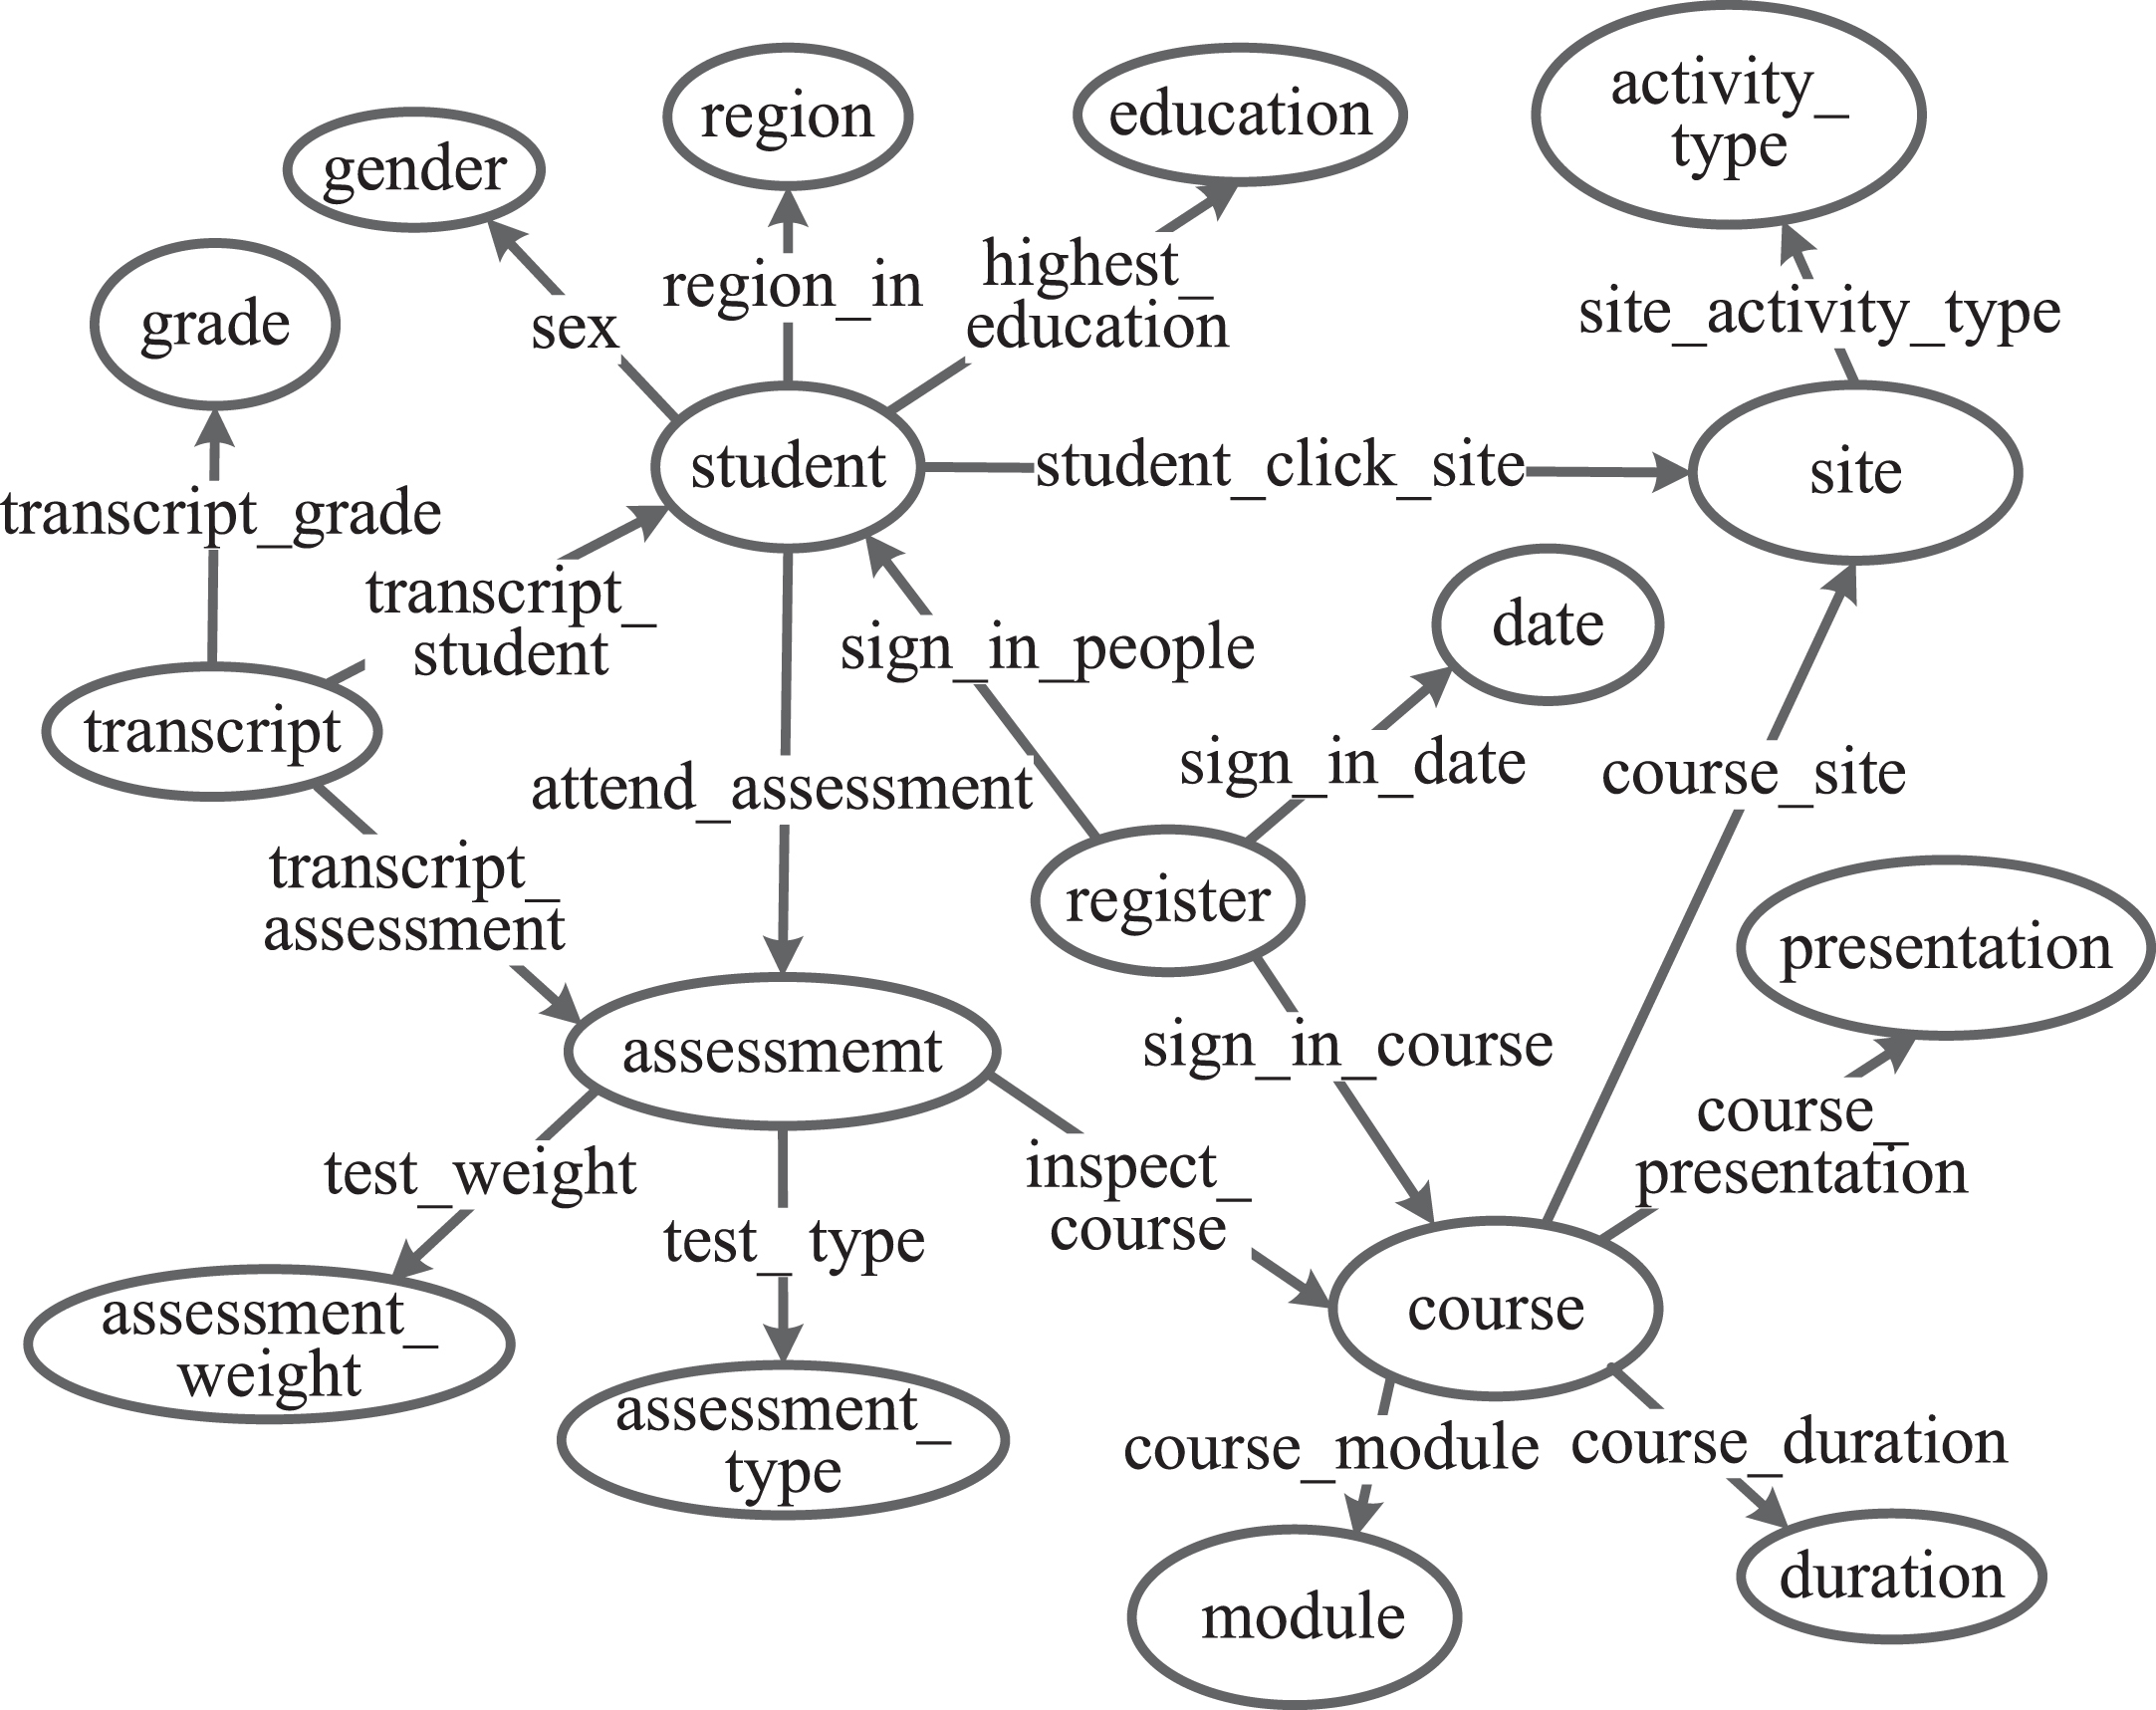
Then, the e-learning ontology model, shown in Fig. 1, consists of 17 entity concepts and 18 types of entity relationships, and contains 5 types of e-learning information, including learners’ personal background, assessments, registration, resource interactions, and course learning.
Fig. 1
Ontology model of online learning environment.
3.2Data extraction
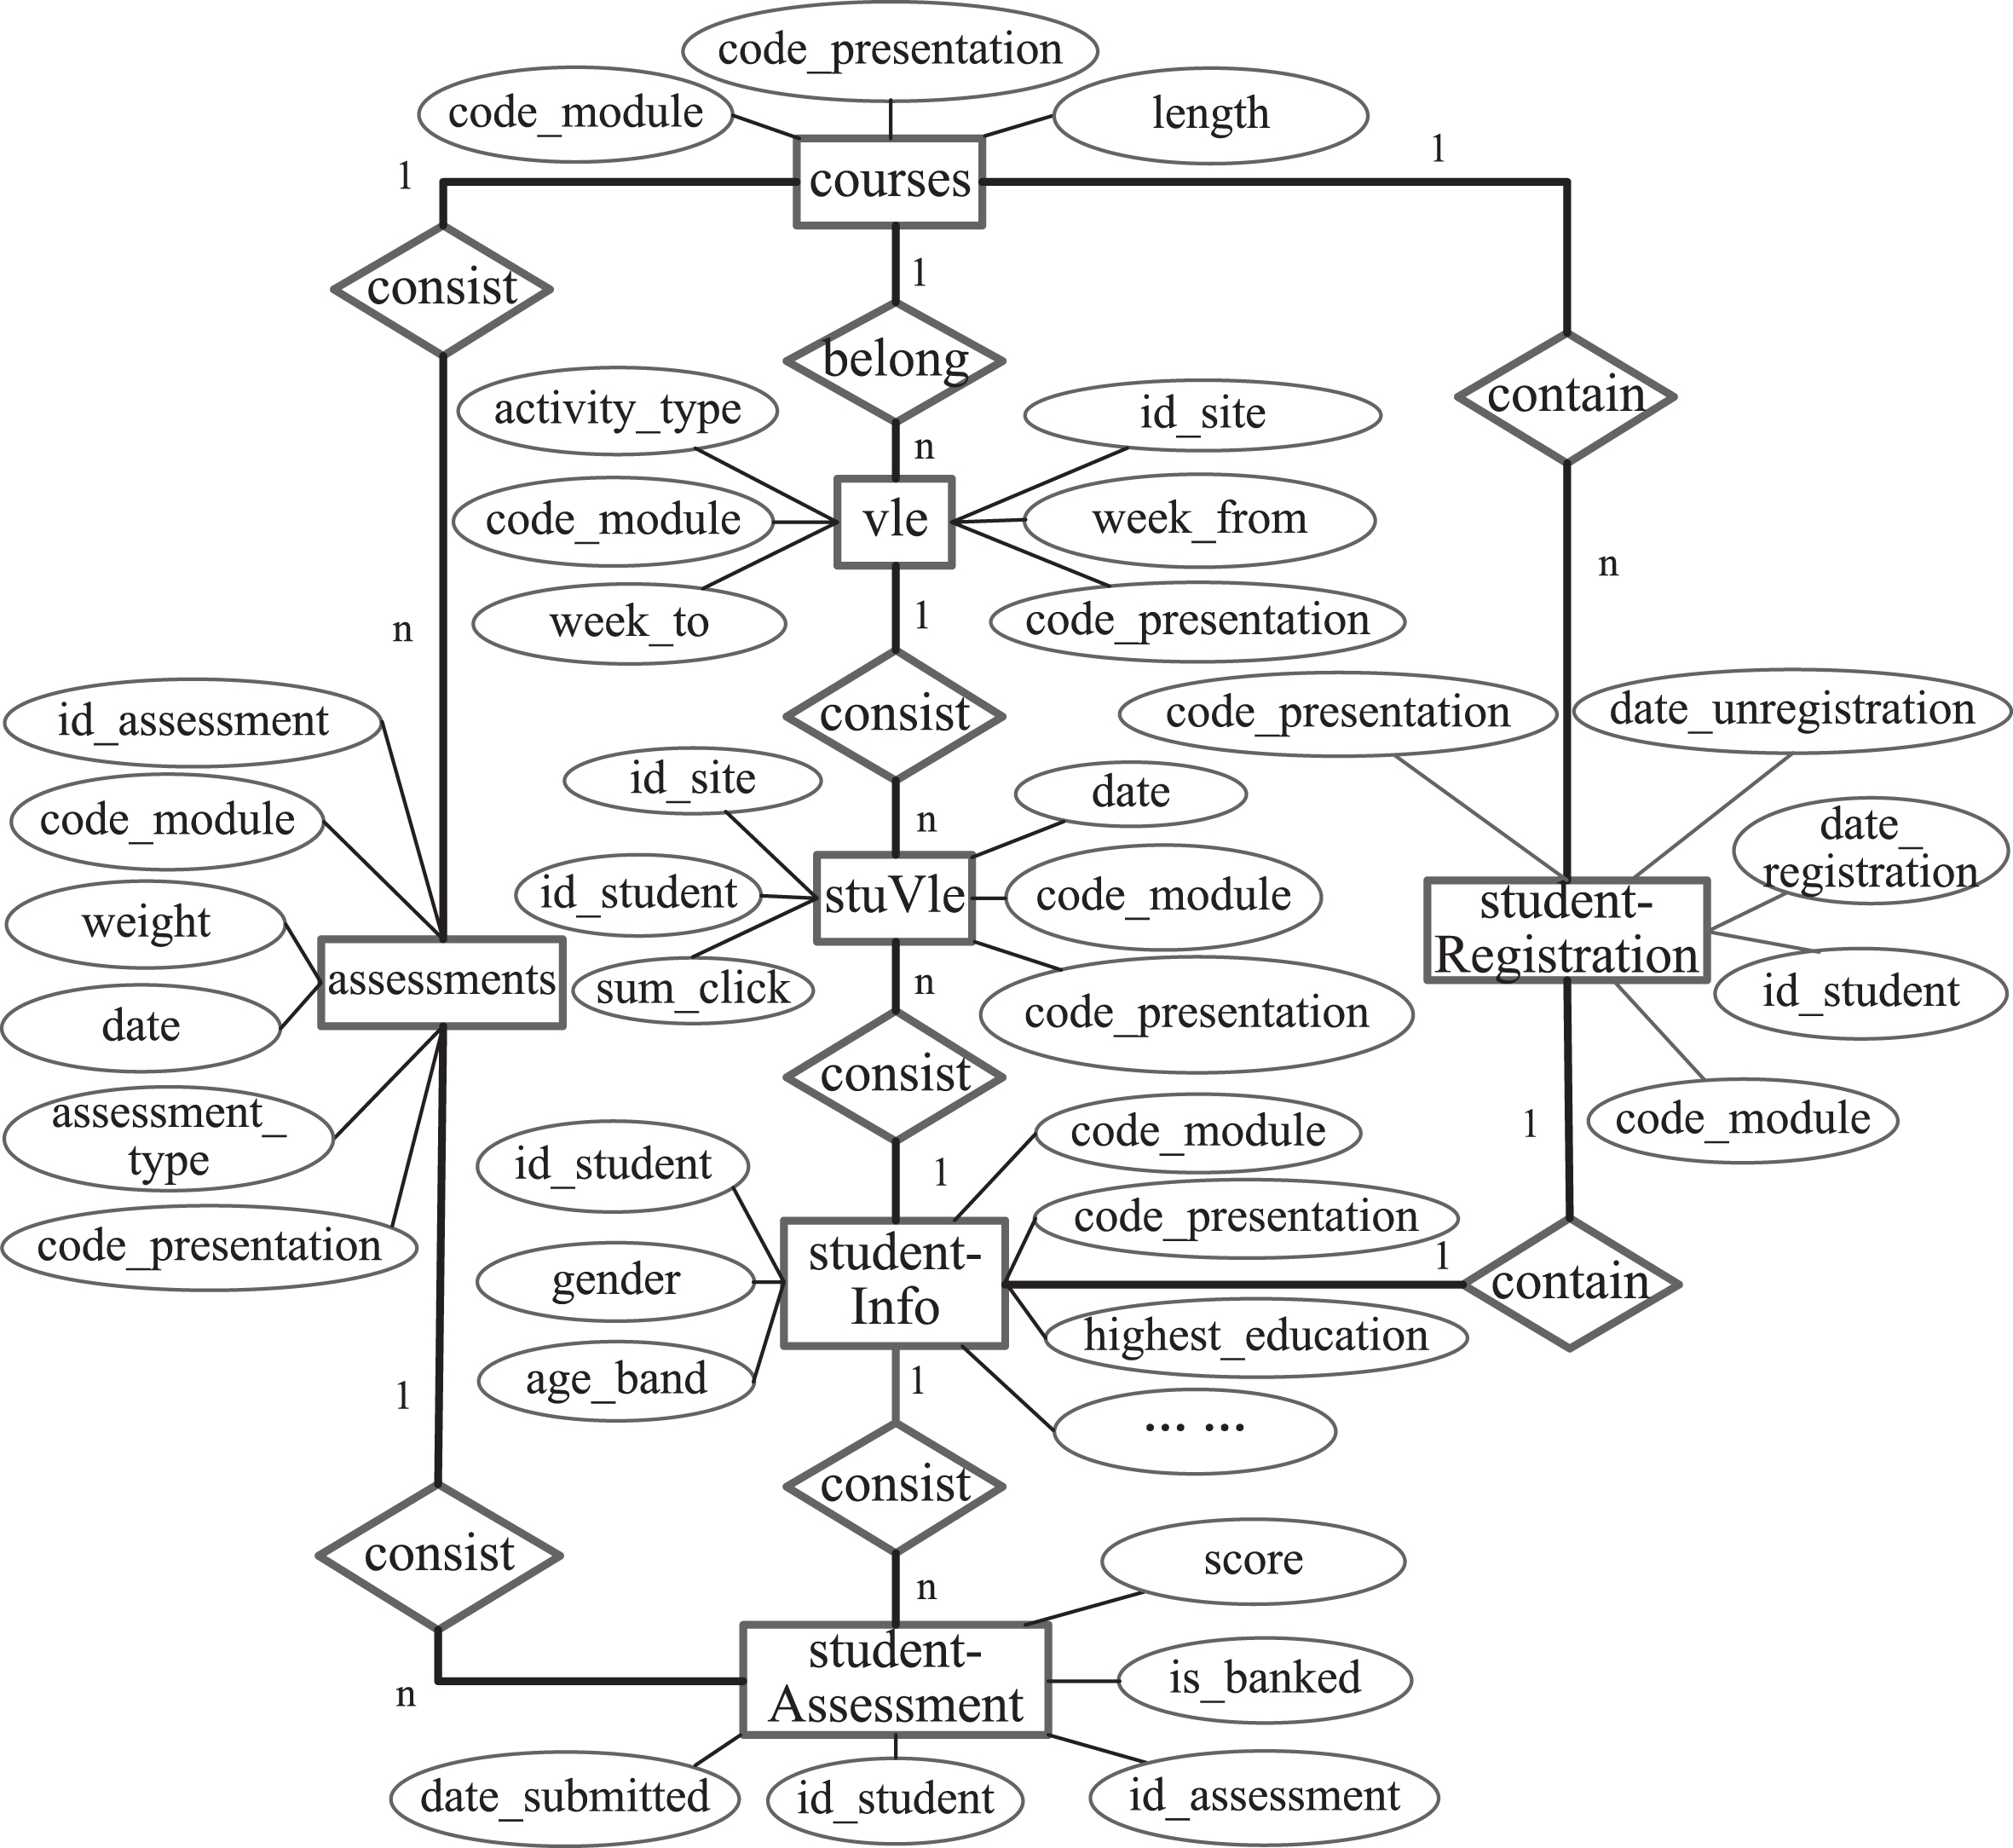
Some open datasets are widely used in personalized learning research, e.g., the open university learning analytics dataset (OULAD) [26], KDD Cup 2010 dataset, and KDD Cup 2015 dataset. OULAD contains the learners’ learning data in 2013 and 2014 from the open university involving 22 courses, 32,593 learners, and 10,655,280 interactions between learners and VLE (virtual learning environment). This paper uses the OULAD dataset. This dataset consists of 7 tables, i.e., studentInfo, studentAssessment, stuVle, studentRegistration, courses, assessments and vle, and its entity relationship diagram is presented as Fig. 2.
Fig. 2
E-R diagram of OULAD.
3.3Data storage
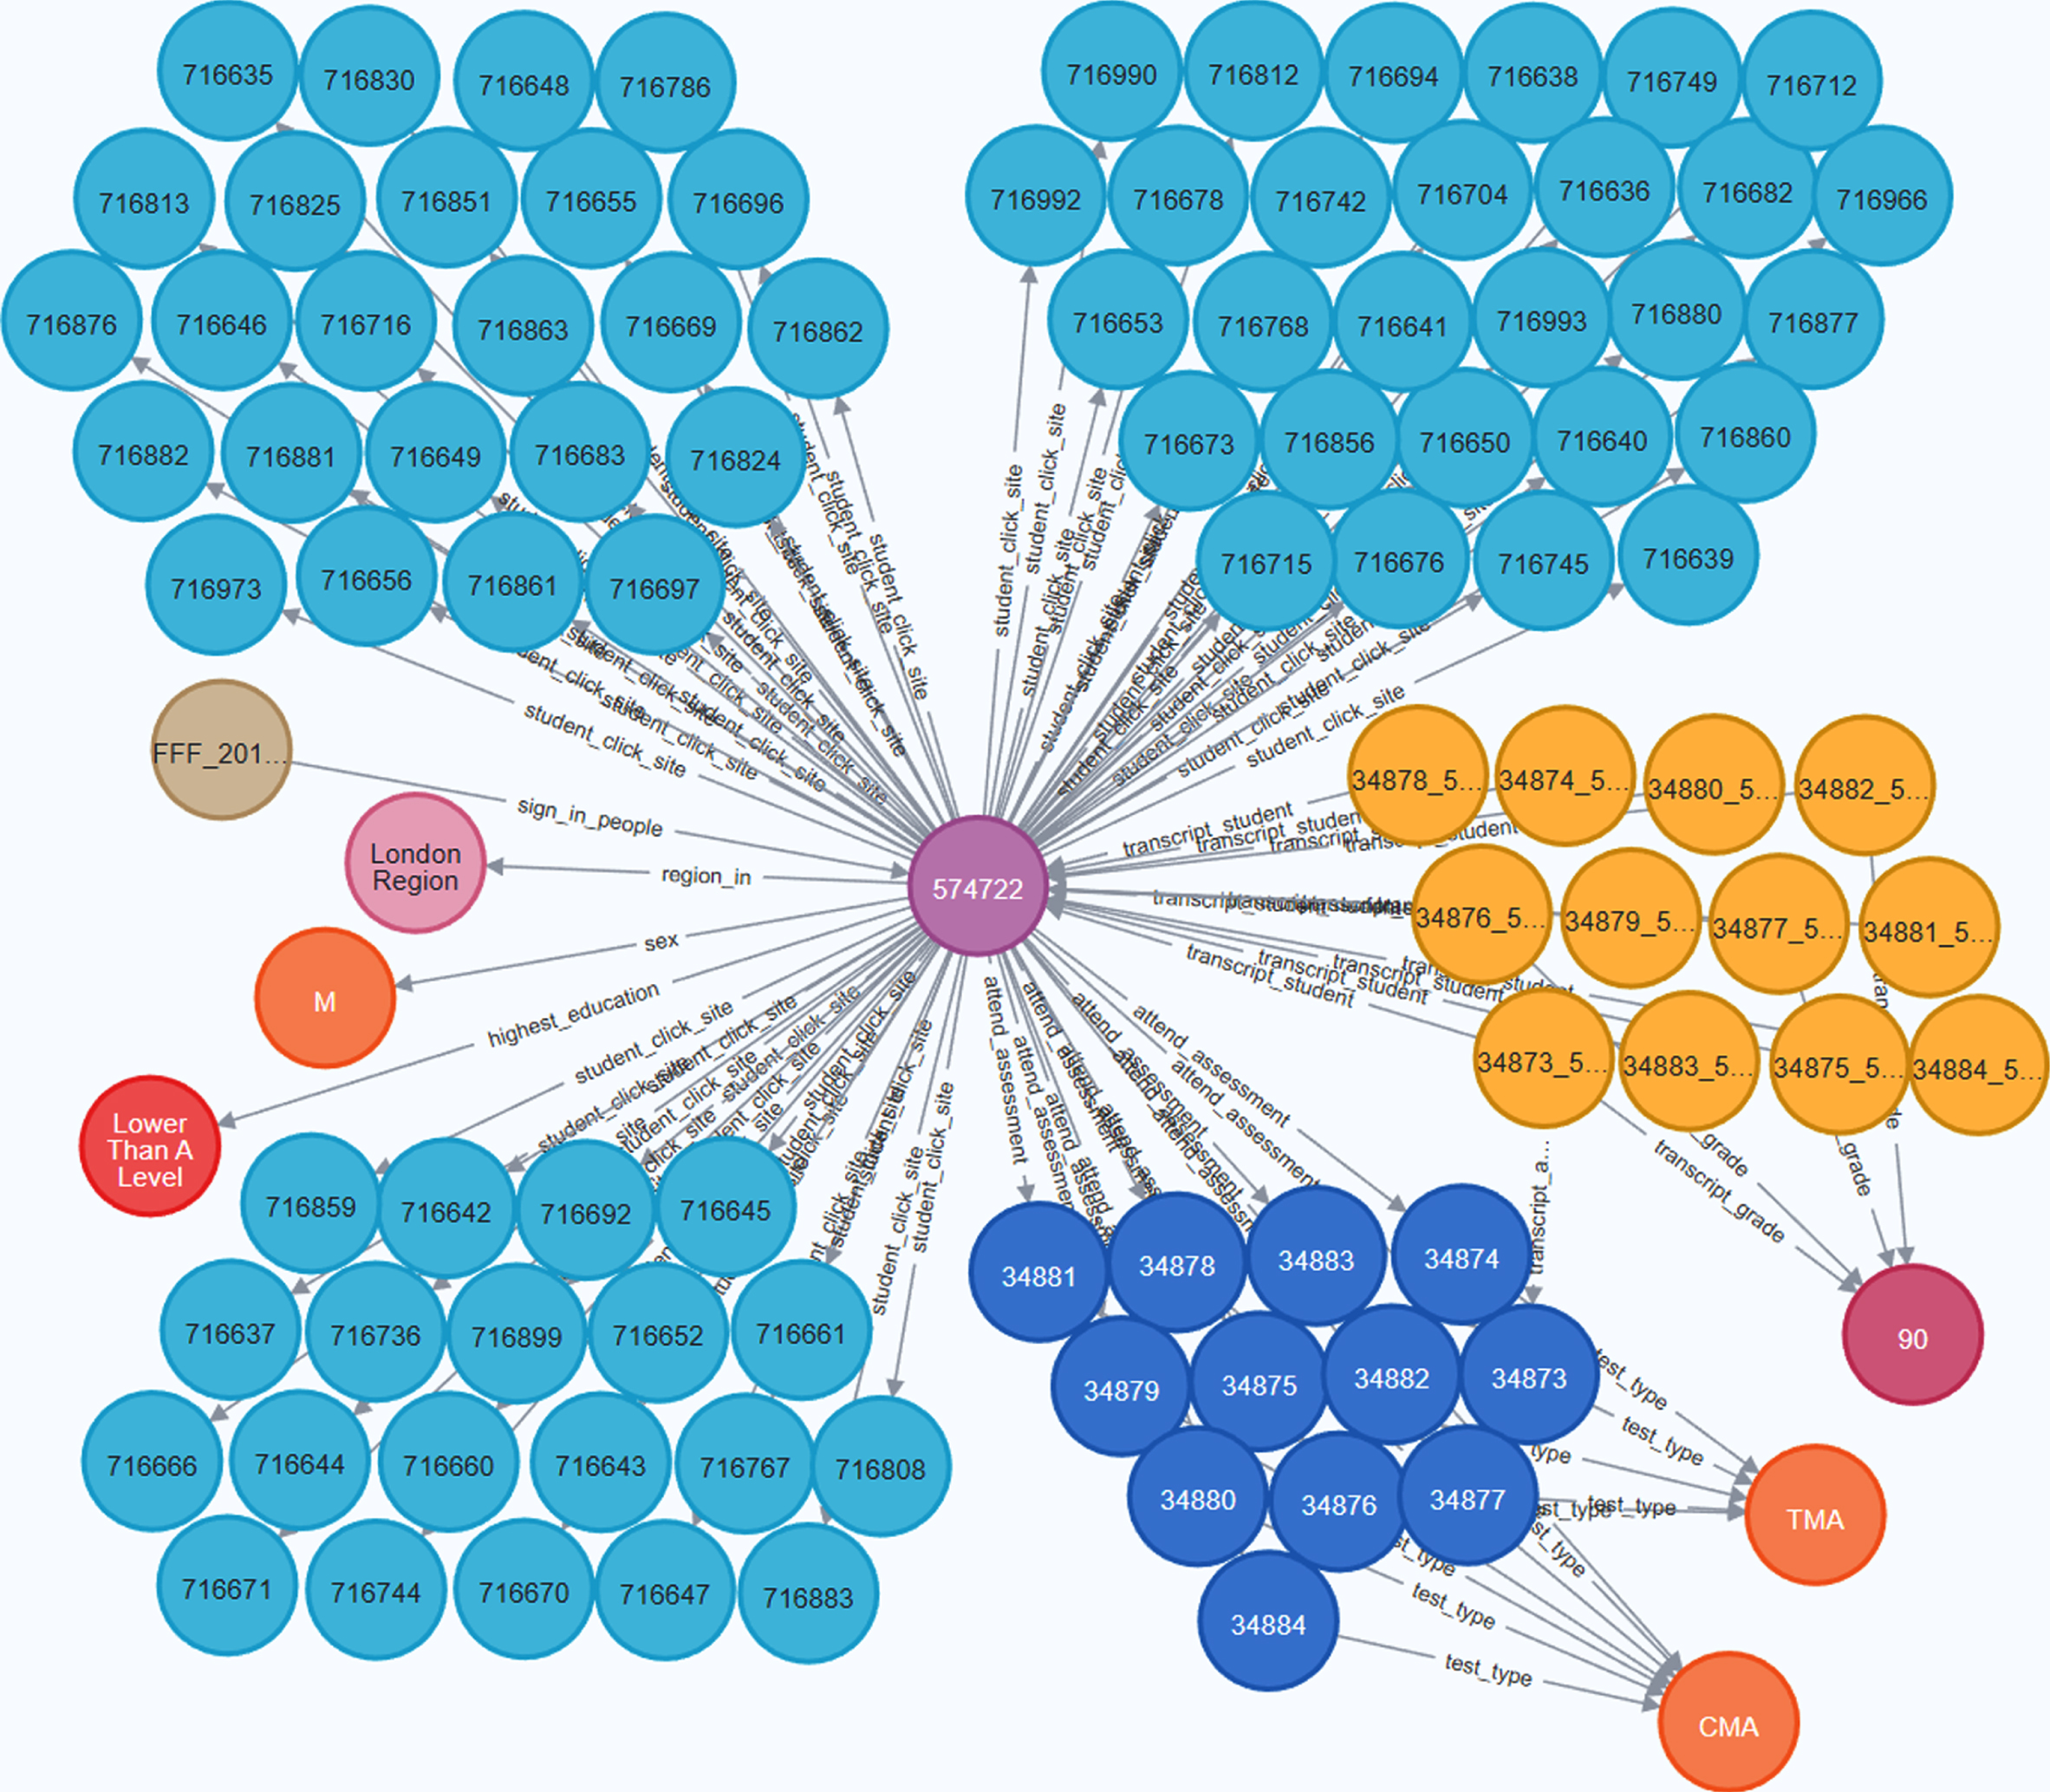
Traditional relational database management systems (DBMSs), such as MySQL and Oracle, execute the JOIN operations or correlation queries to quickly retrieve both tables and relationships between tables. These operations or queries often require significant overhead. Compared with relational DBMSs, the graph DBMS manages nodes, edges, and related description information but not schemes and tables of the relational database, and various types of data are stored in a big graph network. In addition, each relationship in a graph database is stored locally with other types of data in a more flexible format. The graph DBMS with high performance is efficient in traversing data, and can traverse even millions of nodes and edges in one second. In this paper, the Neo4j DBMS is used to store graph data, and the visualization result of the knowledge graphs via Neo4j is shown in Fig. 3.
Fig. 3
Visualization effect of knowledge graphs.
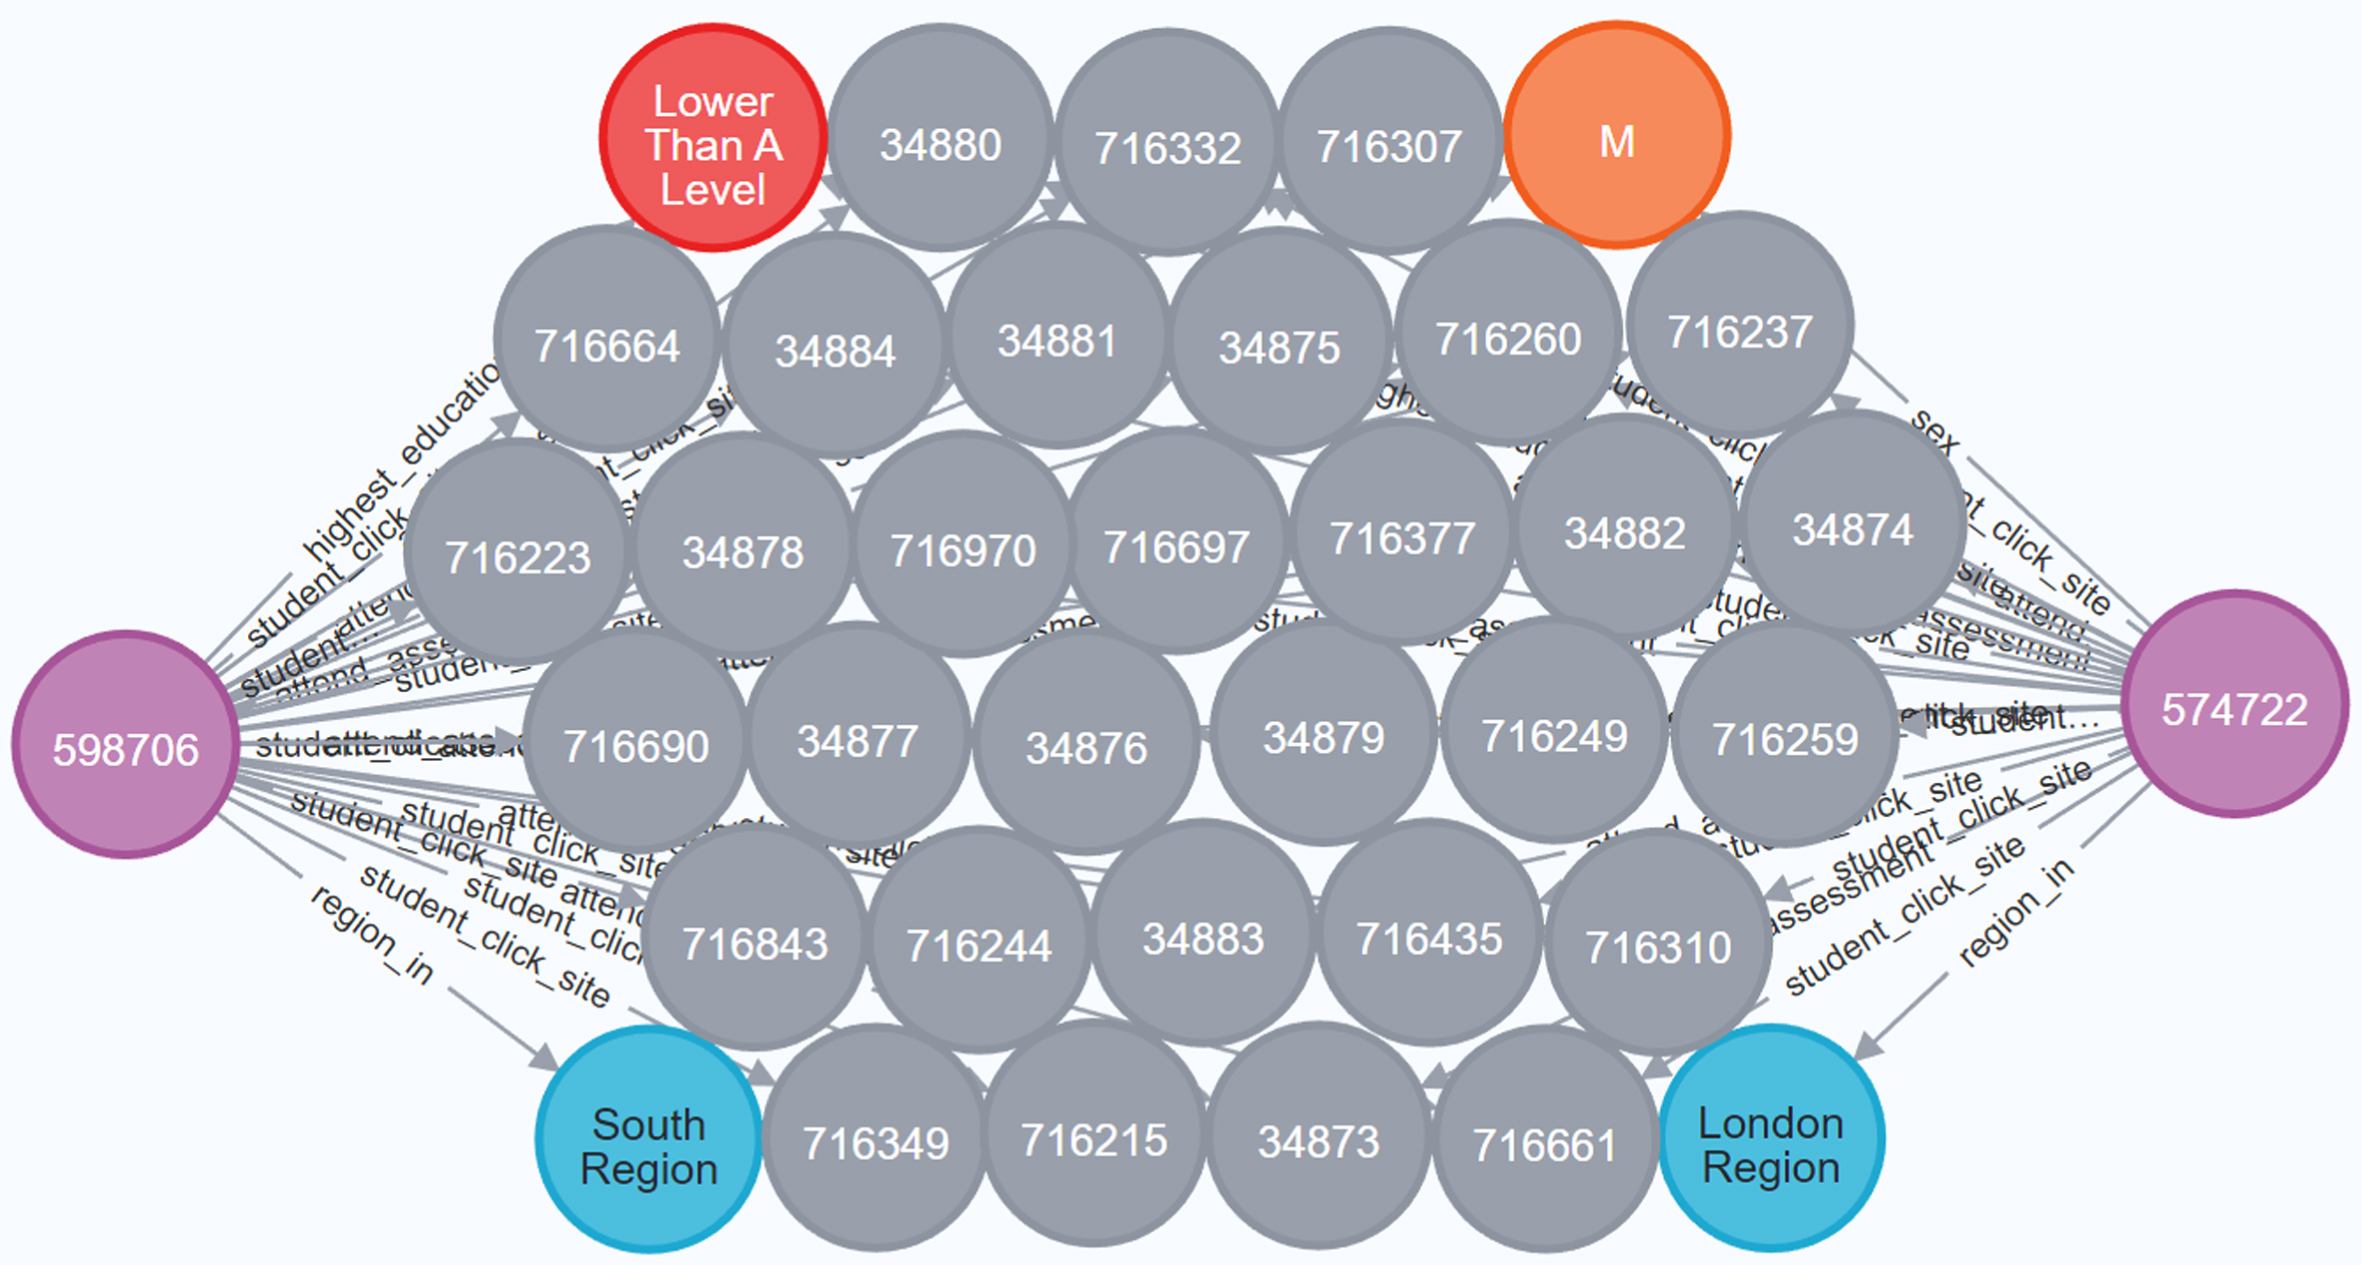
Taking two learners numbered 574722 and 598706 as an example, the partially visualized knowledge graphs of related information are shown in Fig. 4. Figure 4 displays the partial relationships between two learners and four types of nodes, where the orange node denotes that the two learners are male, the red node denotes their highest education, grey nodes are VLE resources that they have clicked, and blue nodes represent where their regions are. Although there is no direct connection between the two learners, the indirect relationships between them are observed via other types of nodes. For example, they clicked on the same VLE resources at the same time or shared the same background attributes. Compared with the CF methods, the network structure of the knowledge graphs makes the association and path analysis easier. Therefore, it is easier to discover the indirect links and underlying links between entities, and the interpretability of results is also enhanced to a certain extent via such visualized presentation.
Fig. 4
An example of a partial knowledge graph.
4Computational efficiency optimization via graph embedding algorithm
Since the scale of graph data is often large in practice, the direct computation of knowledge graphs leads to poor efficiency. The graph embedding algorithm employs vector operation to train an embedded graph model for high-efficiency computation. Obviously, the computation efficiency of the graph embedding algorithm is significantly higher than that of direct computation of a graph. Therefore, this paper applies the graph embedding algorithm to improve the computation efficiency of knowledge graphs.
The knowledge graphs generated based on an ontology of an e-learning environment not only reflect the social relation between learners, but also show the relevance of learning resources. Therefore, this paper focuses on the overall network structure of the knowledge graphs when applying the graph embedding algorithm. To fully express the node type, network structure and rich semantic relationship of the original graph, and retain the implicit features of the network, this paper utilizes the node2vec algorithm [27] for graph embedding training. The node2vec algorithm generates the random walks, and there are two sampling strategies: breadth-first sampling (BFS) and depth-first sampling (DFS), shown in Fig. 5.
Fig. 5
An example of a random walk.
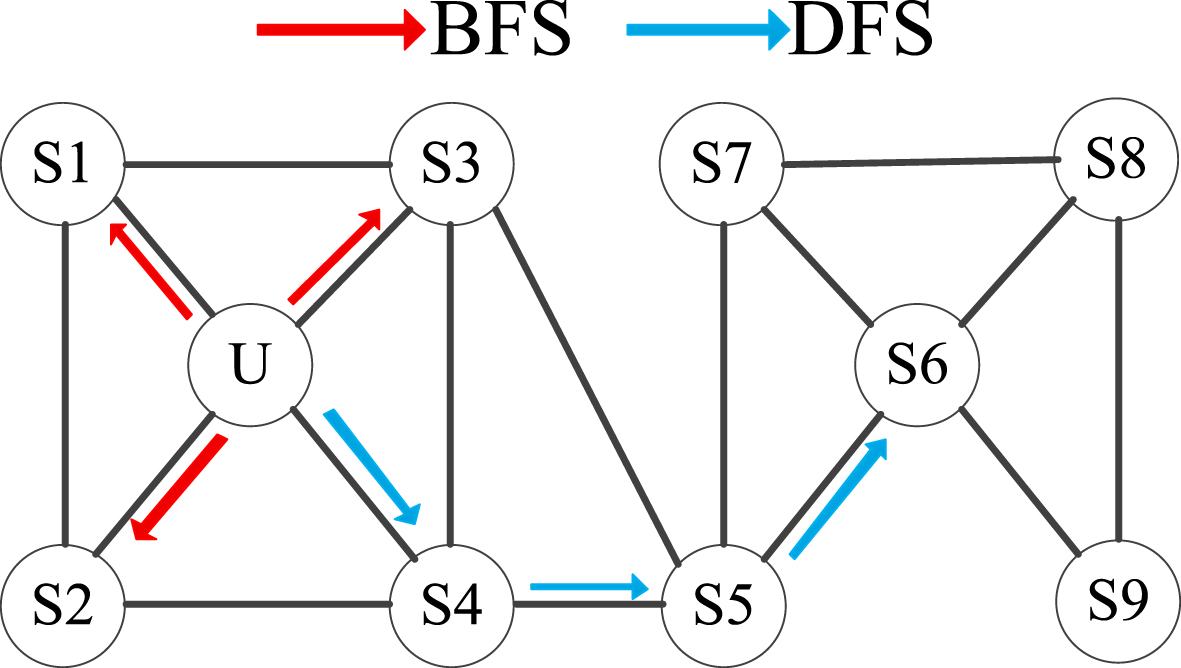
In the sampling process, the BFS only samples nodes directly adjacent to the start nodes, while the DFS also samples nodes at increasing distances from the start nodes. After obtaining the paths via random walk, the word embedding approach is applied to model the representations of nodes in the network. In addition, we can use constraints to adjust sampling strategies dynamically.
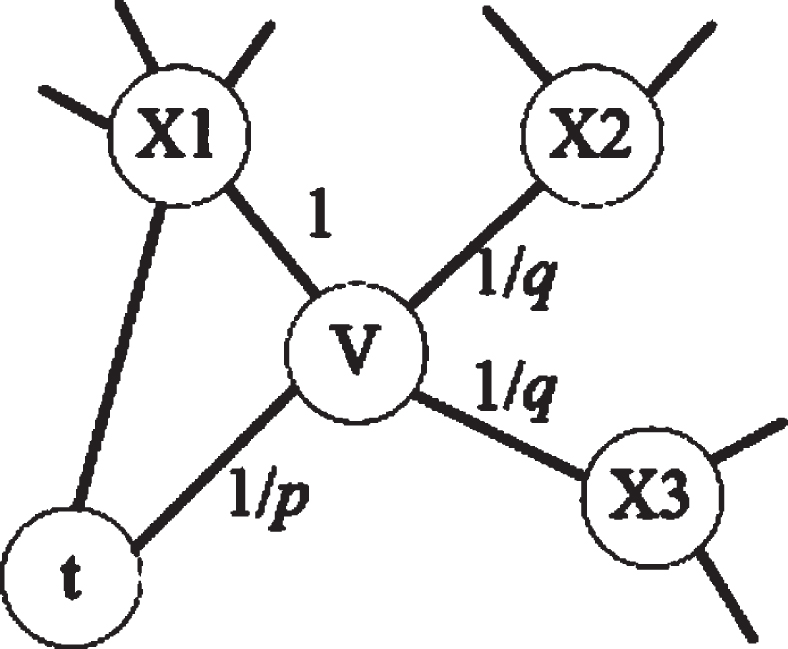
Thus, the node2vec algorithm adjusts the strategies of random walk dynamically by introducing two parameters, p and q, as shown in Fig. 6. Parameter p controls the probability of repeated visits to the visited node, and q controls the walk direction (i.e., inwards or outward). The probability of sampling a visited node is small if the value of p is large. Otherwise, the probability is large. It seems that the node2vec algorithm is similar to the DeepWalk algorithm [28]. However, the node2vec algorithm improves the generation method of random walks because the generated random walks reflect the characteristics of both BFS and DFS. Then, node2vec can enhance the performance of network embedding.
Fig. 6
Node2vec Sampling.
The node2vec algorithm is described as follows.
The node2vec algorithm
LearnFeatures (Graph G=(V,E,W). Dimensions d, Walks per node r, Walk length l, Context size k, Return p, In-out q)
π=PreprocessModifiedWeights(G, p, q)
G’=(V, E,π)
Initialize walks to Empty
for iter = 1 to r do
for all nodes u ∈ V do
walk = node2vec Walk (G’, u, l)
Append walk to walks
f = StochasticGradientDescent (k, d, walks)
return f
node2vecWalk (Graph G’=(V, E,π),Start node u, Length l)
Initialize walk to [u]
for walk_iter = 1 to l do
curr = walk
Vcurr = GetNeighbors(curr, G’)
s = AliasSample(Vcurr,π)
Append s to walk
return walk
In the above algorithm, G denotes the graph, V represents the set of nodes, E denotes the set of edges, d represents the dimension of vectors, r denotes the required number of random walks for each start node, the default fixed length of random walk is 1, k is the size of context window, f:
At every step of the walk, the transition probabilities of the start node to its neighbors are computed according to Equation (1). Suppose a random walk has just traversed edge (t, v) and now is at node v. The transition probability πvx on edge (v, x) is evaluated to decide in the next step x. Since the weights of edges are set as 1 in this paper, the unnormalized transition probability is set to πvx = αpq (t, x).
(1)
After the transition probabilities are obtained, they are summed with G to form G’. Then, the random walks are denoted by walks. Since there are r random walks for each start node, walks are initialized as null, and r random walks for each node in the graph are generated.
Finally, the stochastic gradient descent (SGD) method is applied to train the walks, and optimize the objective function, shown as Equation (2), maximizing the log-probability of the network neighborhood of node u NS (u) based on their feature representations from f.
(2)
Due to the storage of interconnections between the neighbors of each node, the space complexity for node2vec is O (a2|V|), and a denotes the average degree of the graph, which is usually small in real-world networks. To simulate a random walk of length l > k, k samples can be generated for l-k nodes owing to the Markovian nature. Thus, the time complexity for each sample is
5A new approach to personalized learning resource recommendation
5.1Recommendation process
This paper proposes a new personalized learning resource recommendation approach, denoted as PLRec-KL. The recommendation process is shown in Fig. 7.
Fig. 7
Learning resource recommendation.
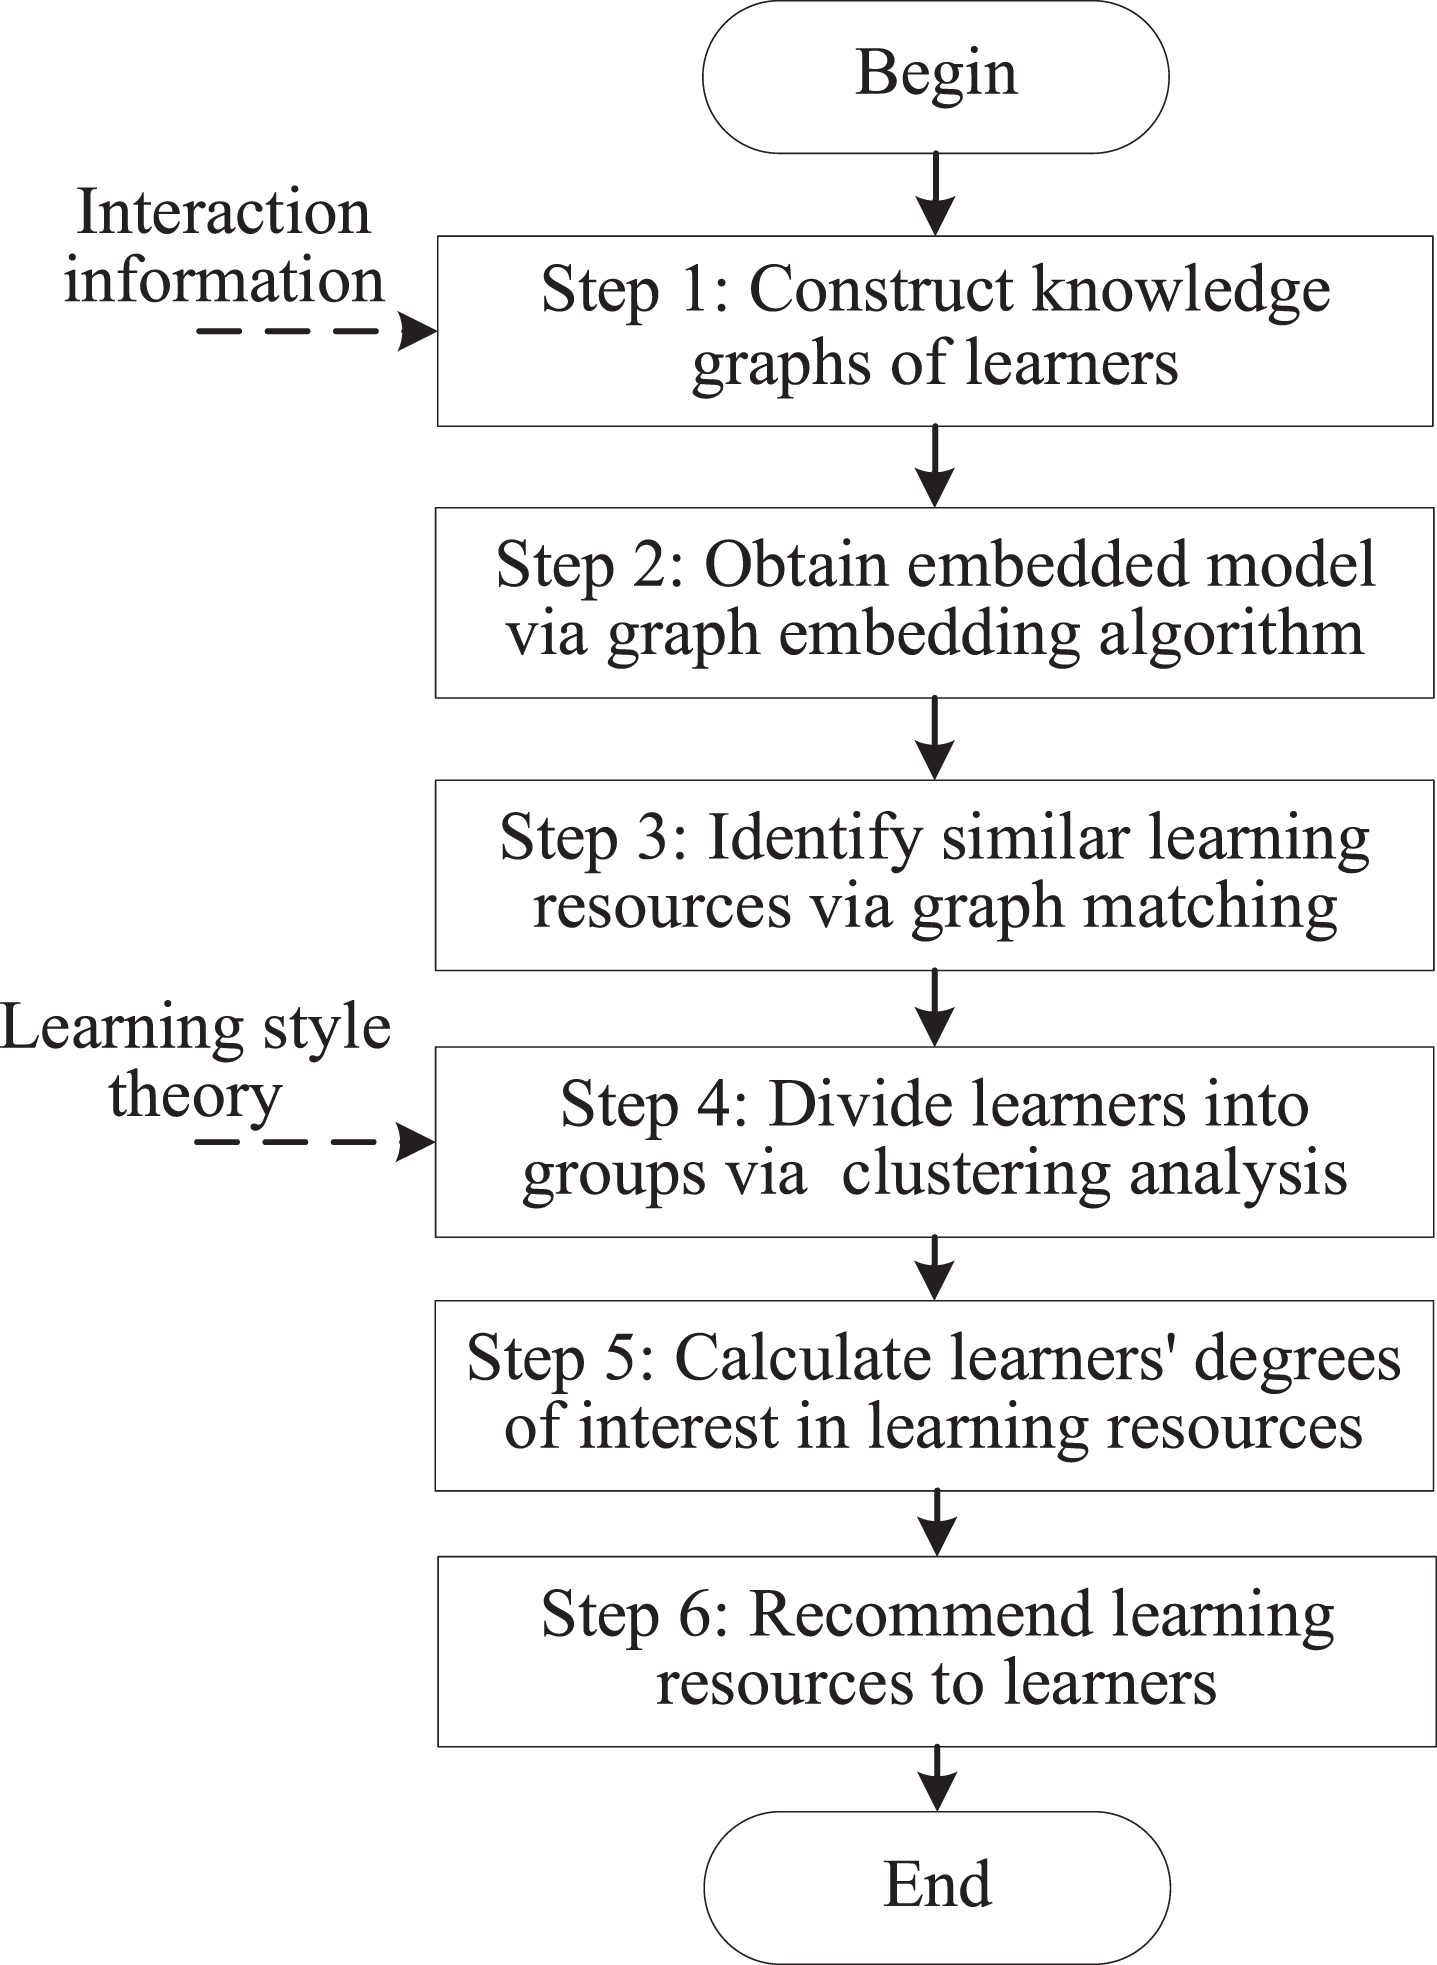
To improve computational efficiency, PLRec-KL extracts the interaction information to construct the knowledge graphs of learners in an e-learning system, and adopts the graph embedding algorithm to obtain an embedded model of the constructed knowledge graphs. Thus, the direct computation on the whole graph is replaced with numerical computation on the embedded model. Then, graph matching is applied to obtain similar subgraphs, and the set of personalized learning resources could be obtained after filtering unrelated entities and relationships in the subgraphs. Considering the group tendency in the process of learning, learners are divided into groups via learning style clustering, and the calculation method of learners’ degrees of interest in resources is also optimized via learning style clustering. Finally, the set of recommendation results is also obtained by sorting learning resources in descending order according to the learners’ interest in resources obtained via graph matching. From Fig. 7, the recommendation process consists of 6 steps. Section 3 has introduced the implementation method of Step 1, and Section 4 analyzed the implementation method of Step 2. The remaining 4 steps will be discussed in detail in the next subsections.
5.2Identify similar learning resources via graph matching
By acquiring learners’ online learning information map, the learners’ registration information, learning records and other historical data are converted into subgraphs according to the generic ontology model, shown in Fig. 8.
Fig. 8
Input of learner information map.
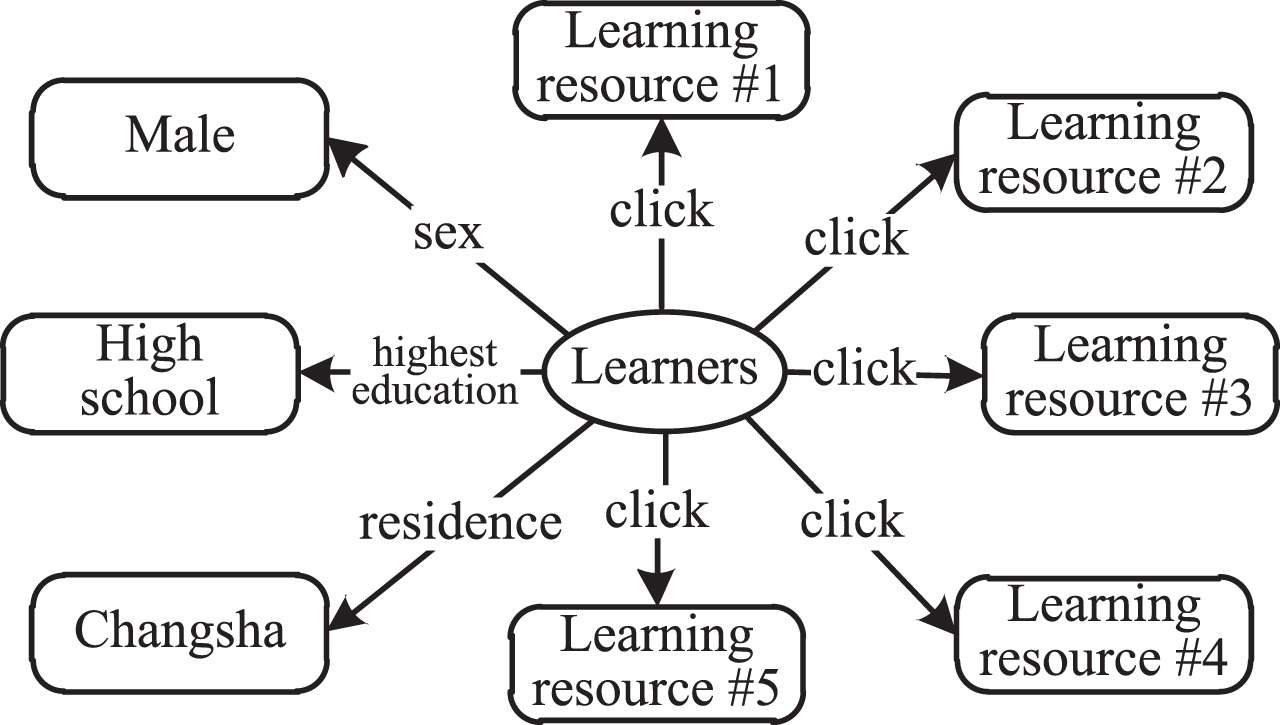
Existing research has demonstrated that gender could influence learners’ learning style and performance to some extent [29, 30]. Thus, it is shown as an indispensable feature of learners’ registration information in the information map. In this paper, the learners’ degrees of interest in resources are calculated according to their learning styles, and sorted recommendation results are obtained according to the degrees of interest. However, for those new learners lacking interaction records, because their information maps only consist of the registration information, and their learning styles cannot be measured. Therefore, learning resources are recommended based on their similar learners’ historical interactions.
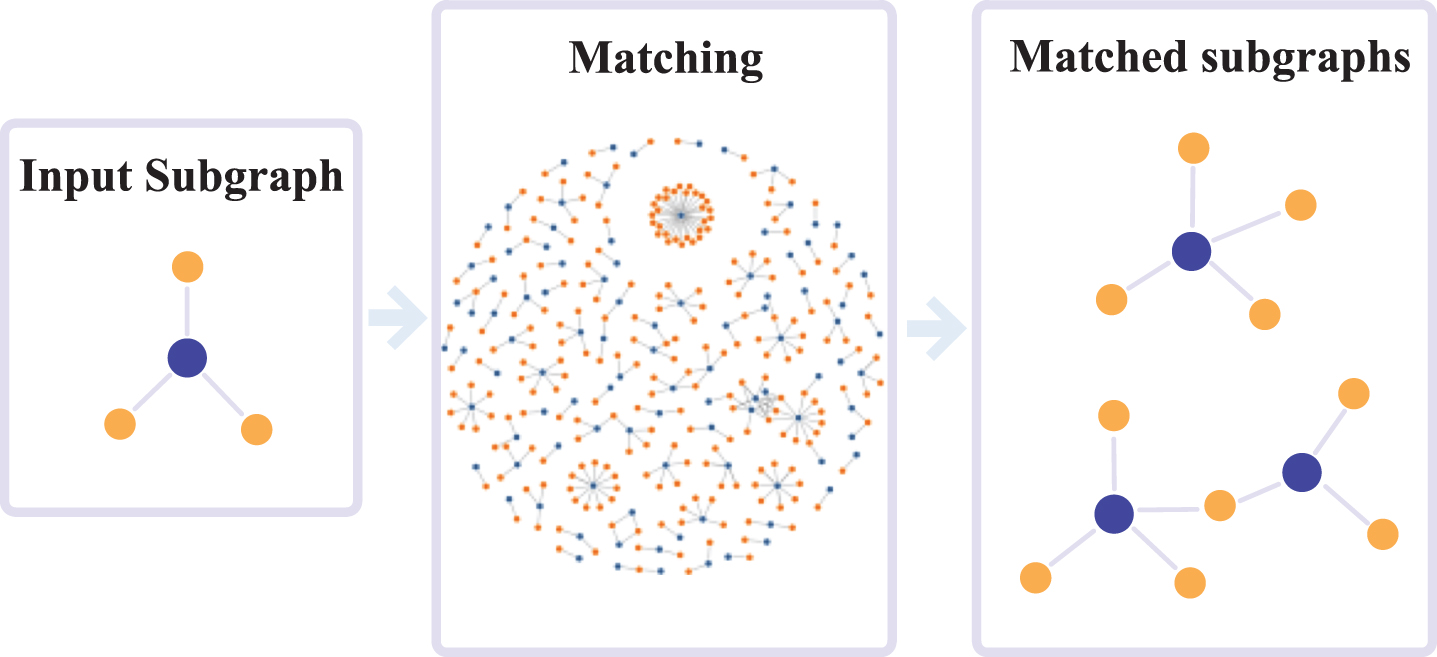
Then, with the input of learners’ information subgraphs, the most similar matched subgraphs are quickly obtained via the graph matching algorithm [31]. The process of obtaining similar subgraphs is shown in Fig. 9.
Fig. 9
Process of obtaining similar subgraphs.
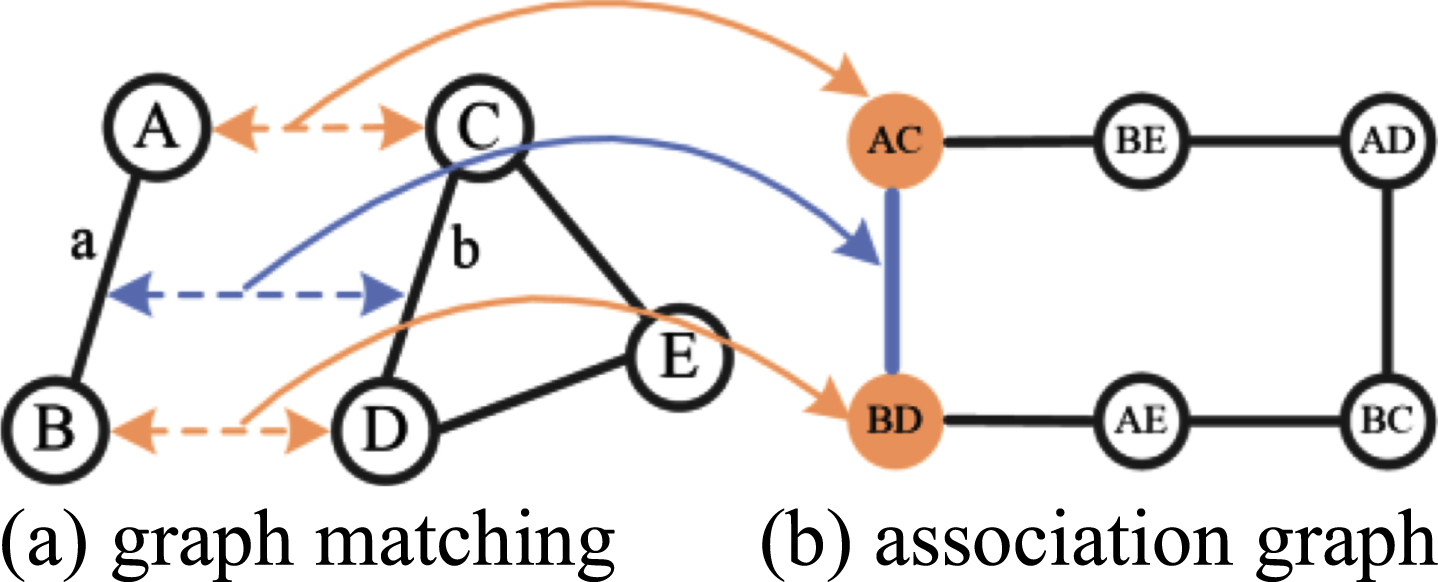
Two graphs need to be matched in a graph matching problem, while the random walk algorithm only is applied to a single graph. Therefore, it is necessary to transform the two graphs into a single graph, namely an association graph, when applying a random walk to deal with the graph matching problem. An example of graph matching is given in Fig. 10, in which two nodes (i.e., A and B) are matched to three nodes (i.e., C, D and E). Figure 10(a) shows the two original graph structures and Fig. 10(b) displays the association graph of Fig. 10(a). Nodes and edges in the association graph represent the matching relationships between matched nodes and the similarity of matched edges in the original graphs, respectively. To be specific, the node AC in the association graph denotes the matching relationship between A and C in the original graph structures, and the weighted edge AC-BD represents the similarity of edge a and edge b. Hence the association graph is undirected and weighted. Since the weights of nodes in the association graph could be obtained via the random walk algorithm, the graph matching problem is transformed into a new problem of finding some nodes with the maximum weight in the association graph.
Fig. 10
Process of graph matching.
Since the embedded model of the whole graph has been obtained via random walks in the process of graph embedding, which has captured structural characteristics, graph matching is transformed from the original graph into the embedded network in the proposed approach. By inputting embeddings of nodes in the learner’s information map, the embeddings of other nodes with the highest relevance in the graph could be obtained. After filtering according to node type, the embeddings for similar learners are obtained.
After obtaining similar subgraphs, the types of nodes and relationships are aggregated and filtered based on restricted constraints. Specifically, if the nodes or relationships in subgraphs are not learning resources, or other elements do not satisfy the restricted constraints, they are filtered out, and the final set of similar learning resources is obtained.
Since graph matching is conducted on the embedded model in our work, the results of graph matching depend on the results of graph embedding, which mainly rely on the logic of sampling. To guarantee good results of graph embedding, we apply the node2vec algorithm to learn embeddings of nodes in the graph, and it takes “random walk” as the sampling strategy to mine the overall structural characteristics of the original network with a certain degree of ambiguity. Thus, the embedded model could provide prediction capabilities for some hidden fuzzy characteristics, i.e., it could capture similarities between learners.
5.3Divide learners into groups via clustering analysis
The introduction of learning style theory could improve the efficiency of learning resource recommendation by analyzing learners’ learning styles and identifying similar learners with the same learning styles [10]. This paper uses the most widely used learning style theory, i.e., the Fred Silverman model [25]. This model characterizes online learners via eight features from four aspects, i.e., sociology, emotion, physiology, and psychology, illustrated in Table 2.
Table 2
Online learning style model
| Category | Feature | Learning behavior |
| Sociology | Communicational | Being active in the forum, etc. |
| Emotion | Motivational | Long duration of study, doing a lot of assessments, etc. |
| Physiology | Verbal | Prefer text and audio materials |
| Visual | Prefer videos and pictures | |
| Psychology | Sequential | Browse materials in a logically ordered progression |
| Global | Jump from one material to another | |
| Sensory | Prefer facts, data, and experimental materials | |
| Intuitive | Prefer principles and theories |
By analyzing the learners’ learning data and counting the number of clicks in different types of activities, we present the analysis results in a table format, where rows denote learners, and columns denote their preferences for different activity types. Then, the combination of interactive activity types is used as the feature for clustering, e.g., the number of clicks on the forum could reflect how active a learner is in the process of learning. Due to the lack of detailed interaction data for each web page in the OULAD dataset, the activity types corresponding to sensing and intuitive features cannot be obtained. Therefore, the activity types could only be modeled by six features, i.e., communicational, motivational, verbal, visual, sequential, and global features. Existing research [10] demonstrates that satisfactory results could also be obtained via the six features.
The K-means algorithm is applied to divide learners into different clusters. Supposing there are N learners, the learner xn is denoted via a vector f_(d_n1), and dnj represents the j-th feature of xn. The Euclidean distance metric is used to measure the similarity between learners, and N learners are clustered into K clusters based on the similarity values. Ck represents the kth cluster, and the learners in Ck are represented by the barycenter.
All learners are clustered based on the pre-processing results, and each cluster represents a learning style. To evaluate the performance of PLRec-KL at different K values, we choose the Silhouette Coefficient (SC) and the Calinski-Harabaz (CH) index as metrics. The SC score is in the range of [-1, 1], where 1 represents dense clustering. The high CH score also indicates that the clustering effects of the proposed model are superior. As experiment results demonstrated, the optimal value of K is 5.
5.4Calculate learners’ degrees of interest in learning resources
Based on the clustering results, we can optimize the computation method about learners’ interests in learning resources. The set of learning resource recommendation results could be obtained by calculating the learners’ degrees of interest in associated learning resources and filtering out resources according to interest values.
Define the cosine similarity metric between im and in in cluster Ck by
(3)
Referring to the AROLS method [10], define the subset of learning resources I in cluster Ck as Ij, and the support of Ij is the percentage of learners in Ck who have browsed learning resource set Ij. Then, the calculation method is as follows.
(4)
Define the support of the association rule Ii → Ij as the percentage of learners in Ck who have clicked both Ii and Ij. The calculation method is as follows.
(5)
(6)
(7)
5.5Recommend learning resources to learners
By calculating the learners’ degrees of interest in these similar resources, the final recommendation results could be obtained after sorting the resources according to their degrees of interest.
The proposed approach constructs a knowledge graph to obtain a set of similar resources by matching similar learners, and determines learners’ learning styles according to their interactions with VLE resources. Based on their learning styles, learning resources are recommended to learners by calculating their interest degree in the obtained similar resources. Thus, the recommendation results have good interpretability. For example, a learner who has often interacted with quiz resources might be clustered into a group with a motivational learning style. Then, based on the embedded model of the knowledge graph, these resources that other members in the same group often interacted with might be recommended to the learner.
6Experiment
All experiments are implemented by Java 8 and Neo4j graph DBMS, on a Linux system with an Intel Xeon Silver 4214 CPU and 256G ECC memory.
6.1Efficiency comparison
Affected by the complex online learning environment involving a huge number of learners and learning resources, the constructed knowledge graph has a large graph scale with numerous nodes, edges and attributes. Then, the large scale of graph data would lead to a long execution time and enormous demand for resources in the computation process. Thus, the graph embedding algorithm is used to cope with the problems caused by the large scale of graph data.
To verify the effectiveness of the graph embedding algorithm for improving computational efficiency, we conduct experiments to compare the actual response time and resource usage of direct computation of a graph with those of computation of an embedded model trained by the graph embedding algorithm. Extracted edges are randomly expanded from 2 million to 20 million. Based on that, the experiments are divided into two groups. Firstly, the random three-level deep retrieval is conducted by Neo4j (denoted as graph_D). Another group conducts three-level deep retrieval on an embedded model trained by the graph embedding algorithm (denoted as embed_M). The experiments are comprehensively evaluated from response time and memory usage.
(1) Comparison of response time
The results are shown in Table 3. The difference in average response time between graph_D and embed_M is not obvious when the graph data scale is small. However, with the increasing scale of graph data, the results become significantly different. For example, when the graph data scale is 107, the response time of embed_M is 701 milliseconds, while that of graph_D is 14,785 milliseconds. Obviously, the computation efficiency has been significantly improved by adopting the graph embedding algorithm in large-scale data scenarios.
Table 3
Comparison of time efficiency
| Graph scale | embed_M (ms) | graph_D (ms) |
| 102 | 63 | 38 |
| 103 | 64 | 57 |
| 104 | 67 | 160 |
| 105 | 138 | 281 |
| 2×10⁵ | 151 | 517 |
| 3×10⁵ | 161 | 773 |
| 4×10⁵ | 173 | 1,034 |
| 6×10⁵ | 189 | 1320 |
| 8×10⁵ | 208 | 1,613 |
| 1.2×10⁶ | 289 | 1,968 |
| 1.6×10⁶ | 254 | 2,327 |
| 2.4×10⁶ | 290 | 2,897 |
| 3.2×10⁶ | 328 | 3,467 |
| 4.8×10⁶ | 380 | 5,210 |
| 6.4×10⁶ | 436 | 7,418 |
| 9.6×10⁶ | 567 | 10,601 |
| 1.28×10⁷ | 701 | 14,785 |
(2) Comparison of memory usage
The results are shown in Table 4. Graph_D outperforms embed_M in memory usage when the graph data scale is lower than 2×10⁵. Graph_D only loads the core modules from the graph database into memory during the initializing process, while embed_M has to load the entire embedded model at once. Thus, compared with graph_D, embed_M consumes more resources due to the loading of the basic framework. However, with the increasing scale of graph data, embed_M significantly outperforms graph_D. For example, when the scale of graph data is 1.28×10⁷, the memory usage of graph_D is 18,357 MB, while that of embed_M is only 7,231 MB. The reason is that more information (e.g., the nodes, edges, attributes, and numerical result of reasoning calculation) has to be loaded from the graph database into memory, while the embedded model only loads the numerical results of the graph embedding training based on the existing framework of the basic model. Overall, the memory consumed by the graph embedding model does not significantly grow with the increasing data scale. Hence it could economize systematic resources in large-scale data scenarios.
Table 4
Comparison of memory efficiency
| Graph scale | embed_M (MB) | graph_D (MB) |
| 102 | 1,381 | 523 |
| 103 | 1,463 | 531 |
| 104 | 1,606 | 729 |
| 105 | 1,681 | 1,053 |
| 2×10⁵ | 1,866 | 1,640 |
| 3×10⁵ | 2,062 | 2,312 |
| 4×10⁵ | 2,366 | 2,879 |
| 6×10⁵ | 2,551 | 3,619 |
| 8×10⁵ | 2,748 | 4,426 |
| 1.2×10⁶ | 3,128 | 5,501 |
| 1.6×10⁶ | 3,517 | 6,581 |
| 2.4×10⁶ | 4,021 | 8,153 |
| 3.2×10⁶ | 4,538 | 9,732 |
| 4.8×10⁶ | 5,151 | 11,577 |
| 6.4×10⁶ | 5,773 | 13,428 |
| 9.6×10⁶ | 6,498 | 15,889 |
| 1.28×10⁷ | 7,231 | 18,357 |
6.2Analysis of K value in learning style clustering
The K value in the K-means algorithm is analyzed on the OULAD dataset, where K denotes the number of learning style clusters. Figure 11 illustrates the variation of the SC and CH scores with different K.
Fig. 11
Evaluation of learning style clustering.
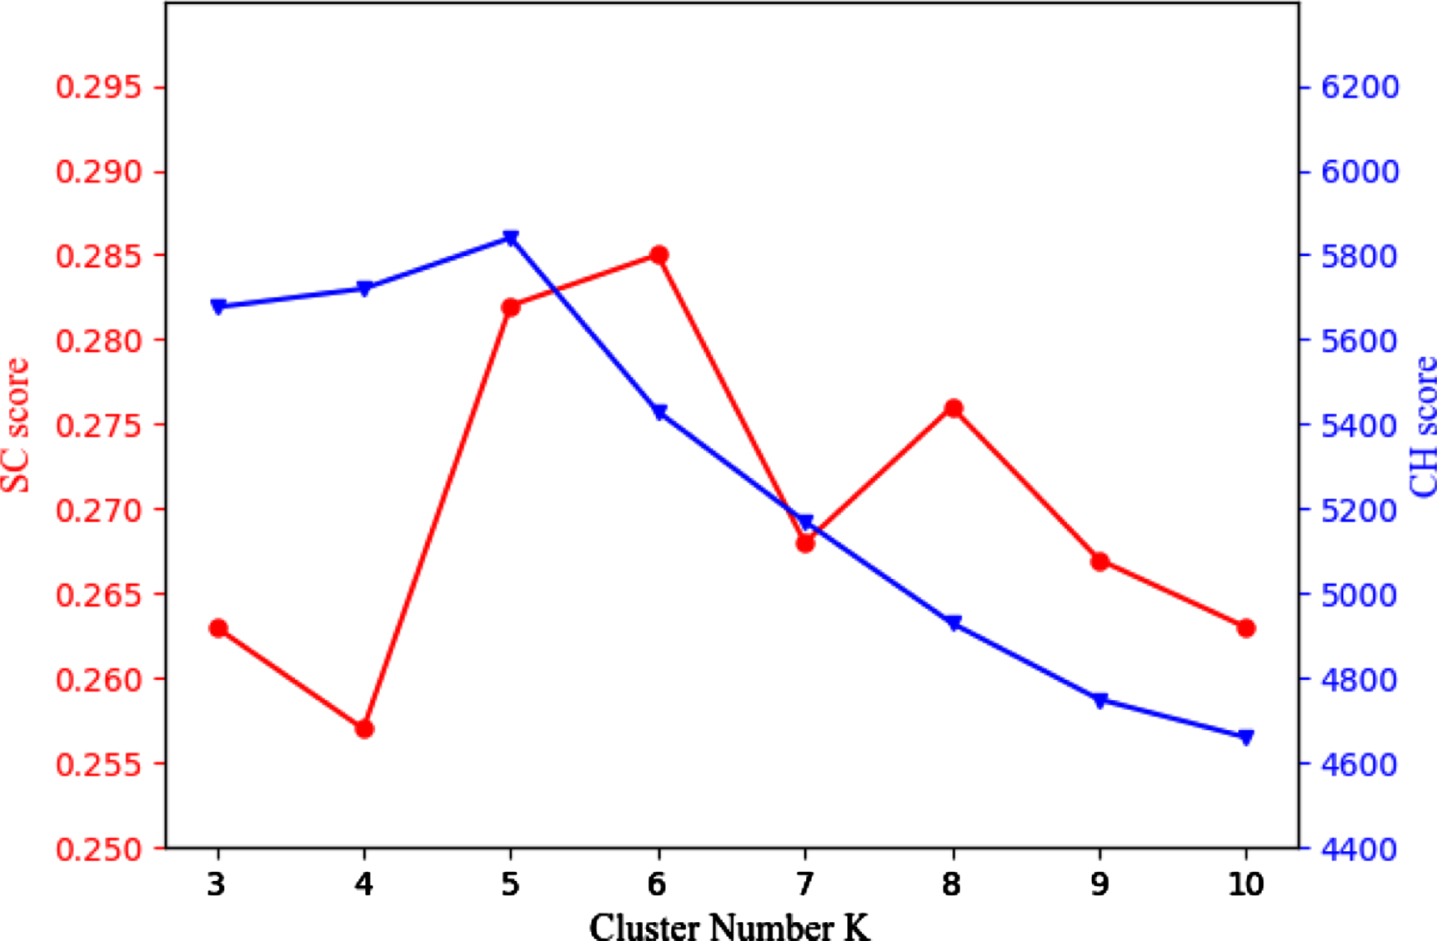
In Fig. 11, the red line denotes the SC score and the blue line denotes the CH score. From Fig. 11, when K = 6, the SC score reaches the peak 0.285, while the CH score is 5,431; when K = 5, the CH score reaches the peak 5,864, while the SC score is 0.282. Obviously, the decreased amplitude of CH score from 5,864 to 5,431 is greater than the increased amplitude of SC score from 0.282 to 0.285. For the best performance of clustering, K is comprehensively suggested as 5.
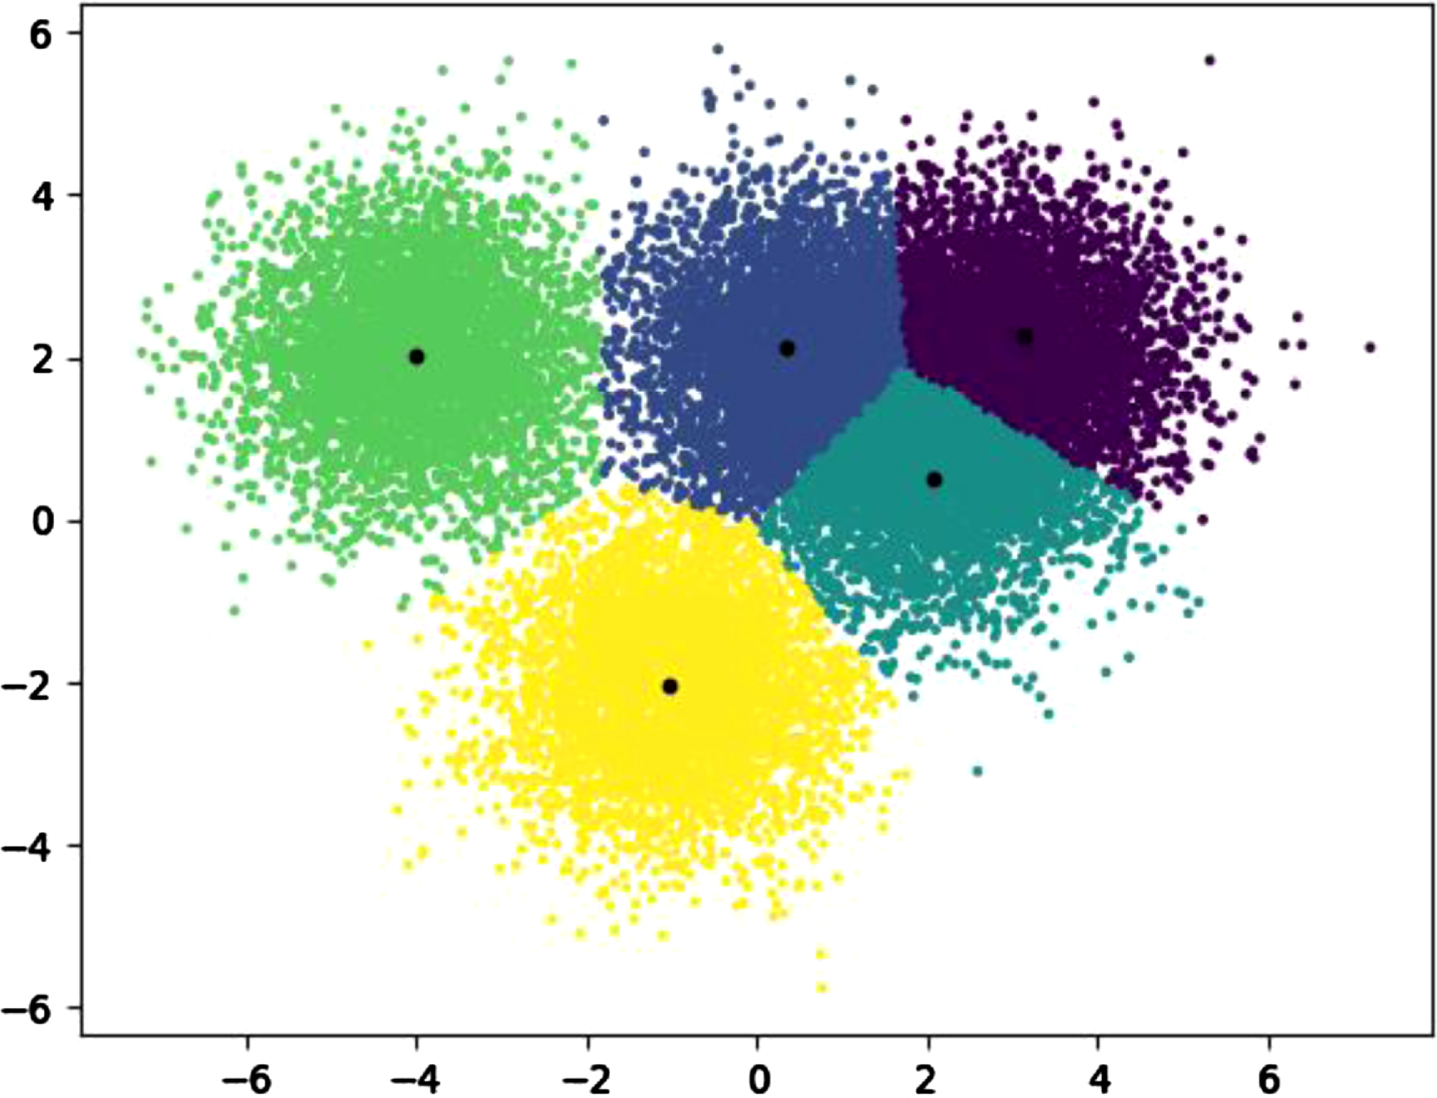
Besides, the clustering results are mapped onto a lower dimensional space via dimension reduction, and learners that have different learning styles are characterized with different colors. From Fig. 12, the learners are divided into five clusters on the premise of a certain number of learners in every cluster. Therefore, the results demonstrate the effective feature mining of learners’ learning styles.
Fig. 12
Learning style clustering and grouping results.
6.3Performance comparison
In this experiment, the performance of PLRec-KL is compared with that of the baseline methods including the user-based CF method (denoted as UserCF), the item-based CF method (denoted as ItemCF), the DNN method [25], and the AROLS method [10]. To ensure data stability and accuracy, we extract 19,263 learners whose average assessment values are greater than or equal to 60 from the OULAD dataset. To further guarantee the accuracy of the results, these records are deleted if a standard deviation exceeds 10 for at least one feature due to the possible large outliers generated by the K-means algorithm.
The precision, recall, and F1 score are widely used to evaluate the quality of recommendations [10], and we also select them as the evaluation metrics to measure the effectiveness of the approach. Their calculation methods are as follows.
(8)
(9)
(10)
(1) Precision comparison
The experiments results are shown in Table 5. In Table 5, the N in x axis denotes the number of top-N recommended resources. Compared with baseline methods, PLRec-KL has significant improvements in precision. Taking N = 20 as an example, UserCF performs the lowest precision value of 0.164, while the average precision value of PLRec-KL is 0.306, which has increased by 8.6% compared with AROLS. The results fully reflect the role of knowledge graphs applied in PLRec-KL. As we know, knowledge graphs contain the background information of recommended resources and the relationships between resources, and could integrate learners-resources networks generated according to user behavior data. Just based on them, PLRec-KL is able to uncover hidden associations between learners and resources, and complete interaction data between learners and resources. Thus, PLRec-KL further improves the recommendation performance compared with other approaches.
Table 5
The results of accuracy
| N \ Methods | PLRec-KL | ItemCF | UserCF | DNN | AROLS |
| 5 | 0.303 | 0.187 | 0.126 | 0.225 | 0.281 |
| 15 | 0.309 | 0.173 | 0.127 | 0.228 | 0.279 |
| 25 | 0.294 | 0.158 | 0.118 | 0.223 | 0.269 |
| 35 | 0.279 | 0.145 | 0.109 | 0.206 | 0.258 |
| 45 | 0.275 | 0.136 | 0.097 | 0.195 | 0.246 |
| 55 | 0.267 | 0.132 | 0.090 | 0.190 | 0.244 |
| 65 | 0.261 | 0.124 | 0.085 | 0.185 | 0.243 |
| 75 | 0.259 | 0.118 | 0.078 | 0.184 | 0.240 |
| 85 | 0.254 | 0.109 | 0.073 | 0.182 | 0.239 |
| 95 | 0.248 | 0.103 | 0.071 | 0.178 | 0.235 |
(2) Recall comparison
The experiments results are shown in Table 6. From Table 6, it is obvious that the recall value continuously increases with the growing value of N, and DNN method outperforms ItemCF and UserCF. Since traditional CF recommendation algorithms tend to calculate similarities based on the existing interaction records, most of the resources recommended to users are those they have already interacted with before, which lead to a low recall value. To break the limitation, due to the unique graph network structure of knowledge graphs, we can use path matching to express underlying associations. Thus, we can further effectively mine the possible associated paths and make knowledge graphs-based recommendations to achieve significant improvements in recall compared with existing approaches. Based on that, the recall of PLRec-KL increases by 68.9% compared with the DNN method.
Table 6
The results of recall
| N \ Methods | PLRec-KL | ItemCF | UserCF | DNN | AROLS |
| 5 | 0.131 | 0.042 | 0.057 | 0.079 | 0.069 |
| 15 | 0.137 | 0.045 | 0.061 | 0.087 | 0.070 |
| 25 | 0.142 | 0.051 | 0.065 | 0.094 | 0.073 |
| 35 | 0.145 | 0.054 | 0.070 | 0.100 | 0.075 |
| 45 | 0.148 | 0.056 | 0.072 | 0.106 | 0.076 |
| 55 | 0.151 | 0.061 | 0.072 | 0.109 | 0.075 |
| 65 | 0.154 | 0.062 | 0.073 | 0.112 | 0.075 |
| 75 | 0.159 | 0.064 | 0.074 | 0.114 | 0.077 |
| 85 | 0.160 | 0.067 | 0.073 | 0.115 | 0.075 |
| 95 | 0.161 | 0.070 | 0.074 | 0.114 | 0.077 |
(3) F1 score comparison
With similar precision and recall values, we apply the F1 score to effectively evaluate the comprehensive performance of each model. The experiment results are shown in Table 7.
Table 7
The results of F1 score
| N \ Methods | PLRec-KL | ItemCF | UserCF | DNN | AROLS |
| 5 | 0.183 | 0.069 | 0.078 | 0.117 | 0.111 |
| 15 | 0.190 | 0.071 | 0.082 | 0.126 | 0.112 |
| 25 | 0.192 | 0.077 | 0.084 | 0.132 | 0.115 |
| 35 | 0.191 | 0.079 | 0.085 | 0.135 | 0.116 |
| 45 | 0.192 | 0.079 | 0.083 | 0.137 | 0.116 |
| 55 | 0.193 | 0.083 | 0.080 | 0.138 | 0.114 |
| 65 | 0.194 | 0.082 | 0.079 | 0.139 | 0.115 |
| 75 | 0.197 | 0.083 | 0.076 | 0.141 | 0.117 |
| 85 | 0.196 | 0.083 | 0.073 | 0.140 | 0.117 |
| 95 | 0.195 | 0.083 | 0.073 | 0.139 | 0.116 |
From Table 7, there is no significant difference between UserCF and ItemCF in terms of overall performance, while the DNN method outperforms than other baselines. Since the DNN could better explore underlying features among elements in multi-feature and non-linear data, and utilize the multi-layer network to match these hidden mapping well, it shows superior comprehensive performance. As a knowledge graph is big and integrated with various heterogeneous auxiliary information, its network structure is utilized for association matching and path analysis. Thus, compared with the baselines, PLRec-KL outperforms in F1 score, especially with an improvement of 35.7% compared with DNN.
6.4Ablation experiment
To further verify the effectiveness of the graph embedding algorithm and learning style theory, two variants of PLRec-KL are compared with the proposed approach in this experiment, denoted as PLRec-KL_NO_EMBED and PLRec-KL_NO_LS, where PLRec-KL_NO_EMBED represents the PLRec-KL without the graph embedding algorithm and PLRec-KL_NO_LS represents the PLRec-KL without adopting learning style theory. Besides, 80% of the data about the learners is selected as the training data and the remaining 20% is for testing the performance of PLRec-KL and PLRec-KL’s variants with different N. The results are shown in Figs. 13–15.
Fig. 13
Accuracy comparison of ablation experiments.
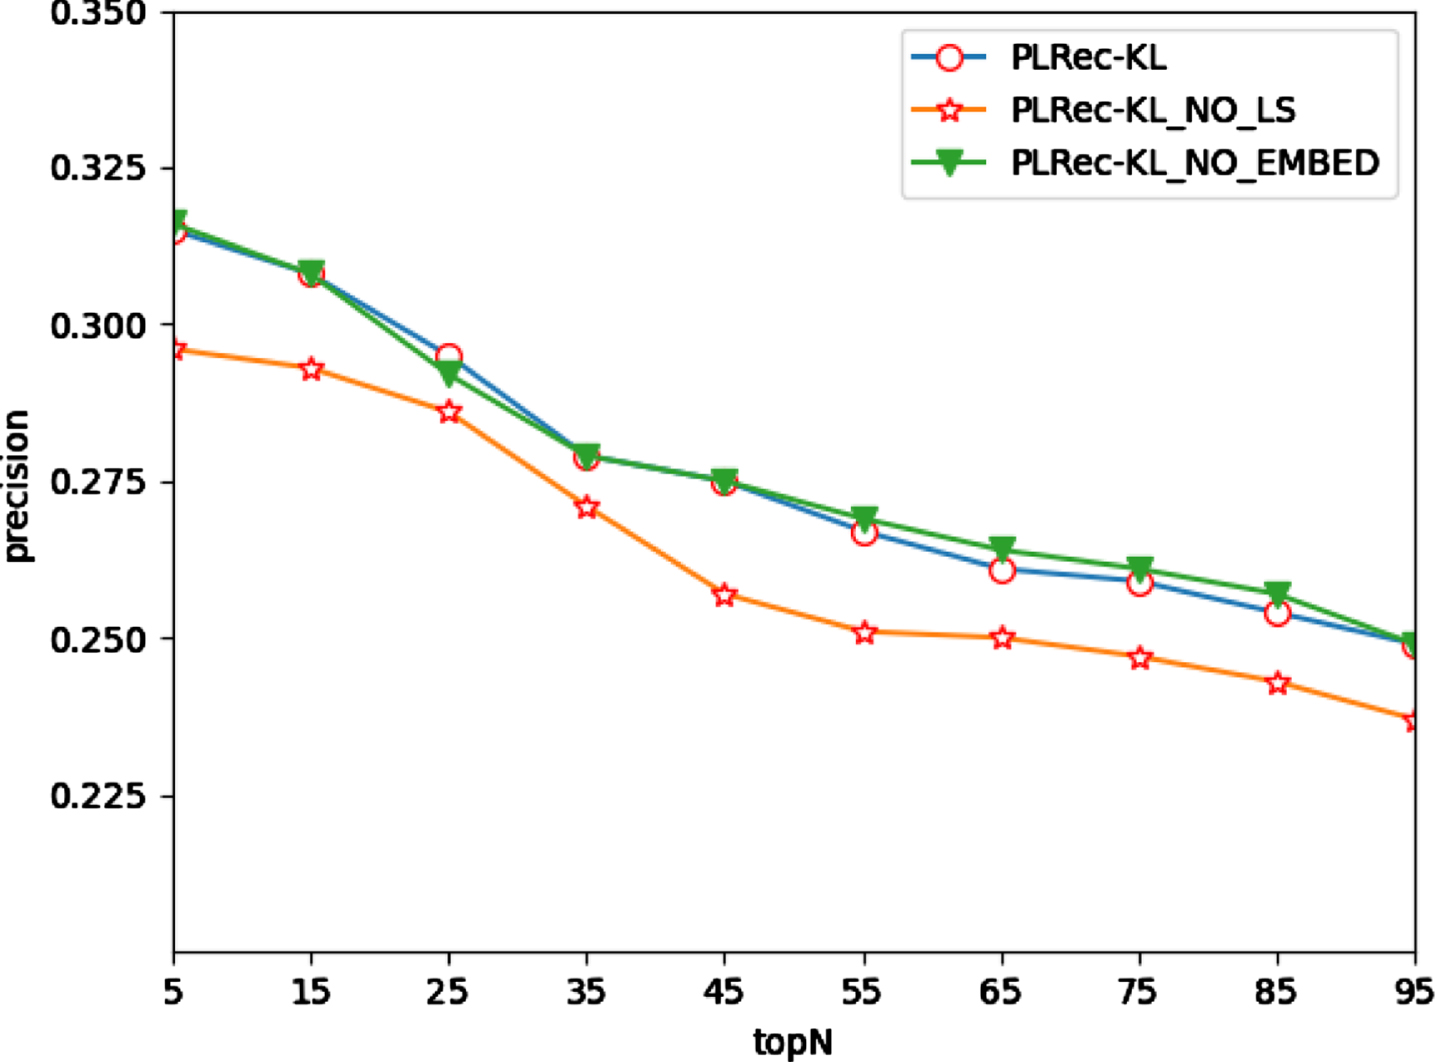
Fig. 14
Recall rate comparison of ablation experiments.
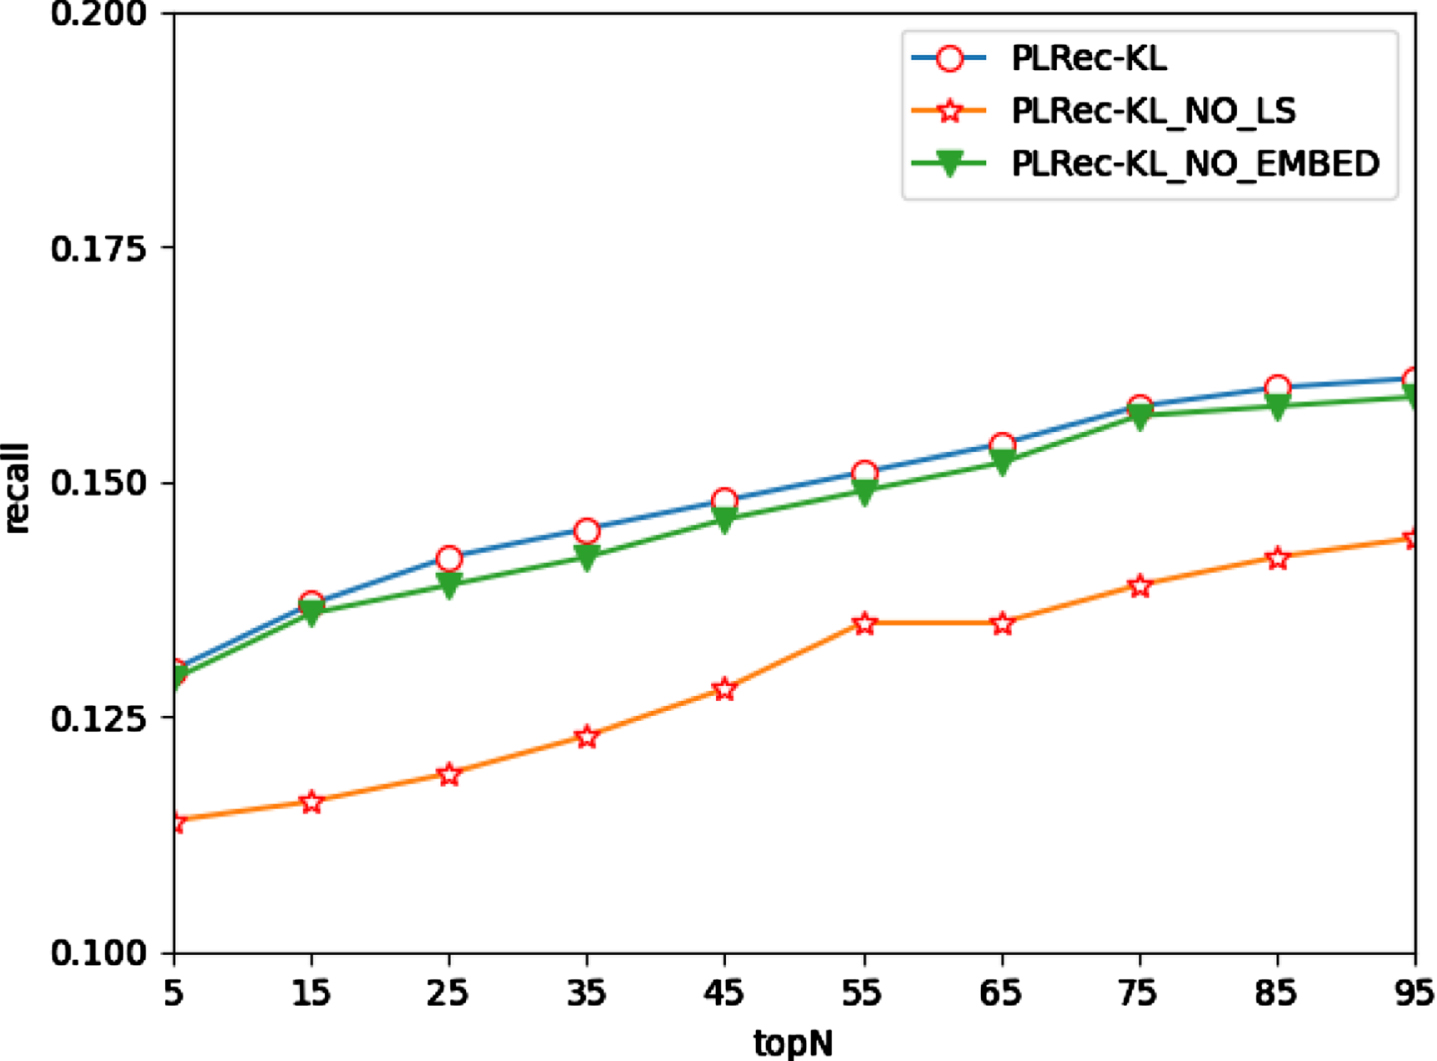
Fig. 15
F1 score comparison of ablation experiments.
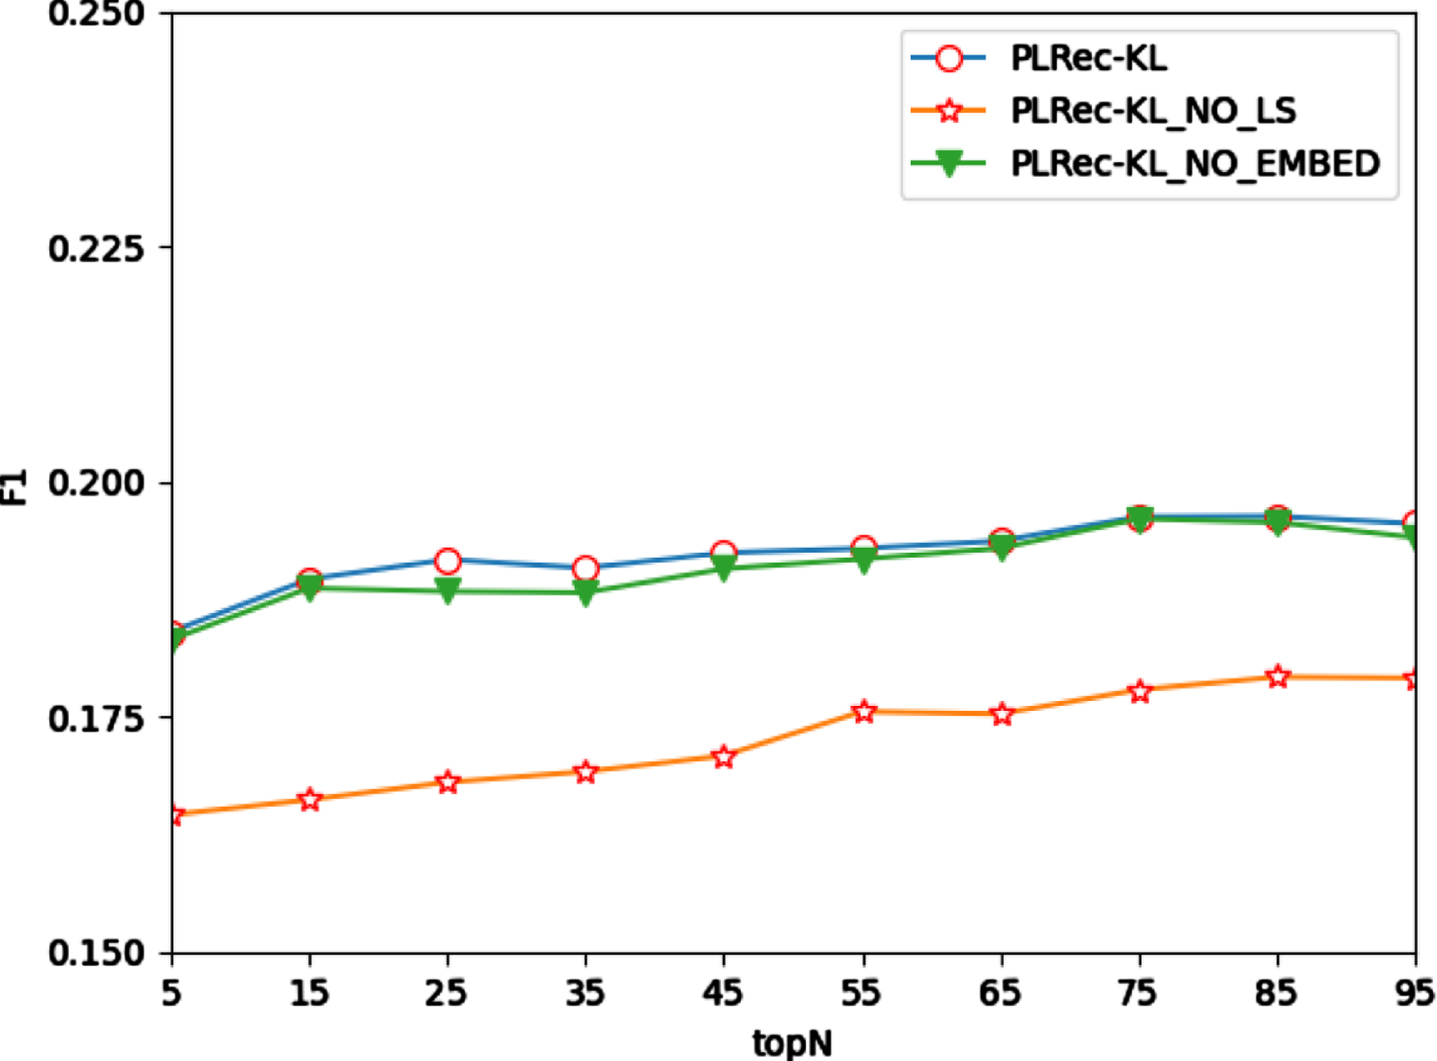
Since the learning styles theory is not used, PLRec-KL_NO_LS ignores the group psychological characteristics of learners in their learning process. Therefore, both its precision and recall have descended, leading to a significant decline in the F1 score. However, compared with PLRec-KL, the performance of PLRec-KL_NO_EMBED in precision is almost the same, and even increases by 0.8%; in terms of recall, it decreases by about 1%; and there is no significant difference between them in the F1 score. The main reason is that the embedded graph model obtained via graph embedding cannot perfectly match the original network structure and remain the problem of fuzzy predictability.
The results of ablation experiments indicate: (a) The adoption of learning style theory definitely improves the performance of recommendation; (b) the introduction of the graph embedding algorithm optimizes the computational efficiency, and cannot provide a significant boost in terms of recommendation performance.
Due to the large-scale of the graph data, the Neo4j database should be adopted to store graph data, and there are high requirements for the server configuration (e.g., memory) in the actual application scenarios. For example, the requirement for memory is 256 GB in our deployed server. In our experiments, once the scale of graph data increases to 1.28×10⁷, the usage of memory reaches 7,231MB, while it would be even larger in real applications owing to the larger scale of data.
In summary, by introducing the learning styles theory, PLRec-KL outperforms all the baseline approaches in both performance and efficiency due to the graph structure and embedded model. However, PLRec-KL faces the challenge of a high memory demand for graph data storage and training of the embedded model. Besides, the learners’ cognitive states reflect learners’ needs for knowledge concepts in the learning process. By considering the learners’ mastery of knowledge concepts, the learning resource recommendation should be able to further improve the interpretability of the recommendation results.
7Conclusion
To break the limitations of existing research, we proposed a personalized learning resource recommendation approach via knowledge graphs and learning style clustering. In this approach, the knowledge graphs for an online learning environment are constructed with a designed generic ontology and the combination of various characteristics and interaction information of learners in the e-learning platform. The graph embedding algorithm is applied to improve the graph computation efficiency. The learning style theory is adopted to optimize the calculation method of similarities between learning resources to further identify learners’ learning preferences and improving the recommendation performance. Finally, the extensive experiments on real-world datasets demonstrate that the proposed recommendation approach significantly improves the computation efficiency and quality of learning resource recommendation in large-scale graph data scenarios.
In the future, our work will focus on three aspects: 1) Further optimize the process of personalized learning resource recommendation by combining the graph embedding algorithm with graph neural network. 2) Further improve the personalization of learning resources by comprehensively considering the learning styles and cognitive status of learners. 3) Further make full use of the comprehensive advantages of knowledge graphs in expressing the relationships among learners, teachers, learning resources and knowledge concepts, and explore its application in automatic question answering or learning path planning.
Acknowledgment
This work was partially supported by the National Natural Science Foundation of China (Nos. 62077014 and 71971221) and Natural Science Foundation of Hunan Province, China (No. 2021JJ30886).
References
[1] | Kong L. , Ma H. , Peng Y. and Tang W. , Hybrid Recommendation of Personalized MOOC Resources: A User Context-aware Approach, Proceedings of the 25th IEEE International Conference on Computer Supported Cooperative Work in Design, 2022, 537–542. |
[2] | Zheng W. , Tang Y. and Liu H. , Survey of personalized learning recommendation, Journal of Frontiers of Computer Science and Technology 16: (1) ((2022) ), 21–40. |
[3] | Hogan A. , Blomqvist E. , Cochez M. , D’amato C. , Melo G. , Gutierrez CS. , Kirrane J. , Navigli R. , Neumaier S. , Ngomo A. , Polleres A. , Rashid S. , Rula A. , Schmelzeisen L. , Sequeda J. , Staab S. and Zimmermann A. , Knowledge Graphs, ACM ComputingSurveys 54: (4) ((2021) ), 1–37. |
[4] | Wu Y. and Zhao S. , Community answer generation based on knowledgegraph, Information Sciences 545: ((2021) ), 132–152. |
[5] | Xiong H. , Wang S. , Tang M. , Wang L. and Lin X. , Knowledge graphquestion answering with semantic oriented fusion model, Knowledge-Based Systems 221: ((2021) ), 106954. |
[6] | Hui B. , Zhang L. , Zhou X. , Wen X. and Nian Y. , Personalized recommendation system based on knowledge embedding and historicalbehavior, Applied Intelligence 52: (1) ((2022) ), 954–966. |
[7] | Xie L. , Hu Z. , Cai X. , Zhang W. and Chen J. , Explainable recommendation based on knowledge graph and multi-objective optimization, Complex & Intelligent Systems 7: (3) ((1241) ), 1252. |
[8] | Goyal P. and Ferrara E. , Graph embedding techniques, applications, and performance: A survey, Knowledge-Based Systems 151: (2018), 78–94. |
[9] | Zhang X. and Ma H. , Review on application of knowledge mapping andgraph embedding in personalized education, Computer Systems & Applications 31: (3) ((2022) ), 48–55. |
[10] | Chen H. , Yin C. , Li R. , Rong W. , Xiong Z. and David B. , Enhanced learning resource recommendation based on online learning style model, Tsinghua Science and Technology 25: (3) ((2020) ), 348–356. |
[11] | Zhao J. , Zhuang F. , Ao X. , He Q. , Jiang H. and Ma L. , Survey of collaborative filtering recommender systems, Journal of Cyber Security 6: (5) ((2021) ), 17–34. |
[12] | Ma H. , Huang Z. , Tang W. and Zhang X. , Exercise Recommendation Based on Cognitive Diagnosis and Neutrosophic Set, Proceedings of the 25th IEEE International Conference on Computer Supported Cooperative Work in Design, 2022, 1467–1472. |
[13] | Lin L. , Learning information recommendation based on text vectormodel and support vector machine, Journal of Intelligent and Fuzzy Systems 40: (2) ((2445) ), 2455. |
[14] | Wang G. , Yuan H. , Huang X. and Min L. , Recommendation algorithm fore-learning resources based on improved collaborative filtering, Journal of Chinese Computer Systems 42: (5) ((2021) ), 940–945. |
[15] | Pouli V. , Kafetzoglou S. , Tsiropoulou E. , Dimitriou A. and Papavassiliou S. , Personalized Multimedia Content Retrieval Through Relevance Feedback Techniques for Enhanced User Experience, Proceedings of the 13th International Conference on Telecommunications, 2015, 1–8. |
[16] | Sojahrood Z. and Taleai M. , A POI group recommendation method inlocation-based social networks based on user influence, Expert Systems with Applications 171: ((2021) ), Article ID:114593. |
[17] | Song F. , Sui D. and Zhou X. , Intelligence learning resourcere commendation algorithm based on deep learning, Journal of Nanjing University of Science and Technology 46: (2) ((2022) ), 185–191. |
[18] | Xu G. , Jia G. , Shi L. and Zhang Z. , Personalized course recommendation system fusing with knowledge graph and collaborative filtering, Computational Intelligence and Neuroscience (2021), Article ID: 9590502. |
[19] | Lv P. , Wang X. , Xu J. and Wang J. , Intelligent personalised exercisere commendation: A weighted knowledge graph-based approach, Computer Applications in Engineering Education 29: (5) ((2021) ), 1403–1419. |
[20] | Qiu Y. , Research on online course recommendation approaches enhanced by knowledge graph, Central China Normal University, Wuhan, 2020. |
[21] | Zhu H. , Tian F. , Wu K. , Shah N. , Chen Y. , Ni Y. , Zhang X. , Chaoand K. and Zheng Q. , A multi-constraint learning path recommendation algorithm based on knowledge map, Knowledge-Based Systems 143: ((2018) ), 102–114. |
[22] | Shi D. , Wang T. , Xing H. and Xu H. , A learning path recommendation model based on a multidimensional knowledge graph framework fore-learning, Knowledge-Based Systems 195: ((2020) ), 105618. |
[23] | Kolb A.Y. , The Kolb learning style inventory-version 3.1 technical specifications, Boston, MA: Hay Resource Direct 200: (72) ((2005) ), 166–171. |
[24] | Felder R.M. and Silverman L.K. , Learning and teaching styles inengineering education, Engineering Education 78: (7) ((1988) ), 674–681. |
[25] | Truong H.M. , Integrating learning styles and adaptive e-learningsystem: Current developments, problems and opportunities, Computers in Human Behavior 55: ((1185) ), 1193. |
[26] | Kuzilek J. , Hlosta M. and Zdrahal Z. , Open university learning analytics dataset, Scientific Data 4: (1) ((2017) ), 1–8. |
[27] | Grover A. and Leskovec J. , Node2vec: Scalable Feature Learning for Networks, Proceedings of the 22nd ACM SIGKDD International Conference on Knowledge Discovery and Data Mining, 2016, 855–864. |
[28] | Perozzi B. , Alrfou R. and Skiena S. , Deepwalk: Online Learning of Social Representations, Proceedings of the 20th ACM SIGKDD International Conference on Knowledge Discovery and Data Mining, 2014, 701–710. |
[29] | Severiens S. and Ten Dam G. , Gender differences in learning styles:A narrative review and quantitative meta-analysis, Higher Education 27: (4) ((1994) ), 487–501. |
[30] | Korlat S. , Kollmayer M. , Holzer J , Lüftenegger M. , Pelikan E. , Schober B. and Spiel C. , Gender differences in digital learningduring COVID-19: Competence beliefs, intrinsic value, learningengagement, and perceived teacher support, Frontiers inPsychology 12: ((2021) ), Article ID:637776. |
[31] | Yan J. , Yin X. , Lin W. , Deng C. , Zha H. and Yang X. , A Short Surveyof Recent Advances in Graph Matching, Proceedings of the ACM onInternational Conference on Multimedia Retrieval, ((2016) ), 167–174. |


