
Model variational consumer preferences based on online reviews using sentiment analysis and PSO-based DENFIS approaches
Abstract
Previous studies developed consumer preference models mainly through customer surveys, ignoring the variability of consumer preferences over time. In addition, it is difficult to obtain time series data based on the customer surveys. In recent years, some previous studies tried to analyse consumer preferences based on online reviews. However, they have not solved the problems of modelling variational consumer preference based on time series data with the consideration of the ambiguity of emotions expressed by customers in online reviews. To solve the above problems, this article proposes the particle swarm optimization (PSO) based dynamic evolving neural-fuzzy inference system (DENFIS) method to model variational consumer preferences based on online customer reviews. Using the time series data mined by the sentiment analysis method and the product attribute settings of the review products, the PSO-based DENFIS method is offered to dynamically model consumer preferences, in which PSO is used to adjust DENFIS parameters adaptively.
1Introduction
With the increasing improvement of business, consumers’ need-oriented product design becomes increasingly critical. For supporting the design, lots of methods and processes have been developed. Questionnaire is the method most companies apply to understand their users. However, consumer preferences change over time. If the survey is still used to obtain consumer preferences, not only the investment cost will be huge, but the lag of the time by using the questionnaire will still affect the prediction of consumer preferences. Therefore, to better study consumer preferences, their time series data should be collected. However, collecting these data is very difficult, especially for the interview surveys. The company and researchers must conduct many surveys in different periods, which consume lots of survey time and resources. Consequently, previous research and industrial practice have similar problems, that is, time-series data of consumer preference for product design are unavailable for consumer preferences modelling.
Nowadays, the company can easily find customer reviews about products on e-commerce sites. Customers share their buying experience and product experience through comments, which can significantly affect potential customers to purchase products. Therefore, companies can extract consumers’ opinions on products through these online products comments and obtain the valuable sources of information for product development. In addition, time-series data can be efficiently collected from online reviews with very little expenditure.
Recently, there has been much research on data and information mining that support product design. Some studies focus on obtaining customer needs and consumer preferences through online customer reviews. Other studies employ rule mining to study the relationships between product attributes and consumer preferences. However, there are some limitations in previous studies. First, the modelling process is very complicated as the relationships in the model may be highly nonlinear and fuzzy. Second, the developed relationship based on the rule-mining is usually not enough to determine the new product attribute settings. Third, there is no research on modelling the relationship between consumer preferences and product attributes based on the time-series data from online reviews.
To solve these problems, this article proposes a particle swarm optimization (PSO)-based dynamic evolving neural-fuzzy inference system (DENFIS) method to model variational consumer preferences based on the online customer reviews. The proposed method first collects online reviews of selected products at different periods and uses opinion mining to calculate the sentiment scores of customer preferences. Secondly, PSO-based DENFIS method is used to model the relationship between the sentiment scores of consumer preferences and the settings of product attributes. The model developed by this method can help determine the optimal product attributes of a new product. DENFIS is an ecological model [1] which can effectively and adaptively learn complex time series and is superior to adaptive neuro-fuzzy inference system (ANFIS), multilayer perceptions and evolved self-organizing maps, in time series prediction. However, the complexity of the parameters of DENFIS may cause a local minimum and affect the modelling accuracy. To overcome the deficiency and further enhance the modelling accuracy of DENFIS, in this article, PSO is applied in DENFIS to determine the optimal parameters.
The structure of this article is as follows: Section 2 introduces the related works. The proposed method of modelling variational consumer preferences through online customer reviews is presented in Section 3. The proposed methodology is implemented in the case study of the sweeping robots, which is described in Section 4. Section 5 acquaints the verification tests of the dynamic modelling. At the end of the article, the conclusions are presented.
2Related works
Sentiment analysis is a research field that extracts people’s views and emotions from the written language, also known as opinion mining. It can analyse customers’ sentiments and reveal customers’ preferences for various product functions [2]. Therefore, many sentiment analysis research work has been carried out. Recently, affective computing and sentiment analysis was emerged which leverage human-computer interaction, information retrieval, and multimodal signal processing for mining sentiments from the online social data [3]. Cambria et al. [4] applied the top-down and bottom-up learning via an ensemble of symbolic and subsymbolic AI tools to detect the polarity in text. Stappen et al. [5] used the SenticNet to extract the natural language concepts from the video transcriptions. Mowlaei et al. [6] employed the statistical methods and genetic algorithm to enhance the performance of sentiment analysis lexicon generation. To alleviate the limitations of the traditional context-based word embedding technique, Song et al. [7] introduced a sentiment lexicon embedding method to increase the sentiment classification performance. Li et al. [8] proposed a new perspective for neural tensor networks on conversational sentiment analysis. Kumar et al. [9] introduced a convolutional stacked bidirectional long short-term memory with a multiplicative attention mechanism for aspect category and sentiment polarity detection. To handle the issue of neutrality in sentiment analysis, Valdivia et al. [10] proposed consensus vote models for detecting and filtering neutrality to improve sentiment classification in sentiment analysis. A multi-level fine-scaled sentiment sensing with ambivalence handling was presented to reveal the multi-level fine-scaled sentiments as well as the different types of emotions [11]. In recent years, deep learning techniques have gained attention in sentiment analysis. Rezaeinia et al. [12] proposed an improved word vector (IWV) for the sentiment analysis to enhance the precision of the pretrained word embedding. They tested the method through the diverse deep learning models and the benchmark sentiment datasets. A deep learning literature for aspect-based sentiment analysis was carried out by Do et al [13].
Many methods have been discovered by employing opinion mining to obtain consumer preferences from the online reviews. Chen et al. [14] introduced an ontology-learning customer needs representation system to generate more accurate consumer preference statements. Zhou et al. [15] proposed an opinion mining method using a hybrid combination of sentiment dictionary and rough set technology to mine customer information about their preferences of products from online reviews to enhance the feature model. Zhang et al. [16] offered a sentiment analysis extraction algorithm that uses fuzzy logic to identify features, opinion expressions, and feature opinions jointly. Zhou et al. [17] applied a two-layer model that combines sentiment analysis and use-case-oriented analogy reasoning to obtain the potential customer needs. A case-based method was proposed by Chiu and Lin [18], which uses an integrated method of text mining and perceptual engineering to extract consumer preferences from the online customer reviews. Kang and Zhou [19] proposed a method based on the Rube unsupervised rules to obtain both subjective and objective features from online consumer comments.
By using various modelling methods, a consumer preference model is established to link product attributes with consumer preferences, which can predict consumer preferences for new products and formulate optimization models to maximize the overall consumer preferences. However, the relationship between product attributes and consumer preferences is very complicated and non-linear. So far, no theoretical model that can simulate the complex relationship has been developed [14]. Therefore, the empirical methods are always used to simulate consumer preferences in the academic field. You et al. [20] and Nagamachi [21] applied statistical linear regression and partial least squares analysis to simulate consumer preferences. Chen et al. [22] proposed the artificial neural networks to simulate the relationship between design attributes and consumer preferences. Yang et al. [23] introduced a method using the belief rules to determine design attributes by simulating consumer preferences. Nevertheless, the methods mentioned above cannot solve the modelling fuzziness from the consumers’ subjective judgments. According to the mentioned problem, quite a few fuzzy methods have been adopted, including fuzzy linear regression [24], fuzzy regression based on non-linear programming [25], fuzzy rule-based systems [26], and fuzzy inference methods [27]. In addition, some fuzzy regression based polynomial modelling methods have also been proposed, such as fuzzy regression based on forwarding selection [28], fuzzy regression based on the chaos optimization [29], stepwise-based fuzzy regression [30], and fuzzy based on genetic programming [31]. However, previous studies disregarded the variability of consumer preferences and only used the survey data for a fixed period of time to model consumer preferences. The prediction of the dynamic consumer preferences is undoubtedly significant for product development. Therefore, time-series data based on online customer reviews should be employed in modelling consumer preferences.
Prior to this, there have been a few studies using survey data to predict the future consumer preferences, such as a grey theoretical model developed by Wu et al. [32], a method based on artificial immune and neural system developed by Chong and Chen [33], and an artificial immune system based support vector machine method introduced by Huang et al. [34]. However, limited research has been found on the future consumer preferences forecasting by using online comments. A fuzzy time series method based on online customer reviews was developed by Jiang et al. [35]. To associate consumer preferences and product attributes, Jiang et al. [36] introduced the association rules which are generated from a multi-objective PSO method, while Chung and Tseng [37] proposed the If-Then rules developed from a rule induction framework. However, the generated rules are not enough to determine the optimal settings of product attributes for the new product design. To solve this issue, Jiang et al. [38] proposed the DENFIS for dynamic modelling of customer preferences for product design, but the effectiveness of the proposed method is limited by the parameter settings.
3Proposed methodology
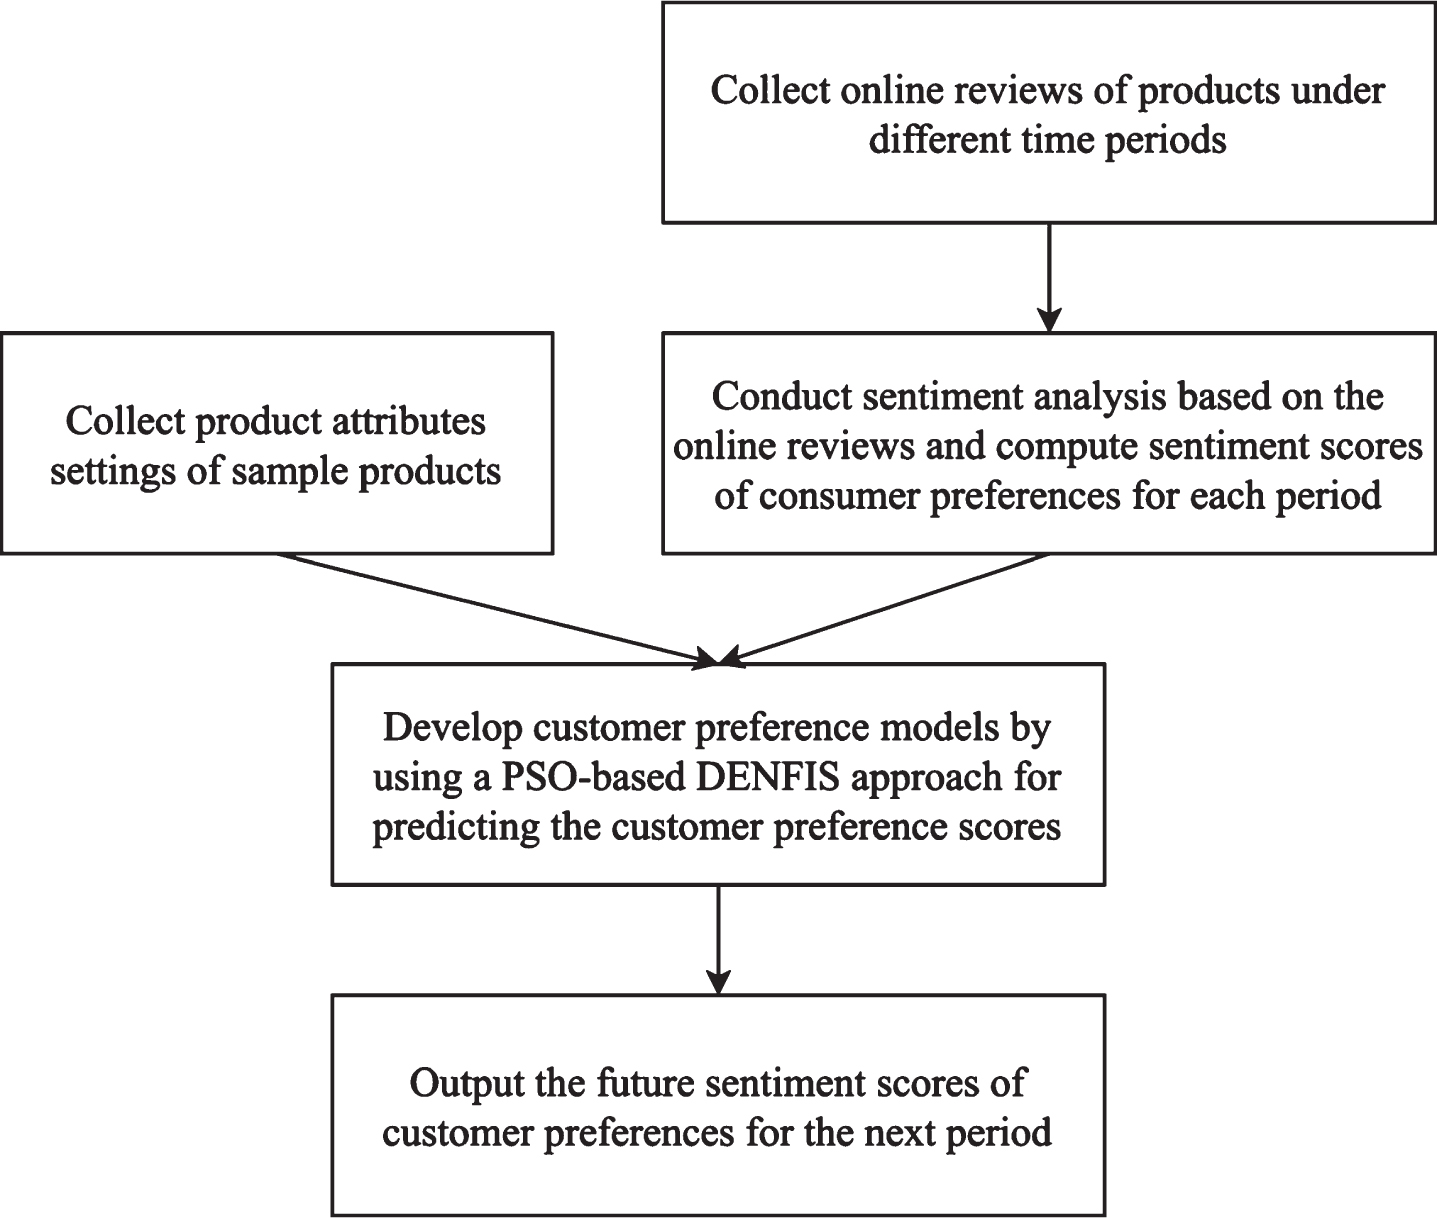
After reviewing the relevant research, many original research on the relationships between consumer preferences and product attributes based on the online reviews were found. However, most studies fail to consider the changes in consumers preferences over time. Based on the time series online reviews, this article supports a consumer-initiated model based on the online reviews. The specific process of the proposed method is illustrated in Fig. 1.
Fig. 1
Proposed methodology.
3.1Sentiment analysis from online customer reviews
First of all, the sample products are determined. The web crawlers are used to obtain consumer reviews of the sampled products on the e-commerce platform. Then the online comments are divided into the different periods and put into the separated Excel files. Then the sentiment analysis is used to obtain the dimensions of consumer preferences and calculate the corresponding sentiment scores.
The six steps of the sentiment analysis are described as follows. First, the preprocessing on the unstructured text is conducted, including eliminating stop-words and non-alphanumeric symbols, and changing letters into lowercase. Second, the words are labelled according to their different parts of speech. In our research, the general nouns refer to the consumers’ preferences, while the adverbs and adjectives are the corresponding emotional expressions. Third, the emotional words of consumer preferences are extracted from the online reviews. Fourth, feature pruning is used to remove the errors and the redundant attributes. Fifth, the K-means clustering method is employed to group the phrase into the different categories according to the phrases’ meaning. For example, the terms “good cleaner”, “high performance”, and “useful” are all categorized as “clean well. Finally, SentiWordNet gives the emotional scores that reflect consumer preferences for the different settings of product attributes. SentiWordNet is an opinion dictionary derived from the WordNet database, in which each synset is represented by several positive, neutral, and negative sentiment information. In this study, Semantria, a well-known text analysis software tool, is used for the sentiment analysis based on the online comments. It provides text analysis through Excel plug-in, extracts emotions based on positive, neutral, and negative dimensions, and calculates the corresponding emotional scores.
3.2PSO-based DENFIS method
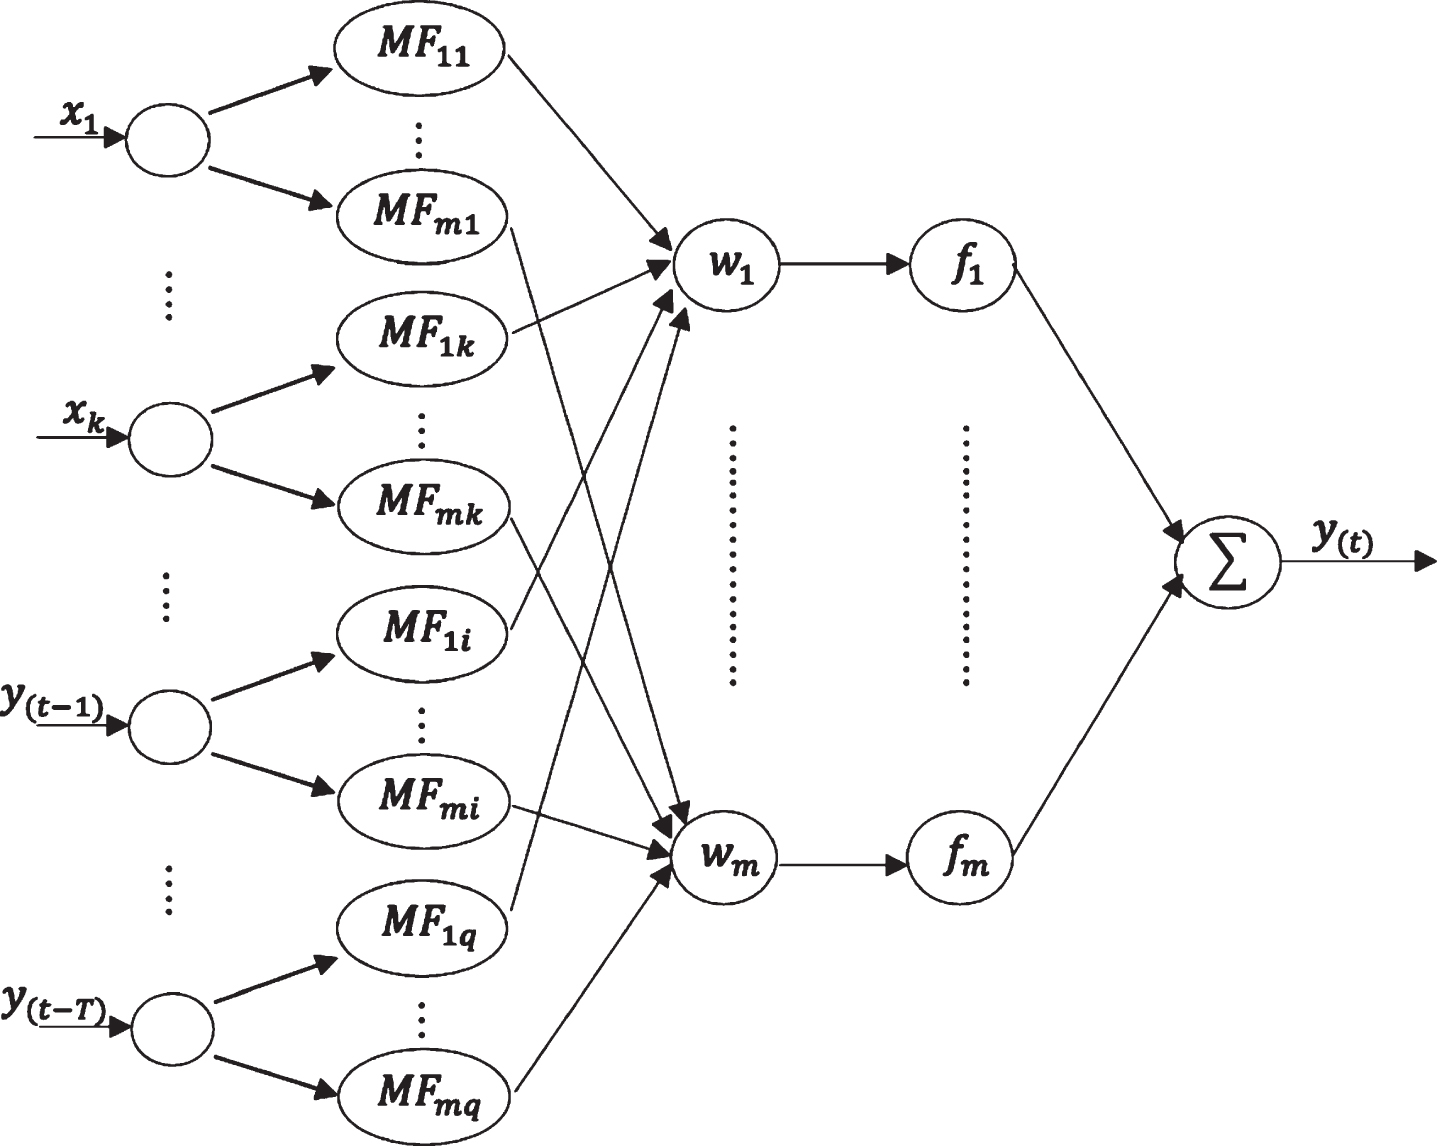
To predict the future consumer preference scores, a PSO-based DENFIS method is proposed for modelling dynamic consumer preferences. Taking the obtained consumer preferences scores and the product attributes as inputs, the evolutionary clustering method (ECM) is employed in DENFIS to divide the inputs into clusters. And the antecedents of new fuzzy rules are formed by using the cluster centres. Based on the weighted recursive least squares estimation method, a first-order linear model is developed for each fuzzy rule. Moreover, PSO algorithm is used to determine the optimal parameters of DENFIS to improve the accuracy of modelling. Based on PSO-based DENFIS method, a dynamic consumer preference model is generated. An architecture of a DENFIS is shown in the Fig. 2, where x1 ∼ xk represent k product attributes; y(t-1) ∼ y(t-T) describe the values of consumer preferences scores in the past periods t - 1 ∼ t - T respectively, while y(t) is the corresponding predicted value of the consumer preference score in the future period t.
Fig. 2
Architecture of DENFIS.
3.2.1Evolving clustering method (ECM)
As a clustering method, ECM dynamically estimates the number of clusters and their corresponding centres on the input data. In the process of clustering, the input data set is firstly divided into different clusters based on their centre and radius. For each input data Zi, i = 2, 3, ⋯ , n, is presented, where n denotes the number of data sets. For the first cluster, C1, its centre, Cc1, and radius, Ru1, are firstly initialized as the first data set and zero, respectively. To determine the number of clusters and limit the new cluster radius, a threshold value, Dthr, is presented. The Euclidean distance is applied to determine the distances, Dij, by (1) from Zi to the existing clusters, Cj, j = 1, 2, ⋯ , m.
(1)
(2)
(3)
(4)
Ca is the cluster with Via, while its cluster centre and radius are determined as Cca and Rua, respectively. The distance between Zi and Ca is denoted as Dia. The cluster Ca is updated if Via ≤ 2 × Dthr. Its radius Rua is replaced as
3.2.2Learning process in DENFIS model
The inputs of DENFIS have two parts, one part is the product attributes of the sampled products, x1 ∼ xk, and another part is the consumer preference score y(t-1) ∼ y(t-T). The ith input of the model is represented as xi, i = 1, 2, ⋯ , q, where the inputs number is q, q = k + T. When i is in different ranges, xi represents the diverse input. It is equal to x1 ∼ xk and y(t-1) ∼ y(t-T), when i = 1, 2, ⋯ , k, and i = k + 1, ⋯ , q, respectively. Using the clusters of the input, a set of fuzzy rules can be generated as follows:
(5)
For the jth cluster, the centre, left and right value are represented as bj,aj and cj, respectively; where aj = bj - d × Dthr and cj = bj + d × Dthr, 1.2 ≤ d ≤ 2.
For the consequent parts of the fuzzy rules, the first-order Sugeno fuzzy models are employed and the linear function of the consequences is developed by the linear least-squares estimation method (LSE). Each of the linear models can be expressed as follows:
(6)
The data sets with n data pairs,
(7)
(8)
(9)
(10)
When entering a new data set, the initialized P and β are updated. At the (l + 1) th iteration, the inverse matrix P(l+1) and coefficients β(l+1) are updated respectively as follows.
(11)
(12)
The (l + 1) th row vector of matrix A is represented as
Based on the above learning process, the lth predicted output of DENFIS is calculated which is the weighted average of each rule’s output.
(13)
(14)
3.2.3Determination of parameters for DENFIS using PSO
PSO is a popular optimization method, simulating the social behaviour of a bird flock. The task of the PSO is to obtain the global optimal solution which can help us to determine the parameters for DENFIS. In PSO, every potential optimization solution can be regarded as the “particle” in a D-dimensional search space. Particles have only two attributes which are speed and position. Speed describes the speed of movement to the potential best position, and position means the location in the movement. PSO is performed based on a group of randomly initialized particles. All particles in the particle swarm update their speed and position based on the current best position, pbest, and the current global best position, gbest, shared by the entire particle swarm using the following formulas.
(15)
(16)
To determine the best position, the mean relative error (MRE) and the variance of error (VoE) are adopted as shown in (17) and (18), respectively. In this article, the sum of MRE and VoE is used as the fitness value of the particle. The position of the particle corresponding to the minimum sum value is the best position.
(17)
(18)
3.3Computational procedures
Based on online customer reviews, the processes of dynamic modelling consumer preference for product development are described as follows:
Step 1: Online customer reviews of the sampled products are collected from e-commerce shopping websites within four pre-defined time periods and are stored in different Excel files after data preprocessing. Semantria, as the sentiment analysis method introduced in Section 3.1, is then applied for each Excel files to obtain the sentiment scores of consumer preferences. Taking the obtained consumer preferences scores and the product attributes as inputs, the data sets for modelling variational consumer preferences for product development are generated.
Step 2: The PSO algorithm is used to optimize the parameters, Dthr and λ, in the DENFIS method. Firstly, the particle swarm is initialized, including the number of iterations, swarm size, search space dimension, search range, and learning factors. The speed and position of each particle are initialized randomly. And the iteration starts.
Step 3: In the first iteration, the initial position of every particle is used as the initial individual best position pbest, and the position vector of each particle is used as the parameters of DENFIS in sequence, including Dthr and λ. The initialization for the first cluster C1 is conducted as described in Section 3.2.1. The initial inverse matrix P and regression coefficients β are obtained using (7) and (8), respectively. The clusters of the input are updated using ECM according to the process described in Section 3.2.1. Based on the clusters, the membership function μj (xi) is generated using (5) and the weight of each fuzzy rule is calculated using (14). The linear model is developed based on (6). Based on the weight of each fuzzy rule and the linear model, the predicted output
Step 4: The iteration is continued by k + 1 → k. In each iteration, the speed vector
Step 5: The iteration stops once the predefined number of iterations is reached. By selecting the smallest value in pbest, the global best fitness value gbest is updated. The values of gbest are the identified optimal settings for Dthr and λ in DENFIS model.
Step 6: Based on the above parameters, the models for variational consumer preferences are generated, and the future emotional scores of consumer preferences can be predicted.
4Implementation
Nowadays, when online shopping is prevalent, numerous online customer comments can be easily collected. By using the sentiment analysis, the emotional scores of consumer preferences can be obtained. However, for consumer preferences forecasting and product development, these sentiment analysis results are not enough. In this section, PSO-based DENFIS approach is introduced to model the variational customer preferences in a case study of sweeping robots.
To develop a new sweeping robot, 10 competitive sweeping robots have been identified as references, denoted by A ∼ J. Online customer reviews of competitive sweeping robots were collected on Amazon.com using 4 fixed time period strategies. The Semantria Excel plug-in was used to perform sentiment analysis on the collected online comments stored in an Excel file. Firstly, words or phrases, which are excavated from online comments are grouped based on the synonyms, and the relevance to the consumer preferences. For example, the excavated phrases “good cleaner”, “high performance”, and “useful” were grouped as a category of “clean well”, which is one of the consumer preferences of the sweeping robots. In this case, there are four common consumer preferences summarized, which are quality, smart operation, clean well and working sound. Using Semantria’s user category analysis, keywords and phrases which are relevant to the consumer preferences are set as the “user category”. Sentiment analysis was then repeated based on each time period to obtain emotional scores of consumer preferences.
In this article, consumer preference “clean well” is used as an example to illustrate the proposed method. There are four product attributes related to the consumer preference “clean well”, which are volume, max suction power, dust box capacity, and wet mopping, and are denoted as x1, x2, x3 and x4, respectively. The units of x1, x2 and x3 are cubic inch, pascal (Pa) and litre (L), respectively. For x4, 1 denotes that the sweeping robot has the function of wet mopping while 0 means it cannot provide this function. The product attributes settings of the 10 sampled products were collected and are shown in Table 1.
Table 1
The setting of product attributes of ten products
| Product | Product attributes | |||
| Volume | Max suction power (Pa) | Dust box capacity (L) | Wet mopping | |
| A | 438.178 | 1400 | 0.5 | 1 |
| B | 490.100 | 1800 | 0.6 | 0 |
| C | 417.720 | 850 | 0.3 | 1 |
| D | 515.573 | 2000 | 0.75 | 0 |
| E | 417.720 | 1000 | 0.3 | 0 |
| F | 442.368 | 1400 | 0.3 | 0 |
| G | 642.105 | 1800 | 0.5 | 0 |
| H | 645.979 | 1800 | 0.4 | 0 |
| I | 643.500 | 2000 | 0.7 | 0 |
| J | 466.215 | 1500 | 0.6 | 0 |
In this case study, four product attributes, x1 ∼ x4, and consumer preference scores of the three past periods, periods 1-3, which are expressed respectively as y(t-3), y(t-2), and y(t-1), are used for developing PSO-based DENFIS models to predict the consumer preference score of the “clean well” in Period 4, y(t). The sentiment scores of 10 products under 4 periods are shown in Table 2.
Table 2
The sentiment scores of ten products under 4 periods
| Product | Clean well | |||
| Period 1 | Period 2 | Period 3 | Period 4 | |
| A | 0.36 | 0.43 | 0.47 | 0.40 |
| B | 0.37 | 0.29 | 0.35 | 0.20 |
| C | 0.28 | 0.32 | 0.44 | 0.24 |
| D | 0.32 | 0.33 | 0.38 | 0.24 |
| E | 0.33 | 0.33 | 0.33 | 0.30 |
| F | 0.43 | 0.40 | 0.41 | 0.39 |
| G | 0.33 | 0.31 | 0.27 | 0.30 |
| H | 0.33 | 0.32 | 0.37 | 0.31 |
| I | 0.30 | 0.31 | 0.30 | 0.30 |
| J | 0.32 | 0.32 | 0.37 | 0.28 |
For the PSO-based DENFIS approach, eight parameters including λ and Dthr 1 ∼ Dthr 7 need to be determined based on the PSO. λ is a forgetting factor with 0 < λ ≤ 1, while Dthr i, i = 1, 2, ⋯ , 7, represent the threshold values of seven DENFIS inputs, respectively. In the proposed approach, the parameter d was set as 1.2, which is a common setting used in previous studies. To initialize the particle swarm, we set the number of the particles as 100, initial value of the fitness as nan, the optimal fitness value threshold as 0.00000000001, and number of the iterations as 1000.
Using the products C ∼ J as the training sets for an example, based on their product attributes, the matrix A, and Y in (8) can be obtained as shown below.
To improve the training performance of DENFIS, the values of x1, x2 and x3 in columns 2, 3 and 4 of the matrix A are normalized. Columns 6-8 of the matrix are the values of x5, x6 and x7, which are also the values of the consumer preference scores of Periods 1–3, respectively. In the vector Y, the values of y1 ∼ y8 represent the consumer preference scores of the products C ∼ J in Period 4. Suppose the data set of product G belongs to the kth cluster and its centre is [0.24, 0.16, 0.53, 0.50, 0.33, 0.36, 0.40]. W1 of [W] shown in (7) and (8) can be calculated by using (9).
Fuzzy rules of products C ∼ J are obtained as follows.
Fuzzy rule 1:
Fuzzy rule 2:
Fuzzy rule 3:
Fuzzy rule 4:
Fuzzy rule 5:
Fuzzy rule 6:
Fuzzy rule 7:
Fuzzy rule 8:
Table 3
The validation results based on the five approaches
| Validation test | Validation data sets | SC-ANFIS | FCM-ANFIS | K-means-ANFIS | DENFIS | PSO-based DENFIS (proposed approach) | |
| 1 | MRE | A, B | 0.3855 | 0.3843 | 0.3854 | 0.3648 | 0.2800 |
| VoE | 0.0434 | 0.0443 | 0.0442 | 0.0150 | 0.0032 | ||
| 2 | MRE | C, D | 0.4456 | 0.4429 | 0.4430 | 0.4070 | 0.4070 |
| VoE | 0.0152 | 0.0151 | 0.0151 | 0.0142 | 0.0142 | ||
| 3 | MRE | E, F | 0.3717 | 0.3685 | 0.3693 | 0.2957 | 0.0870 |
| VoE | 0.0024 | 0.0024 | 0.0025 | 0.0032 | 0.0001 | ||
| 4 | MRE | G, H | 0.1131 | 0.1110 | 0.1110 | 0.0371 | 0.0188 |
| VoE | 0.0004 | 0.0004 | 0.0004 | 0.0004 | 0.0001 | ||
| 5 | MRE | I, J | 0.0407 | 0.0364 | 0.0373 | 0.0313 | 0.0313 |
| VoE | 0.0017 | 0.0017 | 0.0018 | 0.0005 | 0.0005 | ||
5Validation
To evaluate the effectiveness of the PSO-based DENFIS method in modelling variational consumer preferences, five validation tests were conducted, which selected the data sets of products A and B, C and D, E and F, G and H, as well as I and J as the verification test data, respectively. The training data sets in each verification test use the remaining data sets. And there are no duplicate data sets in the verification test. In this article, the MRE and the VoE were adopted as the prediction errors to evaluate the effectiveness of the proposed method. The values of MRE and VoE obtained by the PSO-based DENFIS approach were compared with those obtained by DENFIS, ANFIS, subtractive cluster-based ANFIS (SC-ANFIS), fuzzy c-means-based ANFIS (FCM-ANFIS), and K-means-based ANFIS. In SC-ANFIS, FCM-ANFIS and K-means-based ANFIS, the SC, FCM and K-means methods are combined into ANFIS to decide the membership function of ANFIS respectively. In SC, under the assumption that the potential cluster centre can be any data point, the centre of the cluster is determined according to the density measurement. The FCM method proposes to divide the data set into fuzzy clusters through the minimization of the cost function. Therefore, a given data point can belong to multiple clusters with a certain degree of membership. K-means groups the data set into K clusters by minimizing the value of the objective function. It alternates between assigning each data point to the cluster with the nearest average and updating the cluster centre until the value of the objective function does not improve further.
In each verification, the same data sets were used in the modelling of variational consumer preferences based on PSO-based DENFIS, DENFIS, ANFIS, SC-ANFIS, FCM-ANFIS, and K-means-based ANFIS. Nevertheless, because many inputs are involved in the training, the ANFIS training process was failed with “out of memory” errors, and the ANFIS model cannot be developed. In the proposed approach, based on the PSO, Dthr and λ values settings were determined, which lead to the smallest sum of MRE and VoE. In DENFIS, for the validation tests 1–5, the values of Dthr 1 were set as 0.5, 0.03, 0.41, 0.04, 0.5; Dthr 2 were set as 0.1, 0.03, 0.88, 0.04, 0.3; Dthr 3 were set as 0.6, 0.6, 0, 0.2, 0.2; Dthr 4 were set as 0.4, 0.9, 0.56, 0.2, 0.7; Dthr 5 were set as 0.7, 0.02, 0.73, 0.09, 0.8; Dthr 6 were set as 0.6, 0.16, 0.94, 0.6, 0.7 and Dthr 7 were set as 0.4, 0.4, 0, 0.8, 0.4. The values of λ were set as 0.4, 0.88, 0.42, 0.35 and 1 in the validation tests 1 ∼ 5, respectively. The number of clusters is usually less than or equal to
Based on the generated models, the predicted emotional scores of consumer preference of the fourth period for products A to J can be obtained. The MRE and VoE of the five validation tests based on the five methods are shown in Table 3. It can be seen from the tables that the MRE and VoE based on the proposed approach are all smaller than those based on the other four approaches. With the predicted consumer preference scores of the competitive products, the great reference value can be provided for the company in the product development. On the other hand, by using the developed PSO-based DENFIS models, the appropriate product attribute settings of the sweeping robot can also be determined based on the optimization algorithms.
6Conclusion
Nowadays, the development of new products to meet consumer preferences has become an important issue that enterprises need to solve. Therefore, modelling the relationship between the product design attributes and consumer preferences is crucial. In previous studies and industries, customer survey data are applied to analyse consumer preferences and develop consumer preference models. Nevertheless, it is difficult for customer surveys to obtain the time series survey data that reflect the dynamic changes of consumer preferences under different time periods. Unlike the traditional survey data, online reviews are written by consumers on the e-commerce platform after completing the purchase of the product. It contains the consumer’s evaluation of the product, which can be easily obtained and used in some research to develop the consumer preference models. However, previous research failed to resolve the ambiguity existing in the customer emotional expressions in the online reviews. To resolve the limitations mentioned above, a DENFIS method for dynamic modelling of consumer preferences based on the online customer reviews has been proposed in previous study. Nevertheless, the parameters setting in DENFIS method is complex and it is difficult to determine, which affects the accuracy of the modelling. This article proposes a PSO-based DENFIS method, in which PSO can determine the optimal parameters setting for the DENFIS method. At the same time, the accuracy of the model is improved based on the proposed method. To illustrate the proposed method, a case study of sweeping robot products used for modelling variational consumer preferences was carried out based on the online comments. In order to evaluate the effectiveness of the PSO-based DENFIS method, the prediction results obtained based on the PSO-based DENFIS method were compared with those obtained by DENFIS, ANFIS, SC-ANFIS, FCM-ANFIS, and K-means-based ANFIS. The forecasted results are compared. The comparison results show that the PSO-based DENFIS method is superior to the other five methods in terms of the MRE and the VoE. However, some limitations still exist in the paper. In the sentiment analysis, the problems of neutrality and ambivalence are not considered,which may affect the sentiment scores of the customer preferences. The filtering of neutrality and the handling of ambivalence will be conducted in the future work to enhance the accuracy of the results of the sentiment analysis. In the proposed PSO-based DENFIS approach, to determine the parameters in the PSO such as the size of particle swarm and the number of iterations, different trials with different parameters settings were conducted, which has long time-consuming. The determination of the parameters of the PSO adaptively can be considered to obtain the optimal settings. In order to further evaluate the effectiveness of the proposed method in dynamic modelling of customer preferences, future research work will involve studying various issues, such as determining the minimum and the optimal number of time periods, adopting Gaussian membership functions, and incorporating the backpropagation algorithm into the learning algorithm of the DENFIS approach.
Acknowledgment
This work was supported by the National Natural Science Foundation of China [grant number 71901149].
References
[1] | Kasabov N.K. and Song Q. , Denfis: dynamic evolving neural-fuzzyinference system and its application for timeseries prediction, IEEE Transactions on Fuzzy Systems 10: (2) ((2002) ), 144–154. |
[2] | Cambria E. , Das D. , Bandyopadhyay S. and Feraco A. , Affective computing and sentiment analysis, In A practical guide to sentiment analysis, pages 1–10, Springer, 2017. |
[3] | Cambria E. , Affective computing and sentiment analysis, IEEEIntelligent Systems 31: (2) ((2016) ), 102–107. |
[4] | Cambria E. , Li Y. , Xing F.Z. , Poria S. and Kwok K. , Senticnet 6: Ensemble application of symbolic and subsymbolic ai for sentiment analysis, In Proceedings of the 29th ACM international conference on information & knowledge management, pages 105–114, 2020. |
[5] | Stappen L. , Baird A. , Cambria E. and Schuller B.W. , Sentimentanalysis and topic recognition in video transcriptions, IEEEIntelligent Systems 36: (2) ((2021) ), 88–95. |
[6] | Mowlaei M.E. , Abadeh M.S. and Keshavarz H. , Aspect-based sentimentanalysis using adaptive aspect-based lexicons, Expert Systemswith Applications 148: ((2020) ), 113234. |
[7] | Song M. , Park H. and Shin K.-S. , Attention-based long short-termmemory network using sentiment lexicon embedding for aspect-levelsentiment analysis in korean,&, Management 56: (3) ((2019) ), 637–653. |
[8] | Li W. , Zhu L. and Cambria E. , Taylor’s theorem: A new perspectivefor neural tensor networks, Knowledge-Based Systems 228: ((2021) ), 107258. |
[9] | Ashok Kumar J. , Trueman T.E. and Cambria E. , A convolutional stackedbidirectional lstm with a multiplicative attention mechanism foraspect category and sentiment detection, CognitiveComputation 13: ((2021) ), 1423–1432. |
[10] | Valdivia A. , Luzon M.V. , Cambria E. and Herrera F. , Consensus votemodels for detecting and filtering neutrality in sentiment analysis, Information Fusion 44: ((2018) ), 126–135. |
[11] | Wang Z. , Ho S.-B. and Cambria E. , Multi-level fine-scaled sentimentsensing with ambivalence handling, International Journal ofUncertainty, Fuzziness and Knowledge- Based Systems 28: (04) ((2020) ), 683–697. |
[12] | Rezaeinia S.M. , Rahmani R. , Ghodsi A. and Veisi H. , Sentimentanalysis based on improved pre-trained word embeddings, ExpertSystems with Applications 117: ((2019) ), 139–147. |
[13] | Do H.H. , Prasad P.W.C. , Maag A. and Alsadoon A. , Deep learning foraspect-based sentiment analysis: a comparative review, ExpertSystems with Applications 118: ((2019) ), 272–299. |
[14] | Chen X. , Chen C.-H. , Leong K.F. and Jiang X. , An ontology learningsystem for customer needs representation in product development, The International Journal of Advanced ManufacturingTechnology 67: (1) ((2013) ), 441–453. |
[15] | Zhou F. , Jiao J.R. , Yang X.J. and Lei B. , Augmenting feature modelthrough customer preference mining by hybrid sentiment analysis, Expert Systems with Applications 89: ((2017) ), 306–317. |
[16] | Zhang H. , Sekhari A. , Ouzrout Y. and Bouras A. , Jointly identifyingopinion mining elements and fuzzy measurement of opinion intensityto analyze product features, Engineering Applications ofArtificial Intelligence 47: ((2016) ), 122–139. |
[17] | Zhou F. , Jiao R.J. and Linsey J.S. , Latent customer needselicitation by use case analogical reasoning from sentiment analysisof online product reviews, Journal of Mechanical Design 137: (7) ((2015) ), 071401. |
[18] | Chiu M.-C. and Lin K.-Z. , Utilizing text mining and kanseiengineering to support data-driven design automation at conceptualdesign stage, Advanced Engineering Informatics 38: (2018), 826–839. |
[19] | Kang Y. and Zhou L. , Rube: Rule-based methods for extracting productfeatures from online consumer reviews,&, Management 54: (2) ((2017) ), 166–176. |
[20] | You H. , Ryu T. , Oh K. , Yun M.-H. and Kim K.-J. , Development ofcustomer satisfaction models for automotive interior materials, International Journal of Industrial Ergonomics 36: (4) ((2006) ), 323–330. |
[21] | Nagamachi M. , Perspectives and the new trend of kansei/affective engineering, The TQM Journal, 2008. |
[22] | Chen C.-H. , Khoo L.P. and Yan W. , An investigation into affectivedesign using sorting technique and kohonen self-organising map, Advances in Engineering Software 37: (5) ((2006) ), 334–349. |
[23] | Yang J.-B. , Wang Y.-M. , Xu D.-L. , Chin K.-S. and Chatton L. , Beliefrule-based methodology for mapping consumer preferences and settingproduct targets, Expert Systems with Applications 39: (5) ((2012) ), 4749–4759. |
[24] | Gizem S. , Koksal G. , Batmaz I. and Bayrak O.T. , Classificationmodels based on tanaka’s fuzzy linear regression approach: The caseof customer satisfaction modeling,&, Fuzzy Systems 21: (5) ((2010) ), 341–351. |
[25] | Chen Y. and Chen L. , A non-linear possibilistic regression approachto model functional relationships in product planning, TheInternational Journal of Advanced Manufacturing Technology 28: (11-12) ((2006) ), 1175–1181. |
[26] | Park J. and Han S.H. , A fuzzy rule-based approach to modelingaffective user satisfaction towards office chair design, International Journal of Industrial Ergonomics 34: (1) ((2004) ), 31–47. |
[27] | Fung R.Y.K. , Law D.S.T. and Ip W.H. , Design targets determination for inter-dependent product attributes in qfd using fuzzy inference, Integrated Manufacturing Systems, 1999. |
[28] | Chan K.Y. and Ling S.H. , A forward selection based fuzzy regressionfor new product development thatcorrelates engineering characteristics with consumerpreferences,&, Fuzzy Systems 30: (3) ((2016) ), 1869–1880. |
[29] | Jiang H. , Kwong C.K. , Ip W.H. and Chen Z. , Chaos-based fuzzyregression approach to modeling customer satisfaction for productdesign, IEEE Transactions on Fuzzy Systems 21: (5) ((2013) ), 926–936. |
[30] | Chan K.Y. , Lam H.K. , Dillon T.S. and Ling S.H. , A stepwise-basedfuzzy regression procedure for developing customer preference modelsin new product development, IEEE Transactions on FuzzySystems 23: (5) ((2014) ), 1728–1745. |
[31] | Chan K.Y. , Kwong C.K. , Dillon T.S. and Fung K.Y. , An intelligentfuzzy regression approach for affective product design that capturesnonlinearity and fuzziness, Journal of Engineering Design 22: (8) ((2011) ), 523–542. |
[32] | Wu H.-H. , Liao A.Y.H. and Wang P.-C. , Using grey theory in qualityfunction deployment to analyse dynamic customer requirements, The International Journal of Advanced ManufacturingTechnology 25: (11) ((2005) ), 1241–1247. |
[33] | Chong Y.T. and Chen C.-H. , Management and forecast of dynamiccustomer needs: An artificial immune and neural system approach, Advanced Engineering Informatics 24: (1) ((2010) ), 96–106. |
[34] | Huang A.-H. , Pu H.-B. , Li W.-G. and Ye G.-Q. , Forecast of importance weights of customer requirements based on artificial immune system and least square support vector machine, In 2012 International Conference on Management Science & Engineering 19th Annual Conference Proceedings, pages 83–88, IEEE, 2012. |
[35] | Jiang H. , Kwong C.K. and Yung K.L. , Predicting future importance ofproduct features based on online customer reviews, Journal ofMechanical Design 139: (11) ((2017) ), 111413. |
[36] | Jiang H. , Kwong C.K. , Park W.Y. and Yu K.M. , A multi-objective psoapproach of mining association rules for affective design based ononline customer reviews, Journal of Engineering Design 29: (7) ((2018) ), 381–403. |
[37] | Chung W. and Bill Tseng T.-L. , Discovering business intelligencefrom online product reviews: A rule-induction framework, ExpertSystems with Applications 39: (15) ((2012) ), 11870–11879. |
[38] | Jiang H. , Kwong C.K. , Okudan Kremer G.E. and Park W.-Y. , Dynamicmodelling of customer preferences for product design using denfisand opinion mining, Advanced Engineering Informatics 42: ((2019) ), 100969. |
[39] | Bari A. and Rueda L. , A new profile alignment method for clustering gene expression data, In Conference of the Canadian Society for Computational Studies of Intelligence, pages 86–97. Springer, 2006. |


