
Three-dimensional audio parametric encoding based on perceptual characteristics of spatial cue1
Abstract
Three-dimensional sound effects require a considerable number of sound channels, causing audio-visual spatial orientation sense distortion under circumstances in which the code rate is restricted by the limitation of transmission channel bandwidth and storage capacity. As a result, existing 3D audio systems are incompatible with real-time broadcasting and home theatre applications, severely limiting the application and development of 3D audio systems. By investigating the mechanism of orientation parameters perceptual redundancy, this paper studied 3D spatial orientation cue perceptual characteristics, established an orientation cue perceptual model, developed a heterogeneous quantification table accordingly, and controlled the differences between each quantified value below the quantitative value perception threshold. Using this method, only the information perceptible to the human ear was quantified and perceptual distortions were minimized. The experimental results revealed that, compared to the SLQP method, the quantified bit of the proposed method was reduced by 8.66% in low resolution and 65.23% in high resolution. In addition, the accuracy of this method was higher than that of the SLQP method, enabling better alignment with human perceptual characteristics.
1Introduction
In order to achieve better 3D sound effects, the number of audio channels must be maximized. However, the addition of audio channels may bring challenges to 3D audio, including data surging. Due to the limitation of real-time broadcasting bandwidths and media storage capacity, the reconstruction quality of three-dimensional audio effects drops drastically. In conventional 3D audio coding technologies, the compression efficiency does not meet the requirement of 3D audio data storage and transmission despite the fact that lossless compression of 3D sound effects is done by lossless coding of each audio channel. Parametric coding of 3D audio involves signal redundancy, inner-channel perceptual redundancy, and spatial information redundancy between channels, thus achieving better compression efficiency. However, current 3D audio parametric coding focuses on extraction and uniform quantification of spatial orientation parameters. The quantification errors of orientation parameters are the same in each direction. In cases in which the code rate is restricted by transmission channel bandwidth and storage capacity, audio-visual position sense distortions of the 3D audio were observed. As a result, 3D audio systems are not applicable in real-time broadcasting or home theaters, and the application and development of 3D audio systems are somewhat limited.
3D audio systems require multiple channel signals collected by multiple microphones to record sound field information, and each channel is a monophonic signal recording of the sound field information. Monophonic audio signal compression coding research has a long history. In 1993, the human ear perceptual mechanism was introduced to coding and perceptual audio coding technology MPEG1-audio layer 3 (MP3) based on a psychoacoustic model was proposed to eliminate redundant inner-channel information. MP3 technology utilizes auditory masking effects and sub-band coding technology to maintain each sub-band quantification noise below the hearing threshold, thus achieving transparent quality with low bit rates [11]. Traditional monophonic audio compression coding technology achieves very high compression efficiency of perceptual transparency coding at 2 bit each sampling point by removing perceptual redundancies in combination with information redundancy removal techniques such as entropy coding. Compared to monophonic audio, stereo and 5.1 analog sound channels exhibited better reconstruction of horizontal sound orientation and scene information. Nevertheless, the direct application of traditional monophonic audio coding technology in stereo and 5.1 analog sound channel systems leads to the linear increase of encoding rates with the channel number. Therefore, intensive efforts have been made to remove redundant inter-channelinformation.
Johnston et al. proposed sum-difference stereo audio technology to increase coding efficiency and remove redundant inter-channel information by coding different signals with narrower dynamic ranges. However, the subjective quality of sum-difference stereo audio technology dropped drastically under low-middle code rates. Additionally, the coding efficiency can reduce in the presence of low inter-channel audio coherence[9].
Herre, et al. proposed Intensity Stereo (IS) coding technology based on the human ear’s sensitivity to high-frequency signal spectral envelope and insensitivity to spectrum details [10]. The spectrum energy with sub-band was used as the unit, while the left and right channels’ energy ratio parameters were extracted to a high-frequency band. During decoding, the right audio channel sub-band spectrum was reconstructed according to the left audio sub-band spectrum and energy ratio parameter. In this way, the code rate was reduced by 20% while maintaining the same audio quality. However, the IS method is only applicable in high-frequency bands as strong impacts on the stereophonic effects were observed in low-frequencybands.
Faller, et al. proposed an efficient method using binaural orientation parameters to express stereo audio signals. Multiple sound sources and signals (such as monaural signal) are used, together with spatial parameters, to remove inter-channel spatial information redundancy. The spatial parameters are binaural cues, ILD, and ITD, which are the most important perceptual cues for sound source orientation in the human ear. Based on that, Faller et al. proposed binaural cue coding (BCC) developed a basic frame of spatial audio coding. Their research also proposed using inter-channel level difference (ICLD), inter-channel time difference (ICTD), and inter-channel coherence (ICC) instead of ILD, ITD, and coherence cues. BCC requires a small amount of spatial parameter information (about 2 kbps) to achieve an improved reconstruction of spaciousness of stereo or multichannel signals. Subjective tests showed that with a stereo signal code rate in the range of 24–64 kbps, BCC obtained better coding quality than traditional coding methods [5].
ISO/MPEG proposed a method in which redundant inter-channel spatial information was removed by extracting spatial parameters and inter-channel predictive parameters. Spatial parameters are also quantified to further remove inter-channel spatial redundancy [8]. However, spatial parameter quantification of MPEG Surround is based on the qualitative analysis of binaural cue perception sensitivities, which cannot achieve transparent perceptual lossless effects.
Goodwin, et al. proposed a spatial analysis-synthesis scheme, in which a principal component analysis is applied to decompose frequency sub-band signals into principal components and environmental background and extract orientation parameters and energy parameters separately. This frame is applicable in robustness of spatial audio parameter coding and in the enhancement of certain scenes or sound effects [13].
In the era of 3D audio, the number of audio channels has increased dramatically in the WFS, Ambisonics system, and 22.2 multichannel system. For instance, the quantity of basic loudspeakers in WFS reached hundreds [12]. Despite the high flexibility of loudspeaker configurations in the Ambisonics system, the 3D sound effects drop sharply with the number of loudspeakers. An increase in the number of loudspeakers leads to a surge of data size, which prevents current 3D audio systems from maintaining high compression efficiency without affecting the original 3D sound effects and restricting the development and application of 3D audio systems.
Aiming at high compression efficiency of 3D audio, previous studies of high efficiency 3D audio compression have focused on the reduction of 3D sound effects without altering certain compression ratios. Sakaida, et al. utilized Dolby-E coding technology to compress 22.2 multichannel signals, converted audio channels from 24 to 6, and compressed the code rate from 28 to 7 Mbps. A modulation technique was used to store 8 audio channels in 2 channels. The signal redundancy in the frequency domain was included with no loss of signal quality. However, a 2-channel signal cannot be played appropriately without decoding [14]. Cheng, et al. proposed the application of spatially squeezed surround audio coding (S3AC) to an Ambisonics B audio record coding system. Herein, the Ambisonics B signals were blended into a single channel/stereo, orientation information was extracted for parametric coding, and the signal distortion problem was mitigated [4]. Hellerud, et al. [6] extracted inter-channel predictive parameters based on high-order inter-channel coherence to remove redundant inter-channel spatial information and signals using entropy coding. However, despite its reduced delay, complicated codec calculation was required.
Pinto, et al. [7] converted collected sound field data into frequency domain using time-space fold transformation and achieved WFS signal expression using 2D temporal frequency. Additionally, models for rapid attenuating omnidirectional wave and slowly attenuating directional wave were established, and compression was achieved by discarding the omnidirectional wave. A psychoacoustic model was used to estimate the maximum quantification noise energy supported by each directional wave, thus maintaining the perceptual quality of the decoded signal.
Cheng, et al. [2] proposed randomly located loudspeaker location information to estimate sound source location information and parameterize sound source location information in a 3D sound field. The location information was used as side information in the single channel of original multi-channel signals or space extruding surround audio encoding for stereo mix in order to remove inter-channel spatial information redundancy and mitigate the limitations of Ambisonics such as distortion caused by sub-par recording hardware. The quantification of spatial location information is uniform in terms of spatial distribution and does not include the resolution difference of human locations. Hence, audible distortions are expected at low code rates.
The human discrimination threshold of sound source orientation changes with the sound source location, and the locating capability for a mid-vertical plane is obviously worse than for a horizontal plane. As for the horizontal angular resolution, it’s the most sensitive when the sound source is directly in front of the listener. Minimum audible angle (MAA) increases with the horizontal azimuth angle, and reaches maximum at±90° [1]. It gradually decreases when moving behind the listener and gets doubled behind than before human. The perception sensitivity of the elevating angle differs drastically with sound source height and horizontal location changes. Human auditory senses for locating sound sources in front and above front are better than overhead and behind the head senses. Location accuracy is higher for the sides than the front. At present, tests for perceptual characteristics of spatial azimuth angle are mainly exercised in horizontal, mid-vertical, and oblique planes. Additionally, there is a lack of systematic analysis and models for perceptual sensitivity in the 3D spatial azimuth angle, which could be helpful in 3D audio encoding.
Therefore, this article investigated 3D spatial orientation cue perceptual characteristics, established an orientation cue perceptual model, and built a heterogeneous quantification table accordingly. Theoretically, no perceptual distortions are expected.
2Analysis of spatial location cues perception
The perception ability of the human ear to locate a sound source varies with the sound source location. Studies of perception sensitivity characteristics to three-dimensional sound fields focused on specific locations, such as horizontal and vertical surfaces, while information regarding three-dimensional sounds was omitted. Therefore, a unique experimental setup to test and capture sound sources from different locations in a three-dimensional space was proposed in this article, and an audio testing database was developed. Using an adaptive psychological hearing test method, the sense threshold value of three-dimensional space location cues can be obtained rapidly. On this basis, a representation model of perception sensitivity to three-dimensional space location cues was created to provide references to quantification coding of spatial parameters. Studies of location cue perception characteristics of three-dimensional space have shown that the minimum audible angle of human-to-sound-source should be set at different spatial locations in different directions. Hence, “three freedom” (e.g. horizontal angle, elevation angle, and distance) is required to express a location. In this article, the horizontal direction (horizontal angle) was studied, and a quantification table of three dimensional audio location angles was developed.
2.1Setup of location cues testing system
2.1.1Experimental setup design
Previous studies reported measurements of perception sensitivity at specific locations, which usually involved methods of allowing participants to measure the perception threshold level at different spatial locations. However, variations of environmental conditions are not tolerable in this method and the process is time-consuming. Therefore, it’s extremely challenging to obtain a perception sensitivity threshold level of the entire three-dimensional location. As a result, a simplified testing system is urgently needed. To that end, a design for an experimental setup for 3D space perception characteristics was proposed (Fig. 1).
As shown, this setup included a rotatable base, supporting feet, semi-circular arc bracket, artificial head, pole, and wireless speakers. The semi-circular arc bracket was supported by left and right supporting feet and two connection bearings to support its rotation. An artificial human head was installed and the center of the connection line of the two ears was located at the center of the semi-circular arc bracket. A long stick in the center of the semi-circular arc bracket moved along the diameter direction of the semi-circular arc bracket. The wireless speaker was installed at the terminal of the long stick near the center of the circle.
A connection bearing was included between the semi-circular arc and the supporting feet, and a dial was used to record the rotation angle (0–360°) of the vertical rotation of the semi-circular arc. The right front of the artificial head was set at 0 degree, and the anti-clockwise in the vertical direction was the positive rotationdirection.
The following steps were taken to set up the test method:
– The artificial head was placed inside the setup, and the connection line of the ears and semi-circular arc bracket rotation axis were overlapped. A bearing was installed at the bottom of the artificial head to install another dial, which would record the horizontal rotation angle of the base, from 0 degree to 360 degree, the right front horizontal angle of the head was 0 degree, clockwise waspositive.
– A long stick was installed in the center of the semi-circular arc bracket which was able to move within the same surface as the semi-circular arc bracket. Calibration tails were installed in the stick and the movable range was set as needed. The extension of the stick pointed to the center of the circle. A wireless speaker was installed at the stick terminal near the center of the circle, pointed at the circle’s center.
– The semi-circular arc was rotated to change the vertical location of the speaker, thus changing the elevation angle between the speaker and the XOY plane, which was recorded as β.
– The head base was rotated to change the horizontal angle of the head relative to the speaker, which was also the angle between the speaker and the XOY plane, recorded as α.
– The long stick could be moved, and the distance between the speaker and the circle center was changed. This was recorded as ρ.
– The semi-circular arc bracket and the head were rotated, theoretically achieving all positions in space (ρ, α, β) between the speaker andthe head.
2.1.2Creation of test signal source database
To capture the audio source signal from a specific location (ρ, α, β), the speaker and the head were firstly rotated to the respective location, and the signals were transmitted to the wireless speaker at different frequencies and recorded by the artificial head (the signal length was 5s). Then, the signals were coded in the following format: environment - signal type - band - radius - horizontal angle - elevation angle. For instance, 0 denoted a quiet room, 1 denoted mixed sound inside the room, and 2 denoted outdoor noises. Other examples of signal types included 0, meaning Gaussian white noise; 1, meaning narrow band noise; and 2, meaning pure audio. If it was a narrow band noise of pure audio, capture based on the band was required. Coding of radius and horizontal and elevation angles was coded as the actual number. The testing sound source database captured Gaussian white noise in this article using a testing radius of 2 m with 16 kHz low-pass filtering. The actual sampling environment is shown in Fig. 2.
2.2Testing personnel
Eight testing participants were involved: 5 male and 3 female aged 21 to 27. All participants were post-graduate students who had received proper training and passed a medical checkup. Two additional rounds of screening followed, the first involved the testing personnel repeatedly listening to two sounds at different horizontal angles. Both noises were Gaussian white noise, with a reference audio angle of 0 degrees, and test audio angle at 2.5 degrees, and the participant was required to decide which one was more to the left. Each result was recorded, and if their correct answers reached a certain standard (80% , based on the most recent 20 times) in the given number of times (60 times), the testing personnel passed the test. This test mainly determined if the testing personnel was able to sense the horizontal change when the horizontal angle changed. Additionally, the patience of each participant was tested, with 9 people passing this test. In the actual test, it was easier to distinguish the difference in the location at the start of the test; as the horizontal angle difference became smaller and smaller, the mistake rates increased. One participant failed to follow testing directives, resulting in only 8 participants.
In this test, each participant completed the hearing test 12 times. Each round consisted of JND in 8 different frequencies, and each frequency lasted for three minutes.
2.3Testing signal
2.3.1Signal type
Gaussian white noise, 16 kHz low pass filtering testing series sampled at 48 kHz, 16 bit precise quantification, 300 ms in length, the hearing pressure of the ear was maintained at 70 dB after re-capturing.
2.3.2Selection of horizontal testing angle
Previous studies revealed that the most sensitive horizontal angle of human hearing is the right front and the most insensitive horizontal angles are the sides. Additionally, only data from one side is needed, as the human ear perception characteristic of the two sides of a vertical plane is symmetrical. As a result, the testing locations were selected in an atypical manner for more convenient processing of the data at a later stage. The detailed selection cases are listed in Table 1.
2.4Testing results
This experiment tested horizontal perception threshold levels at 5 different heights and 92 locations. The scatterplot of the testing results demonstrated as follows.
The perception threshold level at the horizontal angle is the most sensitive at right front, and most insensitive at the two sides. As the angle increased, the perception threshold level increased, until the angle was beyond 90 degrees; after that, it decreased. The horizontal perception threshold level at right back was two times that at right front at 0 degree elevation angle.
To analyze the horizontal perception threshold level at different elevation angles, surfaces were simulated using the cubic spline interpolation method (Fig. 3).
As shown, the horizontal perception threshold level increased with the elevation angle, while the variation of signals at different heights was relatively low.
33D audio parametric coding based on perception characteristics
Due to the different perception sensitivities of the human ear in the horizontal plane and vertical direction, the requirements for accuracy must also be different when the sound image recovery is coming from different directions, meaning different methods must be applied. Based on the human ear’s perception sensitivities in different directions, a double coding method was applied. In the horizontal plane, perception sensitivity is high, and sounds in this direction must be fully recovered. Hence, a conventional spatial audio coding method was used so that the speaker signals arranged in the horizontal plane down-mixed to a single channel stepwise. Parameters representing the spatial information were extracted in order to compress the data efficiently in the speaker signals of the horizontal plane. In the vertical direction, perception sensitivity of the human ear is low, and the larger the elevation angle, the lower the perception sensitivity. As such, only the sound image height must be recovered to have a satisfactory effect.
If the spatial audio coding method is applied to compress signals of the horizontal plane, the complexity of coding is quite high. Moreover, using horizontal positioning clues cannot effectively represent the sound image height information, and the effect of rebuilding is not good. Therefore, this project aimed to make orthogonal decomposition for all the speaker signals to obtain components of each channel in a three-dimensional space Cartesian coordinate system of X, Y, and Z axes. The components of each channel were the decomposition of the original monophonic source on the channel. After obtaining components of each channel in the X, Y, and Z axes, each component was summed separately to obtain the component of the original monophonic source for the listener location, which can obtain the horizontal angle and elevation angle. Then, using the elevation angle parameter, a high quality feel of the original monophonic source can be recovered in the decoding side.
For the coding of the horizontal plane, down-mixture is a key step as the arrangement of speakers is inconsistent in three-dimensional audio. It is very challenging to set one or more modes to down-mix channel signals of any configuration, and the correlation of different channels varies.
For the coding of the location information, monophonic sources were divided to extract its location cues. However, this method was limited by its high complexity and low effectiveness. As the human ears are sensitive in only one specific direction, all channel signals can be divided based on the method of critical bands division. It can then be assumed that only one monophonic source was sensed in each band, and the location cues can be extracted through location cues to retrieve height information of each band in the decoding side.
3.1Location parameter extraction
According to perception characteristics of the human ear, the center frequency of each critical sub-band of different bandwidths has similar perception characteristics to the whole sub-band. (The human ear can only perceive a different frequency range in two kinds of frequency sounds.) Therefore, the Bark band division method was applied, in which the audio signal was divided into 24 sub-bands, and the frequency coverage scope was 20–15,500 Hz. Spatial orientation can take the listener as a reference point and decompose each channel signal in a multi-channel system to obtain components of each channel in a 3D space Cartesian coordinate system of X, Y, and Z axes. The components of each channel are the decomposition of the original monophonic source on the channel. After obtaining components of each channel in the X, Y, and Z axes, each component is summed separately to obtain the component of the original monophonic source for the listener location, as shown in Fig. 4.
Firstly, each channel is time-frequency converted, as shown in Equation (1). The specific conversion method used in this study was short-time Fourier transform and virtual quadrature mirror filter bank as shown in the following:
(1)
With the speaker located in horizontal angle μ i and elevation angle η i (Fig. 5), the 3D audio signal P s i (t, n) of the speaker was represented by a vector, where i is the index of the speaker. This signal was decomposed, as shown in Equation (2):
(2)
(3)
The down-mixture channel can be seen as a sound source excluding the spatial location information. Its azimuth can be divided into horizontal angle μ and elevation angle η, through Equations (4) and (5):
(4)
(5)
3.2Down-mixture of multi-channel signals
Current 3D audio systems achieve the whole 3D space listening experience through multi-layer arrangements in which the system is divided into three layers. The middle layer is the most important layer, as it is flush with the horizontal plane of the ear of the listener. Therefore, arrangements of this layer in different 3D audio systems are different in terms of the number and angle placements of the speakers. Parametric stereo technology involves two or three channels being down-mixed as the signal channel and stereo by extracting ILD and IC to recover the location information of the original sound image. However, the down-mixing of speakers is an important issue, as it involves down-mixing the two most relevant speaker signals as a pair, constantly looking for the most relevant speaker channel pair to down-mix progressively. Nevertheless, the complexity of this calculation is relatively high, which makes it difficult to recover after decoding. Considering symmetry and proximity characteristics of the speaker arrangement, speakers should be chosen next to both sides of the center speaker to down-mix, until all are paired. Then start the second round and repeat this process, down-mixing to the last channel signal and then down-mixing with the center speaker to obtain the final monophonic channel signal.
With the speaker arrangement shown in Fig. 5, the label rules take the center speaker as No. 1, and then the speakers next to the No. 1 speaker are numbered from near to far, the left as an even number and the right as an odd number right, until No. n.
According to the down-mixture rules mentioned above and combined with the speaker arrangement, when the 1st round starts to down-mix, the even-numbered speakers form pairs sequentially, and the monophonic channel signal after down-mixing is numbered continuously as the smaller number. for the next round down mixing continuously, the odd number speakers from No. 3 to make a pair sequentially and down mix. This process is repeated until No. 2 and No. 3 speaker signals are remaining, after which they down-mix. Finally, this signal is down-mixed with No. 1 speaker signal to obtain the final monophonic channel
signal. The ILD and IC parameters are extracted every time down-mix is started, with each parameter numbered as the larger number in down-mixing, making it easy to produce a corresponding reconstructed signal according to the parameter values whendecoding.
For an example, ten speakers were arranged in the horizontal plane, with the specific down-mixture process marked in Fig. 6.
3.3Spatial parameter quantification
Spatial parameters code related to the binaural cue parameters ILD and IC, the horizontal angle and elevation angle of location parameters, based on the quantification method of parametric stereo technology, the binaural cue parameters can remove the perception redundancy of the parameter itself. While studying the perception characteristics of binaural cues, the perception threshold was obtained by quantifying the amount of change above the perception threshold to remove the perception redundancy of the parameter and reduce the coding rate. This resulted in the discovery of a novel method.
The scalar quantification method was used for the quantification of the location parameters as the perception threshold of location parameters varies widely, studying and using the existed the perception threshold of location parameters, to limit remove the perception redundancy of height angle.
The conventional quantification method for horizontal and elevation angles is a scalar quantification, and the quantification step is uniform, through selecting different accuracy for different coding requirements seen from the study of perceptual mechanism, the perception threshold difference of the horizontal and elevation angle is larger in different direction and frequency, even up to more than ten times. Therefore, the perception threshold in different frequency bands and the direction of the ears to the azimuth must be considered in the location parameter quantification.
According to the azimuth perception sensitivity model of three-dimensional space, the quantification step is smaller in front of the horizontal angle, and larger on both sides. The quantification step is smaller in front of the height angle, and larger closer to the head, the quantification step is a little smaller on both sides than the front. At the same time, due to the elevation angle as the height increasing MAA gradually become large, so select 11 quantification values of the elevation angle, respectively – 45, – 20, 0, 5, 10, 20, 30, 45, 60, 75, 90, the specific quantification values are shown in Fig. 7.
According to the quantification table, make non-uniform quantification to location parameter (μ, η) extracted, judge (μ, η) in which quantification interval, and assume the target quantification value (μ i , η i ). The specific selection is (μ, η) compared to every quantification interval one by one. If it is satisfied that the value of (|μ - μ i | + |η - η i |) is the minimum, the location parameter (μ, η) will be quantified (μ i , η i ).
3.4Coding rate test analysis
Cheng, et al. [3] designed a method of spatial localization quantification points (SLQP), dividing into high precision and low precision modes. Figure 8 shows the quantification value of the low precision mode, with every blue dot representing a quantification value, 658 in total, requiring 9.4-bit coding. Figure 9 shows the quantification value of the high precision mode, 1729 in total, requiring 10.7-bit coding.
This quantification method does not consider the perception characteristics of the human ear in different directions using the uniform quantification method. Even though in the high precision quantification method, the quantification interval in front is much larger than the perception threshold value of the location, there exists a larger perception error.
To solve this problem, a location parameter quantification method based on the perception characteristics of the human ear was proposed, as shown in the parameter quantification table in the last section. If plan to quantify location cues, requiring 601 quantification values, less than10 bits will be quantified.
The above quantification table shows the difference of every quantification value under the perception threshold value of the quantification. In theory, there is no perception distortion, but this method still requires less bits than the high precision quantification scheme of Bing. Moreover, quantification in front is more accurate than uniform quantification, as the following table of specific coding rate analysis shows.
As can be seen from the table 2, this method, compared to SLQP, reduces the quantification bit by 8.66% in the low precision mode, and 65.24% in the high precision mode. The accuracy of quantification is also higher than the SLQP method, and is suitable for human perception characteristics without causing perception distortion.
4Conclusions
This article investigated the mechanism of orientation parameters perceptual redundancy, this paper studied 3D spatial orientation cue perceptual characteristics, established an orientation cue perceptual model, developed a heterogeneous quantification table accordingly, and controlled the differences between each quantified value below the quantitative value perception threshold. Using this method, only the information perceptible to the human ear was quantified and perceptual distortions were minimized. The experimental results revealed that, compared to the SLQP method, the quantified bit of the proposed method was reduced by 8.66% in low resolution and 65.23% in high resolution. In addition, the accuracy of this method was higher than that of the SLQP method, enabling better alignment with human perceptual characteristics.
References
1 | Mills AW (1958) On the minimum audible angle The Journal of the Acoustical Society of America 30: 237 246 |
2 | Cheng B (2001) Spatial squeezing techniques for low bit-rate multichannel audio coding University of Wollongong Ph.D. Dissertation |
3 | Cheng B, Ritz C, Burnett I (2008) A spatial squeezing approach to ambisonic audio compression IEEE International Conference on Acoustics, Speech and Signal Processing (ICASSP) 369 372 Las Vegas |
4 | Cheng B, Ritz C, Burnett I (2008) Psychoacoustic-based quantisation of spatial audio cues Electronics Letters 44: 1098 1099 |
5 | Faller C, Baumgarte F (2003) Binaural cue coding-Part II: Schemes and applications IEEE Transactions on Speech and Audio Processing 11: 520 531 |
6 | Hellerud E, Solvang A, Svensson P (2009) Spatial redundancy in higher order ambisonics and its use for low-delay lossless compression IEEE International Conference on Acoustics, Speech and Signal Processing(ICASSP) 269 272 Taipei |
7 | Pinto F, Vetterli M (2010) Space-time-frequency processing of acoustic wave fields: Theory, algorithms, and applications IEEE Transactions on Signal Processing 58: 4608 4620 |
8 | ISO/IEC JTC1/SC29/WG11 (MPEG), Call for proposals on spatial audio coding, Doc. N6455, Munich, Germany, 2004 |
9 | Johnston JD, Ferreira AJ (1992) Sum-difference stereo transform coding IEEE International Conference on Acoustics, Speech and Signal Processing (ICASSP) 569 572 California |
10 | Herre J, Brandenburg K, Lederer D (1994) Audio Engineering Society Convention 96 of Audio Engineering Society Intensity stereo coding 3799 Amsterdam |
11 | Brandenburg K (1999) MP3 and AAC explained 17th International Conference on High-Quality Audio Coding of Audio Engineering Society 17 009 Florence |
12 | Marinus MB, de PJ, Werner B (2000) 108th AES Convention On the applicability of distributed mode loudspeaker panels for wave field synthesis based sound reproduction 5165 Paris |
13 | Goodwin MM, Jot J (2007) Primary-ambient signal decomposition and vector-based localization for spatial audio coding and enhancement IEEE International Conference on Acoustics, Speech and Signal Processing (ICASSP) 1 9 Honolulu |
14 | Sakaida S, Iguchi K, Nakajima N, Nishidam Y, Ichigaya A, Nakasu E, Kurozumi M, Gohshi S (2007) The super Hi-vision codec IEEE International Conference on Image Processing 21 24 San Antonio |
Figures and Tables
Fig.1
Experimental setup for three-dimensional spatial perception characteristic (inside the figure: up, back, right, front, rotate direction, wireless speaker, dial, indicator and artificial head).
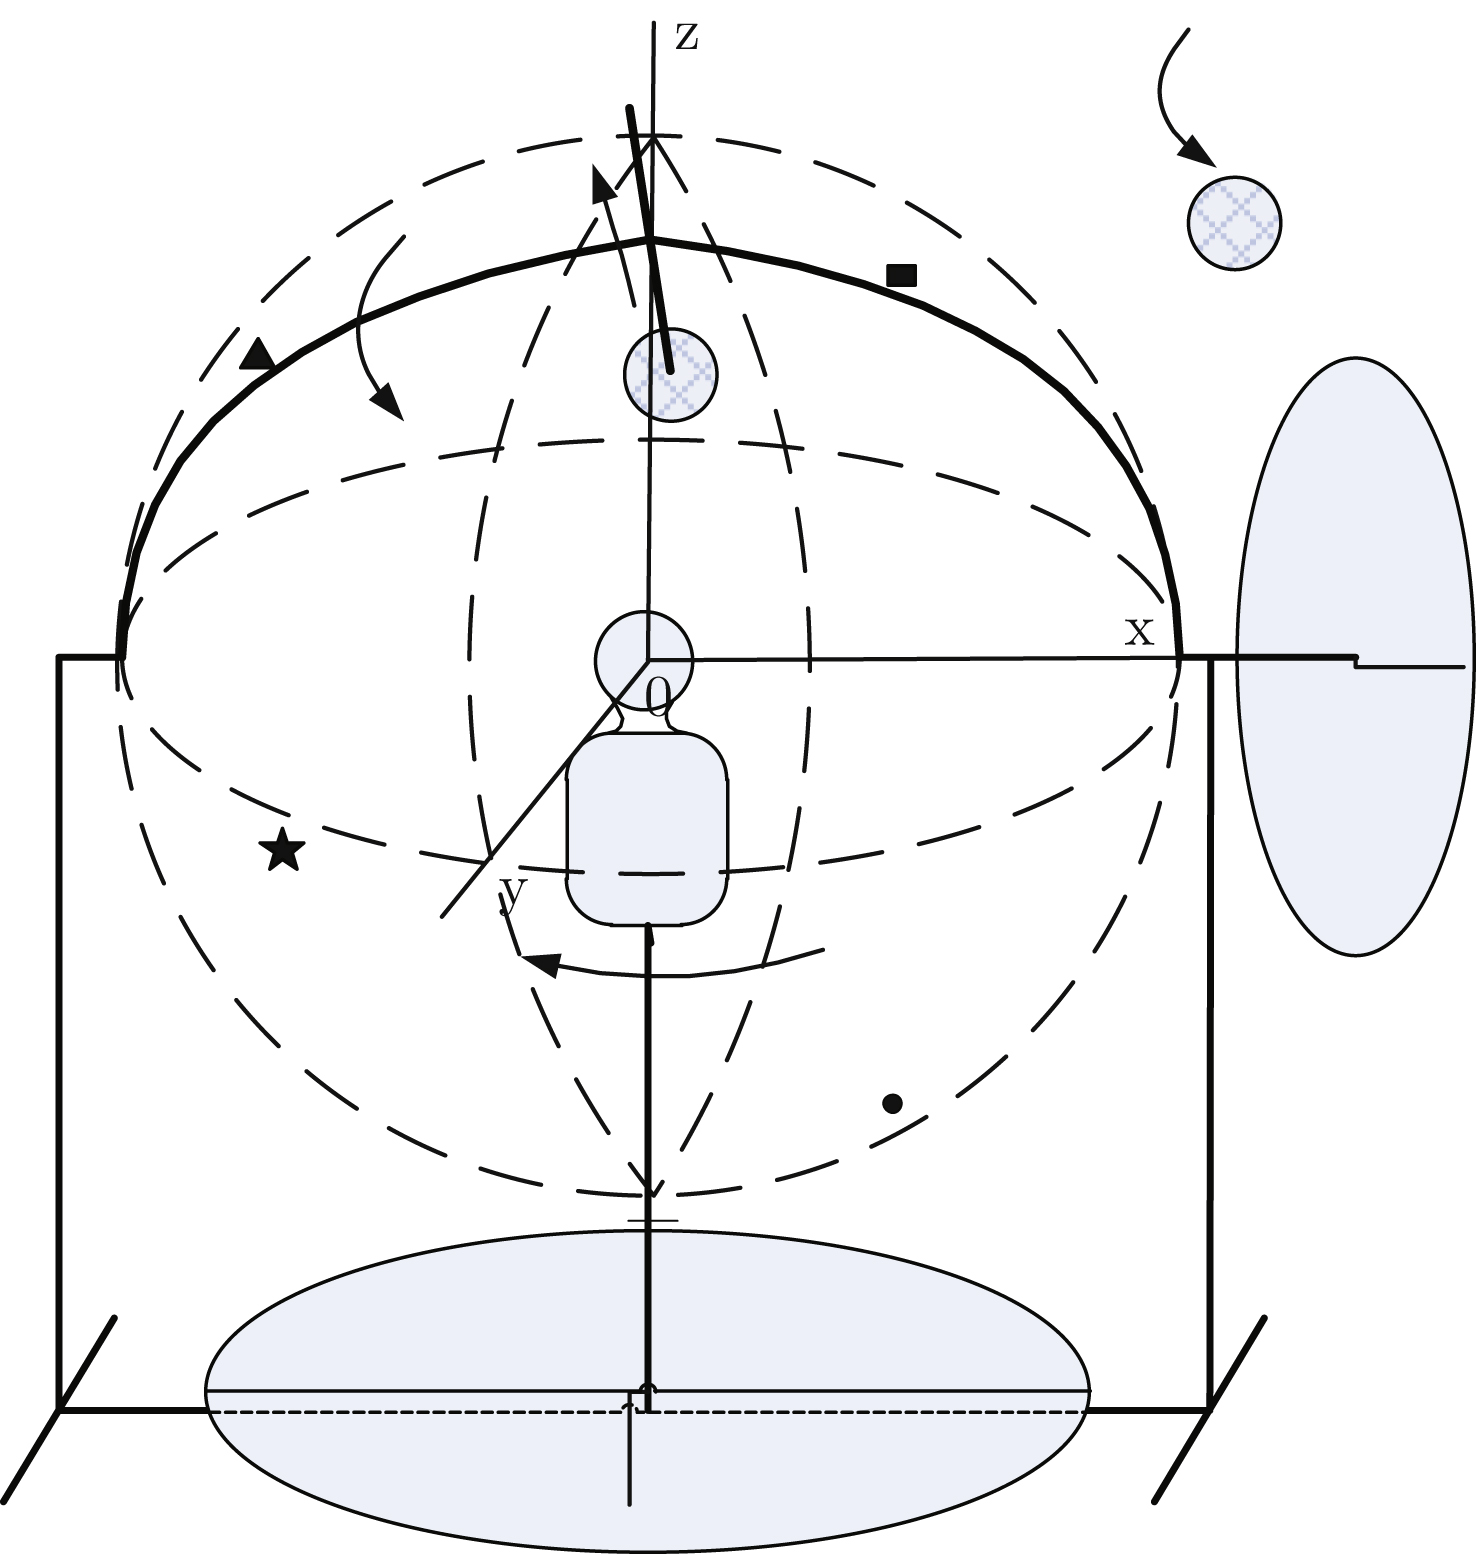
Fig.2
Actual experimental setup for three-dimensional spatial perception characteristic.
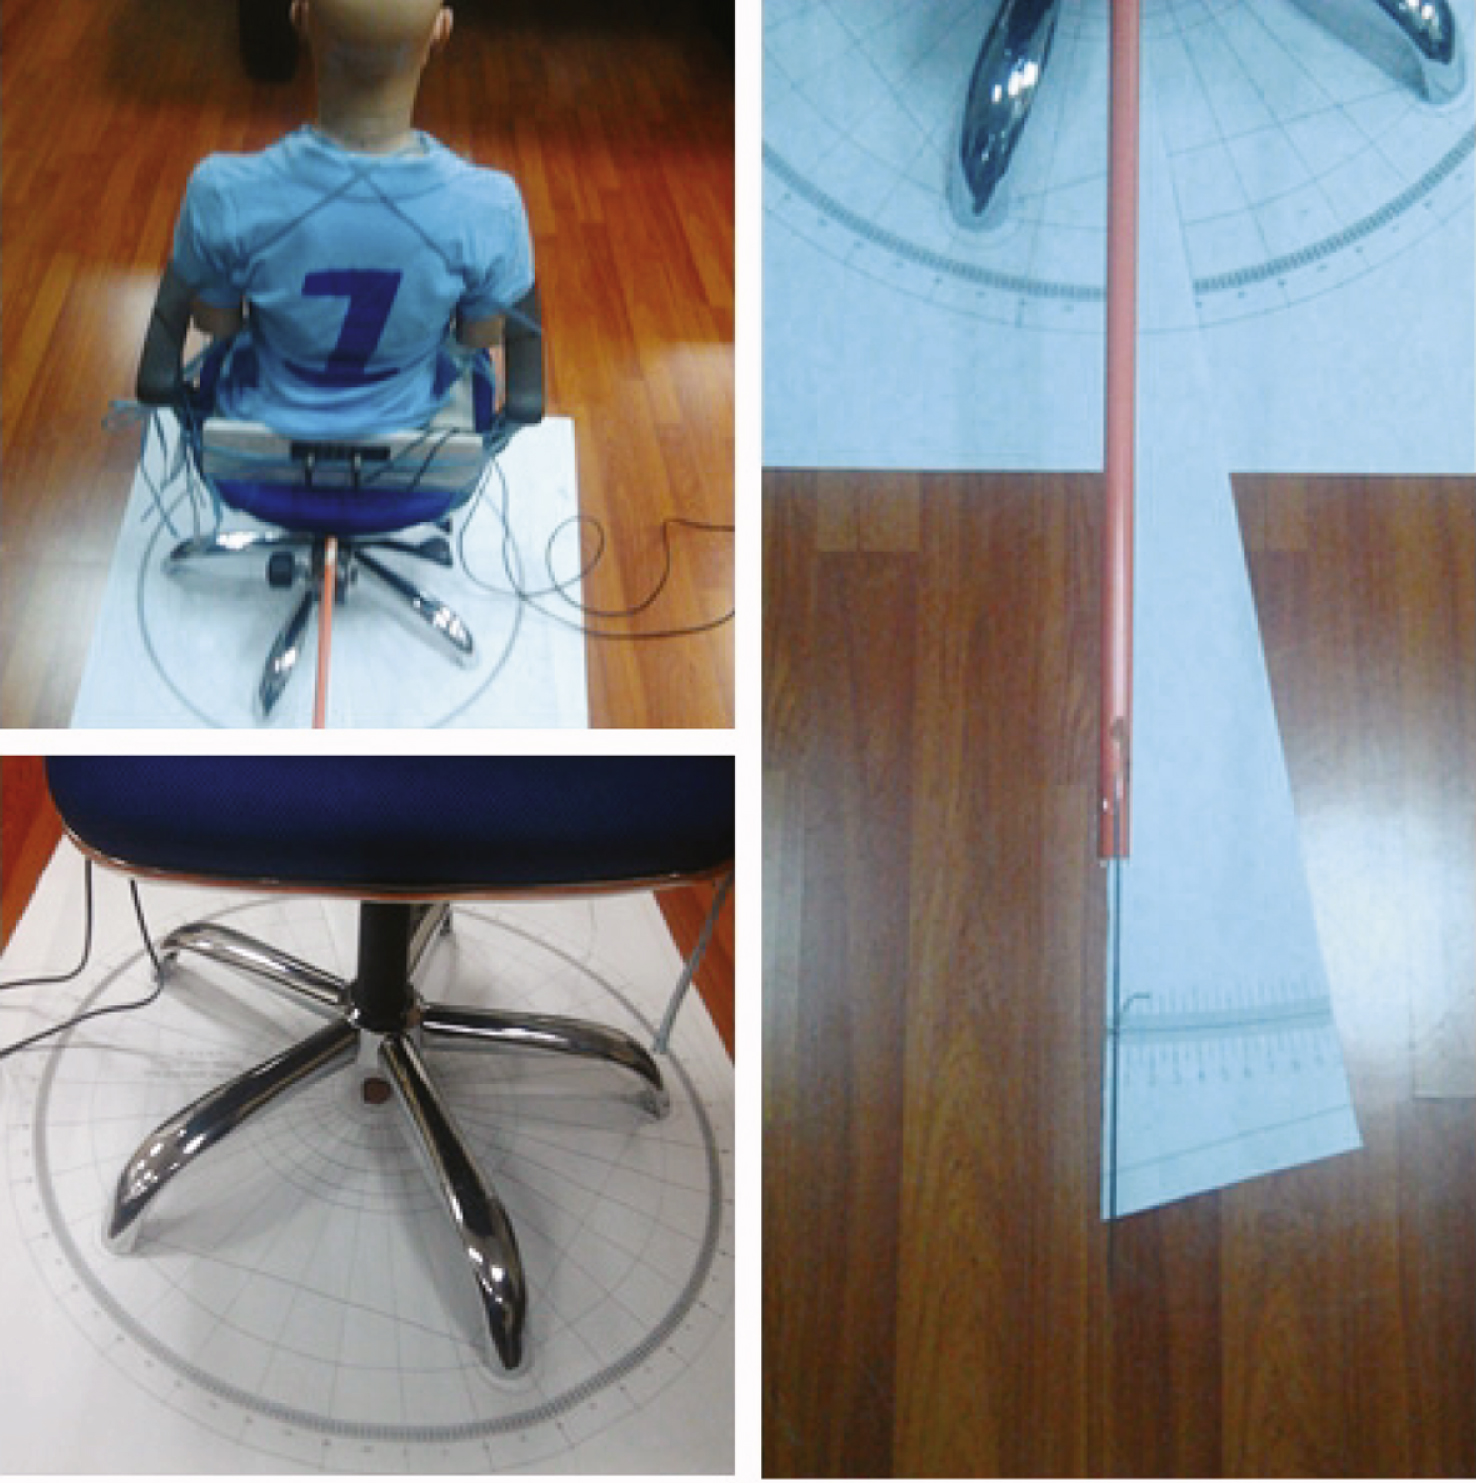
Fig.3
MAA graph of horizontal angle at different heights.
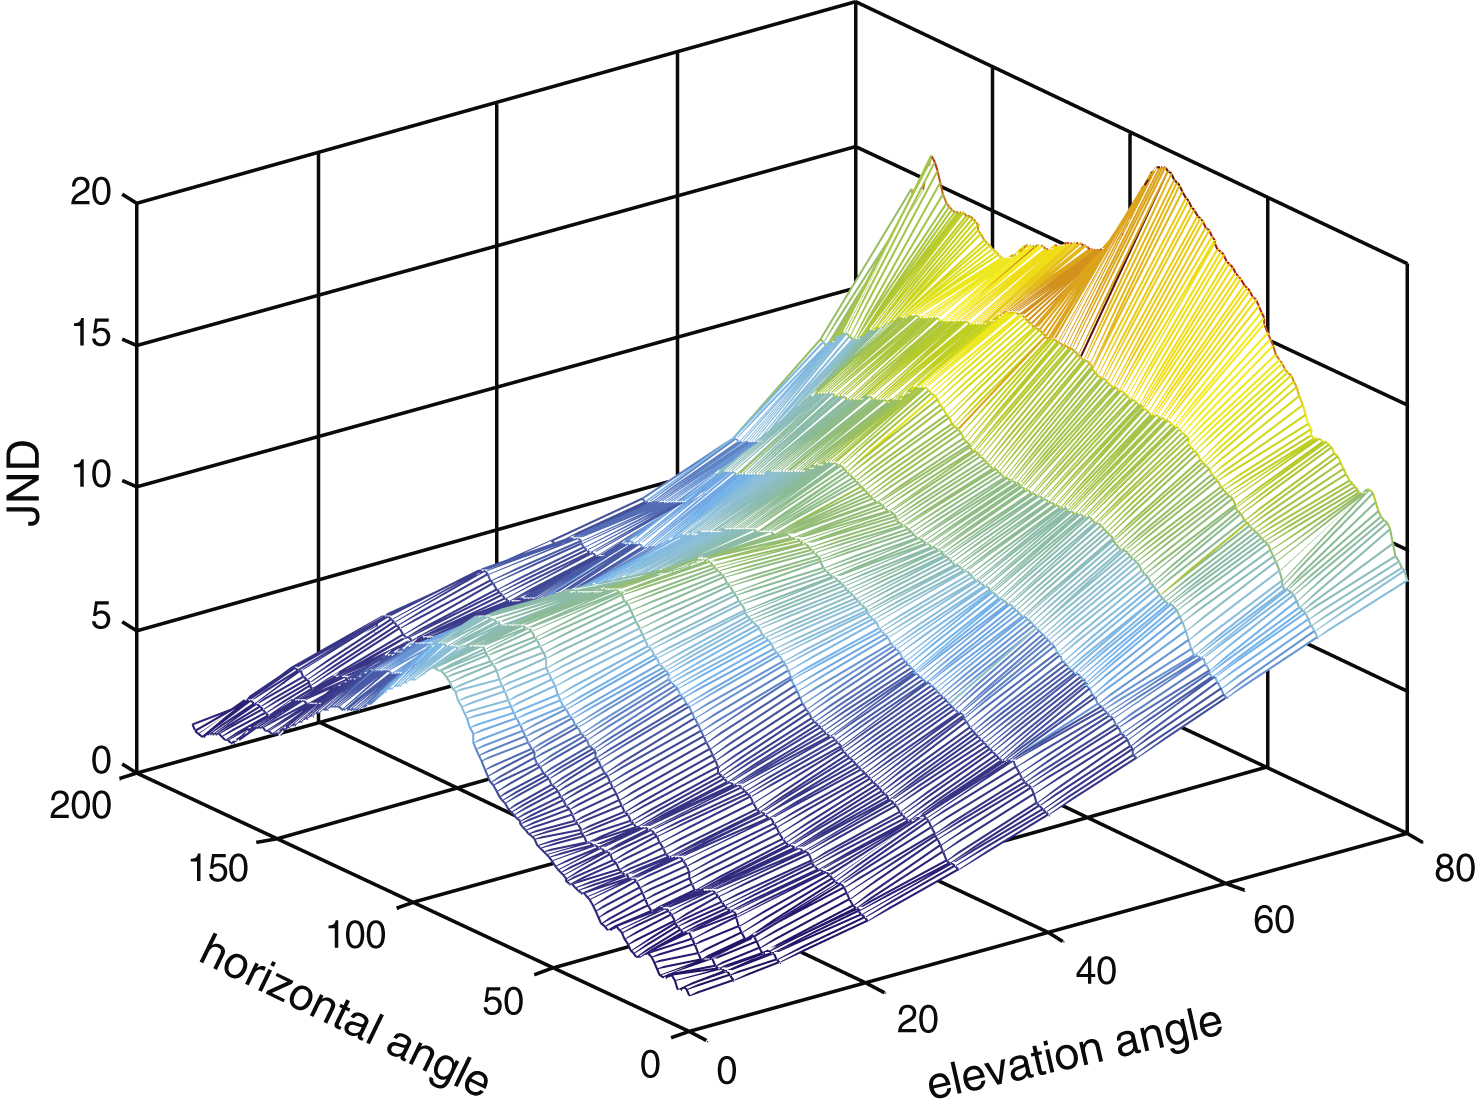
Fig.4
Speaker location and signal calculation.
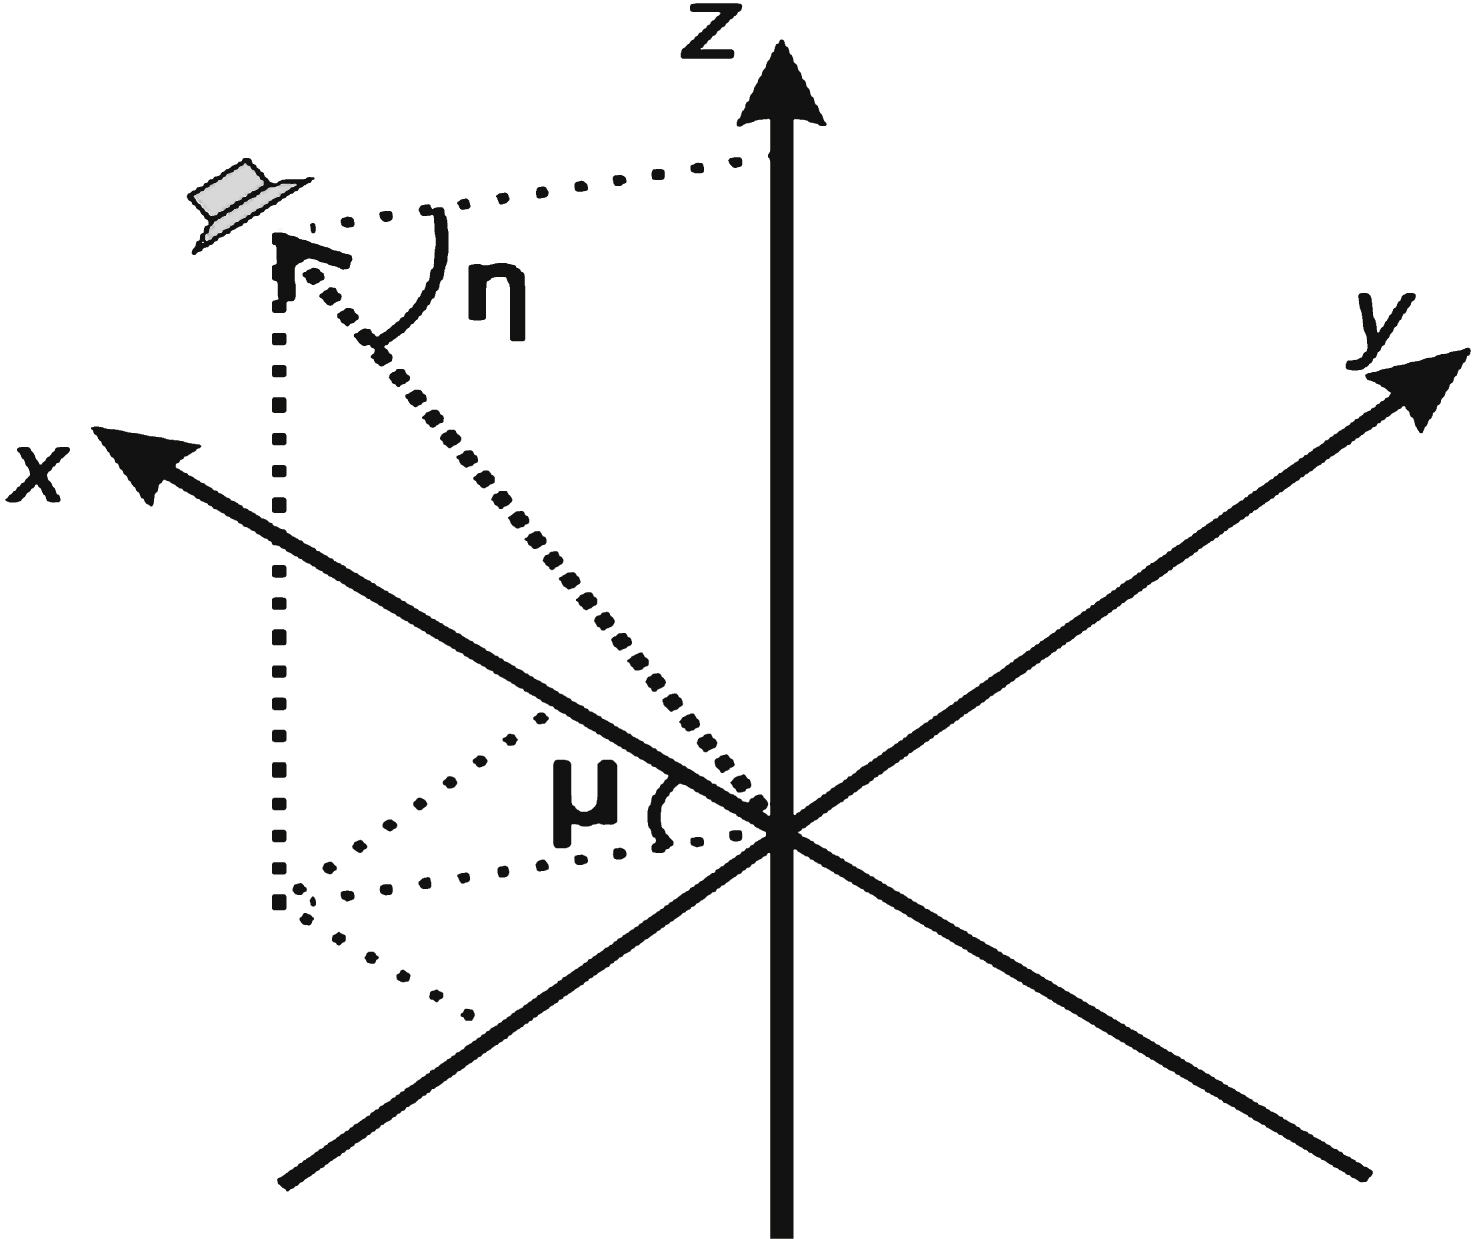
Fig.5
Schematic of speaker arrangements.
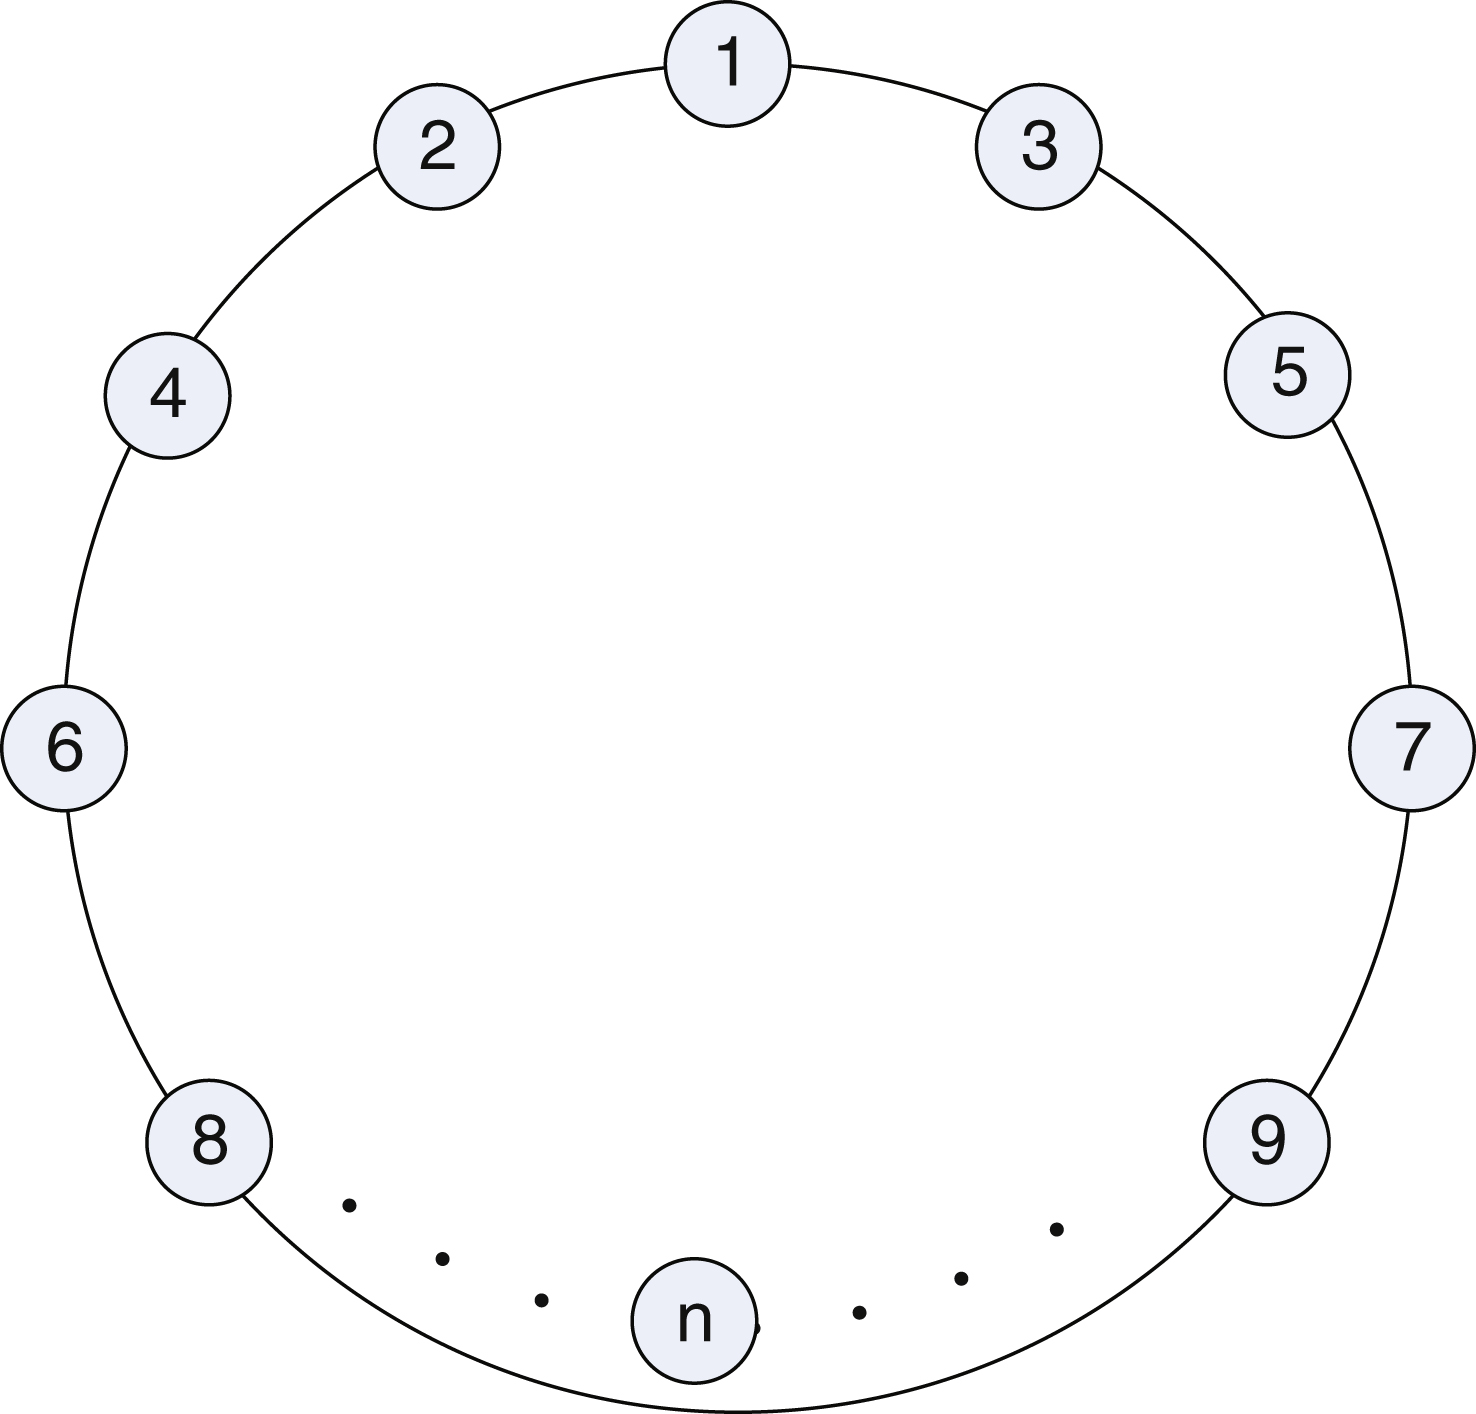
Fig.6
Channel signals in the down-mixture.
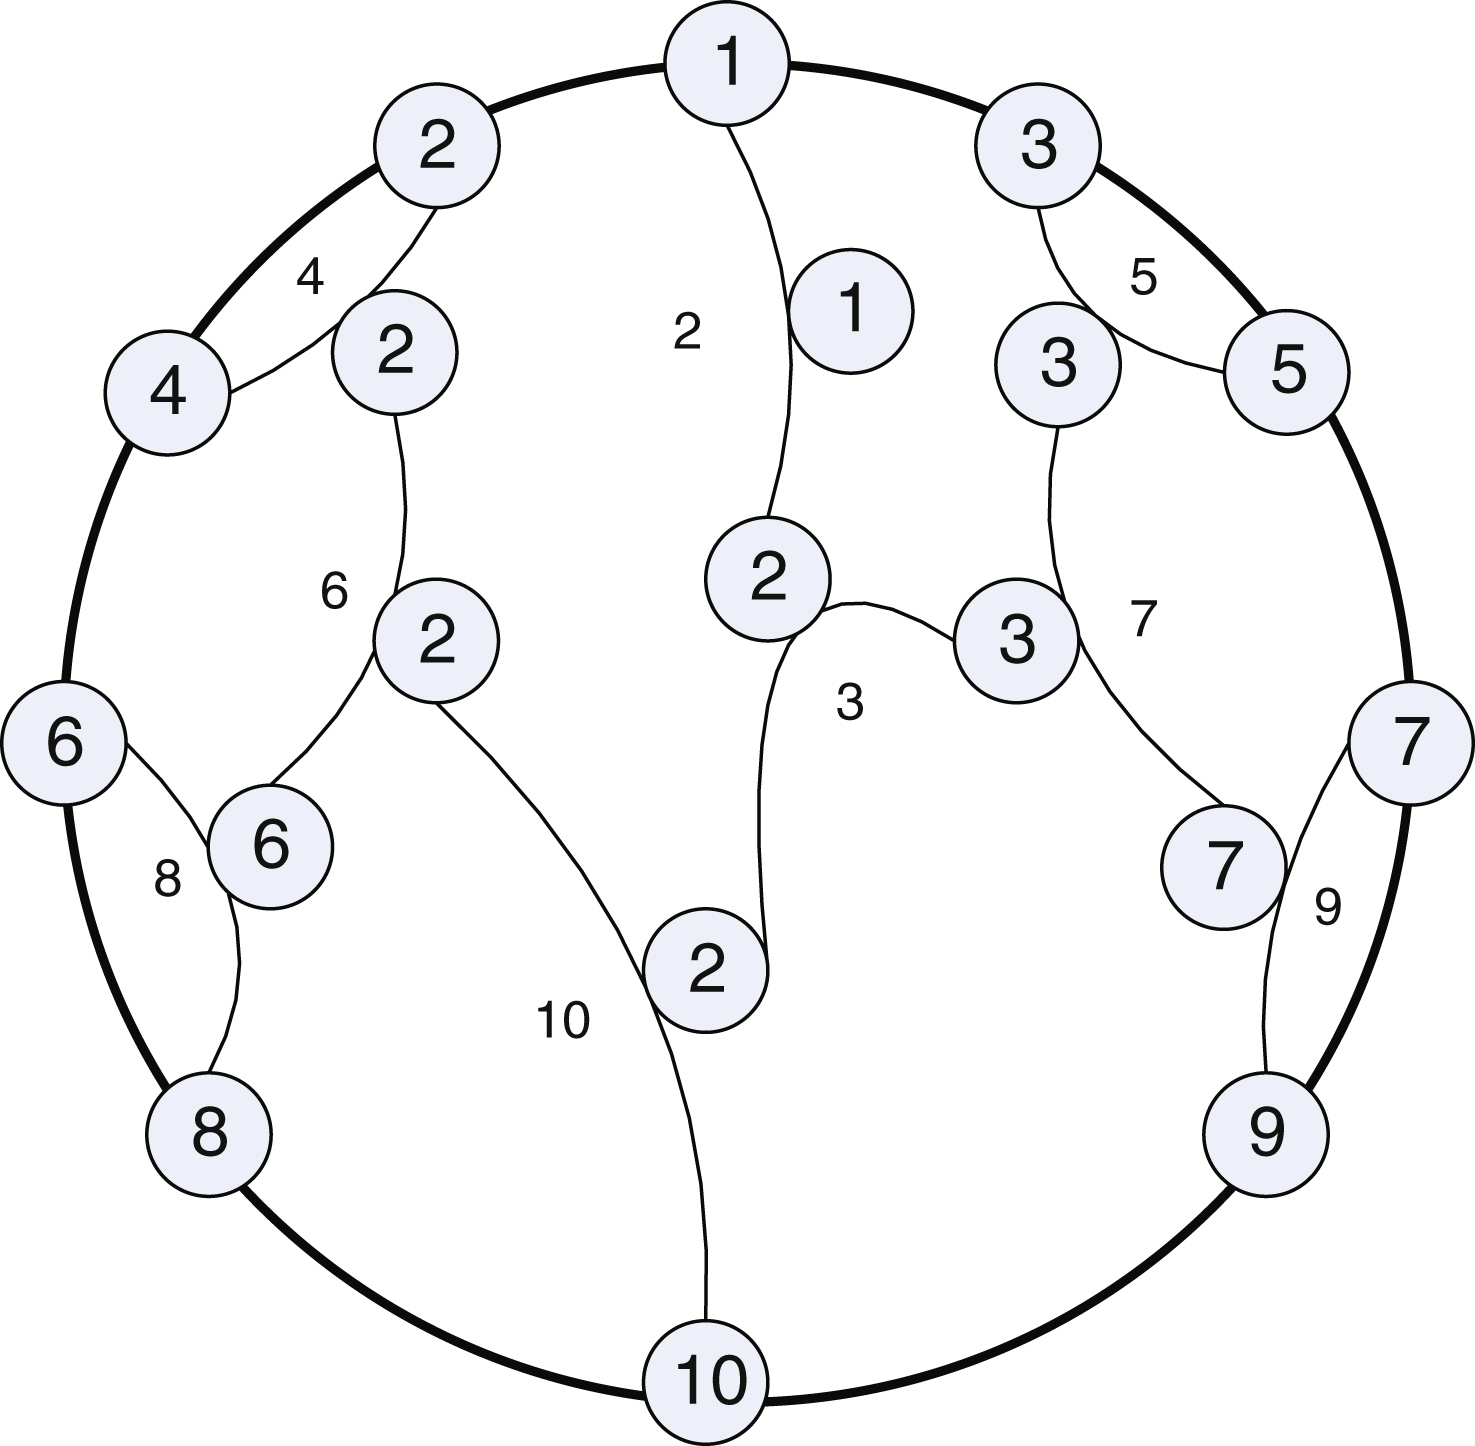
Fig.7
High precision quantification of conventional location parameters.
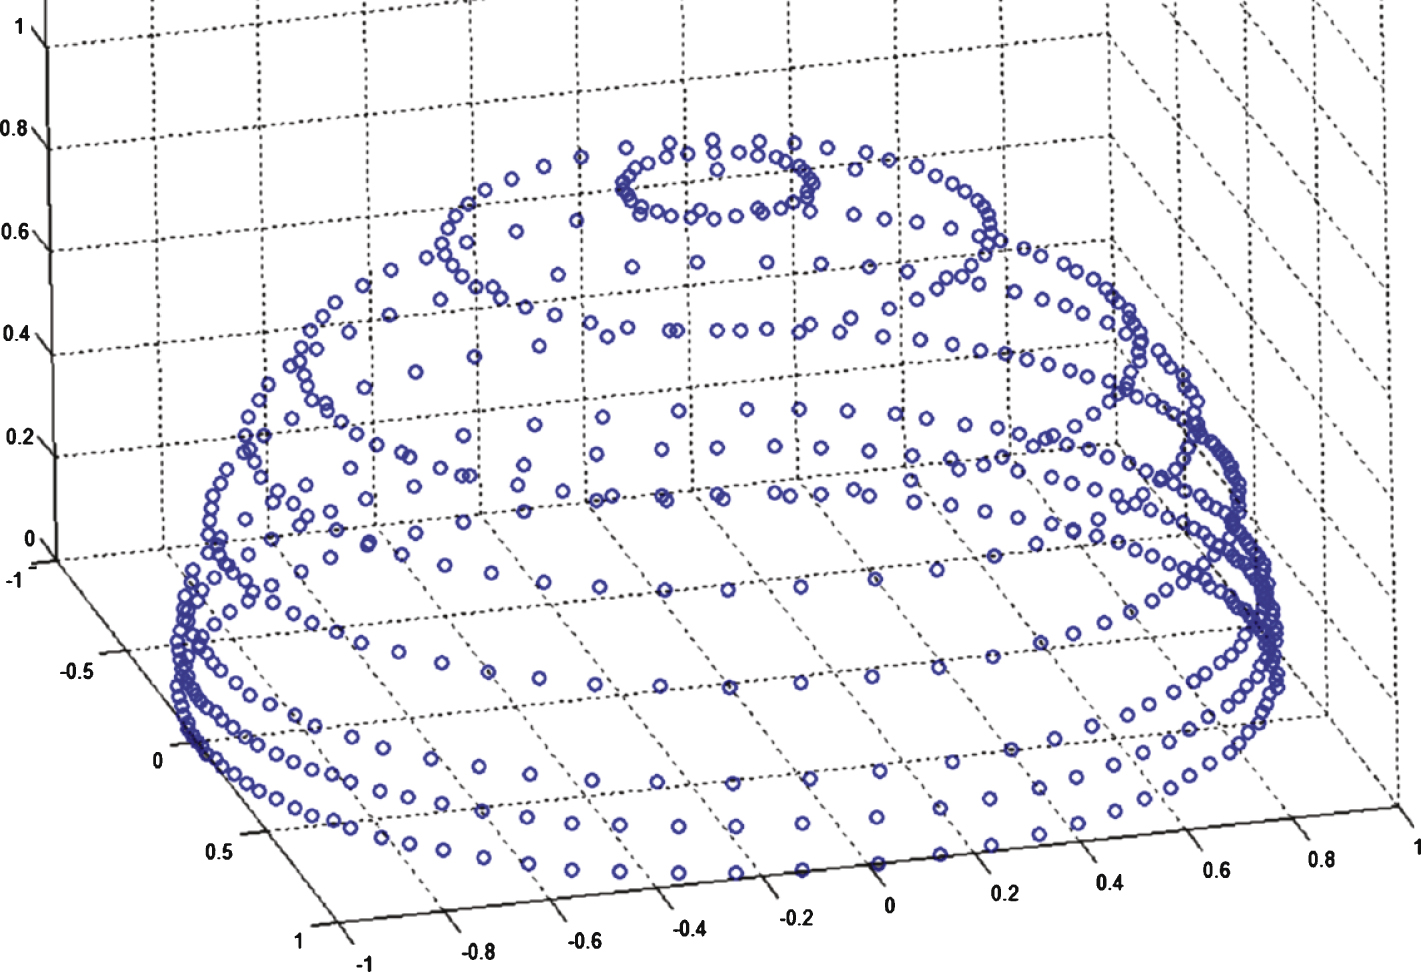
Fig.8
Low precision quantification scheme of conventional location parameters.
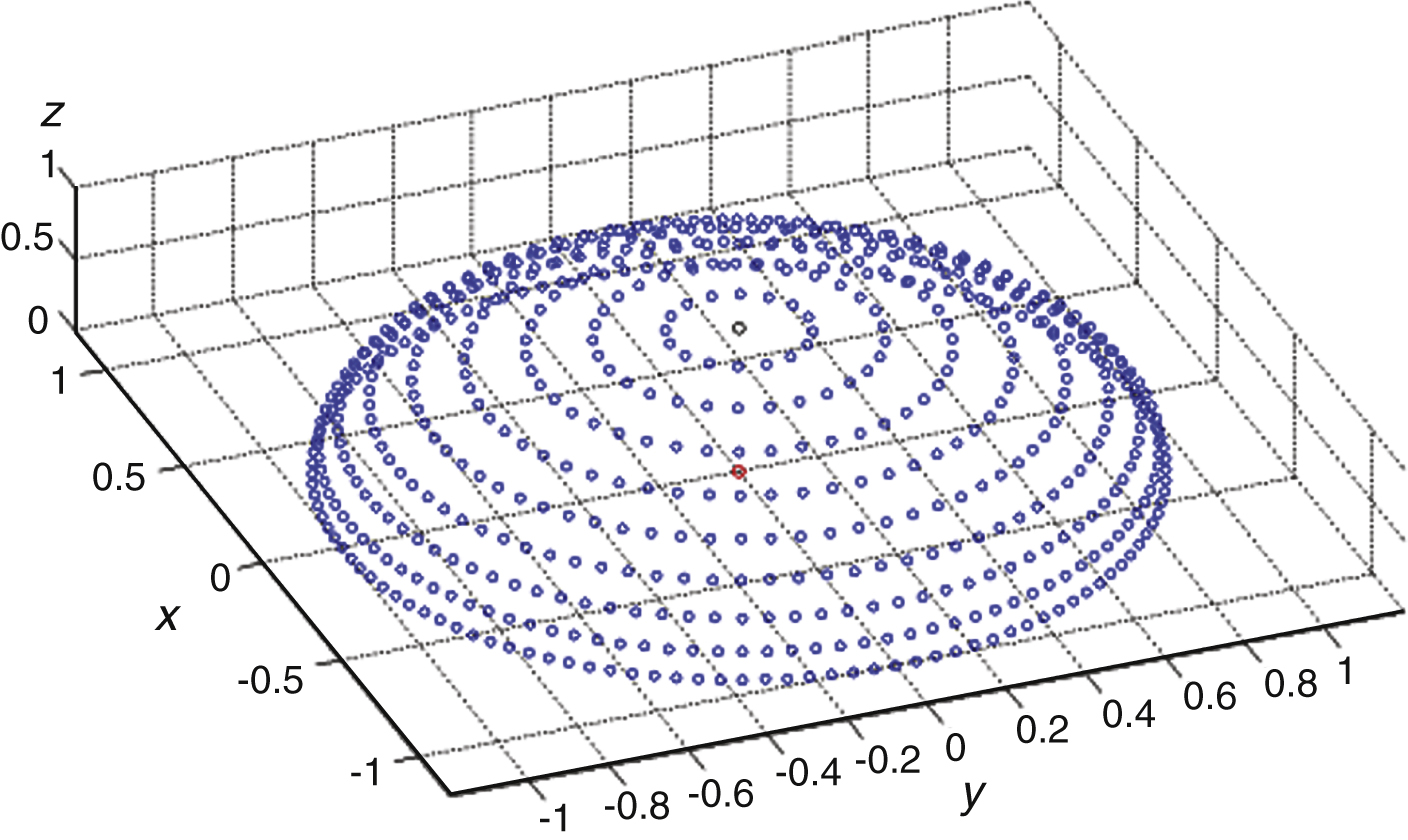
Fig.9
High precision quantification scheme of conventional location parameters.
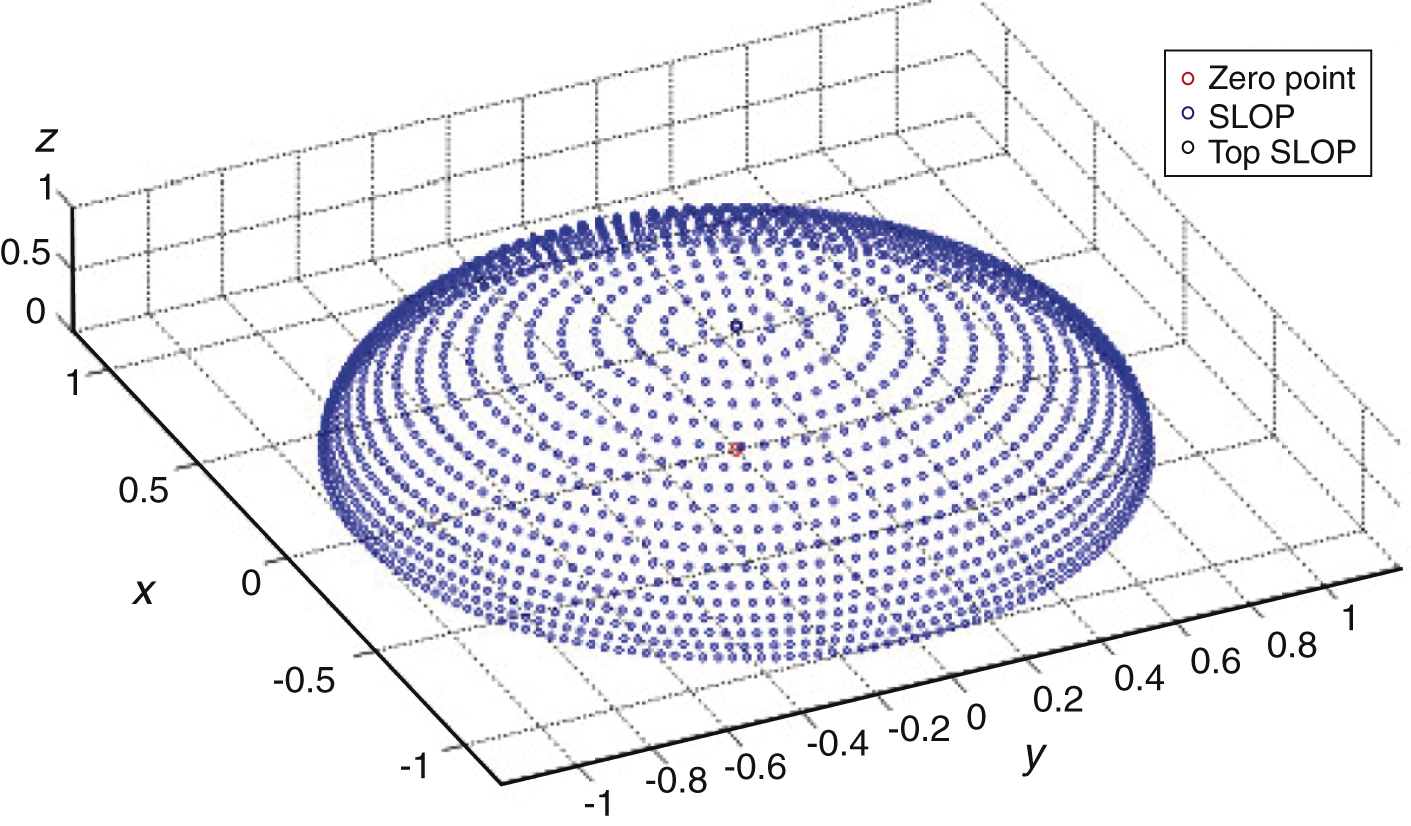
Table 1
Reference table for horizontal testing angle selection
| Elevation angle | 0 | 0 | 10 | 10 | 30 | 50 | 75 |
| serial number | |||||||
| 1 | 0 | 70 | 0 | 110 | 0 | 0 | 0 |
| 2 | 2 | 80 | 3 | 125 | 5 | 7 | 15 |
| 3 | 4 | 90 | 6 | 140 | 12 | 15 | 35 |
| 4 | 6 | 100 | 9 | 150 | 20 | 25 | 55 |
| 5 | 9 | 110 | 12 | 158 | 30 | 40 | 80 |
| 6 | 12 | 120 | 16 | 166 | 42 | 60 | 110 |
| 7 | 15 | 130 | 20 | 174 | 55 | 80 | 145 |
| 8 | 18 | 138 | 25 | 180 | 70 | 105 | 180 |
| 9 | 22 | 145 | 30 | 90 | 130 | ||
| 10 | 26 | 152 | 36 | 110 | 150 | ||
| 11 | 30 | 158 | 42 | 130 | 168 | ||
| 12 | 35 | 163 | 48 | 145 | 180 | ||
| 13 | 40 | 168 | 55 | 155 | |||
| 14 | 45 | 172 | 65 | 165 | |||
| 15 | 52 | 176 | 75 | 173 | |||
| 16 | 60 | 180 | 90 | 180 |
Table 2
Table of rate comparison
| No. | SLQP quantification | Bits | The method | Percentage bit |
| method | needed | proposed | reduction | |
| 1 | Low accuracy | 658 | 601 | 8.66% |
| 2 | High accuracy | 1729 | 601 | 65.24% |


