
Energy conversion path and optimization model in COVID-19 under low carbon constraints based on statistical learning theory
Abstract
This paper uses statistical learning theory and big data analysis to study the energy consumption structure of China from qualitative and quantitative aspects during COVID-19. According to the domestic and foreign scholars’ research on the optimization of energy consumption structure, the carbon emission factor is considered in the optimization of energy consumption structure. Taking the minimum energy consumption cost and carbon dioxide emission as the objective function, the carbon dioxide emission is taken as the objective function, and the total energy consumption and various energy consumption proportions as the constraint conditions, the multi-objective planning method is used to evaluate the energy consumption structure of China. The optimization model of source consumption structure is analyzed, and the medium and long-term energy transformation path and optimization model under low-carbon constraints are studied. Combined with the experimental algorithms related to big data, it is concluded that China’s economic development mainly depends on a large amount of energy consumption during the COVID-19 period. On this basis, some suggestions are put forward to realize the sustainable development of China’s economy and energy.
1Introduction
With the increasing scale of the world economy, the world energy consumption continues to grow. According to the world energy statistics yearbook 2019 issued by BP, a world-famous energy enterprise, it can be seen that the proven oil reserves in the world are now 235.8 billion tons, which can be exploited for 50 years at the current exploitation speed; the coal reserves are 860938 million tons, which can be exploited for 100 years at the current exploitation speed; The reserve of natural gas is 187.3 trillion cubic meters, which can be exploited for another 50 years at the current exploitation speed [1]. In the early stage, coal was the main source. After entering the 20th century, especially since the Second World War, the production and consumption of oil and natural gas continued to rise. In the 1960 s, oil surpassed coal for the first time, leaping to the dominant position of primary energy. Although there were two oil crises in the 1970 s, the world’s oil consumption did not experience any reduction. Since then, the proportion of oil and coal decreased slowly, while the proportion of natural gas increased. At the same time, nuclear energy, wind energy, hydropower, geothermal and other forms of new energy have been gradually developed and utilized, forming the current energy structure pattern of fossil fuel dominated and renewable energy and new energy coexisting. As far as the current situation is concerned, the energy problem is not only a short-term problem within a country, but also a long-term problem of globalization [2].
The global average temperature is now about 0.9 degrees Celsius higher than the 1951–1980 interval. Such changes may lead to more frequent extreme weather and more serious natural disasters. For example, the rise of global temperature has led to the melting of polar ice sheets and the rise of sea level has intensified the storm surge disaster. The El Nino phenomenon tends to be frequent, which greatly affects the normal circulation system. Some people believe that climate change is largely caused by human activities. Among these human factors, the most noteworthy is the increase of CO2 concentration emitted by burning fossil fuels, followed by the increase of dust produced by cement manufacturing. In addition, land use, ozone layer destruction, animal husbandry and agricultural activities, deforestation and so on will have different impacts on climate and become factors of climate change. At present, in order to better solve the energy and environmental problems, China has incorporated environmental protection and resource conservation into its basic national policies [3, 4].
Statistical learning theory (SLT) is a kind of theory that studies the machine learning law in the case of small samples. It provides a strong theoretical basis for people to systematically study the learning machine problem in the case of limited samples. On the issue of global warming in China, not all safeguard measures can be long-term. However, as long as the governments at all levels make up their minds to gradually adjust the regional industrial structure, intensify the efforts to control pollution, and with the response of the people, there will be new changes in China. this paper puts forward suggestions for optimizing China’s primary energy consumption structure from three aspects of management system, technology and policy in combination with SLT.
2Construction of energy consumption structure optimization model under the constraint of low carbon target in China
2.1Construction ideas
At present, China’s energy production is mainly based on coal. However, there are two solutions to meet the increasing energy demand of future economic growth:
– Continue to maintain the current energy production and consumption structure in China, with coal as the core. However, this will make us have to face a series of additional environmental and economic problems brought by coal production and consumption;
– At present, China’s determination of a certain amount of new subsidies, and then balancing the intensity of subsidies and the scale of installed capacity, will be the direction of policy-making. However, at the critical moment when renewable energy power generation is changing from the era of subsidies to the grid at affordable prices, the policy is still the most important factor related to the smooth transition, so how to grasp and grasp it will be a difficult point [5, 6].
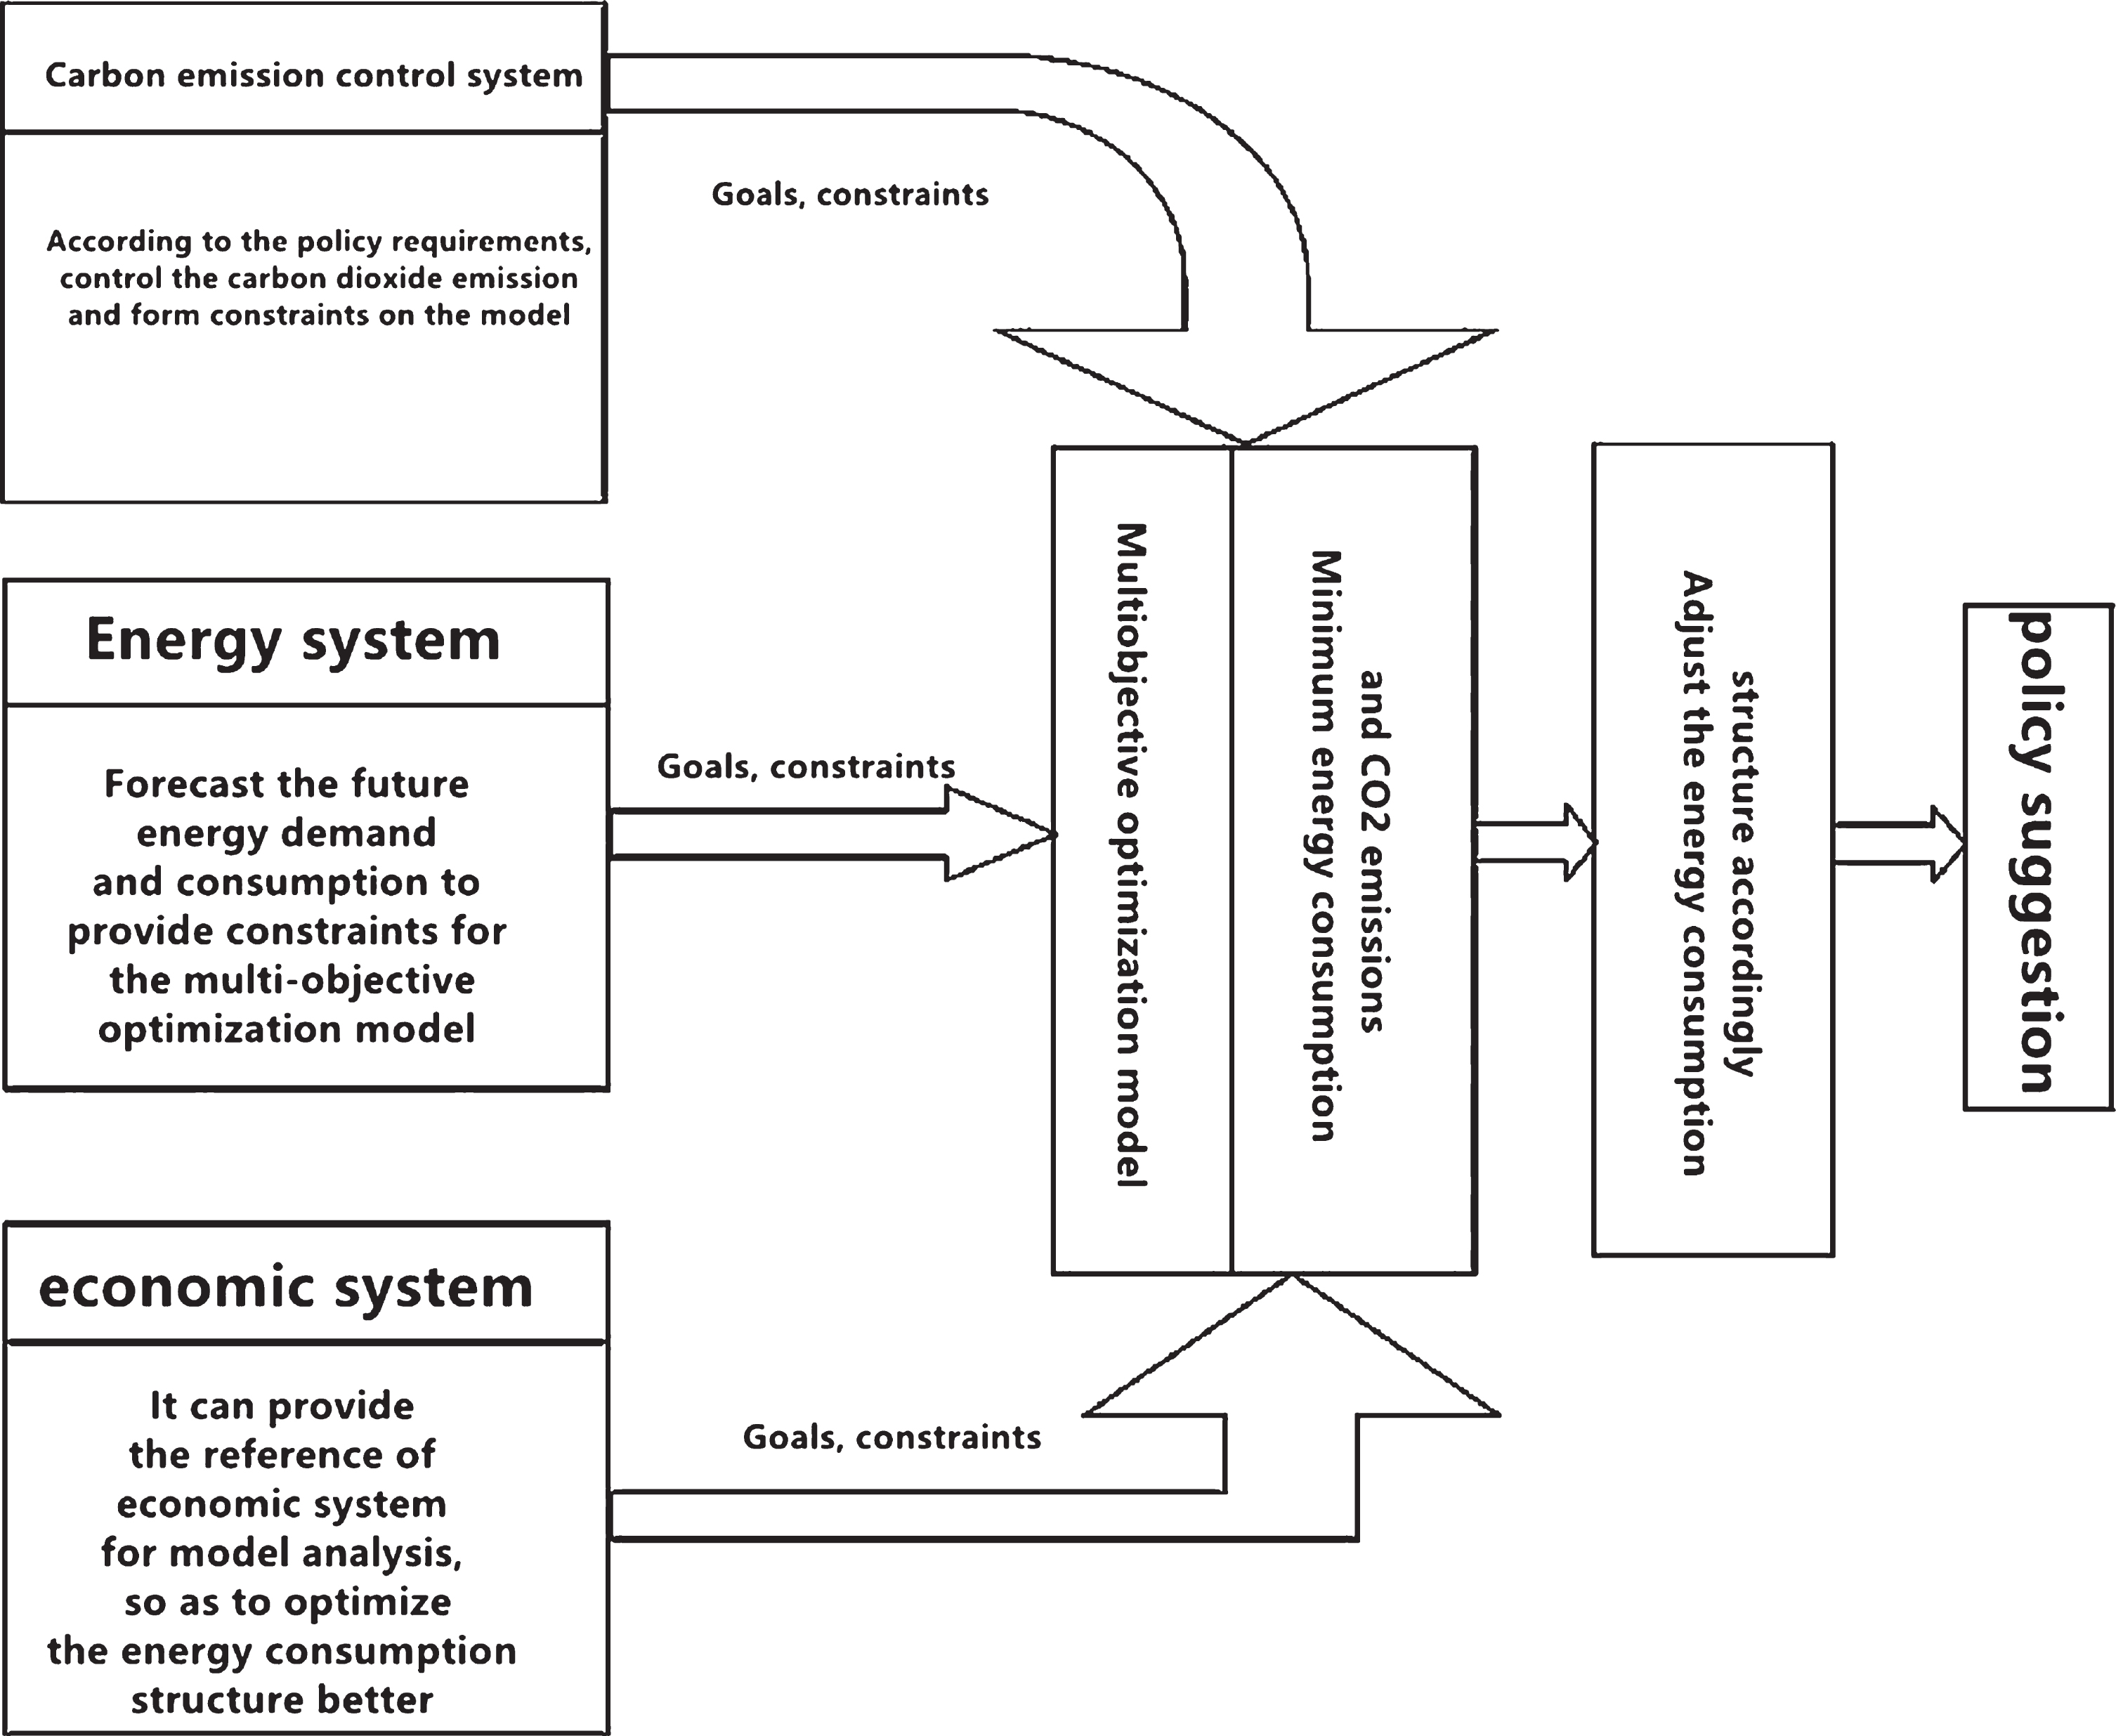
In this paper, the main idea of building the optimization model of China’s energy consumption structure under the constraints of low-carbon objectives is to decompose the objectives of carbon emission control system, energy system and each system of economic system, determine the objectives and constraints of the multi-objective optimization model, analyze the constraints of carbon emission system, energy system and economic system, and determine the constraints of the multi-objective optimization model Bundle conditions, as shown in Fig. 1.
Fig. 1
An analysis model of China’s energy consumption structure optimization and adjustment.
Carbon emission refers to the emission of greenhouse gases, which is mainly carbon dioxide emission. The carbon emission studied in this paper mainly refers to the emission of carbon dioxide produced by the combustion of fossil fuels. The calculation of carbon dioxide emissions from fossil fuel combustion is to multiply the specific energy consumption, including coal, oil, etc., by their respective carbon dioxide emission coefficients [7], so as to obtain the carbon dioxide emissions. The formula is expressed as:
The economic system mainly considers the interaction between economic development and energy consumption, and takes the stable economic development state as the economic constraint for the optimization and adjustment of energy consumption structure. The main role of the economic system is to ensure the lowest total cost of the optimized energy consumption structure, which can make the adjustment of energy structure more feasible. In this paper, we mainly consider two aspects of cost when we study the optimization of energy consumption structure under the constraints of low-carbon goals [8], namely, the external environmental cost of carbon dioxide emissions and energy consumption cost. The external environmental cost of carbon dioxide emission is mainly calculated by multiplying the carbon dioxide emission by the external emission cost per unit carbon dioxide emission. The formula is expressed as follows:
Energy consumption cost is the cost of consuming one unit of energy. The public expression is as follows:
Similar to the economic system, the role of energy system is to optimize the energy structure and ensure the energy demand is met. Based on the prediction of China’s energy consumption in 2030 and 2030 in the research on China’s medium and long term (2030 and 2050) [9] development strategy, this paper changes the threshold of energy system constraints, and further studies the optimization of China’s medium and long term energy consumption structure under the constraints of low carbon targets. The formula is expressed as:
2.2Multiobjective optimization model
In this paper, the multi-objective programming method is used to establish the optimization model. The goal of the economic system to be achieved is set according to different scenarios and the constraints under the scenarios are used to make decision-making scheme selection, focusing on the alternative of feasible scheme and the selectivity of the goal to be achieved.
There are two kinds of decision variables in the multi-objective decision-making method: discrete and continuous [10], which need to adopt discrete decision-making technology and continuous decision-making technology respectively. From the perspective of carbon emission control, this paper studies the optimization of China’s energy consumption structure in order to achieve the coordinated development of energy, economy and society. Therefore, the problem studied in this paper is a decision-making problem with continuous decision variables and infinite plans, so the weighting method in continuous decision-making technology is selected to solve the problem.
When establishing the model of energy structure optimization under the constraint of low-carbon target according to the idea of model construction, some conditions need to be assumed, as follows:
– The hypothesis model takes the optimization of energy consumption structure as a means to achieve the coordinated development of energy, economy and environment [11].
– Assuming that China’s economy continues to grow, and energy consumption increases with it, technological innovation, economic restructuring and management level improvement have no impact on energy consumption [12].
– It is assumed that the fundamental driving force of the optimization of energy consumption structure is to realize the minimization of cost, that is, the minimization of energy consumption cost and carbon dioxide emission cost.
– Assuming that carbon dioxide emissions only come from the combustion of fossil fuels, in this study, including coal, oil, natural gas and electricity.
The decision variables set in this paper are coal (x1), oil (x2), natural gas (x3), electric power (including hydropower, nuclear power, wind power and others) (x4) four primary energy consumption.
The multi-objective optimization model of weighted method based on big data operation is as follows [13–18]:
Among Rn → R, p ⩾ 2, if the objective function Zk (X) (k = 1, 2, . . . , p) and constraint gi (X) = (i = 1, 2, . . . , m) are all linear functions, then after weighting, it will be converted into a linear programming problem, and the optimal solution can be obtained by simplex method, and the solution is the non inferior solution of the linear programming.
Zk (X) (k = 1, 2, . . . , p), gi (X) = (i = 1, 2, . . . , m), then the multi-objective programming problem is a non-linear problem. The optimal solution can be obtained by K - T method, and the solution is also a non inferior solution.
Weight ω is based on the objective function Z1 (X) , Z2 (X) , Z3 (X) , . . . , Zp (X), the value Z satisfies
The optimization objective set in this paper is to minimize the cost of energy consumption and the external environmental cost of carbon dioxide emissions, and the objective function is as follows:
Among,
According to the above model framework, the constraint conditions of the objective function can be set as follows:
– Carbon dioxide emissions are within the range to be controlled:
– The total energy consumption is greater than the Planned Value:
– The changing range of China’s future energy consumption structure is:
Coal:
Petroleum:
Natural gas:
Power:
It is estimated that the change range of energy consumption structure in each region in 2030 is shown in Table 1.
Table 1
The styles defined in the IOSPressDoubleColumnJournal.dot file
| Coal | Petroleum | Natural gas | Power | |
| Beijing | 0.42–0.72 | 0.24–0.38 | 0.04–0.27 | 0.08–0.12 |
| Tianjin | 0.51–0.72 | 0.26–0.41 | 0.02–0.12 | 0.08–0.12 |
| Hebei | 0.65–0.9 | 0.09–0.29 | 0.01–0.09 | 0.08–0.12 |
| Shanxi | 0.7–0.95 | 0.05–0.18 | 0.08–0.12 | 0.08–0.12 |
| Inner | 0.72–0.93 | 0.07–0.2 | 0.08–0.12 | 0.08–0.12 |
| Mongolia | 0.51–0.84 | 0.12–0.31 | 0.03–0.11 | 0.08–0.12 |
| Liaoning | 0.57–0.86 | 0.11–0.26 | 0.01–0.09 | 0.02–0.1 |
| Jilin | 0.49–0.71 | 0.23–0.38 | 0.05–0.13 | 0.08–0.12 |
| Heilongjiang | 0.41–0.72 | 0.28–0.43 | 0.12–0.14 | 0.08–0.12 |
| Shanghai | 0.43–0.84 | 0.16–0.38 | 0.12–0.14 | 0.08–0.12 |
| Jiangsu | 0.42–0.73 | 0.24–0.39 | 0.12–0.14 | 0.03–0.11 |
| Zhejiang | 0.58–0.9 | 0.1–0.25 | 0.12–0.14 | 0.08–0.12 |
| Anhui | 0.44–0.65 | 0.25–0.4 | 0.12–0.14 | 0.1–0.18 |
| Fujian | 0.55–0.83 | 0.14–0.29 | 0.08–0.12 | 0.03–0.15 |
| Jiangxi | 0.49–0.85 | 0.15–0.37 | 0.01–0.12 | 0.08–0.12 |
| Shandong | 0.54–0.89 | 0.09–0.26 | 0.02–0.1 | 0.08–0.12 |
| Henan | 0.55–0.79 | 0.16–0.31 | 0.12–0.14 | 0.04–0.12 |
| Hubei | 0.52–0.79 | 0.14–0.34 | 0.08–0.12 | 0.07–0.15 |
| Hunan | 0.3–0.58 | 0.38–0.53 | 0.12–0.14 | 0.04–0.12 |
| Guangdong | 0.48–0.75 | 0.16–0.31 | 0.08–0.12 | 0.09–0.17 |
| Guangxi | 0.18–0.33 | 0.46–0.61 | 0.18–0.26 | 0.03–0.11 |
| Hainan | 0.4–0.73 | 0.07–0.28 | 0.13–0.21 | 0.07–0.15 |
| Chongqing | 0.35–0.68 | 0.1–0.25 | 0.15–0.23 | 0.07–0.35 |
| Sichuan | 0.57–0.68 | 0.M–0.3 | 0.02–0.1 | 0.04–0.12 |
| Guizhou | 0.55–0.8 | 0.09–0.24 | 0.03–0.11 | 0.09–0.17 |
| Yunnan | 0.45–0.81 | 0.16–0.31 | 0.02–0.22 | 0.01–0.09 |
| Shanxi | 0.45–0.77 | 0.17–0.36 | 0.08–0.12 | 0.06–0.14 |
| Gansu | 0.32–0.67 | 0.12–0.27 | 0.07–0.15 | 0.14–0.32 |
| Qinghai | 0.57–0.87 | 0.11–0.26 | 0.08–0.12 | 0.01–0.09 |
| Ningxia | 0.37–0.66 | 0.21–0.36 | 0.11–0.23 | 0.01–0.09 |
| Xinjiang | 0.42–0.72 | 0.24–0.38 | 0.04–0.27 | 0.08–0.12 |
3Model data processing
3.1Energy demand forecast
China’s energy development strategy can be summarized as the following 16 words: energy saving priority, based on domestic, coal based, diversified development. The main direction of coal is scientific development and clean and efficient transformation. With the growth of domestic gasoline consumption and the decline of crude oil production, the U.S. energy information administration predicts that the import volume of oil and other liquid fuels will again exceed the export volume in 2050, and the United States will become a net oil importer again, but the United States will still be a net exporter of natural gas and coal at that time. China’s energy consumption demand forecast from 2020 to 2050 is shown in Table 2.
Table 2
Forecast value of energy consumption demand in China in the future
| particular year | Energy consumption demand | |
| lower limit | upper limit | |
| 2020 | 4075 | 4396 |
| 2030 | 4747 | 5124 |
| 2040 | 4977 | 5543 |
| 2050 | 5399 | 5985 |
3.2Carbon dioxide emission control value
According to the research results of the major consulting project of Chinese Academy of engineering, the carbon dioxide emissions from fossil fuel combustion in 2020, 2030 and 2050 are predicted and controlled. In 2020, it will be 8.6–9.0 billion tons, and in 2030, 8.4–8.8 billion tons. By 2050, the carbon dioxide emissions from fossil energy combustion in China will be 8.2–8.5 billion tons, as shown in Table 3. According to the above prediction, the control values of China’s carbon dioxide emissions in the future are 8.5 billion tons in 2030, 8 billion tons in 2030, 7.5 billion tons in 2040 and 7 billion tons in 2050.
Table 3
Carbon dioxide emission trend in China
| Carbon dioxide emissions | |
| 2020 | 86–90 |
| 2030 | 84–88 |
| 2040 | 83–86 |
| 2050 | 82–85 |
3.3Energy consumption cost
In the prediction of China’s future energy consumption cost, the unit energy investment cost is mainly used instead of the price, and the import of energy is not considered. According to the prediction results of China Energy Research Report - regional chapter, the prediction values of various energy unit energy investment costs in 2030–2050 are shown in Table 4.
Table 4
Unit energy investment cost
| 2010 | 2020 | 2030 | 2040 | 2050 | |
| Coal | 736 | 1049 | 1528 | 2133 | 2976 |
| Petroleum | 562 | 7894 | 13625 | 17529 | 23841 |
| Natural Gas | 562 | 7894 | 13625 | 17529 | 23841 |
| Primary Power | 97100000 | 13700000 | 19700000 | 27400000 | 37900000 |
3.4External emission cost of carbon dioxide
According to the research results of experts, it is determined that the carbon emission coefficients of various energy sources calculated by carbon are 0.656t/tce for coal, 0.586t/tce for oil and 0.442t/tce for natural gas respectively, and that one ton of carbon can produce about 3.67t carbon dioxide after combustion in oxygen, so the carbon emission coefficients of coal, oil and natural gas are 2.408t/tce, 2.151t/tce and 1.622t/tce. In addition, according to the research of relevant literature, the external emission cost of carbon dioxide in this paper is taken as 50 US dollars / ton, which is converted to 307.5 yuan / ton at the current exchange rate of 6.15. Therefore, the external carbon dioxide emission costs of various energy sources are shown in Table 5.
Table 5
Carbon dioxide emission coefficient and its external emission cost
| Coal | Petroleum | Natural Gas | |
| Carbon dioxide emission coefficient (t / tce) | 2.408 | 2.151 | 1.622 |
| External cost of carbon dioxide emission (yuan / T) | 740.46 | 661.4325 | 498.765 |
3.5Values of ω1 and ω2
When taking values of ω1 and ω2, we need to pay attention to the following points:
– When we change the weight ω1 value to find the non inferior solution, we should not be too fast, otherwise we may cross a certain pole and miss some real non inferior solutions.
– The weight ω1 value cannot be negative. For the objective function Z (x), the weight value ω1 is negative, which means that the maximization problem is transformed into the minimization problem, so the solution found through multi-objective programming is likely to be a bad solution.
– It is a complex work to solve the problem of multi-objective programming with many objective functions and constraints, and it is not necessarily able to find all the non inferior solutions. However, although this problem exists, it can still find some of the non inferior solutions by using the multi-objective programming method.
This paper takes the same weight for two targets in model operation, that is, (ω1, ω2) = (1, 1).
4Optimization of energy consumption structure in medium and long term in China under the constraint of low carbon target
4.1Model operation results
According to the above big data objective functions and constraints, combined with big data, the multi-objective optimization model of China’s energy consumption structure in 2030 is obtained.
Using MATLAB 7.0 to solve the above model and adjust the threshold value, we can get the results of energy consumption structure optimization in 2030, 2040 and 2050.
4.2Analysis of model optimization results
– According to the comparison between the future carbon dioxide emission of China after model optimization in Fig. 2 and the current carbon dioxide emission trend, it can be seen that after the introduction of low-carbon constraints into the model, the carbon emission has been effectively controlled, and by 2050, the carbon dioxide emission from fossil fuel combustion in China can be controlled at about 8 billion tons.
– Starting from the control of carbon emissions, the carbon emission control system is introduced into the model, so that the proportion of coal consumption in the total energy consumption gradually decreases, from 68.4% in 2011 to 62% in 2030, to 41.63% in 2030, and finally to about 40%, which is in a stable state.
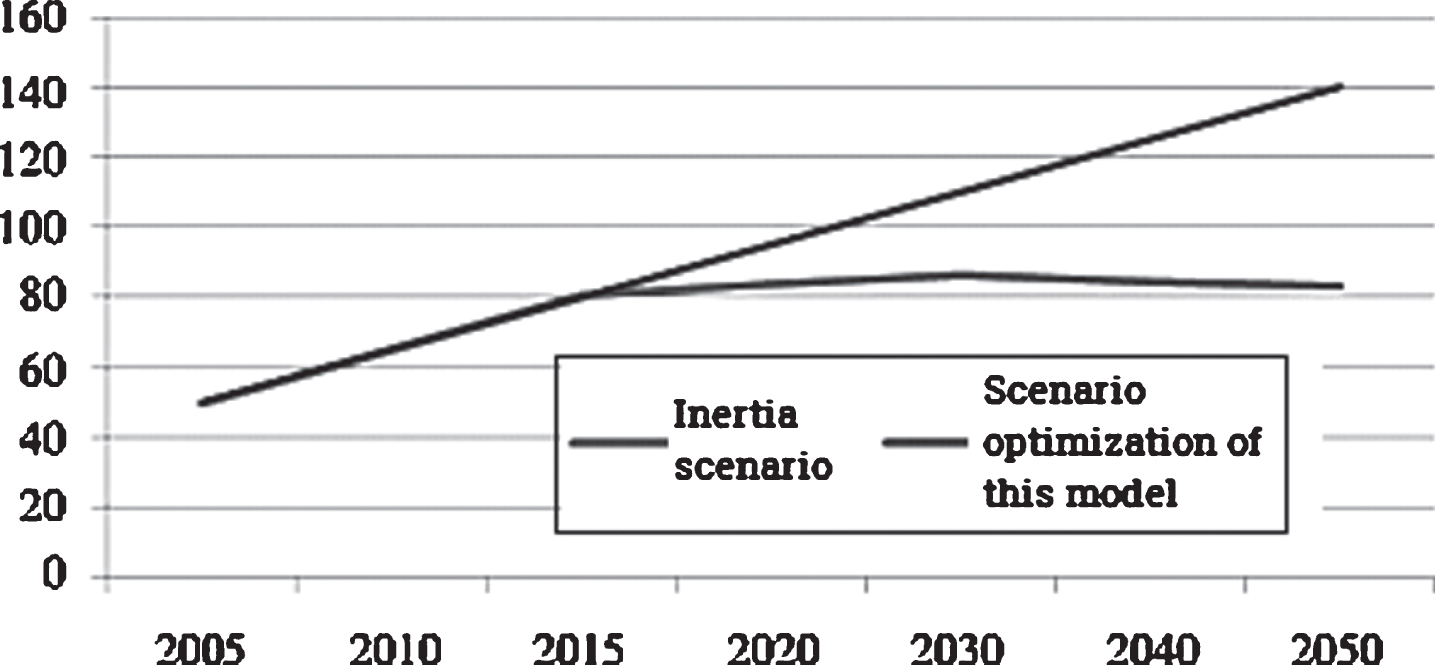
– Compared with coal and oil, the emission of carbon dioxide from natural gas combustion is less, and the current price of natural gas is relatively appropriate. With the development of social economy, the proportion of natural gas consumption in the total energy consumption in the model will gradually increase. As shown in Fig. 3, compared with coal and oil, the carbon dioxide emitted by natural gas combustion is less, and the current price of natural gas is relatively appropriate. With the development of social economy, the proportion of natural gas consumption in total energy consumption in the model will gradually increase, as shown in Fig. 3.
– With the continuous development of hydropower, nuclear power, wind power and other technologies, and people pay more and more attention to low carbon, the role of electricity as a clean alternative energy is becoming more and more obvious, the proportion of electricity in the total energy consumption gradually increases, from 10% in 2030 to 27.31% in 2025, and its future development is shown in Fig. 3.
Fig. 2
Carbon dioxide emissions from fossil fuel combustion (unit: 100 million tons).
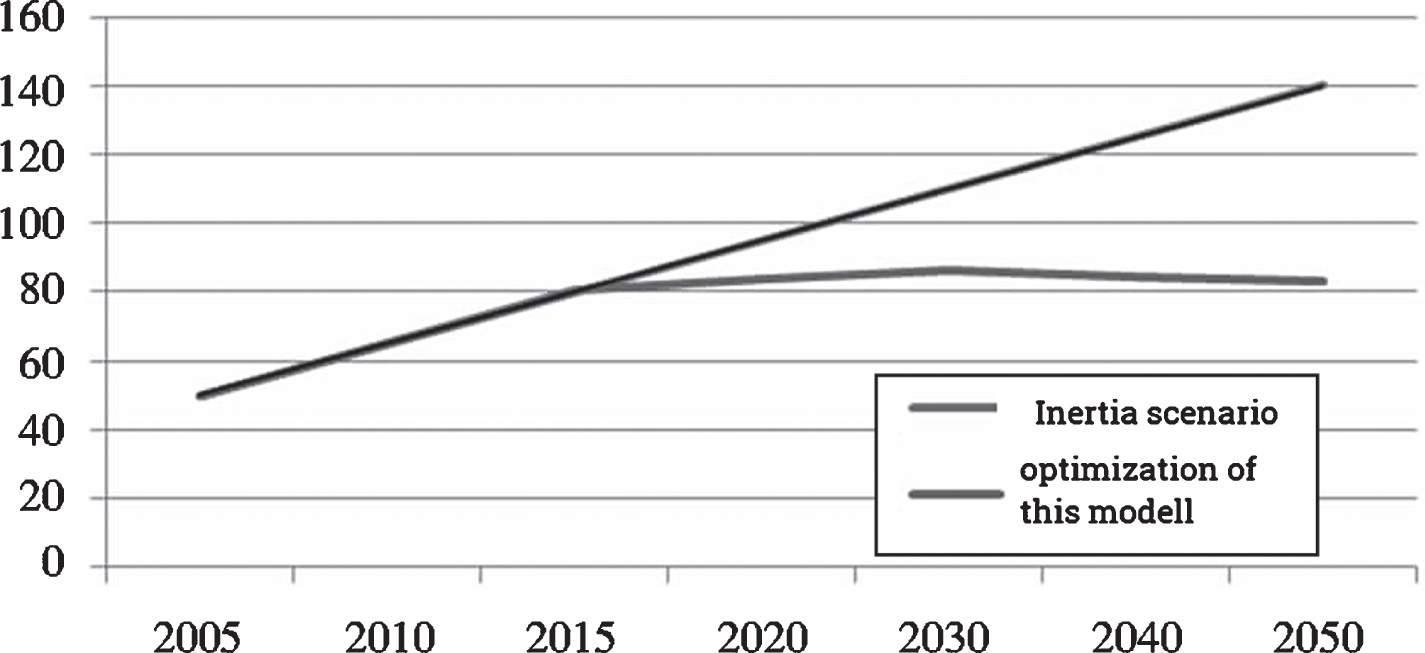
Fig. 3
Setting for document template.
5Conclusions and prospects
The main conclusions are as follows
The main components of thermal power are coal power, gas power generation and oil power generation. Coal power and oil power are fossil energy power generation with high carbon and high pollution. However, the number of oil power generation in China is very small, most of which is coal power. In the future, natural gas power generation will be the main power generation of low-carbon clean energy. In fact, from the perspective of global big data analysis, the intermittent, stochastic, instability and safety problems of non-fossil energy power generation such as hydropower, wind power, solar photovoltaic, nuclear power have not been completely overcome. Therefore, the dominant position of thermal power generation in the future will not be shaken for a long time.
Through the analysis of the optimization results of energy consumption structure in 2030, we can understand the differences of energy consumption structure in different regions under the control of carbon dioxide, and solve the energy consumption problems of different regions according to local conditions.
Vigorously develop new energy sources. From 2030 to 2050, China’s medium and long-term energy consumption structure optimization results can be seen that under the premise of carbon emission control, China’s energy consumption structure has gradually changed and electricity consumption has increased significantly. Therefore, vigorously developing new energy and looking for cleaner, more efficient and cheaper new energy will be the main direction of China’s energy development in the future
China’s energy structure is still relatively backward, and it is difficult to maintain sustainable development. In addition, China’s energy utilization rate is also at a low level. China’s energy waste is serious, which is extremely unfavorable to the society with limited resources. There is still a lot of work to be done to improve energy efficiency. First, adjust the industrial structure and vigorously promote the development of the tertiary industry. Industrial development should take scientific and technological innovation as the main driving force to improve energy efficiency through the development and development of high efficiency and low energy consumption products; the second is to continuously develop technology to improve the energy consumption of product production, starting from each product for energy conservation and emission reduction; finally, for continuous innovation and development, the development of technology and the progress of enterprises depend on technology. The government should adopt policies to promote the scientific and technological innovation of enterprises, which can not only bring better benefits to enterprises, but also promote the development of low-carbon economy. Only in this way can we improve the energy utilization rate, optimize the energy structure and continuously promote the national environmental development..
The introduction of industrial structure into big data model can study the impact of industrial change on energy consumption structure. This paper only considers the development of the whole economy, but the demand for energy consumption in different industries is different. Therefore, we can consider the change of industrial structure in the model, change the threshold value of the model by adjusting the industrial structure, and then compare the optimization results, so as to find a low-carbon industrial structure when optimizing China’s energy consumption structure.
Acknowledgments
This paper is supported by National Social Science Foundation of China. (No. 16BJY054).
References
[1] | Nobuhito S. , Yoshida M. , Hirata H. and Kagawa Y. , Reconstitution of vesicles capable of energy transformation from phospholipids and adenosine triphosphatase of a thermophilic bacterium, Journal of Biochemistry 81: (2) ((1977) ), 519–528. |
[2] | Mingxuan P.L. , Donaldson J.A. and Zhang Q.F. , The transformation of china’s agriculture system and its impact on southeast Asia, Renewable & Sustainable Energy Reviews 42: (1764) ((2011) ), 1370–1384. |
[3] | Chai Q. and Zhang X. , Technologies and policies for the transition to a sustainable energy system in china, Energy 35: (10) ((2010) ), 3995–4002. |
[4] | Zhang Y. , Liu H. and Fath B.D. , Synergism analysis of an urban metabolic system: model development and a case study for Beijing, China, Ecological Modelling 272: ((2014) ), 188–197. |
[5] | Jia P. , Li K. and Shao S. , Choice of technological change for China’s low-carbon development: evidence from three urban agglomerations, Journal of Environmental Management 206: (JAN.15) ((2018) ), 1308–1319. |
[6] | Wang C. , Chen J. and Zou J. , Decomposition of energy-related co2 emission in china: 1957–2000. (2005), Energy, 30. |
[7] | Wang Y. and He S. , The research of china’s foreign trade transformation based on the perspective of the connotation of energy under the background of ecological civilization, Synthetic Communications 29: (13) ((2015) ), 2271–2276. |
[8] | Chaofeng S. , Yang G. Z. and Wan , et al., Performance analysis of co2 emissions and energy efficiency of metal industries in china, Journal of Environmental Management (2014). |
[9] | Zelonijs L. , Energy transformation in the earth’s magnetosphere, International Journal of Mechanical Sciences 39: (2) ((1951) ), 221–231. |
[10] | Zhu Y.Y. , Wang G.T. and Li Z.T. , Molecular recognition with linear molecules as receptors, Current Organic Chemistry 15: (9) ((2011) ), 1266–1292. |
[11] | Prasad V.K. , Badarinath K.V.S. and Eaturu A. , Effects of precipitation, temperature and topographic parameters on evervegetation greenery in the western ghats, India, International Journal of Climatology 28: (13) ((2008) ), 1807–1819. |
[12] | Ho S.S.H. , Ip H.S.S. , Ho K.F. , Ng L.P.T. , Dai W.T. , Cao J. , et al., Evaluation of hazardous airborne carbonyls on a university campus in southern china, Journal of the Air & Waste Management Association 64: (8) ((2014) ), 903–916. |
[13] | Tsujimoto T. , Sakamoto S. , Hirano H. and Watanabe Y. , Energy transformation from heat energy to sound energy in rijke-tube: a study on mechanism of generating sound in transition, Journal of the Atmospheric Sciences 32: (9) ((1975) ), 1838–1847. |
[14] | Lei Z. , Yang Y. and Jiayang L. , China’s promoting energy-efficient products for the benefit of the people program in: results and analysis of the consumer impact study, Applied Energy 133: (nov.15) ((2014) ), 22–32. |
[15] | Li F.R. , Gao C.Y. , Zhao H.L. and Li X.Y. , Soil conservation effectiveness and energy efficiency of alternative rotations and continuous wheat cropping in the loess plateau of northwest china, Agriculture Ecosystems and Environment 91: (1–3) ((2002) ), 101–111. |
[16] | Li N. and Chen W. , Modeling china’s interprovincial coal transportation under low carbon transition, Applied Energy 222: ((2018) ), 267–279. |
[17] | Yang S. , Bai Y. , Wang S. and Feng N. , Evaluating the transformation of china’s industrial development mode during –, Renewable & Sustainable Energy Reviews 20: (apr.) ((2013) ), 585–594. |
[18] | Zhou Y. , Liu Y. , Wu W. and Li Y. , Effects of rural-urban development transformation on energy consumption and co2 emissions: a regional analysis in China, Renewable and Sustainable Energy Reviews 52: (53) ((2015) ), 863–875. |


