
Prediction and comparison of the impact of COVID-19 epidemic on the financial industry of major countries based on neural intelligent algorithm
Abstract
The global economy appears the trend of anti-globalization under the influence of COVID-19. Based on the input-output table of lead database from 2006 to 2020, this paper divides the factors that affect the development of financial industry in China, the United States and Russia into six aspects: price, intermediate input, household consumption, government consumption, export and import. ADGA-BP neural network model is proposed in this paper, which is based on six aspects of price, intermediate input, consumer, government consumption, export and import. The intermediate input is decomposed from the perspective of industrial structure to study the interrelationship between financial industry and other industries in the three countries. The results show that the intermediate input is the main factor in the development of financial industry in the three countries, but the source industries of the intermediate input are not the same; the two factors of household consumption and price are closely related to the development of financial industry in the three countries, and they all play a role in promoting China, while the relationship between household consumption and the United States and between price and Russia is reverse; Government consumption only has a significant impact on Russia; from the perspective of mutual influence, the mutual investment between the financial industry of China and the United States is relatively large, while the relationship between the Russian financial industry and the two countries is relatively weak. It shows that under the background of covid-19, the development of financial industry is affected.
1Introduction
The gradual spread of covid-19 has affected the economic globalization. China’s financial industry continues to explore and develop. However, with the deep development of Global trade cooperation, global value chain (GVC) analysis becomes more and more important. In the context of global value chain, a country’s financial industry is not only affected by domestic factors, but also by international factors. Therefore, the development of China’s financial industry into the analysis framework of the global value chain, explore the domestic and foreign factors that affect its development, has a certain directional role in the healthy development of China’s financial industry [1, 2].
According to the description of covid-19 transmission route in Chinese medical treatment program, the main transmission route is through respiratory droplets and contact. In short, novel coronavirus is only exposed to one way: droplets directly spit into the mucosa, such as mouth, eye and nose, mainly in close contact, such as speaking loudly, unprotected Department of Stomatology, ophthalmology, respiratory tract operation, etc., through the hand contact mouth, eyes and nose of the new coronavirus. Therefore, wearing masks and washing hands are very important to cut off the transmission channels. In this vulnerable situation, the financial industry of various countries is impacted.
As a global financial center, the United States has certain advantages in capital and technology, and its financial industry has been growing faster than other sectors [3]. Although China’s financial service industry has achieved rapid development, the competitiveness of the financial industry is still far behind that of the United States [4–8]. China and Russia are two big BRICs countries, both of which are transition countries. Since the 1990 s, China and Russia have implemented the institutional changes of financial system. However, due to the different domestic political and economic environment, China has adopted a gradual reform of the financial system. Russia has gone through the process of reform from radical to gradual. The comparison of the development of the financial industry between China and Russia also has some enlightenment for the development of China’s financial industry [9–11]. Therefore, this paper selects China, the United States and Russia as the representatives of the fast-growing financial industry of emerging countries, the financial industry of western developed countries and the big heavy industry country whose status needs to be improved to carry out the international comparison of the influencing factors of the development of financial industry, which has practical guiding significance for the development of China’s financial industry [12].
Therefore, based on the neural network model, this paper simulates and forecasts the development speed and quality of the financial industry, reveals the development trend of the financial industry under the multi-objective condition of the new normal, and provides a reference for the government to control the financial industry, optimize the structure of the financial industry, and promote the financial industry to support the new normal [13].
2Journals reviewed
For the development factors of financial industry, foreign scholars have some qualitative research. Scholars believe that the development of a country’s financial industry is mainly limited by its own financial industry foundation. The basis of financial industry is mainly determined by financial institutions, financial technology and industry rules. Scholars have studied the impact of European bank liquidity on the development of the financial industry, pointing out that as an important part of the service industry, the financial industry plays an important role in promoting the development of the service industry. Scholars use the input-output table to study the structural changes of the service industry in the UK. The sources of the growth of the service industry are divided into two aspects: price and quantity. The quantitative reasons can be specific to the changes caused by the communication demand of the commercial service industry and the changes caused by the industrial production demand. Scholars studied the situation of Swedish enterprises from 1992 to 2000, and believed that technological change and the growth of TFP played an important role in promoting the development of Swedish service industry. Scholars believe that the rapid development of economy and the improvement of people’s income provide an important environmental guarantee for the rise of service industry, and the socialized division of labor and industrial adjustment lay the foundation for the improvement of the importance of service industry [14–19].
Financial time series forecasting is mainly based on ARIMA and arch models. Some scholars use ARIMA model to predict financial time series. For example, some scholars use amima model and MLPs to predict S & P 500 index, Shenzhen Composite Index and Dow Jones industrial index. This model has become a common model to deal with stationary time series, but it is difficult to explain the nonlinear relationship between variables and accurately predict the complex time series such as finance based on the linear relationship. In order to improve the prediction effect of time series, the regression conditional heteroscedasticity (arch) model was proposed. The generalized autoregressive conditional heteroscedasticity (GARCH) model has been proposed and developed, and has attracted the attention of scholars in the prediction of financial time series data. For example, GARCH, EGARCH, mmgarch, FIGARCH and other methods predict the volatility and risk value of international crude oil price. Based on EGARCH model and Markov model, Chinese scholars predict the volatility of Shanghai interbank offered rate.
However, ARIMA and arch models have a common disadvantage. They all need to describe the linear or nonlinear relationship between variables through specific expressions. With the recognition of the complexity of the financial system, it is found that the relationship between the nonlinear financial time series data is very complex, and the nonlinear characteristics cannot be fitted with a specific model. This disadvantage seriously affects the prediction effect of this kind of model.
With the rise of intelligent prediction model, neural network model provides a new way to solve this kind of problem. As a natural non-linear modeling, neural network model can mine the complex non-linear characteristics behind the data, and it does not need to assume the specific function form between the data in advance. It has attracted more and more attention in the field of financial non-linear time series prediction, among which the most representative is BP neural network model. BP neural network is used to evaluate the internal control activities of enterprises. BP neural network technology is used to build the performance evaluation model of listed commercial banks, and to train and simulate the performance of sample banks.
But BP neural network also has some limitations. Scholars point out that BP neural network model does not have the ability of global search, and local minimum value is easy to be trapped. Learning convergence speed is too slow. The single application of BP neural network is often ineffective. Therefore, it is necessary to optimize the initial weight of BP neural network with evolutionary algorithm. Scholars point out that genetic algorithm has the characteristics of global optimization. BP neural network is easy to fall into local minimum and slow convergence speed in prediction, which can be overcome and more effective in prediction. The stock return is predicted by the cyclic neural network model optimized by genetic algorithm. Genetic algorithm (GA) and simulated annealing (SA) are used to improve the prediction accuracy of BP neural network, and the investment yield of Japanese stock is effectively predicted. Chinese scholars predict the financial security situation in 2015. Through comparative analysis, it is found that GA-ANN has better fitting accuracy than radial basis function neural network, BP propagation neural network and generalized regression neural network. GA-BP model was adopted. Simulate the interaction between monetary policy regulation and economic growth rate and quality under the new normal conditions, and predict the economic growth rate. These scholars all think that genetic algorithm can overcome the local convergence problem of neural network, and the combination of genetic algorithm and neural network is more accurate than the single neural network. With the deepening of research, scholars are committed to the improvement of genetic algorithm, and propose a prediction model based on the combination of genetic algorithm rough set attribute reduction method and neural network to predict the stock. The operation speed and accuracy of the neural network model optimized by genetic algorithm are further improved.
It can be seen that genetic algorithm combined with neural network model has been used to predict the stock market, foreign exchange market and other financial time series data, which is the direction of the future research and development of complex financial system prediction. However, there are two problems in the existing research: first, the single genetic algorithm is usually combined with neural network, while the genetic algorithm has some problems such as slow convergence speed and “premature” convergence in the process of optimization, which need to be improved; Second, it focuses on the construction of multiple input and single output models, such as the prediction of single variables such as stock market returns, stock prices, and so on.
In contrast, this paper overcomes the limitations of the existing research, uses adaptive genetic algorithm to optimize BP neural network to build a multi-layer network structure, multi input and multi output simulation prediction model, and compares the results of genetic algorithm to optimize BP neural network simulation model, to simulate and predict the development trend of financial industry system under the new normal and multi-objective. The innovation of this paper is mainly reflected in two aspects: first, the selection of research content not only considers the goal of considering both the development speed and quality of the financial industry, but also combines the new normal multi-objective conditions; Secondly, the selection of research methods can not only improve the operation speed and convergence accuracy of traditional neural network model, but also reveal the complex characteristics of non-linear, multi input and multi output of financial industry system, which makes the research process closer to reality and the research results more reliable. This paper not only has an important guiding role in understanding the development of China’s financial industry under the new normal and promoting financial support for the development of China’s economic new normal, but also has an important theoretical significance in enriching and developing the research paradigms and methods of financial industry theory.
To sum up, although the domestic literature has made some empirical analysis on the factors affecting the development of the service industry, and the foreign literature has also made qualitative research on the factors affecting the development of the financial industry, there is no literature that has decomposed the factors affecting the development of the financial industry, let alone has not used the noncompetitive input-output method to do in-depth quantitative research. However, it is an urgent issue for us to understand why the financial industry develops and what factors promote it, and to make an international comparison of these factors. In order to explore the above problems, this paper analyzes the development of financial industry from a structural perspective. Based on wiod’s noncompetitive input-output table, this paper quantitatively analyzes the reasons for the growth of China, the United States and Russia’s financial industry from six factors: price, domestic intermediate input, import, household consumption, government consumption and export, and makes a comparison among the three countries. Based on the research of the final demand factors of the financial industry and the methods used when the proportion of China’s service industry changes, this paper makes two improvements: first, because the investment factors show the formation of fixed capital in the input-output table, and the service industry has the characteristics of nonphysical products, so the impact of investment on the whole service industry including the financial industry is very small, this paper will delete it; Second, this paper further decomposes the intermediate input factors among the six structural factors, and studies the internal relationship of the three countries’ financial industry from the perspective of mutual investment in the financial industry between China, the United States and Russia.
3Research design
3.1Basic principles of the model
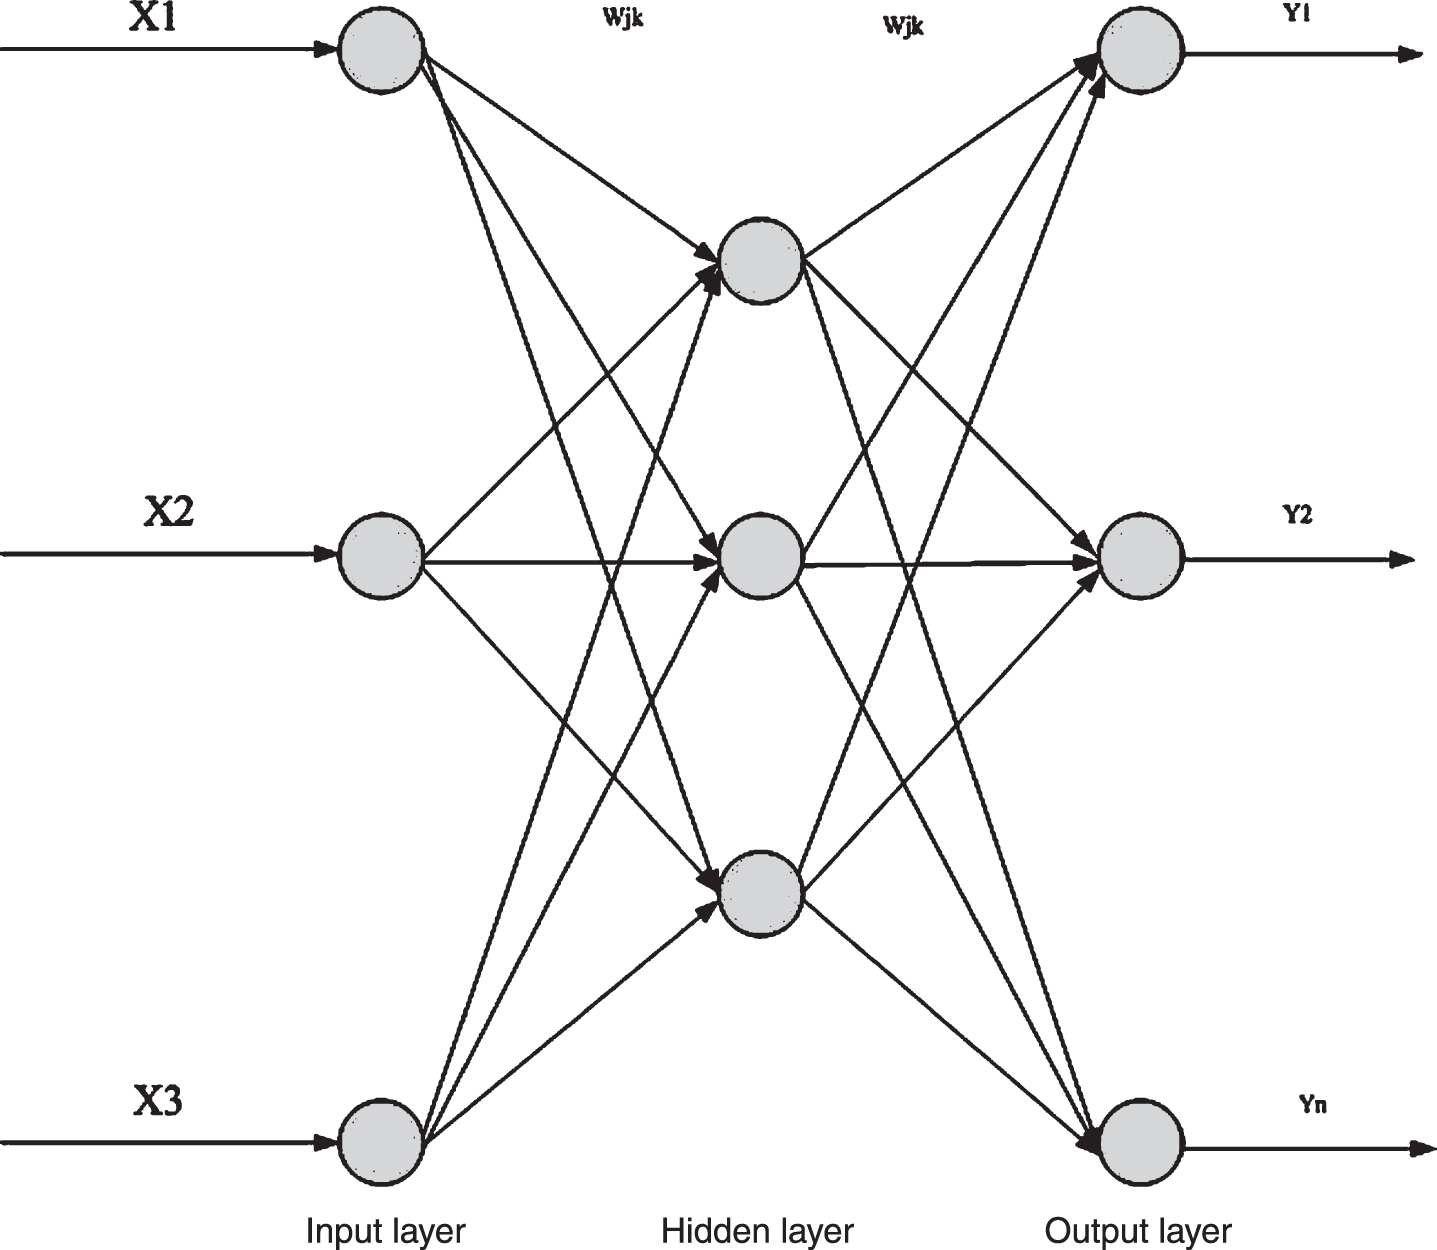
The hidden layer is composed of several independent neurons, and the neurons in each layer do not interact with each other, and all the neurons in each layer have signal transmission, as shown in Fig. 1.
Fig. 1
BP neural network structure chart.
Genetic algorithms (GA) is a kind of random global search and optimization method, which is developed by imitating natural selection and evolution of species. By improving BP neural network with genetic algorithm, the better initial weights and thresholds of neural network can be obtained, the local minimum of network training can be avoided, and the convergence speed can be improved. However, due to the fixed parameter setting of genetic algorithm, there is certain randomness and blindness in the process of optimization, which leads to stagnation near the local optimal solution in the late stage of search, slow down the population evolution speed, even non evolution phenomenon, and finally no optimal solution can be found. Adaptive genetic algorithm (adga) effectively solves the randomness and blindness of genetic algorithm selection, crossover and mutation. It can adaptively change the size of crossover probability and mutation probability in the process of algorithm implementation.
The randomness of initial weight and threshold of BP neural network is avoided. The optimal initial value is obtained. The generalization mapping ability of BP neural network is effectively improved. Neural network has fast convergence and strong learning ability. The new network structure formed by the combination of adaptive genetic algorithm and BP neural network can improve the performance of neural network. It has both the self-learning ability of neural network and the global optimization search ability of adaptive genetic algorithm. Therefore, ADGA-NP neural network model is better than single neural network model and GA-BP neural network model in predicting the development trend of financial industry system under the new normal.
3.2Model construction
The development trend of financial industry is influenced not only by the allocation of internal financial resources, but also by other external factors such as new normal multi-objective conditions. All kinds of influencing factors have different effects, degrees and directions on the financial industry, and there are complex nonlinear relationships. How to determine the main influencing factors and the weight of each factor has become a difficult problem to reveal the development of the financial industry system. Adga-bp neural network can extract all kinds of information in financial industry system and new normal environment, learn the characteristics of new normal and financial industry system, and train the network structure of financial industry system. The optimal weight sequence of financial industry system is output. The optimal simulation network is obtained. Under the condition of new normal and multi-objective, the development trend of financial industry system is predicted more scientifically. The development trend of financial industry is influenced not only by the allocation of internal financial resources, but also by other external factors such as new normal multi-objective conditions. All kinds of influencing factors have different effects, degrees and directions on the financial industry, and there are complex nonlinear relationships. How to determine the main influencing factors and the weight of each factor has become a difficult problem to reveal the development of the financial industry system. Adga-bp neural network can extract all kinds of information in financial industry system and new normal environment, learn the characteristics of new normal and financial industry system, and train the network structure of financial industry system. The optimal weight sequence of financial industry system is output. The optimal simulation network is obtained. Under the condition of new normal and multi-objective, the development trend of financial industry system is predicted more scientifically.
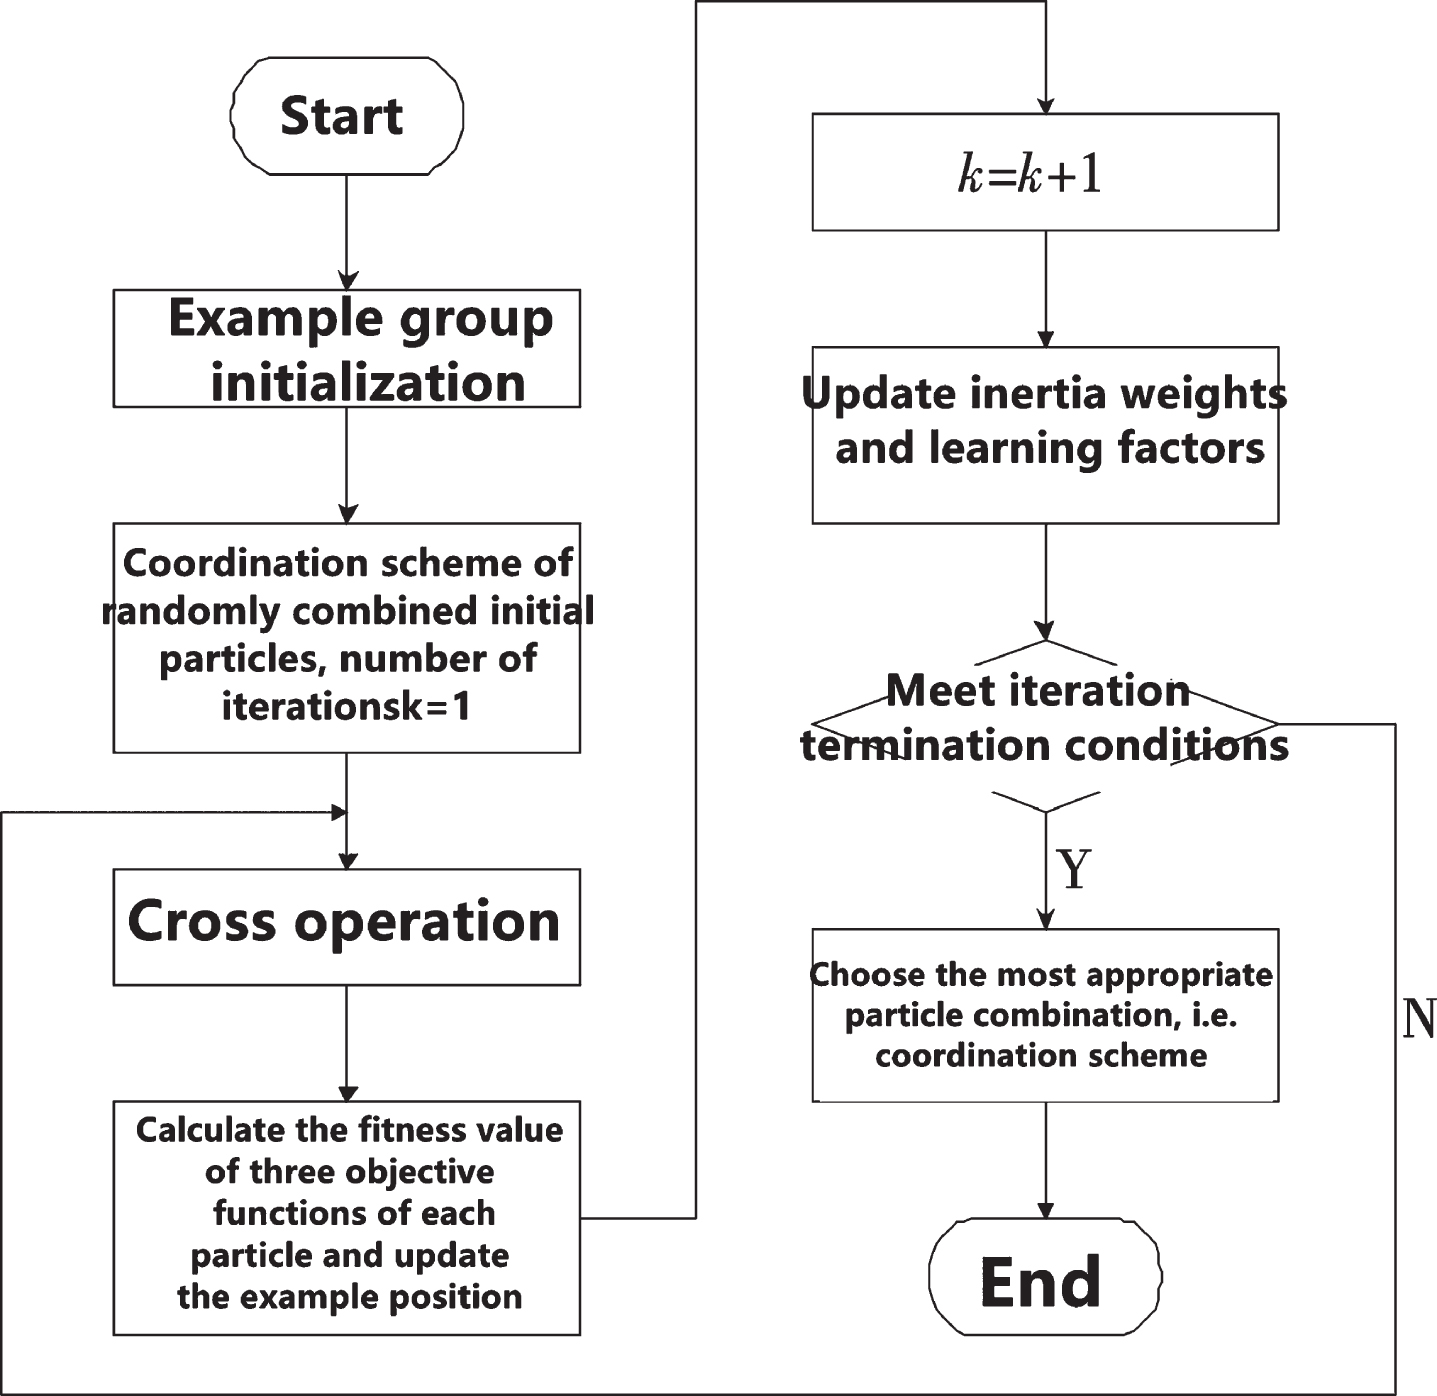
In this paper, an adaptive genetic algorithm is proposed to optimize the prediction model of BP neural network for financial industry system under the condition of new normal and multi-objective. The main steps are shown in Fig. 2.
Fig. 2
Flow chart of BP neural network optimized by adaptive genetic algorithm.
Firstly, the structure of BP neural network is determined, including the number of layers, input layer and output layer neuron nodes, training samples and test samples.
Set the number of input layer nodes n, input vector X = (x1, ⋯ , xi, ⋯ xn), hidden layer nodes m, hidden layer output vector H = (h1, ⋯ , hj, ⋯ hm), output layer nodes k, output layer output vector Y = (y1, ⋯ , yl, ⋯ yk). wij, vjlis the connection weight of input layer to hidden layer and hidden layer to output layer. σi, θ is the threshold value of hidden layer and output layer respectively. The relationship between each layer is as follows:
(1)
(2)
Where g (•) is the transfer function.
The next step is to calculate the fitness value of the individual, and select the operation according to the size of the fitness. The fitness function is calculated by the reciprocal of the sum of squares of the network output errors:
(3)
(4)
Where m is the number of training samples, yk is the expected output value of the k-th node of the network, and
The purpose of selection operation is to select excellent individuals from the population. In this paper, the strategy of Roulette is used to select the genetic parent individuals, and the replication samples are randomly selected according to the following probability values:
(5)
Where n is the population size, the smaller Pi is, the more likely the corresponding individual will be selected.
In the fourth step, the adaptive genetic algorithm is used to carry out the adaptive crossover and mutation operation, and the optimal weights and thresholds are obtained, which are output as the initial weights and thresholds of BP network.
The determination of adaptive crossover probability and mutation probability is the key of genetic algorithm. In this paper, adaptive genetic algorithm is used to make the adaptive crossover probability and adaptive mutation probability automatically change with the size of fitness. The expressions of adaptive cross probability Pc and adaptive variable probability Pm are as follows:
(6)
(7)
Among them, fmax is the maximum fitness value of the population, favg is the average fitness value of the population, f is the larger fitness value of the two crossed individuals, f is the fitness value of the individuals to be mutated, and Pc1, Pc2, Pm1 and Pm2 are constants.
In the fifth step, the training sample is used to adjust the weight through the training function until the training target error is satisfied. The L-M optimization algorithm based on gradient descent and Gauss Newton method of trainlm function is used as the training function of BP neural network. The training samples are trained in the whole solution space to get a simulation network.
The sixth step uses the simulation network to train the test samples. When the error between the network output and the expected output reaches the preset error convergence level, after the network training, the optimal network weight sequence of the financial industry system is obtained, corresponding to a trained optimal simulation network, which is the adaptive genetic algorithm optimization of the development trend of the financial industry under the new normal conditions The model can be used to simulate, control and predict the impact of financial industry system under the new normal condition.
4Structural decomposition of the development of financial industry in China, the United States and Russia under the epidemic situation
In recent years, China’s financial industry has experienced rapid development and gradually to mature stage. According to the latest data from the National Bureau of statistics, the added value of China’s financial industry in 2019 is 3353.476 billion yuan, and its contribution to the added value of the whole service industry has increased from 9.8% in 2010 to 13.8% in 2019. But from 2010 to 2020, the fluctuation of different factors has different trends. According to Equation (7), the calculation results are presented in the form of percentage, as shown in Table 1.
Table 1
The styles defined in the IOSPressDoubleColumnJournal.dot file
| Particular Year | Price factor | Intermediate input | Consumption of residents | ||||||
| China | The United States | Russia | China | The United States | Russia | China | The United States | Russia | |
| 2006 | 8.23 | 3.04 | 3.80 | 3.76 | –0.52 | –3.10 | 5.74 | 0.52 | 0.27 |
| 2007 | –6.24 | –5.88 | –35.78 | 4.91 | 3.66 | 24.62 | –0.03 | 2.16 | 9.08 |
| 2008 | 0.68 | 1.55 | –4.21 | 7.58 | 4.39 | 19.77 | 3.43 | 1.44 | 6.65 |
| 2009 | 2.16 | 0.82 | 84.41 | 8.42 | 2.86 | –10.95 | 4.32 | 1.37 | –4.89 |
| 2010 | –0.47 | –0.83 | –35.28 | 4.72 | –4.90 | 6.40 | 0.80 | –1.39 | 1.52 |
| 2011 | –1.06 | 3.04 | –13.13 | 8.44 | –0.96 | 3.25 | 2.20 | –1.58 | 1.28 |
| 2012 | 2.13 | –0.43 | –26.62 | 9.42 | 1.80 | –16.21 | 8.65 | –1.34 | 0.17 |
| 2013 | 3.18 | 0.67 | 25.22 | 5.67 | 2.09 | –2.82 | 6.03 | 0.12 | –1.41 |
| 2014 | –0.70 | –0.73 | 3.82 | 7.43 | 0.48 | –5.12 | 5.26 | –0.77 | –0.48 |
| 2015 | 4.96 | –0.03 | –6.78 | 14.18 | 0.76 | –2.32 | 9.44 | –0.64 | –1.05 |
| 2016 | 23.28 | 1.01 | –3.66 | 11.54 | 2.54 | –0.20 | 9.24 | 0.15 | –0.41 |
| 2017 | –5.50 | –0.13 | 4.82 | 6.04 | –3.74 | –0.95 | 1.52 | –0.63 | –1.55 |
| 2018 | –21.60 | –4.20 | –30.04 | 9.42 | 1.23 | 6.57 | 6.07 | –0.43 | 5.35 |
| 2019 | 11.83 | 3.31 | 26.25 | 4.79 | –3.49 | –5.43 | 3.61 | –3.19 | –3.25 |
| 2020 | 1.35 | 0.10 | 1.03 | 3.31 | –2.20 | –4.10 | 2.68 | –1.34 | –2.69 |
| Total | 22.23 | 1.32 | –6.14 | 109.63 | 4.03 | 9.38 | 68.95 | –5.55 | 8.59 |
| Particular Year | Government consumption | Imported | Exit | ||||||
| China | The United States | Russia | China | The United States | Russia | China | The United States | Russia | |
| 2006 | 0.00 | 0.00 | –7.49 | 0.09 | –0.02 | –0.08 | –0.04 | –0.10 | –0.04 |
| 2007 | 0.00 | 0.00 | 27.97 | 0.28 | 0.00 | 0.49 | –0.02 | –0.28 | 0.32 |
| 2008 | 0.00 | 0.00 | 23.26 | 0.64 | 0.08 | 0.41 | 0.01 | 0.21 | 0.25 |
| 2009 | 0.00 | 0.00 | –14.37 | 0.97 | 0.07 | –0.32 | 0.06 | 0.10 | –0.16 |
| 2010 | 0.00 | 0.00 | 3.21 | 0.76 | 0.24 | –0.18 | 0.01 | –0.24 | –0.12 |
| 2011 | 0.00 | 0.00 | 3.24 | 1.70 | 0.16 | –0.04 | 0.06 | 0.24 | –O.(M |
| 2012 | 0.84 | 0.00 | –2.57 | 0.52 | 0.09 | 0.02 | 0.18 | 0.00 | 0.01 |
| 2013 | 0.46 | 0.00 | –8.64 | 0.18 | 0.05 | –0.10 | 0.22 | 0.51 | –0.03 |
| 2014 | 0.23 | 0.00 | –3.79 | –0.25 | –0.12 | –0.07 | 0.26 | 0.06 | –0.03 |
| 2015 | 0.42 | 0.00 | –0.82 | –0.01 | 0.21 | –0.05 | 0.31 | 0.08 | 0.00 |
| 2016 | 0.71 | 0.00 | –3.07 | –0.16 | 0.24 | –O.(M | 0.16 | 0.39 | –0.06 |
| 2017 | –0.13 | 0.00 | –7.69 | 0.02 | 0.19 | –0.02 | 0.04 | 0.30 | –0.01 |
| 2018 | 0.20 | 0.00 | 21.54 | 0.03 | 0.04 | 0.03 | –0.05 | –0.05 | 0.01 |
| 2019 | 0.38 | 0.00 | –13.59 | 0.15 | 0.09 | –0.02 | 0.09 | 0.09 | –0.01 |
| 2020 | 0.22 | 0.00 | –9.69 | 0.09 | –0.05 | –0.02 | 0.04 | 0.09 | 0.01 |
| Total | 3.33 | 0.00 | 7.49 | 5.02 | 1.29 | 0.01 | 1.33 | 1.39 | 0.11 |
Intermediate investment provides necessary service activities and physical products for the development of financial industry. Among the six factors studied, the contribution of intermediate investment to the growth of financial industry in the three countries is the largest, especially in China. In the past 15 years, China’s intermediate investment in the financial sector has increased by 109.63 percentage points, an average annual increase of 7.3%, and a breakthrough of 10% in 2010 and 2011. Russia’s data also show that the intermediate input factor has experienced a huge growth, but at the same time the volatility is very obvious. From 2006 to 2010, intermediate investment.
In 2011–2019, the average annual growth rate of intermediate investment decreased by 3.4 percentage points, showing a completely different trend. Compared with other two countries, the U.S. performance is relatively flat, but the intermediate input factor is still the most important factor to promote the financial development of the United States. In the past 15 years, the intermediate input of the U.S. financial industry has been stable at an annual increase of 0.27 percentage points without dramatic fluctuations. It is worth noting that in recent years, especially after 2008, the U.S. and Russia’s intermediate investment has shrunk to a certain extent, among which the cumulative performance of the U.S. intermediate investment in 2008–2011 is –8.2%, which has experienced a certain degree of contraction; the cumulative performance of Russia is –3.91%; Although China is still playing a positive role, there is also a slight decline compared with the previous years. Therefore, it will take time to test whether the intermediate input factor can be the driving force for the sustained and stable growth of the financial industry in the future.
5Conclusions
Under the general trend of the influence of covid-19, financial businesses of various countries are affected. Based on the model of adga BP neural network, the development speed and quality of China’s financial industry under the new normal are simulated, adjusted and predicted. Compared with the domestic and foreign literature, the innovation of this paper is mainly reflected in the selection of research content, which not only considers the development speed and quality of the financial industry system, but also achieves the goal of stable economic growth, economic structure adjustment and innovation driven. The research method can not only reveal the nonlinear, multi input and multi output complex characteristics of the financial industry system, but also optimize the neural network. The running speed and precision of the model. Therefore, the research results of this paper are more realistic and accurate than other literatures.
Factors affected by the covid-19 epidemic were found in the study. Compared with the economic development of the United States, China and Russia, the United States and Russia have been affected by the epidemic for a long time. The epidemic affected the development of the financial industry.
Acknowledgments
This paper is supported by National Natural Science Foundation of China titled “Research on mobile user personalized factor event summary model for search feedback” (No.: 61472290).
References
[1] | Cheung Y.M. , Leung W.M. and Xu L. , Adaptive Rival Penalized Competitive Learning And Combined Linear Predictor Model For Financial Forecast And Investment, International Journal of Neural Systems 8: (5-6) ((1997) ), 517–534. |
[2] | Triantafyllou K. , Gkolfakis P. , Viazis N. , et al., A 13-year time trend analysis of small bowel video capsule endoscopies and a forecast model during the financial crisis in Greece, European Journal of Gastroenterology & Hepatology 29: (2) ((2017) ), 185–191. |
[3] | Bozsik J. , Decision tree combined with neural networks for financial forecast, Electrical Engineering 55: (3-4) ((2013) ), 95. |
[4] | Liu J.N.K. and Kwong R.W.M. , Automatic extraction and identification of chart patterns towards financial forecast, Applied Soft Computing 7: (4) ((2007) ), 1197–1208. |
[5] | Koga C. , Financial Forecast Reporting: A comparative Study of Current Status in U.K, U.S and CA, Medical Law Review 18: (18) ((2010) ), 442–448. |
[6] | Stasinakis C. , Applications of hybrid neural networks and genetic programming in financial forecasting, Journal of Theoretical Biology 244: (2) ((2013) ), 190–207. |
[7] | Chen L.H. and Guo T.Y. , Forecasting financial crises for an enterprise by using the Grey Markov forecasting model, Quality & Quantity 45: (4) ((2011) ), 911–922. |
[8] | Wang H. , Lu S. and Zhao J. , Aggregating multiple types of complex data in stock market prediction: A model-independent framework, 164: (JAN.15) ((2019) ), 193–204. |
[9] | Zhu Y. , Application of the Fiancial Crisis Forecast System Based on the Multifactor Model, Parasitology 3: (2) ((2009) ), 217–225. |
[10] | Hassan R. , Nath B. and Kirley M. , A fusion model of HMM, ANN and GA for stock market forecasting, Expert Systems with Applications 33: (1) ((2007) ), 171–180. |
[11] | Klotz A. , Harouna A. and Smith A.F. , Forecast analysis of the incidence of tuberculosis in the province of Quebec, BMC Public Health 13: (1) ((2013) ), 1–7. |
[12] | Triantafyllou K. , Gkolfakis P. , Viazis N. , et al., A 13-year time trend analysis of small bowel video capsule endoscopies and a forecast model during the financial crisis in Greece, European Journal of Gastroenterology & Hepatology 29: (2) ((2016) ), 1–10. |
[13] | Sung M.C. and Lessmann S. , Save the best for last? The treatment of dominant predictors in financial forecasting, Expert Systems with Applications 39: (15) ((2012) ), 11898–11910. |
[14] | Kaastra I. and Boyd M. , Designing a neural network for forecasting financial and economic time series, Neurocomputing (1996). |
[15] | Cheng C.H. and Wei L.Y. , Volatility Model Based On Multi-stock Index For Taiex Forecasting, Expert Systems with Applications 36: (3p2) ((2009) ), 6187–6191. |
[16] | Cruz C.O. and Marques R.C. , Using the Economic and Financial Reequilibrium Model to Decrease Infrastructure Contract Incompleteness, Journal of Infrastructure Systems 19: (1) ((2013) ), 58–66. |
[17] | Li X. , Liao X. , Zhang X. , et al., Application of GM Model and GRA on the Evaluation for Financial Burden of Patients at Hospitals in China by PPP Model, Journal of Grey System 25: (2) ((2013) ), 112–128. |
[18] | Chen Y. and Niu L. , Adaptive Dynamic Nelson-Siegel Term Structure Model with Applications, Journal of Econometrics 180: (1) ((2014) ), 98–115. |
[19] | Kristjanpoller W. , Fadic A. and Minutolo M.C. , Volatility forecast using hybrid Neural Network models, Expert Systems with Application 41: (5), 2437–2442. |


