
Optimizing sustainable development problem under uncertainty: Robust vs fuzzy optimization methods
Abstract
Sustainable development problem involves several conflicting criteria on economy, energy, environment and social aspects and some sources of uncertainty due to its attribute. It is necessary to mitigate risks in sustainable development schedule. However, the existing literature includes limited quantitative research on robust strategies for sustainable development under uncertainty. Under these concerns, this paper presents a robust multi-objective optimization formulation for allocating labor across economic sectors to simultaneously satisfy economy (gross domestic product, GDP), environment (greenhouse gas (GHG) emissions), energy (electricity) and society (labor), in which the per capita GDP, per capita electricity consumption, per capita GHG and per capita rate of unemployment are robust uncertainty. There are three conflicting objectives in our sustainable development problem. The first objective maximizes the sectoral GDP, the second objective minimizes the sectoral electricity consumption and the third objective minimizes the sectoral GHG emissions. We adapt ɛ-constraint method to deal with the multiple objectives for the sustainable development problem, and obtain a more flexible result via an interactive decision-making process. Since uncertainty has often led to computationally intractable models, we reformulate the proposed model using robust optimization method into the tractable robust counterpart (RC) forms under two types of uncertainty sets. Finally, to demonstrate the effectiveness and applicability for our model, we conduct a case study for meeting year 2030 sustainable development of the United Arab Emirates (UAE). The numerical results show: (a) the robust multi-objective model is effective in uncertain environment and provides a reliable decision tool than deterministic model for integrated multi-objective sustainable development problem; (b) when the possibility distributions of uncertain parameters are available, fuzzy optimization model can provide better decision-making than robust model under box uncertainty set.
1Introduction
Sustainable development over economy, energy, environment and sociology, started in the 1990s for balancing energy-economy-environmental system and resource allocation [25, 32], has always been an important direction of efforts for global nations in the recent years. The United Nations agenda for sustainable development by the year 2030 proposes 17 sustainable development goals which include access to affordable, reliable and clean energy, sustained economic growth with full productive employment, and urgent action to mitigate environmental degradation [16]. The rapid development of economy has led to a remarkable rise in energy consumption and environmental pollution level. Economic development increases energy consumption that affects all economic and industrial activities, while the increased energy consumption is the primordial themes impacting any national economy. Furthermore, energy consumption, still mainly dependent on fossil fuels, such as oil, coal, petroleum and natural gas products, contributes to the increase of GHG emissions. At the same time, economic development affects population levels, while rapid population growth has also contributed the level of GHG emissions [34]. Therefore, in order to achieve sustainable development, the relationship between economic growth, energy consumption, environmental pollution and population growth is the key point that country should be concerned about. This is principally because of the enormous implications that this relationship has for policy prescriptions relative to sustainable development. Therefore, countries need to formulate appropriate policies to jointly address the problems of improving economic development, controlling energy consumption, reducing GHG emissions and meeting workforce allocation [18].
Inevitably, the key factor to the success of sustainable development is to commendably comprehend the interplay between economy, energy, environmental and social aspects simultaneously for finding emergency measures. Jayaraman et al. [18] studied sustainable development on energy-environment-economic system by building goal programming model. This paper extends the literature by investigating the multi-objective integer programming model for allocating labor resource to achieve the sustainable development. Our work pays attention to three objectives: maximum GDP growth, minimum electricity consumption and minimum GHG emissions, and models workforce allocation as constraint. In addition, the numbers of employees in each economic sector are chosen as decision variables. Subsequently, the proposed model is applied to key economic sectors of UAE to achieve sustainability related objectives by the year 2030. The results of the model can clearly show the causal relationship between the three objectives in UAE, which can provide a quantitative basis for policy makers and economists’ policy planning and regulation. Moreover, the results are also used to study the trade-off between resource allocation among different economic sectors and the impact of long-term investments on energy sustainability.
Policy makers need to face not only uncertain per capita contributions but also the rate of unemployment in strategic planning. Jayaraman et al. [16, 17] considered just sustainable development problem under certain environment. Due to the variety of per capita contribution, there often exist some impreciseness and ambiguousness in acquiring accurate data. Accordingly, policy makers have only access to the estimated values or the nominal value, but not enough to precisely pin down the exact data. At this point, the proposed optimization model in this paper incorporates the uncertainties encountered in optimizing sustainable development, such as per capita GDP, per capita electricity consumption, per capita GHG emissions and the rate of unemployment. In the presence of uncertainty, however, the problem becomes intractable. There exist several ways to treat data uncertainty in optimization, for example, robust optimization with distribution-free property, fuzzy technique and stochastic method. Jayaraman et al. [18, 19] employed stochastic and fuzzy methods to build goal programming models for sustainable development problem, respectively. In this paper, we utilize a relatively novel robust optimization method to address the uncertainty. By combining the aforementioned aspects, our multi-objective model is provided with robust uncertainty depicted with interval. We assume that uncertain parameters are taking value in two refined uncertainty sets parameterized in an affine way. As a result, we can transform the model with uncertainty to computational tractable formulation by deriving robust counterpart. When the possibility distributions of uncertain parameters are available, we leverage fuzzy optimization method for planning the sustainable development problem.
This paper contributes to the sustainable development problem in the following four aspects. (i) We propose a new robust multi-objective programming model for planning the sustainable development under uncertainty that involves three conflicting objectives. The first objective maximizes the sectoral GDP. The second objective minimizes the sectoral electricity consumption, and the third objective minimizes the sectoral GHG emissions. (ii) This paper assumes that the rate of unemployment exists within each economic sector in the sustainable development problem, which is obviously in line with the reality. In contrast to the related literature, the rate of unemployment is the first considered in planning the sustainable development problem. (iii) We characterize the per capita GDP, electricity consumption, GHG emissions and the rate of unemployment with robust uncertainty depicted with interval, which is different from the previous related literature. To obtain tractable formulation, we reformulate the proposed model into the equivalent robust counterpart forms under two types of uncertainty sets. (iv) We carry out case study based on the UAE to demonstrate the practicability of the model as well as the effectiveness of the approach. When the possibility distributions of uncertain parameters are available, we validate the fuzzy model and find that it can offer better decision than robust model under box uncertainty set. Further analysis provides the significant justification about studying the trade-off between resource allocation and long-term investments towards sustainability.
The structure of the remaining paper is organised as follows. Section 2 briefly reviews related literature. Section 3 gives the problem statements in detail and builds a robust multi-objective optimization model. Section 4 transforms the proposed model into tractable robust counterpart form. Section 5 conducts a case study based on UAE to verify the effectiveness of the model and approach. Section 6 draws some conclusions and outlines directions for further research.
2Literature review
The issue of sustainable development has always been a hot research topic of global nations in recent years. Chapple [11] provided a comprehensive framework on how to plan sustainable cities and regions, and used the case of the San Francisco Bay area as an example, and also provided an extremely interesting attempt to develop a broad conceptualisation of how to plan more sustainable cities and regions. Asif et al. [1] investiged the relationship between economic growth, urbanization, energy consumption, and CO2 emission in GCC countries. Aznar-Marquez and Ruiz- Tamarit [2] studied economic growth in the presence of two environmental externalities: local and gives account of the marginal damage from the emissions flow and aggregate, or global, and relates to the extreme damage and found and completely characterized the socially optimal equilibrium, which showed that sustained growth is feasible along the balanced path. Jayaraman et al. [16] introduced a weighted goal programming model involving criteria on the economic development, the electricity consumption, the greenhouse gas emissions, and the total number of employees to determine optimal labor allocation across various economic sectors and applied the model to Gulf Cooperation Council Countries. Barreto [6] presented a theoretical framework that incorporates energy within an endogenous growth model considering the interaction and substitution between fossil fuels to reach the steady state where alternative energy production fuels the entire economy. Although the above literatures review the related study of sustainable development without considering uncertainty, some of the more important problems related to sustainability involve uncertainty. Thus, real-world optimization should consider uncertainty and find the method to deal with uncertainty.
Taking uncertainty into consideration, some researchers studied the topic on sustainability. Nomani et al. [27] utilized fuzzy goal programming to analyse environmental, energy and sustainability goals of India by the year 2030 with reference to the key economic sectors of India. Jayaraman et al. [19] studied the sustainable development of UAE by the year 2030 considering economy, population, energy and environment by fuzzy goal programming. Gupta et al. [15] analysed the economic development and sustainable goals on GDP, the electricity consumption and the GHG emissions of India and provides an optimal allocation of resources by building fuzzy goal programming model. Jayaraman et al. [18] utilized stochastic goal programming to consider the sustainable development planning for economic development, energy consumption, GHG emissions and population growth of UAE by the year 2030. Rodriguez-Gonzalez et al. [33] presented a stochastic integrated ecological-economical-social model which includes a crucial social aspect in the sustainability study such as inequity, and analyzed four typical kinds of societies with different levels of development and inequity. For a thorough coverage of development and recent advances in global research on sustainability and sustainable development, the interested reader can refer to Olawumi and Chan [28]. Some of the above literatures on sustainable development mainly considered the uncertainty of goals and used fuzzy or stochastic goal programming method to study the sustainable development. However, the uncertainty of goals is mainly due to the presence of uncertainty about input data. Unlike these documents, this paper assumes that input data including per capita GDP, per capita electricity consumption, per capita GHG emissions and the rate of unemployment are modeled as uncertain parameters.
When the possibility distributions of uncertain input data are available, we study sustainable development problem by fuzzy optimization method. Fuzzy set, pioneered by Zadeh [39], is a strong tool to deal with subjective uncertainty. Since then, fuzzy theory has been explored in the literature. Liu and Liu [21] presented a novel concept of credibility measure and expected value of fuzzy variable. Qiu and Zhang [31] discussed the properties of symmetric fuzzy numbers, showed an equivalent characterization of convex fuzzy sets, and presented a way to construct a symmetric convex fuzzy set with a convex fuzzy set. Qiu et al. [30] obtained some algebraic proper ties and topological properties of the quotient space of fuzzy numbers with respect to the equivalence relation and introduced a new concept of convergence under which the quotient space was complete. At the same time, fuzzy theory integrated with optimization method has been applied successfully to more and more application-oriented fields [3, 22, 23]. The inclusion of fuzzy uncertainty in the context of sustainable development is a challenging issue in terms of modeling and solution. Although several studies may have considered the related problem, the uncertain parameters considered in those documents are characterized by membership functions, while the uncertain data in our paper are measured by possibility distribution functions and a credibilistic sustainable development model is built.
In reality, the possibility distributions of uncertain model parameters are often not easily known. Under the consideration, this paper studies the sustainable development problem in the presence of uncertainty by a relatively novel method - Robust optimization. Robust optimization, first proposed by Soyster [35], is a new approach to deal with the programming problems under uncertain input data without the distribution information, which is different from the fuzzy or stochastic method in nature. Ben-Tal and Newmirovsky [7, 8] successively proved that the robust convex formulation of programming problems with uncertainty is tractable when the uncertainty set is described as a box or an ellipsoid. An extension of this method can be referred to the literature [9, 10, 20]. For a thorough coverage of developments and recent advances in robust optimization, the interested reader can refer to [13]. Due to the superiority of robust optimization, robust optimization approach has been applied in many areas, including data envelopment analysis [5], energy system planning [12], sustainable energy supply systems [24], portfolio of R&D projects [36], single-period inventory problem [14], p-hub median problem [37] and so on. This implies that robust optimization method in uncertain programming problems can address uncertainty and the computational intractable issue in the modeling process, which motivates us to consider the sustainable development problem over economic development, energy consumption, environment protection and population growth by robust optimization method. In this paper, we take advantage of the robust optimization method to resist the uncertain per capita contributions on GDP, electricity consumption, GHG emissions and the rate of unemployment when these uncertain data take their values in box+ellipsoidal and box+generalized budgeted uncertainty sets.
3Robust multi-objective sustainable development model
3.1Problem description
We consider a problem of planning sustainable development. Our problem stems from the increased concern about the relation between energy consumption, global population growth and GHG emissions and the effects on long-run sustainability. The rapid growth of economy requires the massive use of labor resources and energy consumption, in turn leading to high-level pollution. The long-run dynamics of the sustainability criteria offers unique challenges and opportunities to better plan resource allocation. Therefore, we hope to allocate resources (labor) to meet economic growth, reduce GHG emissions and energy consumption in order to achieve sustainable development. Here we take economic sectors as units to allocate labors to simultaneously satisfy GDP growth, electricity consumption, GHG emissions and the number of employees in each economic sector goals necessary to meet an economic sustainability. Therefore, we consider GDP, electricity consumption and GHG emissions as objective functions optimized simultaneously, and the workforce allocation as a constraint satisfying a specified level. Here we consider several economic sectors and following assumptions:
• Objective functions are assumed to be linear: Each objective is supposed to be linearly dependent on each of decision variables; The same as constraints.
• Rate of unemployment in each sector is considered, which is uncertain prior to decision making.
• Set a specific time period for one year.
3.2Notations on the sustainable development problem
To formally characterize the sustainable development problem, we first list all symbols and parameters used in the problem formulation, as shown in Table 1.
Table 1
Notation
| Notation | Description |
| Sets | |
| [I] = {i = a, b, c, d} | a set of uncertain parameters |
| [J] = {j = 1, . . . , n} | a set of economic sectors |
|
| uncertainty set i ∈ [I] |
| Parameters | |
| aj | the per capita GDP contribution of each employee in the economic sector j |
| bj | the per capita electricity consumption of each employee in the economic sector j |
| cj | the per capita GHG emissions contribution of each employee in the economic sector j |
| dj | the per capita workforce contribution of each employee in the economic sector j |
| ej | the current number of employees each economic sector j |
| t | the predetermined upper bound on the total number of employees |
| zi | an L-dimensional perturbation vector i ∈ [I] |
| Decision variables | |
| xj | the number of employees in the economic sector j |
3.3Mathematical model
First we give a detailed account of three objectives in our problem.
• The formulation of the total sectorial GDP under resulting optimal resources allocation across whole country in a year is as follows:
(1)
• The cumulative quantity F2 (x, b (zb)) of per capita electricity consumption (in Giga watt hours (Gwh)) across all economic sectors is as follows:
(2)
• F3 (x, c (zc)), the total level of sectorial GHG emissions (in Giga gram equivalent of CO2), is expressed as follows:
(3)
The per capita GDP contribution a, per capita electricity consumption b and per capita GHG emissions c are provided with a certain degree of uncertainty. We may not be able to evaluate them accurately, which lead to the uncertainty of the total sectorial GDP F1 (x, a (za)), the total sectorial electricity consumption F2 (x, b (zb)) and the total sectorial GHG emissions F3 (x, c (zc)).
By introducing auxiliary decision variables
Next we introduce the constraints of our optimization problem. Constraint (10) guarantees that for all economic sectors the total employed work force does not exceed t inducing thus an upper bound on the total number of employees, in which d (zd) = (d1 (zd) ; d2 (zd) ; … ; dn (zd)) is also uncertain. We impose the constraint (11) to ensure that the worker number xj of each economic sector j ∈ [J] is integer and take into account that for each economic sector j ∈ [J] the employed worker number satisfies the current number of employees per sector, which guarantees the sustainability.
The robust multi-objective sustainable development problem can be modeled as follows:
(4)
(5)
(6)
(7)
(8)
(9)
(10)
(11)
3.4Model transformation into single objective
In this subsection, we consider transforming this multi-objective programming into a single objective programming. Here we use ɛ-constraint method (see [38]). According to the preferences of policy makers, GDP is considered as the objective of the single-objective programming model. As a result, the multi-objective programming problem can be transformed to the following single-objective programming:
(12)
The model (12) can well resist the uncertainty. However, the model faces the computationally intractable challenge in virtue of the semi-infinite constraints of the model. In order to circumvent this difficulty of the model, our goal now is to built a representation capable of expressing equivalently the semi-infinite linear constraints of the model as a finite system of explicit convex constraints. The outlined strategy allows us to focus on robust optimization method. Robust optimization method can provide the RC of model (12) under uncertainty set, which is a finite computationally tractable system of convex constraints.
4Reformulation
In the section, we will reformulate the computationally tractable forms of our robust model (12) under two types of uncertainty sets. The uncertain per capita contributions a, b, c and d in problem (12) are varying in the given uncertainty set parameterized in an affine way by perturbation vector
Similarly, constraints (8)-(10) can also be equivalently written as this kind of form. The uncertain parameters [a ; b ; c ; d] represent basic perturbations from the nominal data [a0 ; b0 ; c0 ; d0].
4.1RC model under box+ellipsoidal uncertainty
In this subsection we study the RC model of problem (12) with uncertain per capital contributions a, b, c, d varying in box+ellipsoidal uncertainty set parameterized in an affine way by the following box+ellipsoidal perturbation set:
(13)
Theorem 1. For sustainable development problem (12), suppose that the uncertain per capital contributions a, b, c, d are parameterized by perturbation vector zi belonging to the box+ellipsoidal perturbation set (13). Then the RC model of sustainable development problem (12) can be represented by the following system:
(14)
Proof. First we build the RC form of constraint (7) on GDP. The perturbation vector za affecting constraint (7) on GDP belongs to following perturbation set
The conic representation of the perturbation set becomes:
A1za ≡ [za ; 0], a1 = [0L×1 ; 1] and
A2za = [∑-1za ; 0] with ∑ = Diag {σ1, . . . , σL}, a2 = [0L×1 ; Ωa] and
Setting φ1 = [τ1 ; π1], φ2 = [τ2 ; π2] with one-dimensional π1, π2 and L-dimensional τ1, τ2, the inequality (7) becomes the following system of constraints in variables π, τ, x:
For every feasible solution to the system, one have
(15)
The above proves that the system (15) is the RC of Eq. (7). Similar to the above derivation process, constraints (8)-(10) with box+ellipsoidal uncertainty set can also be turned into the kind of RC forms.
As a result, the uncertain sustainable development problem (12) can be equivalently transformed into the RC model (14).□
Remark 2. The RC model (14) with finite constraints is computationally tractable. Moreover, any x satisfying the RC model (14) is a solution of problem (12).
4.2RC model under box+generalized budgeted uncertainty
In this subsection we study the RC model of problem (12) with uncertain per capital contributions a, b, c, d varying in box+generalized budgeted uncertainty set parameterized in an affine way by the following box+generalized budgeted perturbation set:
(16)
Theorem 2. For the sustainable development problem (12), suppose that the uncertain per capital contributions a, b, c, d are parameterized by perturbation vector zi belonging to the box+generalized budgeted perturbation set (16). Then the RC model of sustainable development problem (12) can be represented by the following system:
(17)
Proof. This proof is similar to Theorem 1.□
Remark 2. The RC model (17) is also computationally tractable. Every feasible solution to the RC model (17) is feasible for uncertain problem (12).
5Case study
In the section, we present a case study about year 2030 sustainability goals of UAE from two perspectives: (a) uncertain per capita contributions are distribution-free; (b) the possibility distribution of uncertain per capita contributions are available. All mathematical models are solved by CPLEX studio1263.win-x86-64 on personal computer (Intel(R) Core(TM) i5-4200M 2.50GHz CPU and RAM 4.00GB).
5.1Data source and analysis
The UAE vision 2021 highlights an ambition to attain a ‘competitive and resilient economy’ and a ‘sustainable environment’ [19]. Mokri et al. [26] pointed out that UAE is the world’s 10th largest per capita electricity consumer with an average annual increase rate of about 8.8% during the last decade. During the years 2006–2011, the annual increase in the electricity demand in UAE was as high as 10.8%, which was closely followed the trend in annual population growth of 11% during the same period [26]. In addition, 97.5% of electricity generation in the UAE relies on natural gas-powered plants [29], which naturally leads to the environmental pollution including the production of GHG emissions and other particulate matter. Considering the currently high, yet increasing energy consumption, GHG emissions and population in the UAE, an expected harmonious sustainable development towards economy, environment, energy and population, it is imperative to explore sustainability of the UAE. Accordingly, we find the data on the per capita contributions in several key sectors of the UAE presented in Jayaraman et al. [18]. There are 8 economic sectors identified by Vellinga are considered: (1) agriculture, (2) crude oil, natural gas and quarrying, (3) manufacturing and electricity, (4) construction and real estate, (5) trade and transport, (6) trade and transport, (7) banking and financial corporations and (8) government, social and personal services. According to Jayaraman et al. [18], the population size t are estimated as 9452000 for 2030 year.
5.2Robust method for sustainable development experiments
In the problem the uncertain per capita contributions a, b, c and d with distribution-free property, basic perturbations around nominal value a0, b0, c0 and d0, are varying in box+ellipsoidal and box+generalized budgeted uncertainty sets. We assume the nominal data [a0 ; b0 ; c0] of the uncertain parameters [a ; b ; c] are provided in Jayaraman et al. [18], and the uncertain parameter dj takes its value in the segment [0.98, 1.0] with
Table 2
Perturbation values of uncertain parameters
| Sectors | Perturbation values | |||
|
|
|
|
| |
| Agriculture | 0.003521739 | 0.000478696 | 0.001728696 | 0.0100 |
| Crude oil, natural gas and quarrying | 0.46969697 | 0.005912121 | 0.171707576 | 0.0100 |
| Manufacturing and electricity | 0.018134206 | 0.002502291 | 0.006629133 | 0.0100 |
| Construction and real estate | 0.00838565 | 0.001873543 | 0.000267227 | 0.0100 |
| Trade and transport | 0.017690457 | 0.001614274 | 0.000627506 | 0.0100 |
| Restaurant and hotels | 0.008095238 | 0.000738571 | 0.000258095 | 0.0100 |
| Banking and financial corporations | 0.105138889 | 0.014509722 | 0.003349306 | 0.0100 |
| Government, social and personal services | 0.009569444 | 0.000872083 | 0.000305000 | 0.0100 |
Table 3
Computational results with box+ellipsoidal uncertainty set
| Ω | σl | x1 | x2 | x3 | x4 | x5 | x6 | x7 | x8 |
| 0.5 | 0.1 | 230000 | 1999329 | 611000 | 1338000 | 4072813 | 210000 | 363884 | 720000 |
| 0.3 | 230000 | 1977456 | 611000 | 1338000 | 4095152 | 210000 | 358507 | 720000 | |
| 0.5 | 230000 | 1956015 | 611000 | 1338000 | 4117006 | 210000 | 353165 | 720000 | |
| 0.7 | 230000 | 1934993 | 611000 | 1338000 | 4138389 | 210000 | 347855 | 720000 | |
| 1.0 | 0.1 | 230000 | 1988338 | 611000 | 1338000 | 4084044 | 210000 | 361191 | 720000 |
| 0.3 | 230000 | 1945453 | 611000 | 1338000 | 4127755 | 210000 | 350506 | 720000 | |
| 0.5 | 230000 | 1904220 | 611000 | 1338000 | 4169611 | 210000 | 339949 | 720000 | |
| 0.7 | 230000 | 1864549 | 611000 | 1338000 | 4209619 | 210000 | 329514 | 720091 | |
| 1.5 | 0.1 | 230000 | 1977456 | 611000 | 1338000 | 4095152 | 210000 | 358507 | 720000 |
| 0.3 | 230000 | 1914379 | 611000 | 1338000 | 4159315 | 210000 | 342577 | 720000 | |
| 0.5 | 230000 | 1854864 | 611000 | 1338000 | 4219481 | 210000 | 326915 | 720000 | |
| 0.7 | 230000 | 1806035 | 611000 | 1338000 | 4271191 | 210000 | 308867 | 720013 | |
| 2.0 | 0.1 | 230000 | 1966682 | 611000 | 1338000 | 4106139 | 210000 | 355832 | 720000 |
| 0.3 | 230000 | 1884195 | 611000 | 1338000 | 4189876 | 210000 | 334715 | 720000 | |
| 0.5 | 230000 | 1807780 | 611000 | 1338000 | 4266809 | 210000 | 314040 | 720000 | |
| 0.7 | 230000 | 1799913 | 611000 | 1338000 | 4297493 | 210000 | 273229 | 720000 |
In Table 2,
5.2.1Computational results
In order to assess the applicability of the proposed model and the approach, 32 test problems in terms of the different sizes of box+ellipsoidal and box+generalized budgeted uncertainty sets and parameter σl are generated when data variability of uncertain parameters are set to 10% relative to their nominal values and (ɛE, ɛG) = (0.25, 0.60). The summary of the results on the test problems for box+ellipsoidal and box+generalized budgeted uncertainty sets are listed in Tables 3 and 4, Figs. 1–3.
Fig.1
Impacts of parameter σl and uncertainty size on the GDP
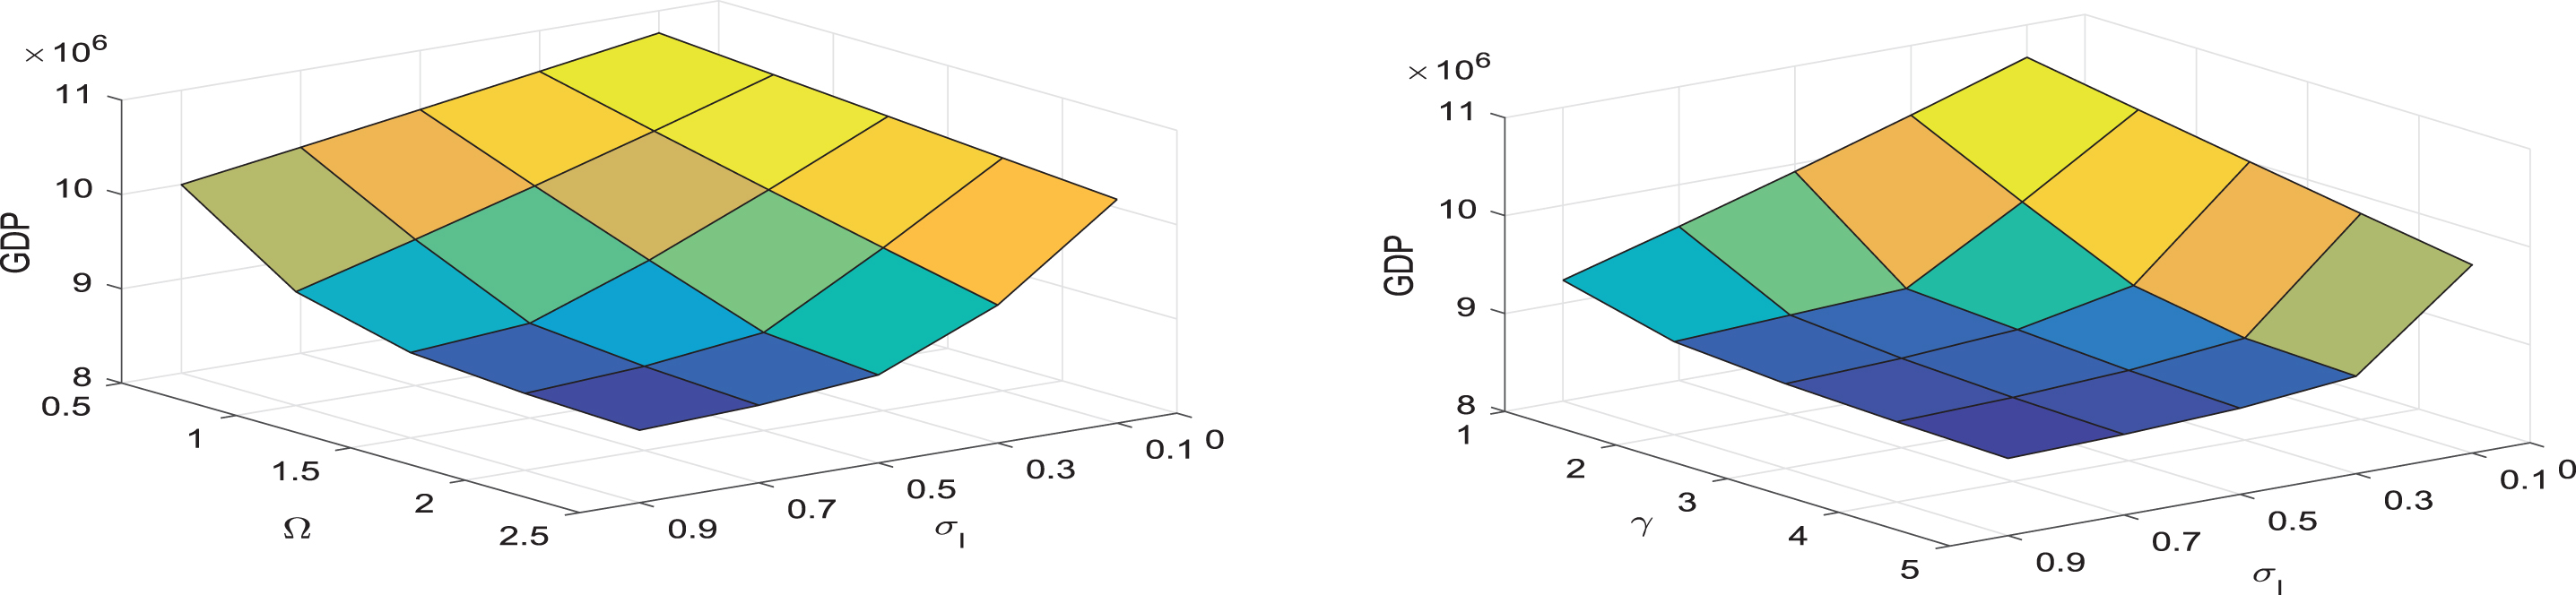
Fig.2
Impacts of parameter σl and uncertainty size on the electricity consumption
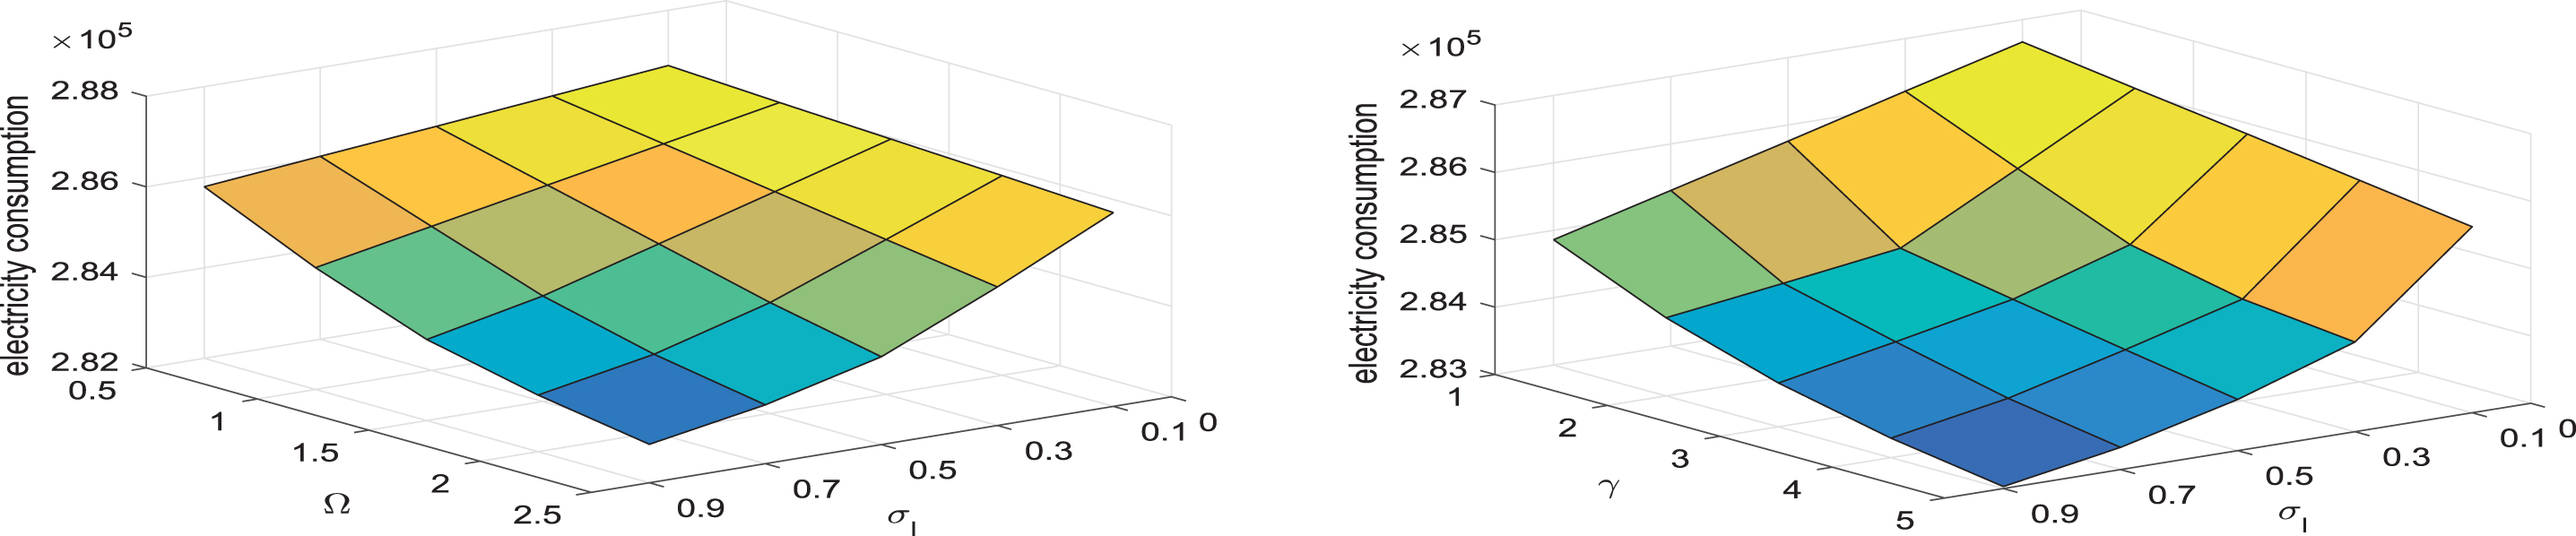
Fig.3
Impacts of parameter σl and uncertainty size on the GHG emissions
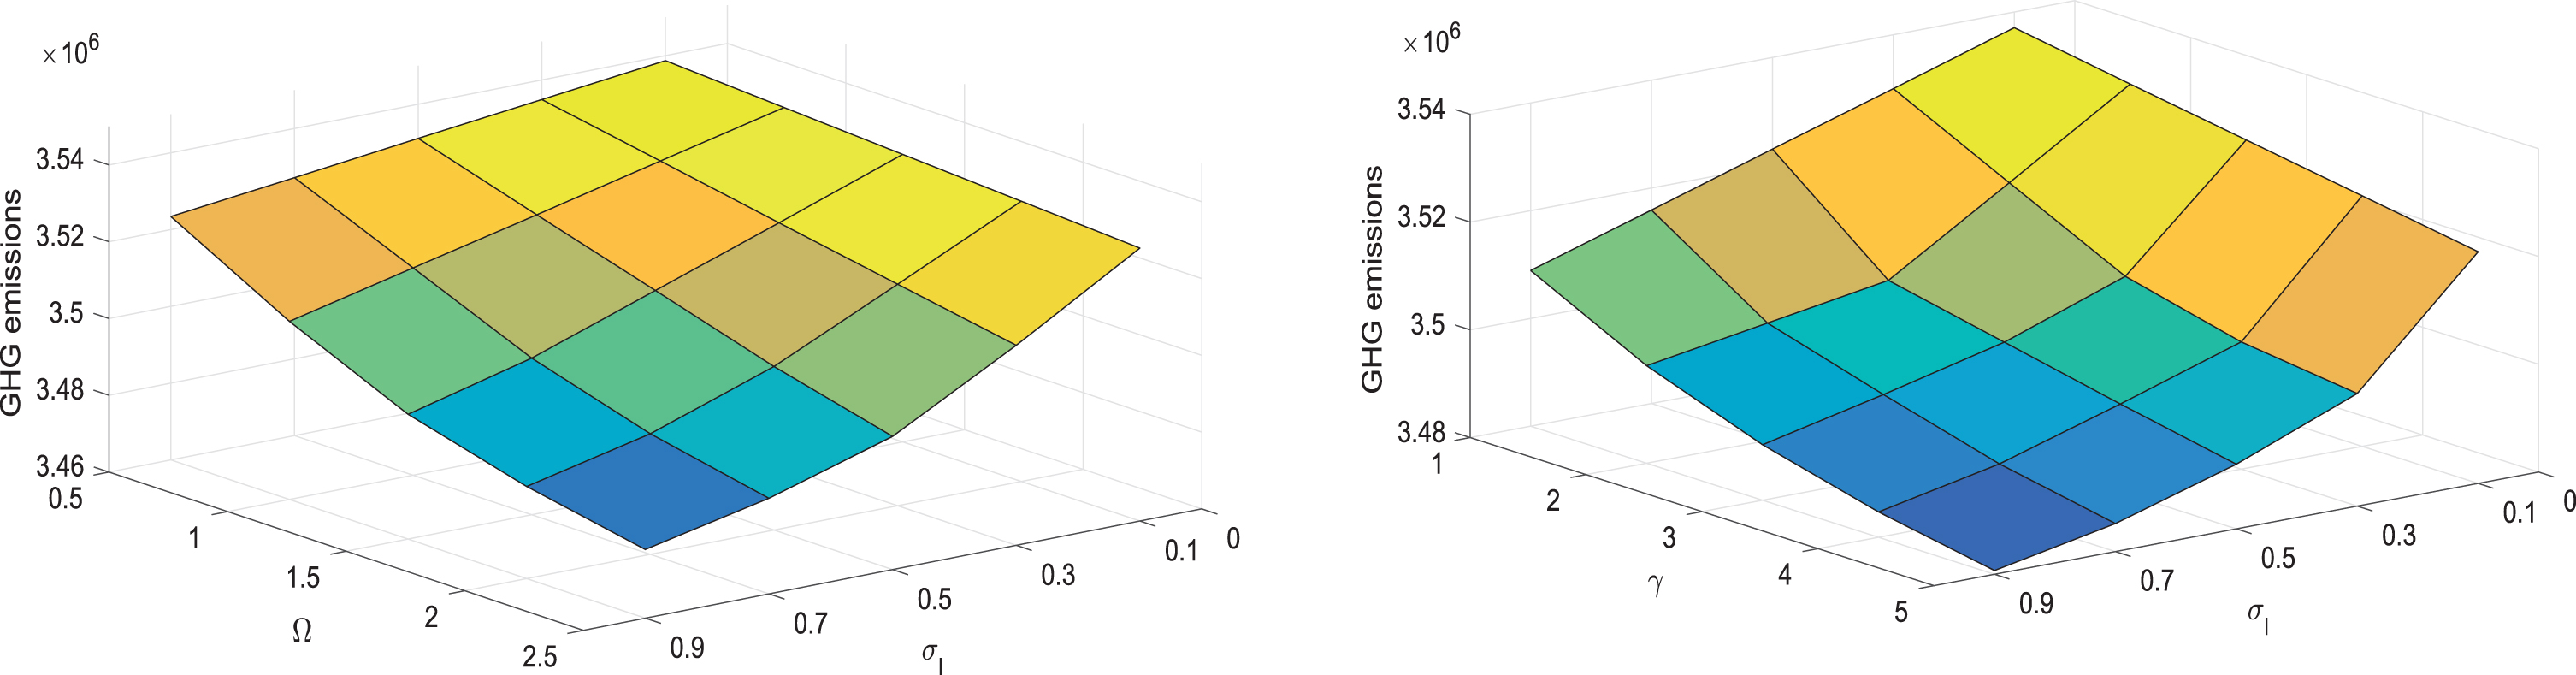
Table 4
Computational results with box+generalized budgeted uncertainty set
| γ | σl | x1 | x2 | x3 | x4 | x5 | x6 | x7 | x8 |
| 1.0 | 0.1 | 230000 | 1988464 | 611000 | 1338000 | 4082356 | 210000 | 363531 | 720000 |
| 0.3 | 230000 | 1945823 | 611000 | 1338000 | 4122557 | 210000 | 357602 | 720000 | |
| 0.5 | 230000 | 1904824 | 611000 | 1338000 | 4160733 | 210000 | 351903 | 720000 | |
| 0.7 | 230000 | 1865376 | 611000 | 1338000 | 4197000 | 210000 | 346422 | 720000 | |
| 2.0 | 0.1 | 230000 | 1966932 | 611000 | 1338000 | 4102717 | 210000 | 360537 | 720000 |
| 0.3 | 230000 | 1884911 | 611000 | 1338000 | 4179099 | 210000 | 349136 | 720000 | |
| 0.5 | 230000 | 1808926 | 611000 | 1338000 | 4248058 | 210000 | 338580 | 720000 | |
| 0.7 | 230000 | 1806446 | 611000 | 1338000 | 4264391 | 210000 | 317262 | 720002 | |
| 3.0 | 0.1 | 230000 | 1945823 | 611000 | 1338000 | 4122557 | 210000 | 357602 | 720000 |
| 0.3 | 230000 | 1827393 | 611000 | 1338000 | 4231468 | 210000 | 341145 | 720000 | |
| 0.5 | 230000 | 1805826 | 611000 | 1338000 | 4268506 | 210000 | 311906 | 720000 | |
| 0.7 | 230000 | 1802944 | 611000 | 1338000 | 3180032 | 210000 | 353604 | 1769774 | |
| 4.0 | 0.1 | 230000 | 1925124 | 611000 | 1338000 | 4141890 | 210000 | 354725 | 720000 |
| 0.3 | 230000 | 1807686 | 611000 | 1338000 | 4256106 | 210000 | 327947 | 720092 | |
| 0.5 | 230000 | 1803425 | 611000 | 1338000 | 3200765 | 210000 | 356099 | 1747638 | |
| 0.7 | 230000 | 1798327 | 611000 | 1338000 | 4306699 | 210000 | 260879 | 720090 |
As can be seen in Tables 3 and 4, adjusting the value of σl impacts the numbers of labor allocation xj for each economic sector j. On the one hand, it can be observed the distribution of labor force across 8 economic sectors under box+ellipsoidal uncertainty set. For example, under Ω = 0.5, by altering the parameter value of σl for 0.3 and 0.5, x2 changes from 1977456 to 1956015, x5 changes from 4095152 to 4117006, and x7 changes from 358507 to 353165, while x1, x3, x4, x6 and x8 keep unchanged. This event similarly happens to other cases (e.g., σl=0.1, 0.7). On the other hand, we can see that the allocation of labor force in each economic sector under box+generalized budgeted uncertainty set. For example, under γ = 4, by manipulating the parameter value σl for 0.1 and 0.3, x2 and x7 are down, x5 and x8 go up, while x1, x3, x4 and x6 remain immovability. As a consequence, for each Ω and γ, the x2 and x7 decrease and x5 increases when σl is decreasing. The fact demonstrates that policy makers can easily adjust the parameter value σl in order to obtain better allocation of labor force across 8 economic sectors to achieve sustainable development.
According to Tables 3 and 4, it can be also observed that by adjusting the safe parameters Ω and γ, the number of labor allocation for each economic sector are different. For each σl, if the safe parameter Ω takes its value as 0.5, 1.0, 1.5 and 2.0, respectively, the x2 and x7 decrease evidently and x5 is gradually increasing, while the numbers of other sectors are largely remain unchange. For example, under σl = 0.1, by altering the safe parameter Ω for 0.5 and 0.1, x2 decreases from 1999329 to 1988338, x7 decreases from 363884 to 361191, and x5 increases from 4082356 to 4197000. In the same case, when the safe parameter γ takes its value as 1.0, 2.0, 3.0 and 4.0, x2 and x7 decrease evidently, and x5 gradually increases, while the numbers of employees in other sectors are largely remain immovability. These imply that policy makers can adjust Ω or γ to better allocate the labor force to achieve sustainable development. By comparing Tables 3 and 4, it is found that the numbers of labor allocation are different under different uncertainty set. For example, under σl= 0.5, x2 are 1807780 and 1808926, respectively, when Ω= 2 and γ= 2. This event similarly happens to σl= 0.1, 0.3 and 0.7. Based on the analysis, policy makers can choose appropriate uncertainty set on the basis of the situation.
Next the alteration of parameter σl and the different sizes of box+ellipsoidal and box+generalized budgeted uncertainty sets with respect to the three objective values, respectively, are plotted in Figs. 1–3, where the left horizontal axis corresponds to parameter σl, the right horizontal axis corresponds to different levels of uncertainty set and the vertical axis corresponds to the objective value. As expect, the values of GDP, electricity consumption and GHG emissions decrease monotonically by enlarging the size of the uncertainty set when parameter σl is enforced. Moreover, the three objective values are also less at higher parameter σl under any choice of the level of uncertainty sets. Furthermore, comparing the three objective values under box+ellipsoidal and box+generalized budgeted uncertainty sets when Ω = γ = 2, σl = 0.5 reveals that the three objective values are less under box+ellipsoidal uncertainty than the values under box+generalized budgeted uncertainty, respectively. These findings appear the impacts of parameter σl, the different uncertainty sets and its size on GDP, electricity consumption and GHG emissions, which helps policy makers make better decisions.
5.2.2Model comparison
To evaluate the advantages of the proposed model, some comparison results are obtained in two different environments: deterministic model and robust model. In the case that a, b, c and d take its nominal values a0, b0, c0 and d0, respectively, the uncertain parameters are reduced to the deterministic ones. Here (ɛE, ɛG)= (0.25, 0.60). Table 5 and Fig. 4 summarize the comparison of solution results.
Table 5
Model comparison results
| Nominal value | Ω = 2.5 (σl = 0.7) | Ω = 3 (σl = 0.5) | γ = 5 (σl = 0.7) | γ = 6 (σl = 0.5) | |
| x1 | 230000 | 230000 | 230000 | 230000 | 230000 |
| x2 | 2010432 | 1795730 | 1798637 | 1795824 | 1797216 |
| x3 | 611003 | 611000 | 611000 | 611000 | 611000 |
| x4 | 1338000 | 1338000 | 1338000 | 1338000 | 1338000 |
| x5 | 4061453 | 4316998 | 4303804 | 4317165 | 4310429 |
| x6 | 210000 | 210000 | 210000 | 210000 | 210000 |
| x7 | 366586 | 246455 | 264455 | 246443 | 255478 |
| x8 | 720000 | 720001 | 720249 | 720143 | 720143 |
|
| 286900 | 283300 | 283600 | 283330 | 283480 |
|
| 3540600 | 3484900 | 3489500 | 3485200 | 3487700 |
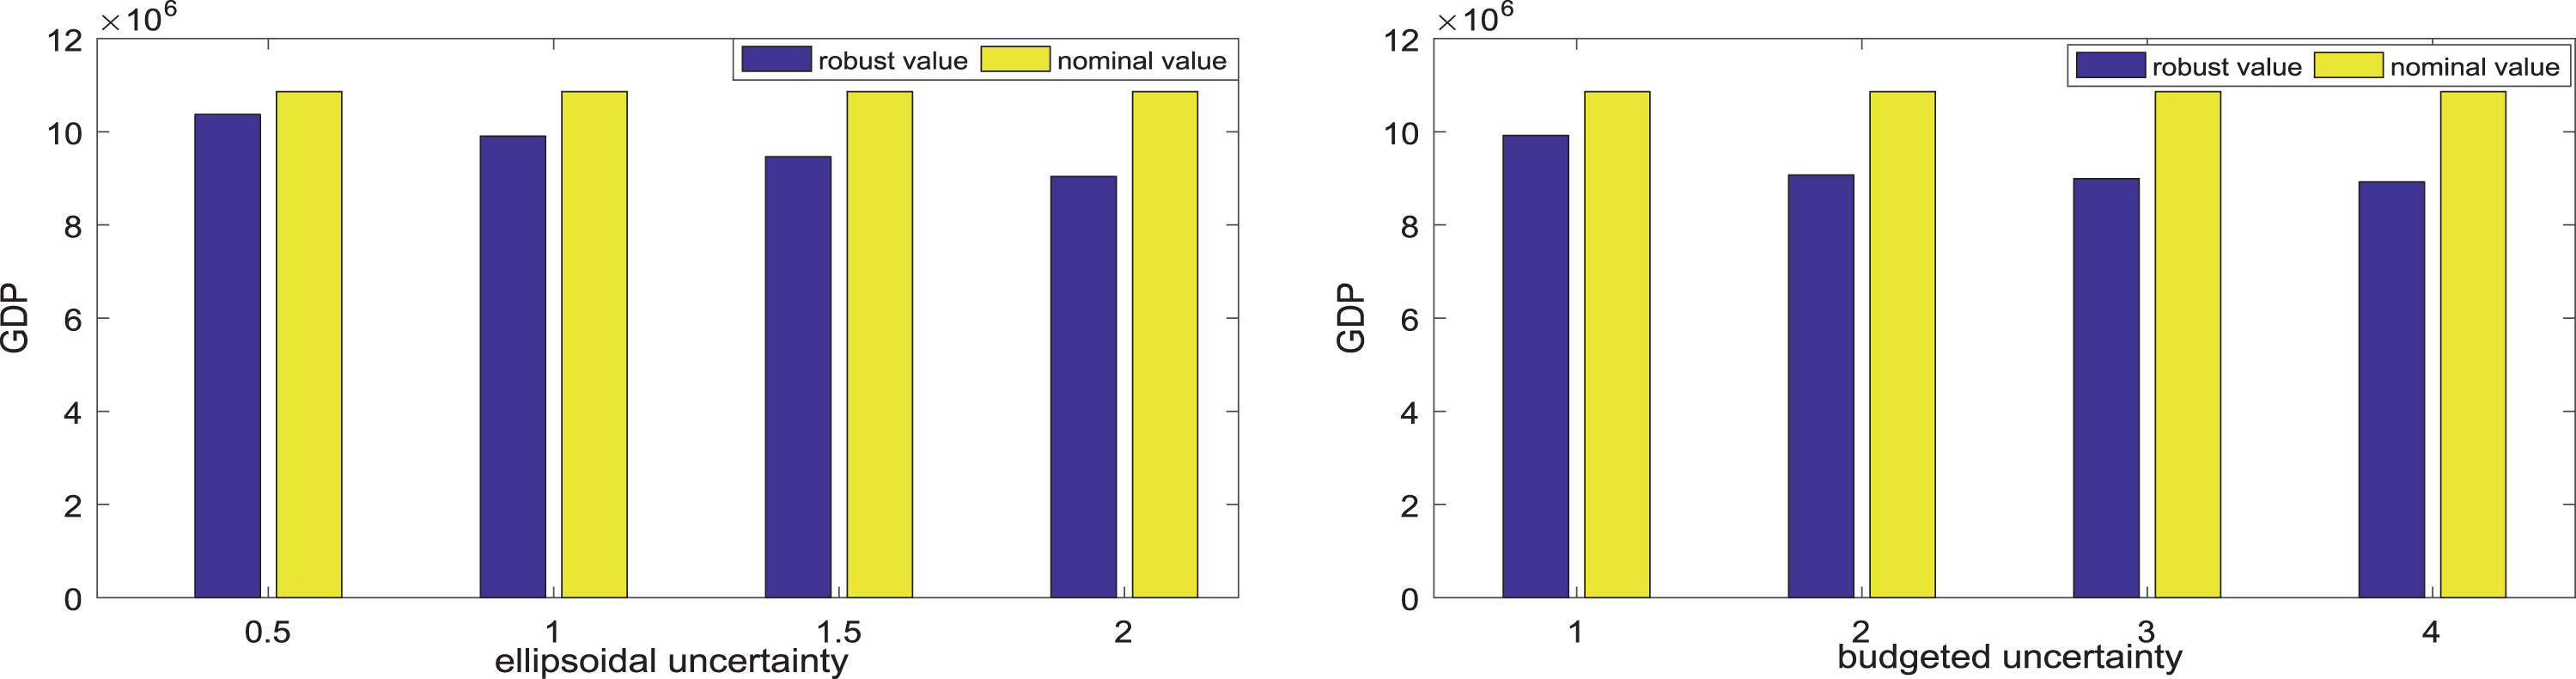
Fig.4
Comparison results under different uncertainty set, σl = 0.5.
By Table 5, we can clearly see that the solutions for the deterministic model are a little different from the proposed model in this paper. For x2, under Ω = 2.5, σl = 0.7, the nominal solution 2010432 is higher than robust solution 1795730. The model which includes robustness has substantial optimal decision than the one without uncertainty. This is principally because the uncertainty of parameters profoundly reflects the optimal solution. In other words, the uncertainty of data can not brook being ignored.
In addition, Fig. 4 reports the comparison results of objective GDP under box+ellipsoidal and box+ generalized budgeted uncertainty sets, respectively. It is easily found that robust GDP is smaller than nominal GDP. Not surprisingly, although the robust model incurs lower GDP, the electricity consumption and GHG emissions shown in Table 5 are a little higher than our robust values. That is, our robust model achieves lower electricity consumption and GHG emissions. Therefore, policy makers should be able to formulate a good strategic planning for the sustainable development by 2030 year for UAE.
5.2.3Sensitivity analysis
In order to recognize the most significant parameters of robust model, several sensitivity analysis are carried out and the impact of parameter alteration on objective GDP is investigated. We perform sensitivity analysis on parameters (ɛE, ɛG) and the different data variability of uncertain parameters a, b and c, while d still takes its value in segment [0.98, 1.0] with nominal value 0.99. Here Ω = γ = 2, σl=0.5. The analysis results are provided in Fig. 5 and Table 6.
Fig.5
Impacts of data variability on the GDP
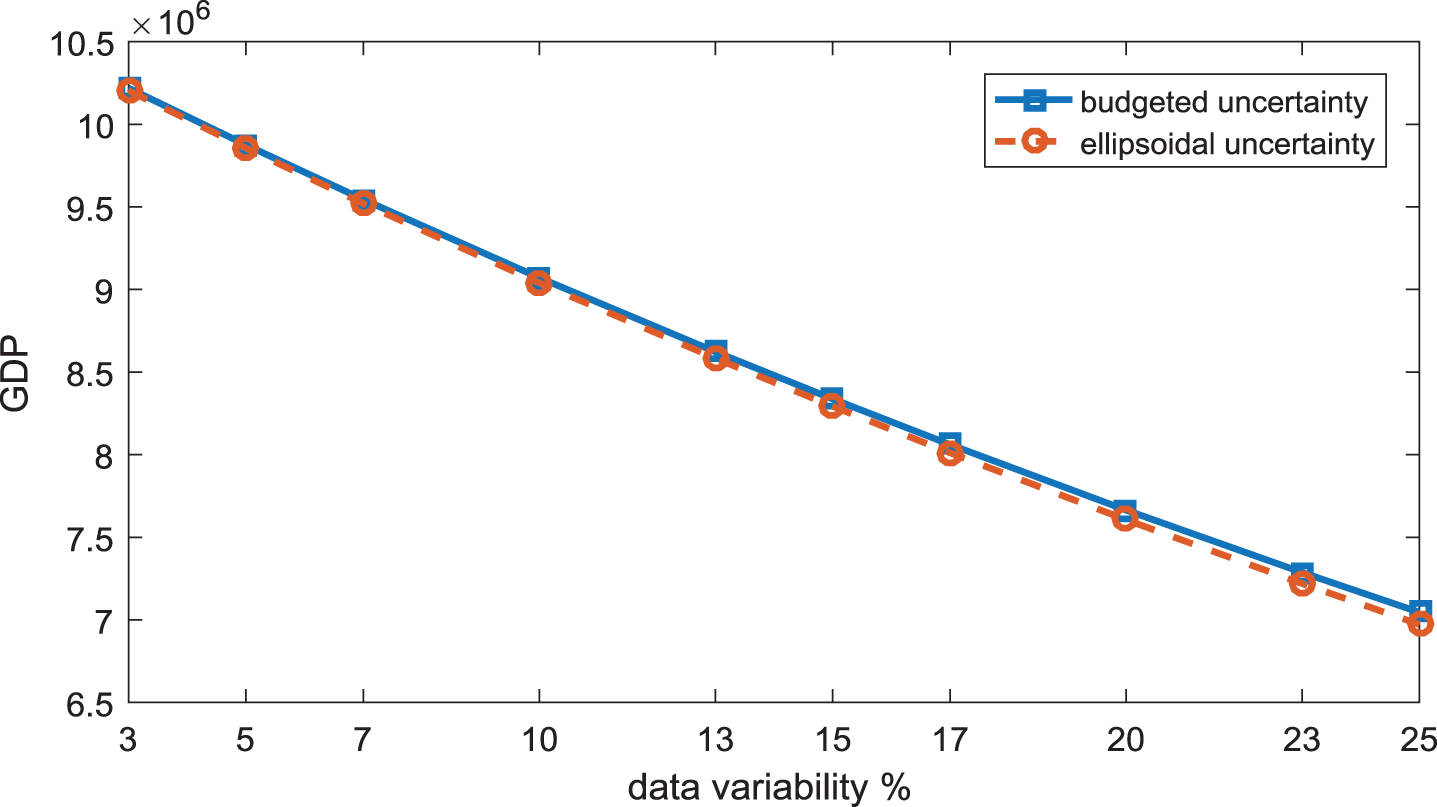
Table 6
Sensitivity of GDP, σl = 0.5
| ɛE |
|
| ɛG |
|
|
| (ɛG = 0.6) | Ω = 2 | γ = 2 | (ɛE = 0.25) | Ω = 2 | γ = 2 |
| 0.05 | 9493200 | 9538300 | 0.45 | 11657000 | 11683000 |
| 0.10 | 9381900 | 9429800 | 0.50 | 10789000 | 10812000 |
| 0.15 | 9269500 | 9312900 | 0.55 | 9915100 | 9941800 |
| 0.20 | 9155500 | 9192100 | 0.60 | 9039800 | 9071300 |
| 0.25 | 9039800 | 9071300 | 0.65 | 8162800 | 8200800 |
| 0.30 | 8922000 | 8950500 | 0.70 | 7283700 | 7330400 |
| 0.35 | 8785400 | 8815700 | 0.75 | 6402200 | 6447100 |
Figure 5 depicts the sensitivity of objective GDP to the alteration of the data variability of the uncertain parameters under box+ellipsoidal and box+generalized budgeted uncertainty sets, respectively. The horizontal axis corresponds to the data variability (%) and the vertical axis corresponds to the GDP. It can be inferred that by an increase of data variability, the value of GDP gets significantly decrease for any choice of box+ellipsoidal and box+generalized budgeted uncertainty sets.
The effect of parameters ɛE and ɛG on the objective GDP is shown in Table 6. It is intuitive that as the ɛE and ɛG become higher, respectively, the GDP is lower. By Table 6, if the ɛE takes its value 0.1, which corresponds to the ellipsoidal uncertainty set, the optimal objective GDP = 938190 is higher than the value for ɛE = 0.15, 0.20, 0.25, 0.30, 0.35. Since the electricity consumption and GHG emissions decrease as the ɛE and ɛG increase, according to the relation on the three objectives, we find that the results are stand to reason.
5.3Fuzzy method for sustainable development experiments
In this subsection, we study a sustainable development problem by fuzzy optimization method [21, 23] instead of robust optimization, once the possibility distributions of uncertain per capita contributions a, b, c and d are available. In this case, we build the following fuzzy sustainable development model in which the uncertain per capita contributions a, b, c and d are assumed as fuzzy variables.
(18)
(19)
5.3.1Computational results
Let us set (ɛE, ɛG) = (0.25, 0.60) and consider the values of
Table 7
Computational results with different tolerance parameters with violation levels 0.05
| (I) | (II) | (III) | (IV) | (V) | (VI) | |
| x1 | 230000 | 230000 | 230000 | 230000 | 230000 | 230000 |
| x2 | 1900587 | 1739197 | 1810307 | 1891133 | 1735890 | 1740476 |
| x3 | 611002 | 611003 | 611004 | 611004 | 611004 | 611004 |
| x4 | 1338000 | 1338000 | 1338000 | 1338000 | 1338000 | 1338000 |
| x5 | 4163307 | 4364020 | 4308933 | 4255045 | 4358548 | 4443135 |
| x6 | 210000 | 210000 | 210000 | 210000 | 210000 | 210000 |
| x7 | 298045 | 258721 | 233217 | 206279 | 258019 | 178326 |
| x8 | 720000 | 720000 | 720000 | 720000 | 720000 | 720000 |
|
| 9830600 | 9101100 | 8943000 | 8796400 | 8656600 | 8187600 |
|
| 284350 | 283510 | 283090 | 283090 | 283090 | 283510 |
|
| 3501100 | 3488100 | 3481500 | 3481500 | 3481500 | 3488100 |
Table 8
Computational results with different violation levels with tolerance parameters (III)
| (i) | (ii) | (iii) | (iv) | (v) | (vi) | |
| x1 | 230000 | 230000 | 230000 | 230000 | 230000 | 230000 |
| x2 | 1831165 | 1830866 | 1852123 | 1851818 | 1873483 | 1873172 |
| x3 | 611004 | 611003 | 611004 | 611004 | 611003 | 611003 |
| x4 | 1338000 | 1338000 | 1338000 | 1338000 | 1338000 | 1338000 |
| x5 | 4302703 | 4284227 | 4277719 | 4258869 | 4252076 | 4232842 |
| x6 | 210000 | 210000 | 210000 | 210000 | 210000 | 210000 |
| x7 | 228069 | 246845 | 241595 | 260750 | 255397 | 274942 |
| x8 | 720000 | 720000 | 720000 | 720000 | 720000 | 720000 |
|
| 9026200 | 9139200 | 9225000 | 9339500 | 9427800 | 9543900 |
|
| 283510 | 283510 | 283930 | 283930 | 284350 | 284350 |
|
| 3488100 | 3488100 | 3494600 | 3494600 | 3501100 | 3501100 |
From the computational results in Tables 7 and 8, we find that with the different tolerance parameters and violation levels, the solutions and objective values are different. On the one hand, the labor allocation decision is relevant to the tolerance parameters and violation levels. Specifically, the second sector, the fifth sector and the seventh sector have noticeable changes in the number of workers allocated as the tolerance parameters and violation levels change. For example, the employee number for the second sector changes from 1900587 to 1739197 by altering the tolerance parameters from (I) to (II) for the test problems in Table 7, and the employee number for the second sector changes from 1831165 to 1830866 by altering violation levels from (i) to (ii) for the test problems in Table 8. On the other hand, the objective values are also relevant to the tolerance parameters and violation levels. For example, the GDP decreases from 9101100 to 8943000, the electricity consumption decreases from 283510 to 283090, the GHG emissions decreases from 3488100 to 3481500 by changing the tolerance parameters from (II) to (III) in Table 7, and when violation levels change from (ii) to (iii) in Table 8, the GDP increases from 9139200 to 9225000, the electricity consumption increases from 283510 to 283930, the GHG emissions increases from 3488100 to 3494600.
5.3.2Comparison study
Fuzzy model with fixed distributions is less conservative than the model with only supporting information. To see this, we conduct the comparative experiments by compare fuzzy model (19) with triangular probability distribution and the robust model under box uncertainty. For the robust model, we consider the supporting information of aj, bj, cj and dj, respectively, are
Table 9
Comparison results with violation levels 0.05
| (I) | (III) | (VI) | ||||
| fuzzy | robust | fuzzy | robust | fuzzy | robust | |
| x1 | 230000 | 230000 | 230000 | 230000 | 230000 | 230000 |
| x2 | 1900587 | 1877012 | 1810307 | 1790128 | 1740476 | 1710800 |
| x3 | 611002 | 611003 | 611004 | 611004 | 611004 | 611003 |
| x4 | 1338000 | 1338000 | 1338000 | 1338000 | 1338000 | 1338000 |
| x5 | 4163307 | 4180190 | 4308933 | 4333008 | 4443135 | 4472538 |
| x6 | 210000 | 210000 | 210000 | 210000 | 210000 | 210000 |
| x7 | 298045 | 285795 | 233217 | 219860 | 178326 | 159659 |
| x8 | 720000 | 720000 | 720000 | 720000 | 720000 | 720000 |
|
| 9830600 | 9664600 | 8943000 | 8750600 | 8187600 | 7914900 |
|
| 284350 | 282670 | 283090 | 282670 | 283510 | 282670 |
|
| 3501100 | 3475000 | 3481500 | 3475000 | 3501100 | 3475000 |
From the computational results, we can clearly observe that the obtained optimal decision of our fuzzy model and the one of robust model under box uncertainty are completely different. For the objective value
6Conclusions
In this paper we introduced a robust multi-objective programming model to study the sustainable development over economic development, electricity consumption, GHG emissions and workforce allocation under uncertain environment. Specifically, we allocated labor across economic sectors to simultaneously satisfy GDP growth, electricity consumption, GHG emissions optimization objectives. After that, we utilized ɛ-constraint method to transform the multi-objective model into single-objective model. For uncertainty involved in the problem, we assumed that the per capita contribution on sectorial GDP, electricity consumption, GHG emissions and the rate of unemployment were characterized with robust uncertainty. That is, these uncertain parameters were known to belong to the given uncertainty sets. However, it would give rise to an overly conservative or computationally intractable robust model along with poorly uncertainty sets. To address the uncertainty and obtain the tractable model, we derived the proposed model to its robust counterpart forms under box+ellipsoidal and box+generalized budgeted uncertainty sets.
We implemented case study based on the UAE to demonstrate the applicability of the proposed model. The computational results showed a mathematical validation to satisfy conflicting objectives on GDP growth, electricity consumption and GHG emissions to achieve UAE’ sustainable development for year 2030. The results indicated that the method yielded good practical efficacy, which were different from previous studies on this topic. Decision makers can commendably make strategic planning and investment allocations towards sustainable development, and can also adjust their parameters according to their preferences through leveraging this method. In addition, the results provided a quantitative decision tool and advice for policy makers on investment and allocation in economic sectors to achieve the sustainability of year 2030. Furthermore, we formulated a fuzzy model for UAE when the possibility distribution of uncertain input data was available.
Future research of this model presented can incorporate additional sustainability criteria on: (i) water resources management and its impact on energy-environment system, (ii) energy saving, recycling and green energy. The model developed in the case study only analysed 8 sectors across different industries. Hence, it would be another meaningful attempt to extend the model to be able to simulate the energy consumption and GHG emissions for more sectors. For uncertainty, in this paper we characterized uncertain per capita GDP, per capita electricity consumption, per capita GHG emission and the unemployment rate by finite closed interval and valivated a robust model for planning the sustainability of UAE in case study. If the possibility distribution of uncertain input data is available, a credibilistic optimization is a better choose for formulating and solving. For the further work we will suggest to use other fuzzy techniques [3, 4, 22] or stochastic methods to address uncertainty.
Acknowledgments
This work are supported partially by the National Natural Science Foundation of China (Nos. 61773150, 61374184) and the Youth Natural Science Foundation of Hebei Province (No. A2016204057). Ms. Ruru Jia is supported by the Post-graduate’s Innovation Fund Project of Hebei University (No. hbu2019ss029).
References
[1] | Asif M. , Sharma R.B. and Adow A.H.E. , An empirical investigation of the relationship between economic growth, urbanization, energy consumption, and CO2 emission in GCC countries: A panel data analysis, Asian Social Science 11: (21) ((2015) ), 270–284. |
[2] | Aznar-Marquez J. and Ruiz-Tamarit J.R. , Environmental pollution, sustained growth, and suffcient conditions for sustainable development, Economic Modelling 54: ((2016) ), 439–449. |
[3] | Bai X. , Optimal decisions for prepositioning emergency supplies problem with type-2 fuzzy variables, Discrete Dynamics in Nature and Society, Article ID: 9275192 ((2016) ), 17 pages. |
[4] | Bai X. and Liu Y.K. , CVAR reduced fuzzy variables and their second order moments, Iranian Journal of Fuzzy Systems 12: (5) ((2015) ), 45–75. |
[5] | Bai X. , Zhang F. and Liu Y.K. , Modeling fuzzy data envelopment analysis under robust input and output data, RAIRO-Operations Research 52: (2) ((2018) ), 619–643. |
[6] | Barreto R.A. , Fossil fuels, alternative energy and economic growth, Economic Modelling 75: ((2018) ), 196–220. |
[7] | Ben-Tal A. and Newmirovsky A. , Robust convex optimization, Mathematics of Operations Research 23: (4) ((1998) ), 769–805. |
[8] | Ben-Tal A. and Newmirovsky A. , Robust solutions of uncertain linear programs, Operations Research Letters 25: (1) ((1999) ), 1–13. |
[9] | Bertsimas D. , Pachamanova D. and Sim M. , Robust linear optimization under general norms, Operations Research Letters 32: (6) ((2004) ), 510–516. |
[10] | Bertsimas D. and Sim M. , Tractable approximations to robust conic optimization problems, Mathematical Programming 107: (1–2) ((2006) ), 5–36. |
[11] | Chapple K. , Planning Sustainable Cities and Regions: Towards More Equitable Development, Routledge, (2014) . |
[12] | Dong C. , Huang G.H. , Cai Y.P. , Cheng G.H. and Tan Q. , Bayesian interval robust optimization for sustainable energy system planning in Qiqihar City, China, Energy Economics 60: ((2016) ), 357–376. |
[13] | Gabrel V. , Murat C. and Thiele A. , Recent advances in robust optimization: An overview, European Journal of Operational Research 235: (3) ((2014) ), 471–483. |
[14] | Guo Z.Z. and Liu Y.K. , Modelling single-period inventory problem by distributionally robust fuzzy optimization method, Journal of Intelligent and Fuzzy Systems 35: (1) ((2018) ), 1007–1019. |
[15] | Gupta S. , Fugenschuh A. and Ali I. , A multi-criteria goal programming model to analyze the sustainable goals of India, Sustainability 10: (3) ((2018) ), number.778. |
[16] | Jayaraman R. , Colapinto C. , Torre D.L. and Malik T. , A weighted goal programming model for planning sustainable development applied to gulf cooperation council countries, Applied Energy 185: ((2017) ), 1931–1939. |
[17] | Jayaraman R. , Colapinto C. , Torre D.L. and Malik T. , Multi-criteria model for sustainable development using goal programming applied to the United Arab Emirates, Energy Policy 87: ((2015) ), 447–454. |
[18] | Jayaraman R. , Colapinto C. , Liuzzi D. and Torre D.L. , Planning sustainable development through a scenario-based stochastic goal programming model, Operational Research 17: ((2017) ), 789–805. |
[19] | Jayaraman R. , Liuzzi D. , Colapinto C. and Malik T. , A fuzzy goal programming model to analyze energy, environmental and sustainability goals of the United Arab Emirates, Annals of Operations Research 251: ((2017) ), 255–270. |
[20] | Jia R.R. and Bai X.J. , Robust optimization approximation of amiguous P-model ang its application, Mathematical Problems in Engineering Article ID: 5203127 ((2018) ), 14 pages. |
[21] | Liu B.D. and Liu Y.K. , Expected value of fuzzy variable and fuzzy expected value models, IEEE Transactions on Fuzzy Systems 10: (4) ((2002) ), 445–450. |
[22] | Liu N.Q. , Chen Y.J. and Liu Y.K. , Optimization portfolio selection problems under credibilistic CVaR criterion, Journal of Intelligent and Fuzzy Systems 34: ((2018) ), 335–347. |
[23] | Liu Y.K. , Bai X.J. , Yang K. , Parametric Credibilistic Optimization Methods, Science Press, Bejing, (2017) . |
[24] | Majewski D.E. , Wirtz M. , Lampe M. and Bardow A. , Robust multi-objective optimization for sustainable design of distributed energy supply systems, Computers and Chemical Engineering 102: ((2017) ), 26–39. |
[25] | Mezher T. , Chedid R. and Zahabi W. , Energy resource allocation using multi-objective goal programming: The case of Lebanon, Applied Energy 61: (4) ((1998) ), 175–192. |
[26] | Mokri A. , Ali M.A. and Emziane M. , Solar energy in the United Arab Emirates: A review, Renewable and Sustainable Energy Reviews 28: ((2013) ), 340–375. |
[27] | Nomani M.A. , Ali I. , Fugenschuh A. and Ahmed A. , A fuzzy goal programming approach to analyse sustainable development goals of India, Applied Economics Letters 24: (7) ((2017) ), 443–447. |
[28] | Olawumi T.O. and Chan D.W.M. , A scientometric review of global research on sustainability and sustainable development, Journal of Cleaner Production 183: ((2018) ), 231–250. |
[29] | Omri A. , CO2 emissions, energy consumption and economic growth nexus in MENA countries: Evidencec from similtaneous equations models, Energy Economics 40: ((2013) ), 657–664. |
[30] | Qiu D. , Lu C. , Zhang W. and Lan Y. , Algebraic properties and topological properties of the quotient space of fuzzy numbers based on Mares equivalence relation, Fuzzy Sets and Systems 245: ((2014) ), 63–82. |
[31] | Qiu D. and Zhang W.Q. , Symmetric fuzzy numbers and additive equivalence of fuzzy numbers, Soft Computing 17: ((2013) ), 1471–1477. |
[32] | Ramathan R. and Ganesh L.S. , Energy resource allocation incorporating qualitative and quantitative criteria: An integrated model using goal programming and AHP, Socio-Economic Planning 29: (3) ((1995) ), 197–218. |
[33] | Rodriguez-Gonzalez P.T. , Rico-Martinez R. and Rico-Ramirez V. , An integrated stochastic economic-ecological-social model with stratified-population, Ecological Modelling 368: ((2018) ), 15–26. |
[34] | Shahbaz M. and Lean H.H. , Does financial development increase energy consumption? The role of industrialization in Tunisia, Energy Policy 40: ((2012) ), 473–479. |
[35] | Soyster A.L. , Convex programming with set-inclusive constraints and applications to inexact linear programming, Operations Research 21: (5) ((1973) ), 1154–1157. |
[36] | Sun B. , Liu Y. and Yang G.Q. , A robust pharmaceutical R&D project portfolio optimization problem under cost and resource uncertainty, Journal of Uncertain Systems 11: (3) ((2017) ), 205–220. |
[37] | Yin F.H. and Chen Y.J. , The robust optimization for p-hub Median problem under carbon emissions uncertainty, Journal of Uncertain Systems 12: (1) ((2018) ), 22–35. |
[38] | Yoshimura M. , System Design Optimization for Product Manufacturing, Springer Publishing Company, Incorporated, (2010) . |
[39] | Zadeh L.A. , Fuzzy set as a basis for a theory of possibility, Fuzzy Sets and Systems 1: ((1978) ), 3–28. |


