
Empirical evaluation of continuous test-driven development in industrial settings
Abstract
BACKGROUND:
Continuous Test-Driven Development (CTDD) is, proposed by the authors, enhancement of the well-established Test-Driven Development (TDD) agile software development and design practice. CTDD combines TDD with continuous testing (CT) that essentially perform background testing. The idea is to eliminate the need to execute tests manually by a TDD-inspired developer.
OBJECTIVE:
The objective is to compare the efficiency of CTDD vs TDD measured by the red-to-green time (RTG time), i.e., time from the moment when the project is rendered not compiling or any of the tests is failing, up until the moment when the project compiles and all the tests are passing. We consider the RTG time to be a possible measurement of efficiency because the shorter the RTG time, the quicker the developer is advancing to the next phase of the TDD cycle.
METHOD:
We perform single case and small-n experiments in industrial settings presenting how our idea of Agile Experimentation materialise in practice. We analyse professional developers in a real-world software development project employing Microsoft.NET. We extend the contribution presented in our earlier paper by: 1) performing additional experimental evaluation of CTDD and thus collecting additional empirical evidence, 2) giving an extended, detailed example how to use and analyse both a single case and small-n experimental designs to evaluate a new practice (CTDD) in industrial settings taking into account natural constraints one may observe (e.g., a limited number of developers available for research purposes) and presenting how to reach more reliable conclusions using effect size measures, especially PEM and PAND which are more appropriate when data are not normally distributed or there is a large variation between or within phases.
RESULTS:
We observed reduced variance and trimmed means of the RTG time in CTDD in comparison to TDD. Various effect size measures (including ES, d-index, PEM, and PAND) indicate small, albeit non-zero, effect size due to CTDD.
CONCLUSIONS:
Eliminating the reoccurring manual task of selecting and executing tests and waiting for the results (by embracing CTDD) may slightly improve the development speed, but this small change on a level of a single developer, multiplied by a number of developers, can potentially lead to savings on the company or industry level.
1Introduction
According to the Pulse of the Profession [9], based on the 9th Global Project Management Survey by Project Management Institute, 71% of organizations report using agile approaches in their projects sometimes (31%), often (29%), or always (11%). As reported by the recent State of Agile report by VersionOne [1], 97% of respondents said that their organizations practiced agile development methods. According to the same report, 35% of respondents use Test-driven development (TDD) practice. Furthermore, TDD, along with pair programming, is one of the most interconnected practices of Extreme Programming (XP) [4]. A detailed description of TDD by example is given by Beck [5]. It is also worth mentioning that among software development practices, those commonly associated with TDD and XP are still prevalent, e.g., unit testing and refactoring are employed by 75% and 45% of the respondents, respectively, according to the State of Agile report by VersionOne [1].
Practically, all modern Integrated Development Environments (IDEs) provide support for a practice that is called continuous compilation. It is a practice of compiling the source code in the background thread after every change in the code base. The effect of the continuous compilation is an immediate feedback about all the compilation errors and warnings while developer edits the code. Continuous compilation is available in IDEs like Microsoft Visual Studio (since 2010), Eclipse, IntelliJ IDEA etc. An extension of continuous compilation called continuous testing (CT) was introduced by Saff and Ernst [22, 23]. CT adds background testing on top of the background (continuous) compilation. Thus developers are not only informed about the compilation problems but also about the results of the automated tests. So the test feedback is provided on top of the compilation feedback. CT is available in Microsoft Visual Studio since version 2012, but only in the highest and most expensive versions. The Visual Studio implementation of CT is called Live Unit Testing and is contained in the Enterprise version of Visual Studio 2017.
In 2013, we proposed the new practice Continuous Test-Driven Development (CTDD) which combines the TDD practice with CT [15]. CTDD is described in detail in Section 2. Preparing for evaluation of the new practice we have forked an open source CT tool called AutoTest.NET. We have extended it with the capabilities of gathering the life data about its execution (e.g. exact timestamps of the test triggering events, results of the tests, etc.), as well as gathered preliminary feedback about the tool via a Technology Acceptance Model (TAM)-inspired survey [15]. The results of the survey encouraged us to proceed an empirical evaluation of the new CTDD practice and supporting tool. We have found that CTDD might gain acceptance among TDD practitioners. To the best of our knowledge, we are the first who performed an empirical comparison of TDD and CTDD. The initial speculation was that if there is even a small time benefit regarding the coding velocity of a single developer then might turn out to be a visible benefit at large scale, due to the size of the software engineering industry as a whole.
Hence, we wanted to assert whether there is any time-related benefit for a developer or a small number of developers and thus compared CTDD with TDD to answer the question. If there is a performance gain due to CTDD then (taking into account the mentioned popularity of TDD among software developers) an organisation using TDD or the entire software industry could observe benefits from switching to CTDD.
This paper extends our earlier conference paper [17], including preliminary CTDD evaluation (using single case experimental design) with only one developer, by performing a second CTDD experiment (using small-n experimental design) in a different project involving two additional developers. We also present much more in depth analysis of the results of both experiments using effect size measures (discussed in Section 6.3) to provide more reliable conclusions wrt. differences between TDD and CTDD. The research goal and hypothesis stayed the same for both of the studies and are presented in Section 3.
In [16] we emphasise the value of software engineering research performed in a real industrial setting (based on real-world tasks) in contrary to the lab experiments (mainly based on toy tasks). While it was not strictly required to use close-to-reality setting to perform our research (it could also be done in a more controlled lab environment), gathering empirical evidence from real developers working in real projects, in real software engineering environments, gives us a dose of reality lab experiments often lack. That is why we believe that there is a need for a kind of lightweight/agile experimentation framework that is especially suitable in industrial software engineering setting, see our Agile Experimentation Manifesto [16].
The large scale experimental research, although doable, is often not feasible in profit driven setting. It is mainly because it is often too expensive to involve professional developers in full-fledged experiments (e.g., doing the same (sub)system twice using different methods). For example, the CODEFUSION company was interested in possible benefits of CTDD, but not interested in full-fledged experiments. That is why the idea of Agile Experimentation and using single-case/small-n experimental designs was coined by the first author and accepted by the company.
We compared the TDD and CTDD practices, described in Section 2, in a single-case randomized blocks design with two conditions. We treat TDD as a baseline1. and CTDD as an intervention (details are described in Section 3.3). We have performed two experiments to asses the efficiency of the CTDD practice. Plan, execution (including the tool set we built to perform the experiments), results, as well as analysis and discussion of the results of the conducted experiments are presented in Section 3, 4, 5, 6, respectively. The results of the first experiment were discussed earlier [17]. The results of the second experiment and detailed analysis of the results of both experiments (including four effect size measures) are presented in this paper for the first time.
2Background
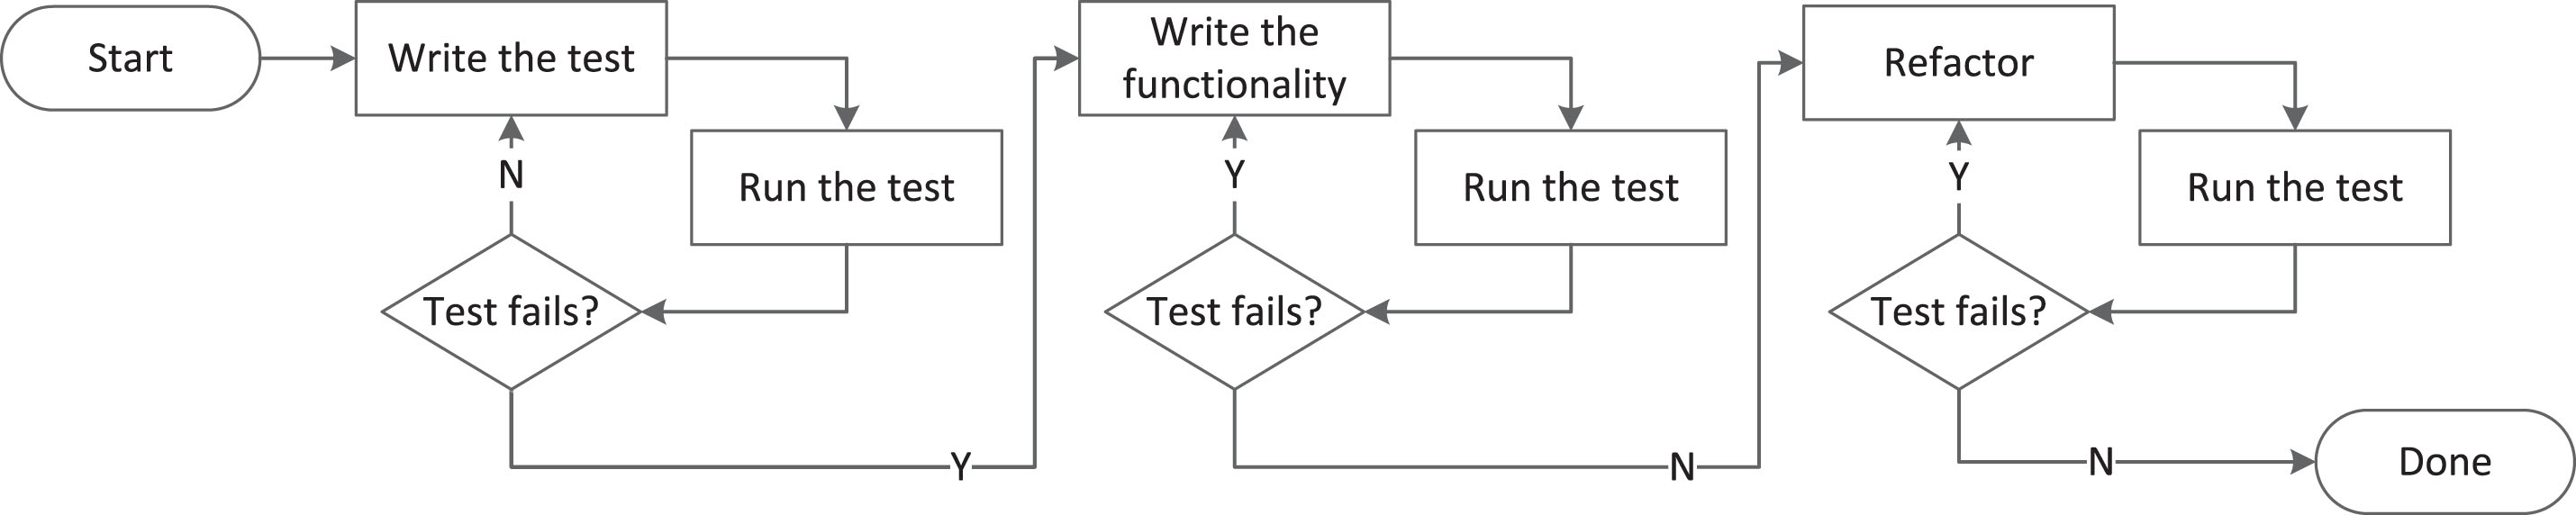
Figure 1 shows a typical TDD practice flow. The developer begins by writing a test. Then she executes the test. She expects the test or even the build to fail because there is no implementation yet to satisfy the test. Then she proceeds to quickly write the functionality that will satisfy the test. Executes the test to check if it succeeds. Then refactors the code and repeats the process several times striving for complete implementation. While doing this she is executing the tests continuously checking whether she did not break anything.
Fig.1
Test-Driven Development.
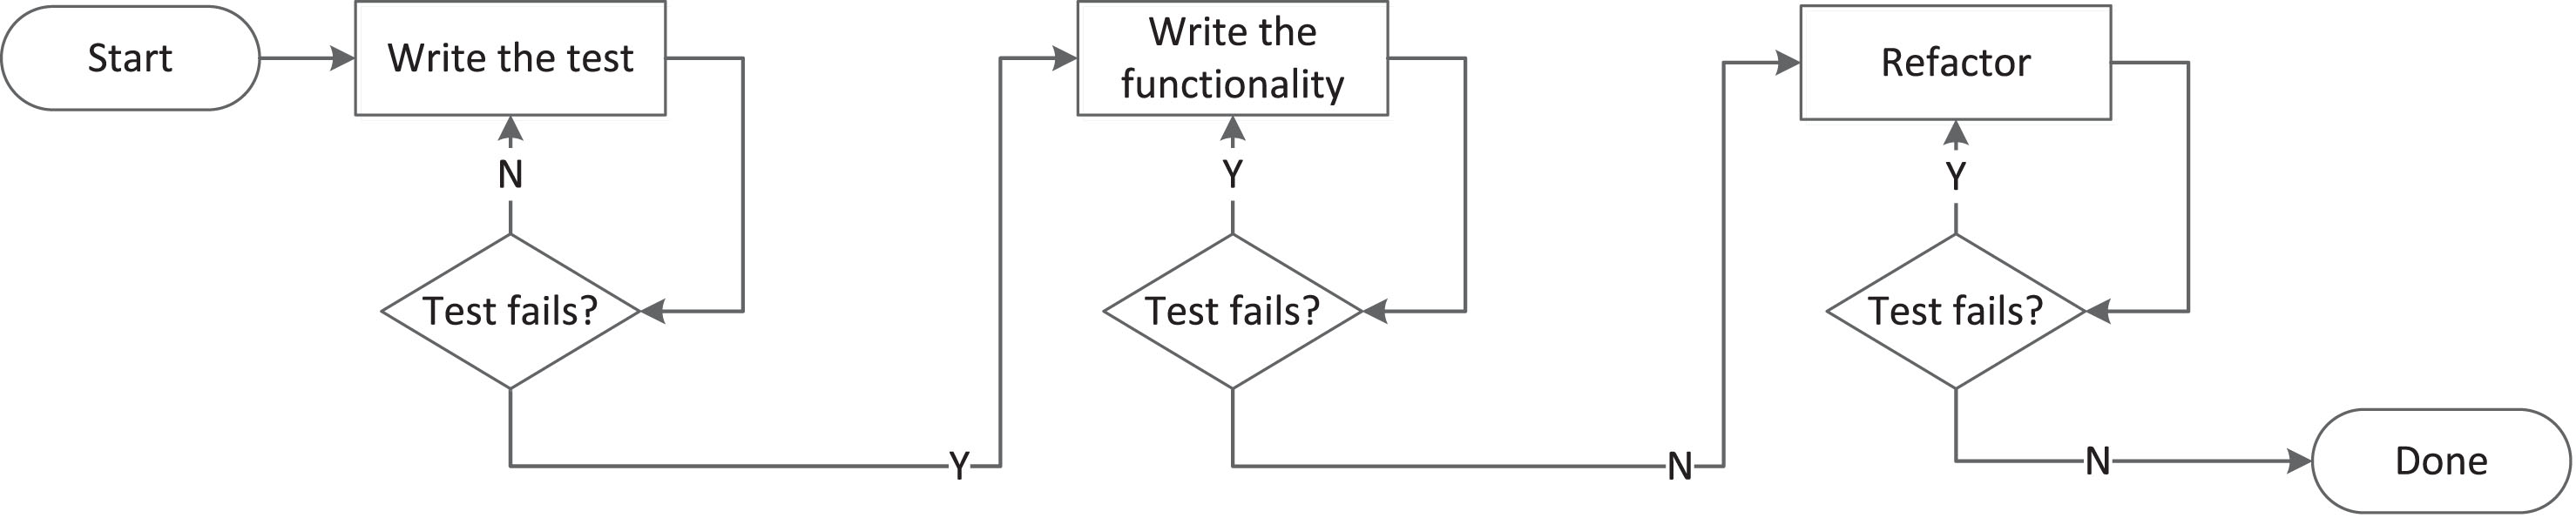
The Figure 2 shows the subtle but meaningful change in the flow. We proposed to add a continuous notion to the TDD practice by virtually freeing the developer from the duty to manually execute the tests. In CT and CTDD the code is compiled and tested automatically mostly after the developers saves the changes in the file. She is not forced to select specific tests and execute them herself. The need to manually select and trigger the tests by pressing a button or issuing a command is removed. The tests are performed in the background. It potentially adds a value to the process by giving to the developer a more frequent and earlier feedback from amended code.
Fig.2
Continuous Test-Driven Development.
3Experiments planning
3.1Experiments goal
The overall goal of the experiments is to determine the difference in software developer performance using CTDD compared with TDD. The objects of this study are professional software developers working in a real software development project. All of the participants are computer science graduates with two to five years in professional software development. One held BSc, while two held MSc degree at the time of performing the experiment. All of them are TDD practitioners, although the level of experience in TDD practice varied among them. In Experiment 1 we had single software engineer involved, in Experiment 2 the developer 1 was also a software engineer and developer 2 was a junior software engineer. All of them have used TDD in previous projects they were involved in. The usage of TDD is completely optional in the projects the developers are working in. If they find it suits the development in one way or another they are allowed and encouraged to use TDD. The experiment was conducted on modules where TDD was suitable from the point of view of the developer.
The developers will use TDD and CTDD simultaneously and the tools they use will differentiate the practice. Randomization will be used during the assignment of the individual classes to TDD or CTDD.
The purpose is to measure and evaluate the individual developer performance when she uses CTDD (introduced by the authors in [15]) instead of TDD. Form the point of view of the researcher it is interesting if there is any systematic difference in the TDD vs. CTDD performance. RTG time is the measure with which the individual performance of the software developer will be measured. It is also where the difference between the TDD and CTDD practices, which are similar, may reveal. RTG stands for red-to-green.
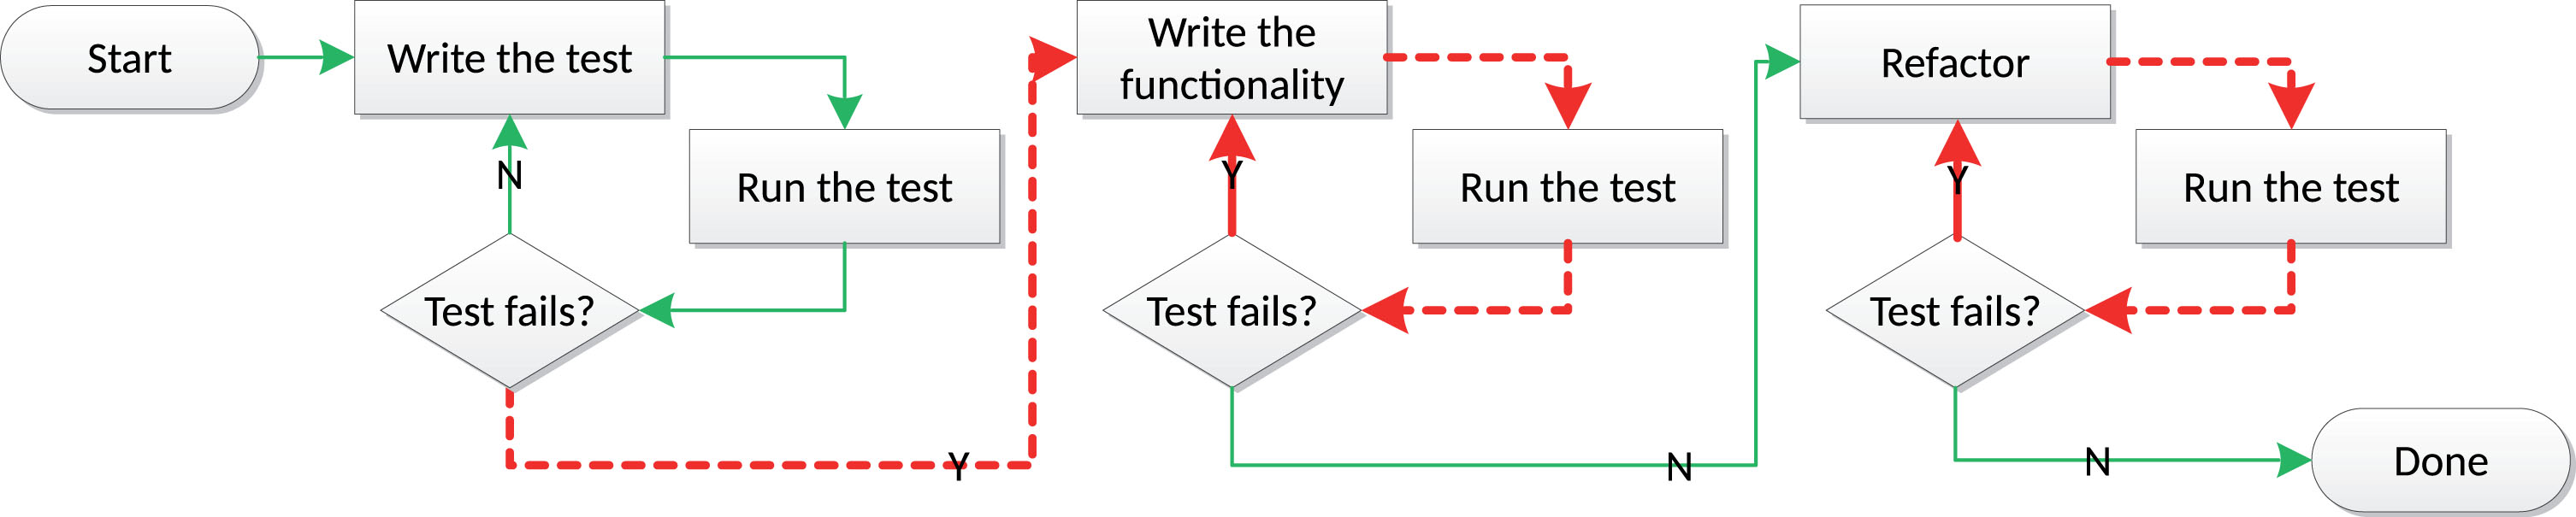
Let tred in RTG be the moment in time when the whole software project is transitioning to the red state, i.e., is rendered not building. Whatever the reason is. It is in the red state when there is a problem with producing working software on any stage of the build process. It can not compile due to syntax errors in source code or any of the automated tests is failing for whichever reason (e.g., error in code under test or in test itself). Let tgreen in RTG be the moment in time when the project is transitioning from red to green, i.e., to building properly again. It compiles and all the tests are passing (no matter the strategy used to satisfy the test: obvious implementation, fake it or triangulation [14]). The shorter the time between the tred and tgreen the quicker the turnover—the less time developer is spending in the TDD loop transitioning from the red state to the green one.
Figure 3 depicts the TDD loop with the RTG time highlighted as red dashed lines with arrows. In every TDD loop the developer runs the tests and checks the result. Depending on the result she proceeds to the next step. After writing the initial test it should fail—there is no implementation to satisfy the test. The RTG time begins. The developer proceeds to satisfy the test in the easiest possible manner. Then she runs the tests and checks the result. If the test is satisfied then the RTG time ends. The developer proceeds to the refactoring phase. In this phase the RTG time is possibly triggered many times when the developer refactors the code rendering the tests to fail and then fixing it to satisfy the tests again. We are measuring the RTG time because it encapsulates all the developer manual tasks to run the tests. If we can eliminate those manual tasks from the TDD loop, as explained in the earlier section by incorporating the continuous notion into the TDD practice, we can shorten the RTG time. It is desirable that the developer spends more time doing his actual work of developing required features and tests than to be engaged in the mundane and recurring “mechanical” work involving manual selection and execution of tests. The task of selecting and executing the tests and then waiting for the feedback to be returned is constantly occurring while using TDD. To the extend that the developer might omit some test feedback loops which might be risky. The conjecture is that if we can eliminate this constantly repeated task using CTDD, we can reduce the aforementioned risk and time waste and make the developers more productive. As a side effect it might ensure better TDD abidance by performing relentlessly the tasks the developer might omit.
Fig.3
RTG time - red-to-green time in the TDD loop. Red arrows indicate the time measured in the experiment.
The context embraces real-world commercial software development projects. First is a civil engineering software project for doing the calculation of various concrete constructions. It is a Windows desktop application using Windows Presentation Foundation to create GUI. Second is a software for in-house waste management in a company that is producing or processing dangerous wastes. It is a web application that uses ASP.NET MVC to create GUI. Both projects are using C# as a programming language and are written using Microsoft Visual Studio. Table 1 shows some additional data about the experiments and the software projects under investigation.
Table 1
Overview of CTDD experiments tab:experiments
| Experiment 1 | Experiment 2 | |
| Project | Industry grade construction | Industry grade waste |
| engineering software | management software | |
| KLOC | 39.2 | 277.3 |
| Avg. Methods | 7.31 | 9.80 |
| per Class | ||
| Avg. Statements | 3.78 | 3.04 |
| per Method | ||
| Avg. Complexity [19] | 1.73 | 1.71 |
| Developers | 2 | 2 |
| Developers participating | 1 | 2 |
| in experiment | ||
| Environment / language | .NET / C# | .NET / C# |
| IDE | Visual Studio 2012 | Visual Studio 2015 |
| IDE Extensions | AutoTest.NET4CTDD, | ResharperSensor, |
| NActivitySensor | NActivitySensor |
The goal template proposed by Basili et al. [3] was used to summarize the scope of the study as follows: Analyze the CTDD practice
For the purpose of evaluation
With respect to its efficiency measured by the RTG time
From the point of view of the researcher
In the context of a professional software developer in real-world (industrial) software development project(s).
3.2Hypothesis formulation
A precise statement about what will be evaluated in an experiment is the central aspect of experiment planing. Hence we formulated the null and alternative hypotheses:
H0: There is no difference in the developer coding velocity, measured as the RTG time (TRTG) introduced earlier in Section 3, between the CTDD and TDD observation occasions, i.e., H0: TRTG (CTDD) = TRTG (TDD).
H1: Using CTDD in a real software project makes the developer faster in comparison to TDD in terms of the RTG time, i.e., H1: TRTG (CTDD) < TRTG (TDD).
In Section 3.1, we mentioned that we expect the CTDD to reduce the waste related to the RTG time so we are predicting a direction in the effect and thus we could assume directional alternative hypothesis.
3.3Experimental design
Performing an empirical study in the real world, commercial software development project, apart from obvious challenges, has important advantages, e.g., increasing the external validity of the obtained results. It is hard to obtain this level of external validity by performing experiments with computer science students on a toy project at university. It is also the case that we decided to grab the opportunity we had an access to the CODEFUSION company (through one of the authors). As a result, our decision to perform the study in the real project should help us to generalise the results of our study to similar industrial projects.
Despite having access to the professional software developers we needed to take into consideration that a software developer is valuable and expensive “resource” in the IT industry. Developer’s time is a scarce resource and the goal of the various parties (researcher and business owner) regarding the experiment do not necessary converge. The researcher is often interested in improving the industry process through a large, controlled experiment where reliable conclusions can be drawn. The business or project owner is mostly interested in the return of investment (ROI). The incorporation of the results of an experiment are interesting for business owner only if the positive impact to the project was proven. From the business point of view the professional developers are expensive assets, seldom available for scientific research.
Because we had access to a small software development company we up front gave up the idea to perform large scale experiment. Also performing the project or its part twice once with use of TDD and once with CTDD was not an option. The company we had access to, was co-run by one of the authors of this paper, while one of the customers of that company had scientific background and was kind enough to allow some experimentation provided the impact on the project will be reasonably small. Furthermore, we could perform a part of the experiment in an in-house product development project. Because the developers had full freedom to choose weather to use TDD in the project or not we had on of two developers involved in the project using TDD in the first experiment and both developers involved in the second project using (i.e., small-n). That was the reason we were not controlling the TDD process conformance in the experiments. The developers had no reason not to use the practice if they freely choosed to do so in the fist place.
An important aim of the experimental design is to mitigate threats to internal validity related to alternative explanations. Randomization can be seen as a useful technique to mitigate this threat. Because of the constraints imposed by the company and the project we were not able to assign the interventions (treatments) at random to a large enough number of participants (subjects) as it is the case in classic, large-n experimental designs. What we, however, were able to do was to randomly assign treatments to observation occasions to mitigate the threads to internal validity. As a result, we were able to make use of randomization in single case and small-n experiments.
Even though it is possible to randomly allocate treatments to observation occasions it is unfortunately not possible to use classic statistical tests (like t-test) to analyze the data from single-case or small-n experimental designs. The assumptions made in the classic tests are different. The most prominent assumption is that the observations are independent. It is obviously not the case when we collect a series of measurements on a single case.
Instead of using classic tests we decided to use randomization tests that fit better for our scenario. They do not require the observations to be independent, and do not relay on rather restrictive assumption of random sampling from a population.
Using single-case/small-n experimental design combined with randomization tests [7] (that are the core elements behind our idea of Agile Experimentation in software engineering [16]) were until now mainly used in the social psychology, medicine, education, rehabilitation, and social work [10], although there were first inroads into using those techniques in software engineering as well [8, 16, 17, 25].
Dugard et al. [7] discuss different experimental designs considering the constrains the project characteristics impose on those designs. Taking into account the imposed constraints, we found the single-case randomized blocks design with two conditions experimental design to be suitable for our needs because:
1. We are treating the participants as single-cases.
2. We have two conditions to compare: TDD and CTDD.
3. We can arrange those two conditions in blocks.
4. We can assign conditions to observation occasions in blocks at random (further details how we did it are provided in Section 4)
To introduce required randomization in our experimental design we decided to use randomized block. This design is one of the schemas in alternation designs. The simplest of the alternation designs is a completely randomized design where the treatments are assigned in a fully random manner. As such some possible assignments can be rather undesirable. For example, such that have no changes in treatments, because the randomization algorithm returned the same treatments all the time (e.g., AAAAAA or BBBBBB) or the changes in treatment was assigned only once during the randomization (e.g., AAABBB or BBBAAA). Random block design deals with that problem by introducing a block. The algorithm we implemented in our tool was based on two conditions. The first treatment in block was always randomly assigned and the second was a reverse. So, the possible assignments, if we have six measurement occasions, are as follows: AB AB AB, BA BA BA, AB AB BA, BA BA AB, AB BA AB, BA AB BA, AB BA BA, BA AB AB.
4Experiment execution
Two experiments were conducted using the same experimental design but different tools. Table 1 shows the overview of the experiments2. Both experiments were conduced on two different industry grade software projects. As mentioned before, the results of the first experiment were reported by the authors in [17].
In the first experiment, we had two developers, but only one was using TDD\CTDD, while in the second one we had also two developers and both of them were using TDD\CTDD. During both experiments the developers were using Visual Studio (version 2012 in the first experiment, while version 2015 in the second one).
In order to gather the data needed to assess the CTDD practice, in the first experiment, we had to extend one tool and develop another.
The first tool AutoTest.NET4CTDD is a fork of an open source Visual Studio add-in AutoTest.NET. We have made it possible for AutoTest.NET to gather the real time statistics during its usage. This feature was not available in the built in CT capabilities of Visual Studio. AutoTest.NET4CTDD detects what tests need to be run based on the changes the developer makes in code. It executes all the detected tests regardless of its purpose and origin. Those tests can formally be unit, integration or even system tests. As long as the change the developer made is related to the test that is automated, it will be run. If those tests were used as regression tests, AutoTest.NET4CTDD will run them.
Another feature that we have built into this tool was the ability to turn the automatic testing off for certain classes. If the background testing was turned on, we have had the CTDD phase. If the background testing was turned off, the developer needed to execute tests manually which gave us the TDD phase. The tests in both phases were executed in an user interface non-blocking thread (Visual Studio was responsive all the time). The differentiation weather a class needs to be developed using TDD or CTDD is made using a Random Block Generator tool described later in that section.
AutoTest.NET4CTDD was able to gather the data about the tests performed when developer used CTDD. What we needed was another tool that could allow us to gather the data when developer used TDD, when no CT is performed. We have searched for a ready made extension of this kind available for Visual Studio. Unfortunately we did not find any suitable for our needs so we have decided to develop one, called NActivitySensor, ourselves. We described this tool in the appendix of [16].
With AutoTest.NET4CTDD and NActivitySensor at hand, we were able to gather the data needed for our empirical investigation of CTDD vs TDD. The measure we have used to compare both practices is red-to-green time (RTG time), see Section 3.1, which can be easily measured using the tools we have developed as they provide the time stamps of all the events needed to calculate it. The RTG time is where the advantage of using CTDD practice could appear over the use of TDD. RTG time is the right measure to differentiate between TDD and CTDD because it measures the time that the developer is wasting by selecting and executing the tests, waiting for the results that were not prepared in advance in the background thread, and checking the results. All else being equal apart from the treatment (TDD vs CTDD) the smaller the RTG time the quicker the developer.
The second experiment was conducted in a project where Visual Studio 2015 was used. At the time of conducting the experiment the developers were using Resharper—a popular Visual Studio extension3 that already contained the continuous testing infrastructure. So Resharper (and not AutoTest.NET4CTDD) was used in this experiment to perform CTDD. Unfortunately Reshaper does not provide any data gathering functionality. In order to get the test execution time stamps and results from Resharper we needed to develop the third tool, a plug-in for Resharper called RSActivitySensor.
To introduce randomization to the experiment as required in the single-case randomized blocks design with two conditions experimental design, we implemented a subsequent software tool that we called Random Block Generator. RSActivitySensor and Random Block Generator are described in an online appendix [18].
It was agreed upon that the impact of the research on the developers working in the project should be minimal. The Random Block Generator tool usage was the only one manual action the developers needed to perform in the experiment. The tool randomly decides if the class the developer is adding to the project will be developed using TDD or CTDD. The developer then needs to decorate the class with the comment //AUTOTEST_IGNORE in the first line of the file if it is to be developed using traditional TDD. Both AutoTest.NET4CTDD and RSActivitySensor read this comment and act accordingly by disabling the CT. In that case the developer needs to select and execute the test manually.
All the data gathered during the experiments was stored in two relational databases. One was for AutoTest.NET4CTDD and one for RSActivitySensor/NActivitySensor. We calculated the RTG time from the time stamps in the database.
We released NActivitySensor and AutoTest. NET4CTDD as open source projects that are available from GitHub4.
5Results
The statistical analysis of the data was performed using R [21], while to aid our single-subject data analysis we used an SSDforR [2] package.
In both experiments we began the comparison between the TDD and CTDD phases by calculating descriptive statistics including measures of central location (e.g., mean, trimmed mean), as well as variation in both phases. As is often recommended, we have looked for the outliers and the observations that were beyond the two SD were further investigated. In the first experiment, we have found them to be the RTG times including the midnight (when the project with some failing test(s) was left until the next working day). As a result, we were sure that we need to remove the outliers. In the second experiment we followed the same practice—checked all of the observations that were beyond the two SD and, if it was reasonable, removed from the further analysis (6,7% of the observations from developers involved in the first experiment were considered outliers; in the second experiment the numbers were 4.2% and 4.8%).
The subsequent RTG times from Experiment 1 visualized in Figure 4 and Experiment 2 visualized in Figures 5 and 6 were first sorted by the TDD and CTDD phase and then depicted on the diagrams to better facilitate the presentation of descriptive statistics.
![Subsequent RTG durations [min] in phases A (TDD) and B (CTDD) – Experiment 1 (after [17]).](https://content.iospress.com:443/media/ifs/2019/37-6/ifs-37-6-ifs179369/ifs-37-ifs179369-g004.jpg)
Fig.5
Subsequent RTG durations [min] in phases A (TDD) and B (CTDD) – Experiment 2, Developer 1.
![Subsequent RTG durations [min] in phases A (TDD) and B (CTDD) – Experiment 2, Developer 1.](https://content.iospress.com:443/media/ifs/2019/37-6/ifs-37-6-ifs179369/ifs-37-ifs179369-g005.jpg)
Fig.6
Subsequent RTG durations [min] in phases A (TDD) and B (CTDD) – Experiment 2, Developer 2.
![Subsequent RTG durations [min] in phases A (TDD) and B (CTDD) – Experiment 2, Developer 2.](https://content.iospress.com:443/media/ifs/2019/37-6/ifs-37-6-ifs179369/ifs-37-ifs179369-g006.jpg)
What we found across all of the analysed experiments and developers is that widely used measures of central locations, means and more robust trimmed means, as well as standard deviations of the RTG times are lower in CTDD than TDD, see Figures 4, 5 and 6. It is also visualised by boxplots presented in Figures 7, 8 and 9, as well as summarised in Table 2.
Fig.7
Boxplot for RTG duration [min] in A (TDD) and B (CTDD) – Experiment 1 (after [17] with added mean).
![Boxplot for RTG duration [min] in A (TDD) and B (CTDD) – Experiment 1 (after [17] with added mean).](https://content.iospress.com:443/media/ifs/2019/37-6/ifs-37-6-ifs179369/ifs-37-ifs179369-g007.jpg)
Fig.8
Boxplot for RTG duration [min] in A (TDD) and B (CTDD) – Experiment 2, Developer 1.
![Boxplot for RTG duration [min] in A (TDD) and B (CTDD) – Experiment 2, Developer 1.](https://content.iospress.com:443/media/ifs/2019/37-6/ifs-37-6-ifs179369/ifs-37-ifs179369-g008.jpg)
Fig.9
Boxplot for RTG duration [min] in A (TDD) and B (CTDD) – Experiment 2, Developer 2.
![Boxplot for RTG duration [min] in A (TDD) and B (CTDD) – Experiment 2, Developer 2.](https://content.iospress.com:443/media/ifs/2019/37-6/ifs-37-6-ifs179369/ifs-37-ifs179369-g009.jpg)
Table 2
Descriptive statistics (RTG duration [min])
| Measurement | Experiment 1 | Experiment 2 | Experiment 2 | |||
| Developer 1 | Developer 2 | |||||
| A (TDD) | B (CTDD) | A (TDD) | B (CTDD) | A (TDD) | B (CTDD) | |
| number of observations | 85 | 55 | 21 | 46 | 68 | 31 |
| median (Md) | 1.768 | 3.018 | 3.85 | 2.58 | 1.615 | 1.820 |
| mean (M) | 12.372 | 8.388 | 5.051 | 3.247 | 2.683 | 2.088 |
| 10% trimmed mean (tM) | 7.713 | 5.67 | 4.560 | 2.761 | 2.248 | 1.927 |
| standard deviation (SD) | 20.724 | 12.459 | 4.009 | 2.833 | 2.601 | 1.451 |
| minimum (0% quantile) | 0.275 | 0.295 | 0.88 | 0.42 | 0.25 | 0.43 |
| maximum (100% quantile) | 116.746 | 60.286 | 15.68 | 12.02 | 14.73 | 5.25 |
| IQR | 13.439 | 9.804 | 4.5700 | 2.7475 | 2.1925 | 2.2150 |
| 25% quantile | 0.584 | 0.758 | 1.98 | 1.09 | 1.000 | 0.895 |
| 75% quantile | 14.023 | 10.562 | 6.5500 | 3.8375 | 3.1925 | 3.1100 |
The only measure of central location that does not follow this, otherwise clear, trend was median in Experiment 1 (see Figure 4, 7 and Table 2) and developer 2 in Experiment 2 (see Figure 6, 9 and Table 2). This is something we did not expect that could contradict our hypothesis. Therefore, now we will focus on detailed analysis and discussion of the obtained results.
6Detailed analysis and discussion of results
In this section we discuss in detail results of the performed experiments from the perspective of measures of central location, measures of variations, as well as effect size measures which are crucial to provide more reliable conclusions about differences between TDD and CTDD.
6.1Measures of central locations
Visual examination of the boxplot in Experiment 1 shows a slight drop in the RTG time in the CTDD phase of that experiment. The boxplot for developer 1 in Experiment 2 indicates an evident drop of the RTG time in the CTDD phase of the experiment. However, the drop is not so evident for developer 2 in Experiment 2. The reason for that might be that the developer 2 was less experienced and was using AutoTest.NET4CTDD in other way than the other developers. It might be that the developer was also the developer that was not strictly following the TDD rules. This was hard to control and constitutes a threat to validity. On the other hand it was entirely developers decision whether to use TDD and when. That is why one of the developers in Experiment 1, who preferred not to use TDD, was not involved in the experiment. Hence, we feel that the process conformance threat, albeit present, was minimised in this way.
It might also be a good idea to build into the research tools the ability to gather more telemetry data, e.g., how exactly the developer is using the IDE and our tool, what tool windows are visible in the IDE and when etc. It could give us in further information to reason about differences between developers.
As pointed out in Section 5, the RTG time mean across all of the experiments and involved developers was smaller in CTDD than TDD. It suggests a positive impact of the CTDD practice. However, mean is not a robust measure of the central location and can be strongly influenced by outliers, especially when the number of observations is small.
One of the widely known robust measures of the central location is the median. As pointed out in Section 5, the medians across developers were not consistent, i.e., the median of the RTH time for CTDD was lower in the case of developer 1 in Experiment2, while higher than TDD in Experiment 1 and in the case of developer 2 in Experiment 2. This might be surprising. However, in general the median is not ideal [11]. Even though the median is robust, it ignores all but one or two observations. As a result, estimates of the standard error of the median are not efficient. They may also be unreliable if there are duplicate values in the data. Therefore, trimmed means are often recommended robust measures of the central location while analysing software engineering experiments [11].
The 10% trimmed means for the data in Experiment 1 and Experiment 2, for both developers, suggest the same positive impact of the CTDD practice versus the traditional TDD. Based on the 10% trimmed means, the RTG time reduction in Experiment 1 was about 123 seconds, while in Experiment 2 in the case of developer 1 was 108 seconds, and in the case of developer 2 was over 19 seconds.
6.2Measures of variations
Apart from the measures of central tendcency, Table 2 reports the maximum and minimum. The difference between these values form a very simple measure of variation—a range. It is clearly the case that variation measured by the range is smaller in CTDD than TDD across all of the experiments and analyzed experiments.
The more valuable measure of statistical dispersion is the interquartile range (IQR) or the middle 50%. IQR is the difference between the 75th (third quantile) and 25th (first quantile) percentiles.
We have found a great deal of variation in Experiment 1. Not only the variation in the middle 50% of the data was substantial, but also IQR for TDD (IQR1TDD = 14.023 - 0.584 = 13.439) was higher than for CTDD (IQR1CTDD = 10.562 - 0.758 = 9.804). In Experiment 2, we observed a similar pattern, the variation in the middle 50% of the data, in case of developer 1, was higher in TDD (IQR2TDD1 = 6.55 - 1.98 = 4.57) than CTDD (IQR2CTDD1 = 3.8375 - 1.0900 = 2.7475), while in case of developer 2 they were similar (IQR2CTDD2 = 3.110 - 0.895 = 2.215, IQR2TDD2 = 3.1925 - 1.000 = 2.1925). Generally, the variation in the middle 50% of the data in Experiment 2 was much smaller than in Experiment 1. A possible explanation of this phenomenon might be higher complexity of the project used in Experiment 1 (calculation library in civil engineering) than the project used in Experiment 2 (waste management).
We also report standard deviation (SD) in Table 2, which is another helpful measure of variation. It describes the average distance between the scores and the mean. According to the 68-95-99.7 rule 68% of the scores in normal distribution are within the 1 SD below and the 1 SD above the mean, 95% are within the 2 SDs and 99.7% are within the 3 SDs below and above the mean.
Standard deviations (SD) calculated in Experiment 1 provide additional empirical evidence to the claim that variation when the CTDD practice was used was much smaller than when TDD was used (SDCTDD = 12.459 vs. SDTDD = 20.724). This is a desirable effect of the CTDD practice that is designed to provide fast and continuous feedback to the developer informing him immediately when tests do not pass. We also used this common measure of variation (SD) which measures the distance between the scores and the mean again in Experiment 2 and we observed exactly the same pattern. The SD in Experiment 2 was SDTDD = 4.009 vs. SDCTDD = 2.833 for developer 1 and SDTDD = 2.601 vs. SDCTDD = 1.451 for developer 2. Again, it is straightforward to explain as the aim of the new practice (CTDD) is to provide a fast feedback when tests do not pass, thus the reduced variance in the RTG time thanks to CTDD.
6.3Effect size
The importance of the experimental effect is often calculated using effect size measures. They can be very helpful, as they provide a measure of the magnitude of a treatment effect (CTDD vs. TDD in our case) and thus complement the statistical significance of the test statistic in a important way. Effect size measures are much less affected by the sample size than the statistical significance and, thus, are better indicators of practical significance [11, 14].
In our case, effect size measures quantify the change between the RTG times in the TDD and CTDD phases of the experiments. To better grasp the effect of CTDD vs TDD, apart from typically reported traditional effect size measures ES and d - index calculated with the help of the SSDforR package, we also report more sophisticated effect size measures PEM and PAND. They are considered to be more appropriate when data are not normally distributed or there are multiple phases to be compared, or there is a large variation between or within phases, which is indeed the case in our experiments.
Effect size measure ES is defined as:
(1)
It is a difference between the RTG times means in the CTDD and TDD phases divided by the standard deviation of the TDD phase.
In our study the variation between the phases differs (see Table 2). In such case it is better to use d - index as the effect size measure. It is similar to ES but uses pooled standard deviation instead of standard deviation. Pooled standard deviation is a weighted average of standard deviations for two groups. d - index does not show the direction of the effect and can be defined as:
(2)
Neither mean nor median should be used if there are trends in the data, and the same applies to effect size measures ES or d - index. We have calculated the trends using ordinary least squares (OLS) regression because it is considered an accurate measure of the trend. The OLS was calculated for both experiments. In Experiment 1, the multiple R-squared values were very close to 0 (0.005 for the phase A (TDD) as well as B (CTDD)), while the p-values for the slopes in both phases were not statistically significant (p > .05), p = 0.519 for A and p = 0.608 for B. Hence, we concluded that there were no (or were negligible) trends in the data.
The situation was similar in Experiment 2. The multiple R-squared values for developer 1 were 0.088 for the phase A and 0.013 for the phase B, with p-values 0.192 and 0.457 accordingly. For developer 2 we measured multiple R-squared values of 0.006 in phase A and 0.101 in phase B. The p-values for trend were 0.533 and 0.0814. The p-value in phase B was not so far from 0.05 but still above the threshold what allows us to assert the trend as small enough to proceed and calculate effect size to measure the magnitude of change between A (TDD) and B (CTDD).
In the first experiment, we have calculated ES = -0.192 and d - index = 0.222 which can be interpreted as small, albeit non-zero effect size [6]. In Experiment 2, for the developer 1 we have ES = -0.45018 and d - index = 0.55689 and for developer 2 ES = -0.22878 and d - index = 0.25788. It is a bit higher, but still small albeit non zero effect in all cases. It is worth mentioning that the minus in ES indicates the desirable direction of the change—the drop of the RTG time in CTDD.
Because we had a relatively large deal of variation in both experiments and within both phases we decided to use non-overlapping effect size measures: the percentage of the data points in intervention phase (CTDD) exceeding the median of the baseline phase (TDD), i.e., PEM [13], and the percentage of all non-overlapping data, i.e., PAND [20]. They are calculated by using the percentage of data points in the CTDD phase that exceeds a specific point in the TDD phase [12].
In Experiment 1, we have calculated PEM = 0.38, which can be interpreted as “not effective” according to [13, 24], and PAND = 0.61, which can be interpreted as “debatable effectiveness” according to Parker et al. [20].
In Experiment 2, for developer 1 PEM = 0.74 which can be interpreted as “moderate effectiveness”, while for developer 2 PEM = 0.48—“not effective”. Further, in the case of developer 1 we have calculated PAND = 0.3 which is “not effective” and PAND = 0.69 which is “debatable effectiveness” (it is worth noting that 0.69 is the maximal value in the “debatable effectiveness” range, just below the threshold value for “moderate effectiveness”).
7Conclusions and future work
The results of the second quasi-experiment seem to corroborate the findings we reported in [17]. It seems to be a small effect of using the CTDD practice compared to the TDD practice regarding the RTG time. We have noted drop in the mean, the trimmed mean and variation of the RTG time in CTDD vs TDD across both experiments. Additionally, non-overlapping data effect size measures, developed to deal with large variations within both phases, classified the size of the effect due to CTDD as between “moderate effectiveness” and “not effective”.
Obtained results seem to align with common intuition. The act of selecting and executing tests after the changes are made is a simple task. The expected time difference will not be big, but still worth empirical investigation taking into account how often it happens and how many software engineers use TDD (vide Section 1).
The current results are showing that our initial hypothesis, presented in Section 3, seems to be backed by the data. The calculated effect size was moderate at best thus further investigation needs to be made to obtain more reliable empirical evidence. The impact of using CTDD on a day to day work of a single developer is rather small, but a common admission of the new CTDD practice in a team or in the whole organisation might positively influence its performance.
This study can be seen as an example of and a guide to the so called Agile Experimentation and using small-n and single case experiments in software engineering [16, 17]. What we think is important, is that Agile Experimentation may bridge the gap between academia and business, between researchers and business owners or developers due to negligible cost of experimentation and still valuable feedback for developers/business and researchers.
Acknowledgments
Lech Madeyski was partially supported by the Polish Ministry of Science and Higher Education under Wroclaw University of Science and Technology Grant 0401/0201/18.
References
[1] | The 12th annual State of Agile Report. Technical report, Versionone.com, 2018. |
[2] | Auerbach C. and Zeitlin. W. SSDforR: Functions to Analyze Single System Data, 2017. R package version 1.4.15. |
[3] | Basili V.R. , Caldiera G. and Rombach H.D. The goal question metric approach. In Encyclopedia of Software Engineering. Wiley, (1994) . |
[4] | Beck K. Extreme Programming Explained: Embrace Change, Addison-Wesley, Boston, MA, USA, (1999) . |
[5] | Beck K. Test Driven Development: By Example, Addison-Wesley, Boston, MA, USA, (2002) . |
[6] | Bloom M. , Fischer J. and Orme J. Evaluating Practice: Guidelines for the Accountable Professional, Pearson/Allyn and Bacon, (2008) . |
[7] | Dugard P. , File P. and Todman J. , Single-case and Small-n Experimental Designs: A Practical Guide to Randomization Tests. Routledge, 2nd edition, (2012) . |
[8] | Harrison W. N = 1: An alternative for software engineering research? 1997. Based upon an editorial of the same title in Volume 2, Number 1 of Empirical Software Engineering (1997). |
[9] | Institute P.M. Pulse of the profession: Success rates rise: Transforming the high cost of low performance, 2017. |
[10] | Kazdin A.E. Single-case Research Designs: Methods for Clinical and Applied Settings, Oxford University Press, (2011) . |
[11] | Kitchenham B. , Madeyski L. , Budgen D. , Keung J. , Brereton P. , Charters S. , Gibbs S. and Pohthong A. , Robust Statistical Methods for Empirical Software Engineering. Empirical Software Engineering 22: (2) ((2017) ), 579–630. |
[12] | Lenz A.S. Calculating effect size in single-case research, Measurement and Evaluation in Counseling and Development 46: (1) ((2013) ), 64–73. |
[13] | Ma H.-H. An alternative method for quantitative synthesis of single-subject researches, Behavior Modification 30: (5) ((2006) ), 598–617. |
[14] | Madeyski L. Test-driven Development: An Empirical Evaluation of Agile Practice, Springer, (Heidelberg, London, New York), (2010) . |
[15] | Madeyski L. and Kawalerowicz M. Continuous Test-Driven Development - A Novel Agile Software Development Practice and Supporting Tool. In Maciaszek L. and Filipe J. , editors, ENASE 2013 - Proceedings of the 8th International Conference on Evaluation of Novel Approaches to Software Engineering ((2013) ), pp.260–267. |
[16] | Madeyski L. and Kawalerowicz M. Software Engineering Needs Agile Experimentation: A New Practice and Supporting Tool. In pp. 149–162. Springer, Software Engineering: Challenges and Solutions, volume 504 of Advances in Intelligent Systems and Computing ((2017) ). |
[17] | Madeyski L. and Kawalerowicz M. Continuous Test-Driven Development: A Preliminary Empirical Evaluation Using Agile Experimentation in Industrial Settings, ((2018) ), pp. 105–118. Springer International Publishing, Cham. |
[18] | Madeyski L. and Kawalerowicz M. Appendix to the paper “Empirical Evaluation of Continuous Test-Driven Development in Industrial Settings”, (2019), http://madeyski.e-informatyka.pl/download/MadeyskiKawalerowicz19CTDDAppendix.pdf. |
[19] | McConnell S. Code Complete: A Practical Handbook of Software Construction, Microsoft Press, Redmond, WA, USA, (1993) . |
[20] | Parker R.I. , Hagan-Burke S. and Vannest K. Percentage of All Non-Overlapping Data (PAND): An Alternative to PND, The Journal of Special Education 40: ((2007) ), 194–204. |
[21] | R Core Team. R: A Language and Environment for Statistical Computing, R Foundation for Statistical Computing, Vienna, Austria, 2016. |
[22] | Saff D. and Ernst M.D. Reducing wasted development time via continuous testing. In Fourteenth International Symposium on Software Reliability Engineering, ((2003) ), pp. 281–292, Denver, CO, November, 17–20. |
[23] | Saff D. and Ernst M.D. An experimental evaluation of continuous testing during development. In ISSTA 2004, Proceedings of the 2004 International Symposium on Software Testing and Analysis, ((2004) ), pp. 76–85, Boston, MA, USA, July, 12–14. |
[24] | Thomas M.A.M. and Scruggs E. Applications of Research Methodology, Number t. 19 in Advances in learning and behavioral disabilities. Elsevier 2006. |
[25] | Zendler A. , Horn E. , Schwärtzel H. and Plödereder E. Demonstrating the usage of single-case designs in experimental software engineering, Information & Software Technology 43: (12) ((2001) ), 681–691. |
Notes
1 Actually, TDD can also be considered just another intervention level.
2 All metrics in Table 1 were calculated using SourceMonitor V3.5 http://www.campwoodsw.com/sourcemonitor.html


