
Age-Dependent Degradation of Locomotion Encoding in Huntington’s Disease R6/2 Model Mice
Abstract
Background:
Huntington’s disease (HD) is an inherited fatal neurodegenerative disease, leading to neocortical and striatal atrophy. The commonly studied R6/2 HD transgenic mouse model displays progressive motor and cognitive deficits in parallel to major pathological changes in corticostriatal circuitry.
Objective:
To study how disease progression influences striatal encoding of movement.
Methods:
We chronically recorded neuronal activity in the dorsal striatum of R6/2 transgenic (Tg) mice and their age-matched nontransgenic littermate controls (WTs) during novel environment exposure, a paradigm which engages locomotion to explore the novel environment.
Results:
Exploratory locomotion degraded with age in Tg mice as compared to WTs. We encountered fewer putative medium spiny neurons (MSNs)—striatal projection neurons, and more inhibitory interneurons—putative fast spiking interneurons (FSIs) in Tg mice as compared to WTs. MSNs from Tg mice fired less spikes in bursts without changing their firing rate, while FSIs from these mice had a lower firing rate and more of them were task-responsive as compared to WTs. Additionally, MSNs from Tg mice displayed a reduced ability to encode locomotion across age groups, likely associated with their low prevalence in Tg mice, whereas the encoding of locomotion by FSIs from Tg mice was substantially reduced solely in old Tg mice as compared to WTs.
Conclusion:
Our findings reveal an age-dependent decay in striatal information processing in transgenic mice. We propose that the ability of FSIs to compensate for the loss of MSNs by processes of recruitment and enhanced task-responsiveness diminishes with disease progression, possibly manifested in the displayed age-dependent degradation of exploratory locomotion.
INTRODUCTION
Huntington’s disease (HD) is typically a mid-life onset fatal neurodegenerative disorder, characterized by early hyperactive choreic movements, while hypoactivity develops at later stages [1]. The neuropathological hallmarks are striatal atrophy mainly caused by selective degeneration of medium spiny neurons (MSNs) [2–5].
Here, we studied a commonly used mouse strain for HD animal-based research, the R6/2 mouse model in which mice are transgenic for exon 1 of the human HD gene [6]. In this model, the mice display minor motor alterations along with cognitive and learning deficits prior to expression of pronounced motor symptoms [7–11]. Major pathological changes, such as cortical and striatal atrophy, also precede significant motor dysfunction [6, 12, 13]. Previous electrophysiological studies of R6/2 mice have indicated changes in passive and active membrane properties of MSNs, such as increased membrane input resistance, decreased frequency of spontaneous excitatory post synaptic currents (EPSCs) and increased GABAergic post synaptic currents [14–16]. These findings suggest that as the disease progresses, striatal ability to generate action potentials is diminished, due to both intrinsic changes in the cells and a compromised projection of cortical afferents to the striatum [17, 18]. Many of the changes observed would be expected to cause an overall decrease in MSN firing rates. However, some in vivo electrophysiological studies reported an increase in firing rate in striatal neurons of the R6/2 [19, 20] and in anesthetized Q175 HD model mice [21].
In the current study, we aimed to probe how the encoding of motor processes changes with age in HD. We have previously shown that neuronal activity of striatal fast spiking interneurons (FSIs) and MSNs was related to the animals’ locomotion when exposed to a novel environment (NE), allowing accurate estimation of the animals’ locomotion from the firing of each cell type [22]. We therefore exposed R6/2 transgenic (Tg) mice and their age-matched nontransgenic littermates (wild-type; WT or controls) to a NE while chronically recording neuronal activity in the DS.
MATERIALS AND METHODS
Animals
All procedures were approved by the Bar-Ilan University Animal Care and Use Committee and carried out in accordance with the National Institutes of Health (NIH) guidelines.
Data were obtained from 14 R6/2 transgenic mice (Tg; 6 males and 8 females) and 13 age-matched nontransgenic littermate controls (wild-type; WT or controls; 6 males and 7 females). R6/2 mice (Jackson labs, B6CBA-Tg (HDExon1)62Gpb/1J, 120 CAG, stock number 002810) were generated by crossing ovarian-transplanted females (from R6/2 female donors) with B6CBAF1/J WT males (Jackson labs, stock number 100011). Genotype was determined by polymerase chain reaction (PCR) of tail-tip DNA at 15 days of age. All animals were housed two in a cage separated by a divider after surgery, on a 12:12 h light/dark cycle and had ad libitum access to food and water. Experiments began at 7 or 8 weeks of age, lasted for up to 4 weeks and were performed during the light phase. Surgeries were performed one week prior to the first recording session.
Behavior and locomotion
Mice were individually housed in a clean cage with a small amount of bedding for 24 h before the recording session, in order to familiarize them with their recording cage and induce the sensation of a home cage (HC). On the day of the experiment, the mouse was connected to the head stage for at least 30 min prior to the start of the experiment, to enable habituation to the recording wires and to the presence of the experimenter. Each experimental session consisted of a 5 min recording of baseline activity in the home cage (BL); 10 min in the novel environment (NE), which was a clean cage, identical to the home cage in size and bedding but lacking familiar odors; and an additional 5 min in the original home cage (HC). The short transition periods between the environments were discarded from the analysis. Each mouse was subjected to up to four sessions that were repeated once a week. A gridline measuring 8.5×7 cm2, which was placed underneath the cage (17 cm×29 cm×14 cm, for width, length and height, respectively), divided the cage into 8 equal squares a little larger than the animal’s body size. Locomotion was estimated by the number of gridline crossings made by the animal. During the experiment, the experimenter manually registered the gridline crossings, which were time stamped by the recording system.
Surgery
The surgical procedures have been described in detail elsewhere [22, 23]. In brief, a ∼2×1 mm2 craniotomy was made 2–3 mm laterally over the dorsal striatum (Anteroposterior (AP) = 1.3 ––0.7 mm; Mediolateral (ML) = 2–3 mm); custom-made microwire arrays (4×4 or 4×8 arrays of S-isonel-coated tungsten microwires of 35 or 50μm in diameter) were lowered by 2–2.2 mm from the surface of the brain [24] while recording neural activity. The electrodes were aimed at the DS, the sensorimotor region of the striatum. Final placement of the electrodes was determined based on the coordinates and quality of the recorded neural activity. Electrode location was histologically confirmed after the conclusion of the experiment. Following electrolytic marking lesions, a perfusion was performed with 10%formalin, succeeded by brain fixation with 20%sucrose and formalin, and subsequent cryostat sectioning into 60μm thick slices.
Data collection
We chronically recorded neural activity from the DS using microwire arrays. Neural activity was amplified, band-pass filtered at 150–8000 Hz and sampled at 40 KHz using a multichannel acquisition processor system (MAP system; Plexon, Dallas, TX, USA). The activity was initially sorted online; however, all waveforms exceeding a selected threshold were saved for offline sorting (OfflineSorter V2.8.8; Plexon). Confirmed single units with a signal to noise ratio above 3:1 were further analyzed using custom-written MATLAB software (R2013b, The MathWorks Inc., Natick, MA, USA). Neurons with firing rate lower than 5 spikes per minute were excluded from the analysis. Overall, we analyzed 161 single neurons in 13 WT mice and 171 single neurons in 14 Tg mice. It should be noted that although all mice participated in multiple recording sessions and units were often recorded on the same wire during consecutive weeks, we assumed that the detected units were different each session due to electrode drift [20, 25].
Data analysis
Task-related neurons
Experimental sessions were divided into time bins of 2.5 min, thus creating two baseline epochs: BL1 and BL2, four novel environment epochs: NE1 to NE4, and two home cage epochs: HC1 and HC2. For each neuron, firing rate distributions were calculated per time epoch by measuring the number of spikes occurring in 5 s bins, resulting in 30 samples of firing rate for each time epoch. To test whether a neuron was task-related (i.e., responsive), the six firing rate distributions (NE1 to HC2) were compared to the BL firing distribution (BL1 and BL2 taken together) using a multiple comparison ANOVA with p < 0.01, with Bonferroni post hoc adjustment. Each component in the vector could assume values of 1, –1, or 0, depending on whether we observed an increase in firing rate, a decrease in firing rate or no significant change compared to baseline firing, respectively. A neuron was classified as task-related if its firing rate significantly changed during any of the behavioral epochs as compared to BL activity.
Firing properties
The firing rate (FR) during baseline was calculated as the total number of spikes elicited by the neuron divided by the duration of the entire BL epoch in seconds.
PROP (isi > 2s) defined as the proportion of interspike intervals (ISIs) exceeding 2 s. This feature was calculated as the sum of all ISIs over 2 s long divided by the entire recording time of BL, as previously described [22, 26, 27].
The burst-like phasic spontaneous activity in striatal MSNs was defined as two or more spikes occurring with an ISI of less than 50 ms and terminated with an ISI over 150 ms long. The burst rate was calculated as the total number of bursts divided by the duration of the entire BL epoch in seconds. The percentage of spikes fired in a burst was calculated as the total number of spikes that were fired during bursts divided by the total number of spikes elicited by the neuron during the BL epoch.
Neuronal classification
Recorded neurons were classified into cell types using data measured during baseline epochs in each session. Classification was based on the following waveform and firing features: valley to peak duration (VPD), PROP (isi > 2s) and FR, which taken together enable reliable cell classification. This method, which has been described elsewhere [22], conforms with the classification described in Berke, Okatan [28] and further expands it, thus allowing the identification of additional cell types.
Estimation of locomotion
The linear regression model equation applied for estimating locomotor activity from striatal firing rate was:
where FRMSN, FRFSI are matrices comprising the normalized firing rates in 5 s time bins of the identified neuronal subpopulations: the MSNs and the FSIs, respectively. The locomotion variable holds the average number of gridline crossings in these time bins, and a0 –a2 are the estimated regression coefficients. These coefficients provide the best approximation by minimizing the least square error of the model. The linear regression model equation was calculated using the ‘regress’ function in MATLAB software (R2013b, The MathWorks Inc., Natick, MA, USA), and R2 was used as a measure of regression quality. Regression was calculated separately for WT and Tg mice, with Tg mice also separated into age groups. To control for sample size, we calculated the regression quality as measured by the R2 values versus number of units. To this end, we randomly selected 10,000 different samples of units, increasing in sample unit size by increments of 5 units (i.e., sample unit number: 5, 10,. . . , modulo(max(number of units), 5) = 0 (nearest multiplication of 5 of the unit count)), out of the entire unit cells, and plotted a graph of averaged R2 versus number of units. Confidence intervals were negligible as n = 10,000 repetitions.
Furthermore, when n is high, p value is not the correct measure for statistical inference because trivial effects can yield very low p values [29, 30]. In these cases, a direct measure of the effect size and its confidence intervals are recommended [31]. We used Cohen’s d [32] to measure the effect size as follows:
where
RESULTS
Exploratory locomotion decreases with age in R6/2 Tg mice
14 R6/2 Tg mice and 13 WT mice were exposed to a novel environment once a week for up to four consecutive weeks starting at 7–8 weeks of age. Each experimental session comprised 5 minutes in the home cage, defined as baseline activity (BL), after which the animal was transferred to a novel environment (NE), a cage identical to the home cage but lacking familiar odors or objects. After a period of 10 min in the novel environment, the animal was transferred back to its home cage (HC) for an additional 5 min period (Fig. 1A). Active exploration was assessed by continuously registering gridline crossing occurrence within a session, a measure reflecting the animal’s horizontal propagation (locomotion) while disregarding other in-place movements, such as grooming, sniffing, etc. (see Methods).
Fig. 1
Behavioral characteristics of WT and R6/2 Tg mice during exposure to a novel environment. A) Experimental timeline. B) Number of average gridline crossings in 5 s bins are shown for WT mice for four consecutive sessions. Colors denote the sessions order. C) Number of gridline crossings in 5 s bins for WTs (black), Tg young (red) and Tg old (blue) mice averaged over all sessions and animals. Tg mice explored the novel environment significantly less than WTs in an age-dependent manner (ANOVA, F = 45.4, df = 3, p = 1.8×10⁻²⁷).
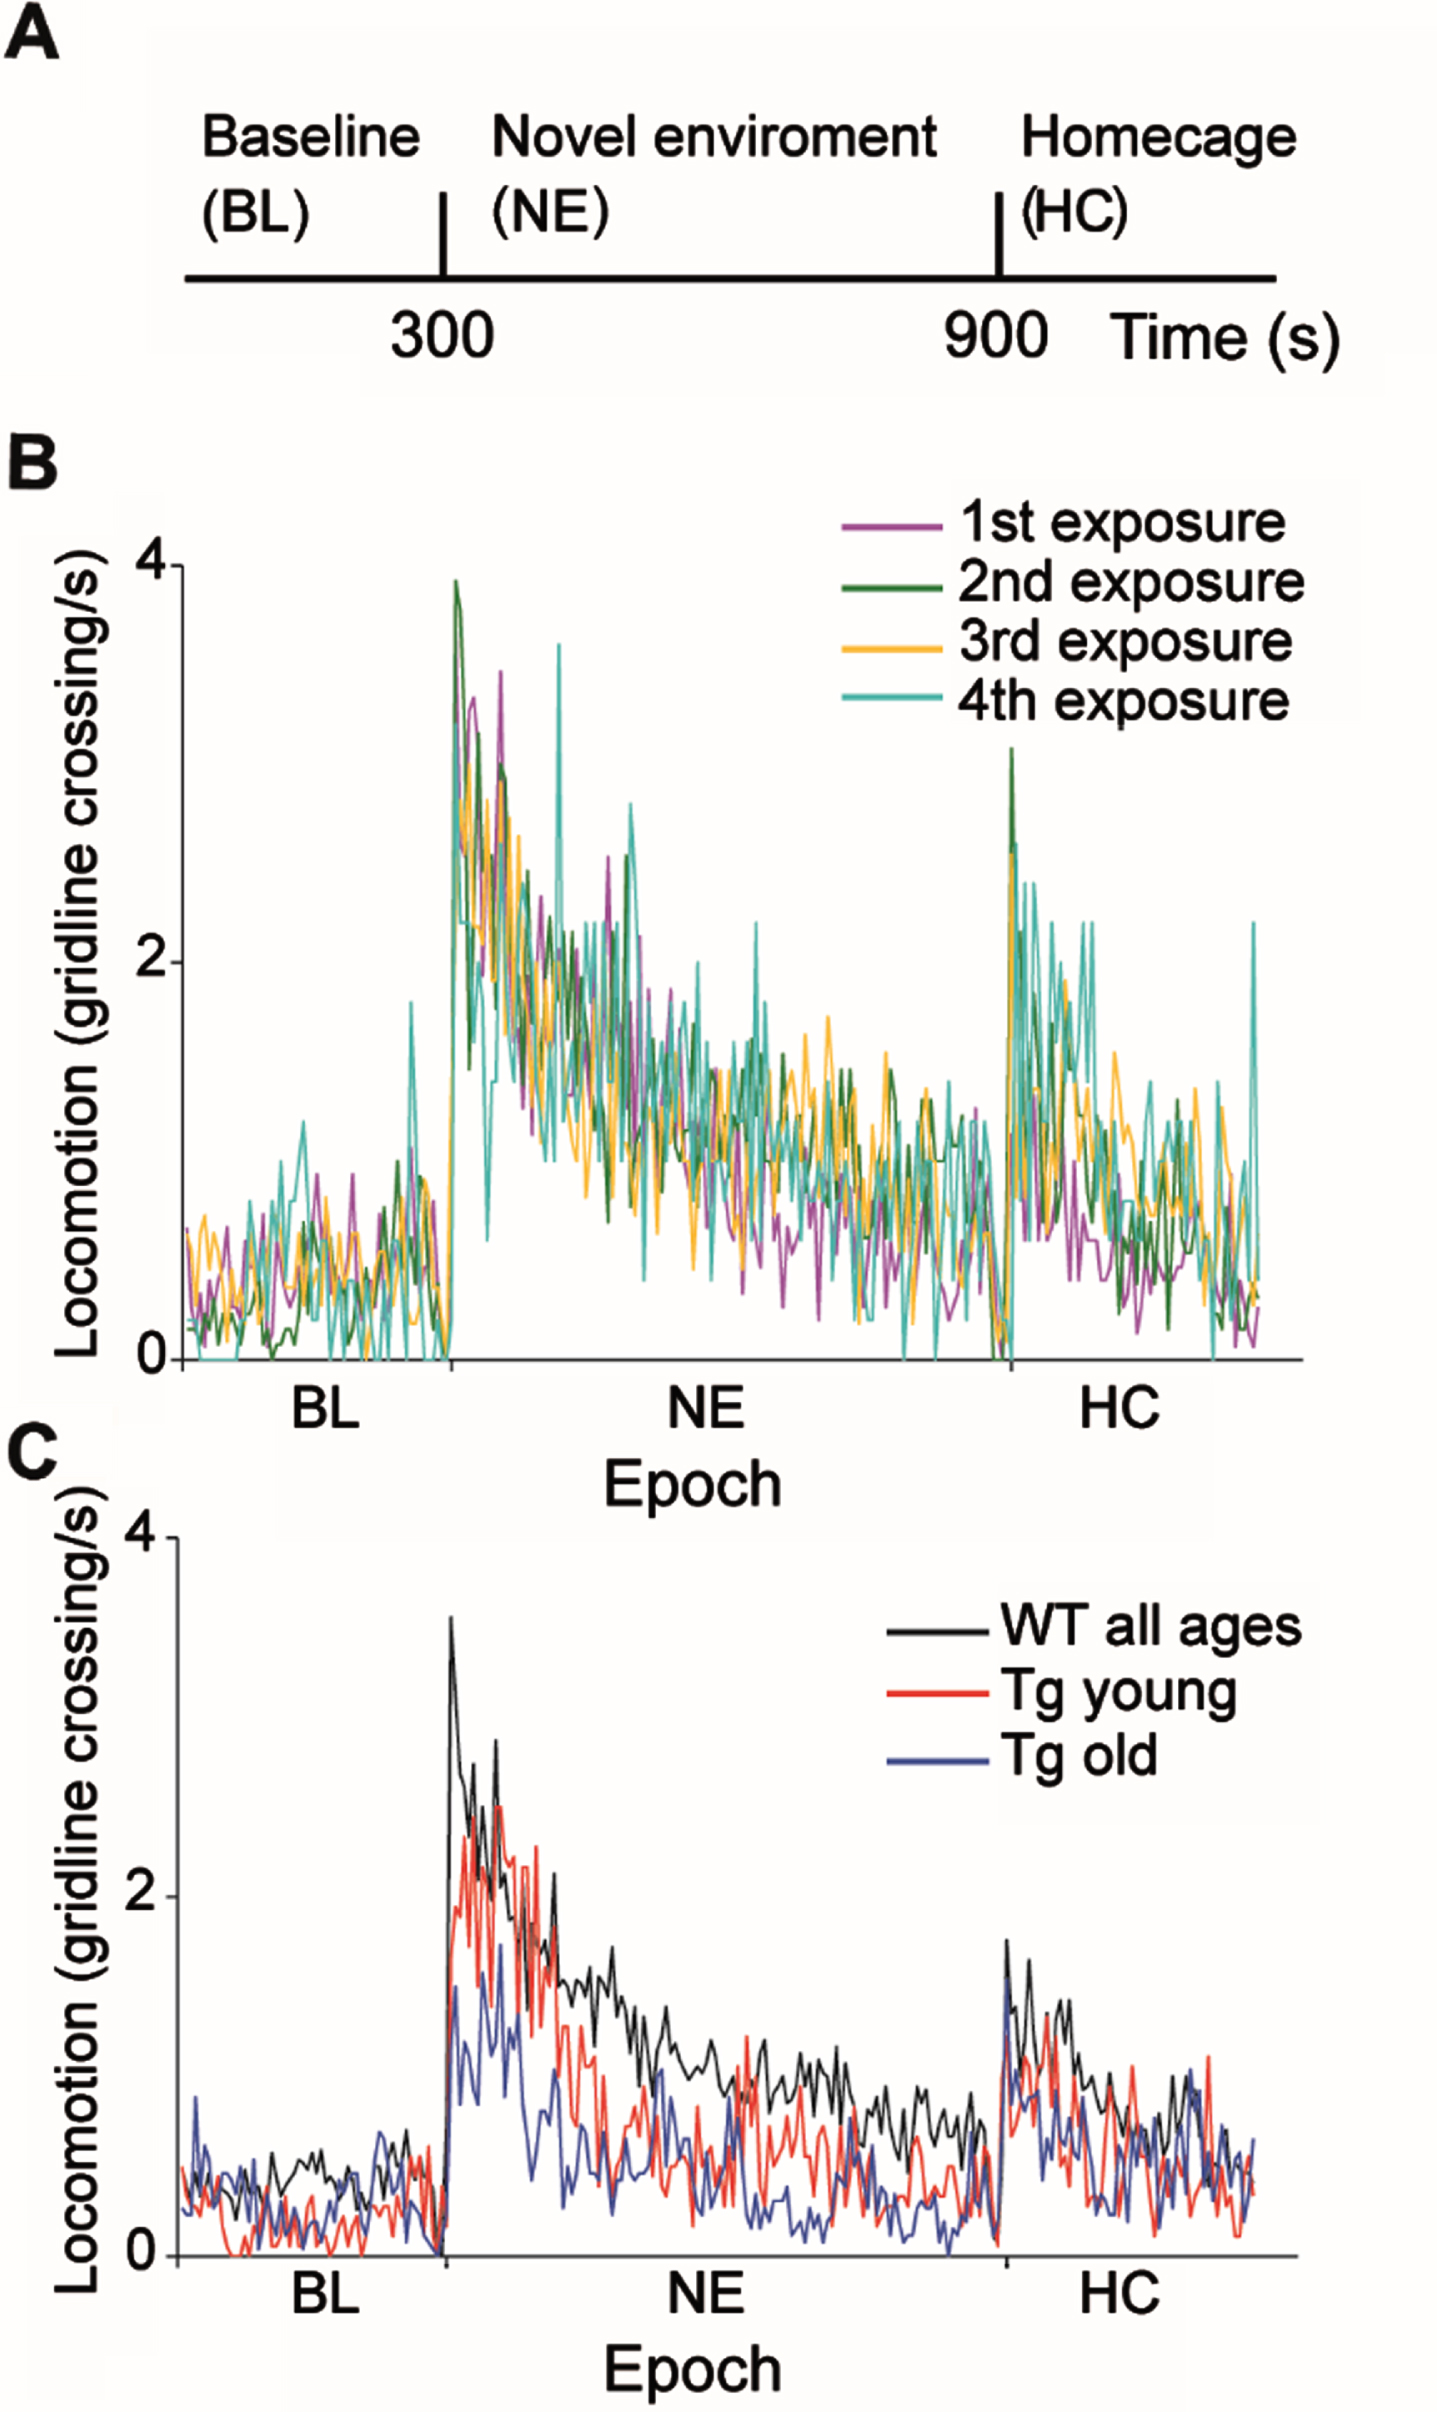
The general response pattern of both WT and Tg mice to the behavioral paradigm was similar to that previously described [22] and consisted of an increase in locomotion upon transition to the novel environment, which gradually decreased back to the baseline level. Similar to our previous results [22], WT mice did not habituate to the paradigm, that is, they displayed similar locomotion across exposures (Fig. 1B; ANOVA, F = 3.63, df = 3, p = 0.01, post hoc testing with the Tukey-Kramer adjustment showed that the difference was not statistically significant). Thus, we pooled together the data from all WT mice for further analysis. In contrast to the WTs, Tg mice explored the NE significantly less than WTs in an age-dependent manner (Fig. 1C; ANOVA, F = 45.4, df = 3, p = 1.8 x10⁻²⁷). Post-hoc testing with the Tukey-Kramer adjustment revealed that the average locomotion rate following the transition to the NE of young Tg mice (7–8 weeks of age) was significantly lower than that of WT mice, and significantly higher than that of older Tg mice (9–10 weeks of age). The reduced average locomotion rate observed in Tg mice upon transition to the NE may be ascribed to reduced locomotor activity of Tg mice, as WT mice explored the environment for a significantly longer period of time than Tg mice (44±19%and 24±19%, mean±STD, for WT and Tg mice, respectively; χ2 test, χ2 = 1044, df = 1, p = 0). It should be noted that in the Tg mice, age and exposure week co-vary. However, considering that WT mice did not habituate to the task, we attribute the gradual reduction in exploratory behavior in Tg mice to motor deterioration resulting from disease progression. This reduction in exploratory behavior may also be attributed in part to motivational deficits and apathy resulting from disease progression [34–36]. The novel environment task has both cognitive and motor aspects [22]. The fact that the animals’ exploration pattern of the environment was similar across genotypes provides evidence against cognitive decline likely because this task is too simple and doesn’t require high cognitive abilities.
Altered prevalence of striatal cell populations in R6/2 Tg mice
We recorded a total of 161 units (in 37 sessions) and 171 units (in 40 sessions) from the dorsal striatum of WT and R6/2 Tg mice, respectively. The electrodes’ position within the DS of both WT (Fig. 2A) and Tg (Fig. 2B) mice was verified histologically (see Methods) and was found to be similar across genotypes.
Fig. 2
Similar classification of striatal neurons into distinct cell types in WT and R6/2 Tg mice. A, B) Electrode arrays were positioned in the mouse DS. Examples of electrode placement (arrows) marked with electrolytic lesions in DS of a WT (A) and a Tg animal (B). Shown are 60μm coronal slices. Slice coordinates relative to Bregma are shown above. C, D) 3D scatter plots of waveform parameters and firing characteristics of sorted single neurons recorded in WTs (C) and in Tg mice (D) showing 4 distinct clusters, each corresponding to a different striatal cell type, and a fifth subset of unclassified neurons (yellow). The set of parameters defining each group is listed in Table 1. MSNs (n = 83 and n = 22 for WT and Tg mice, respectively) are marked in red; FSIs (n = 59 and n = 101 for WT and Tg mice, respectively) are marked in blue; UINs (n = 8 and n = 27 for WT and Tg mice, respectively) are marked in cyan; and TANs (n = 8 and n = 9 for WT and Tg mice, respectively) are marked in green. E) The average waveform of MSNs (top), FSIs (center top), UINs (center bottom) and TANs (bottom) from WT (colored line) and Tg (dashed black line) mice, showing the similarity in waveform between the genotypes. F) Distribution of recorded cell types for each genotype (in percentage and cell count). The proportion of different striatal cell populations differed between genotypes (χ2, df = 4, p = 0.0001).
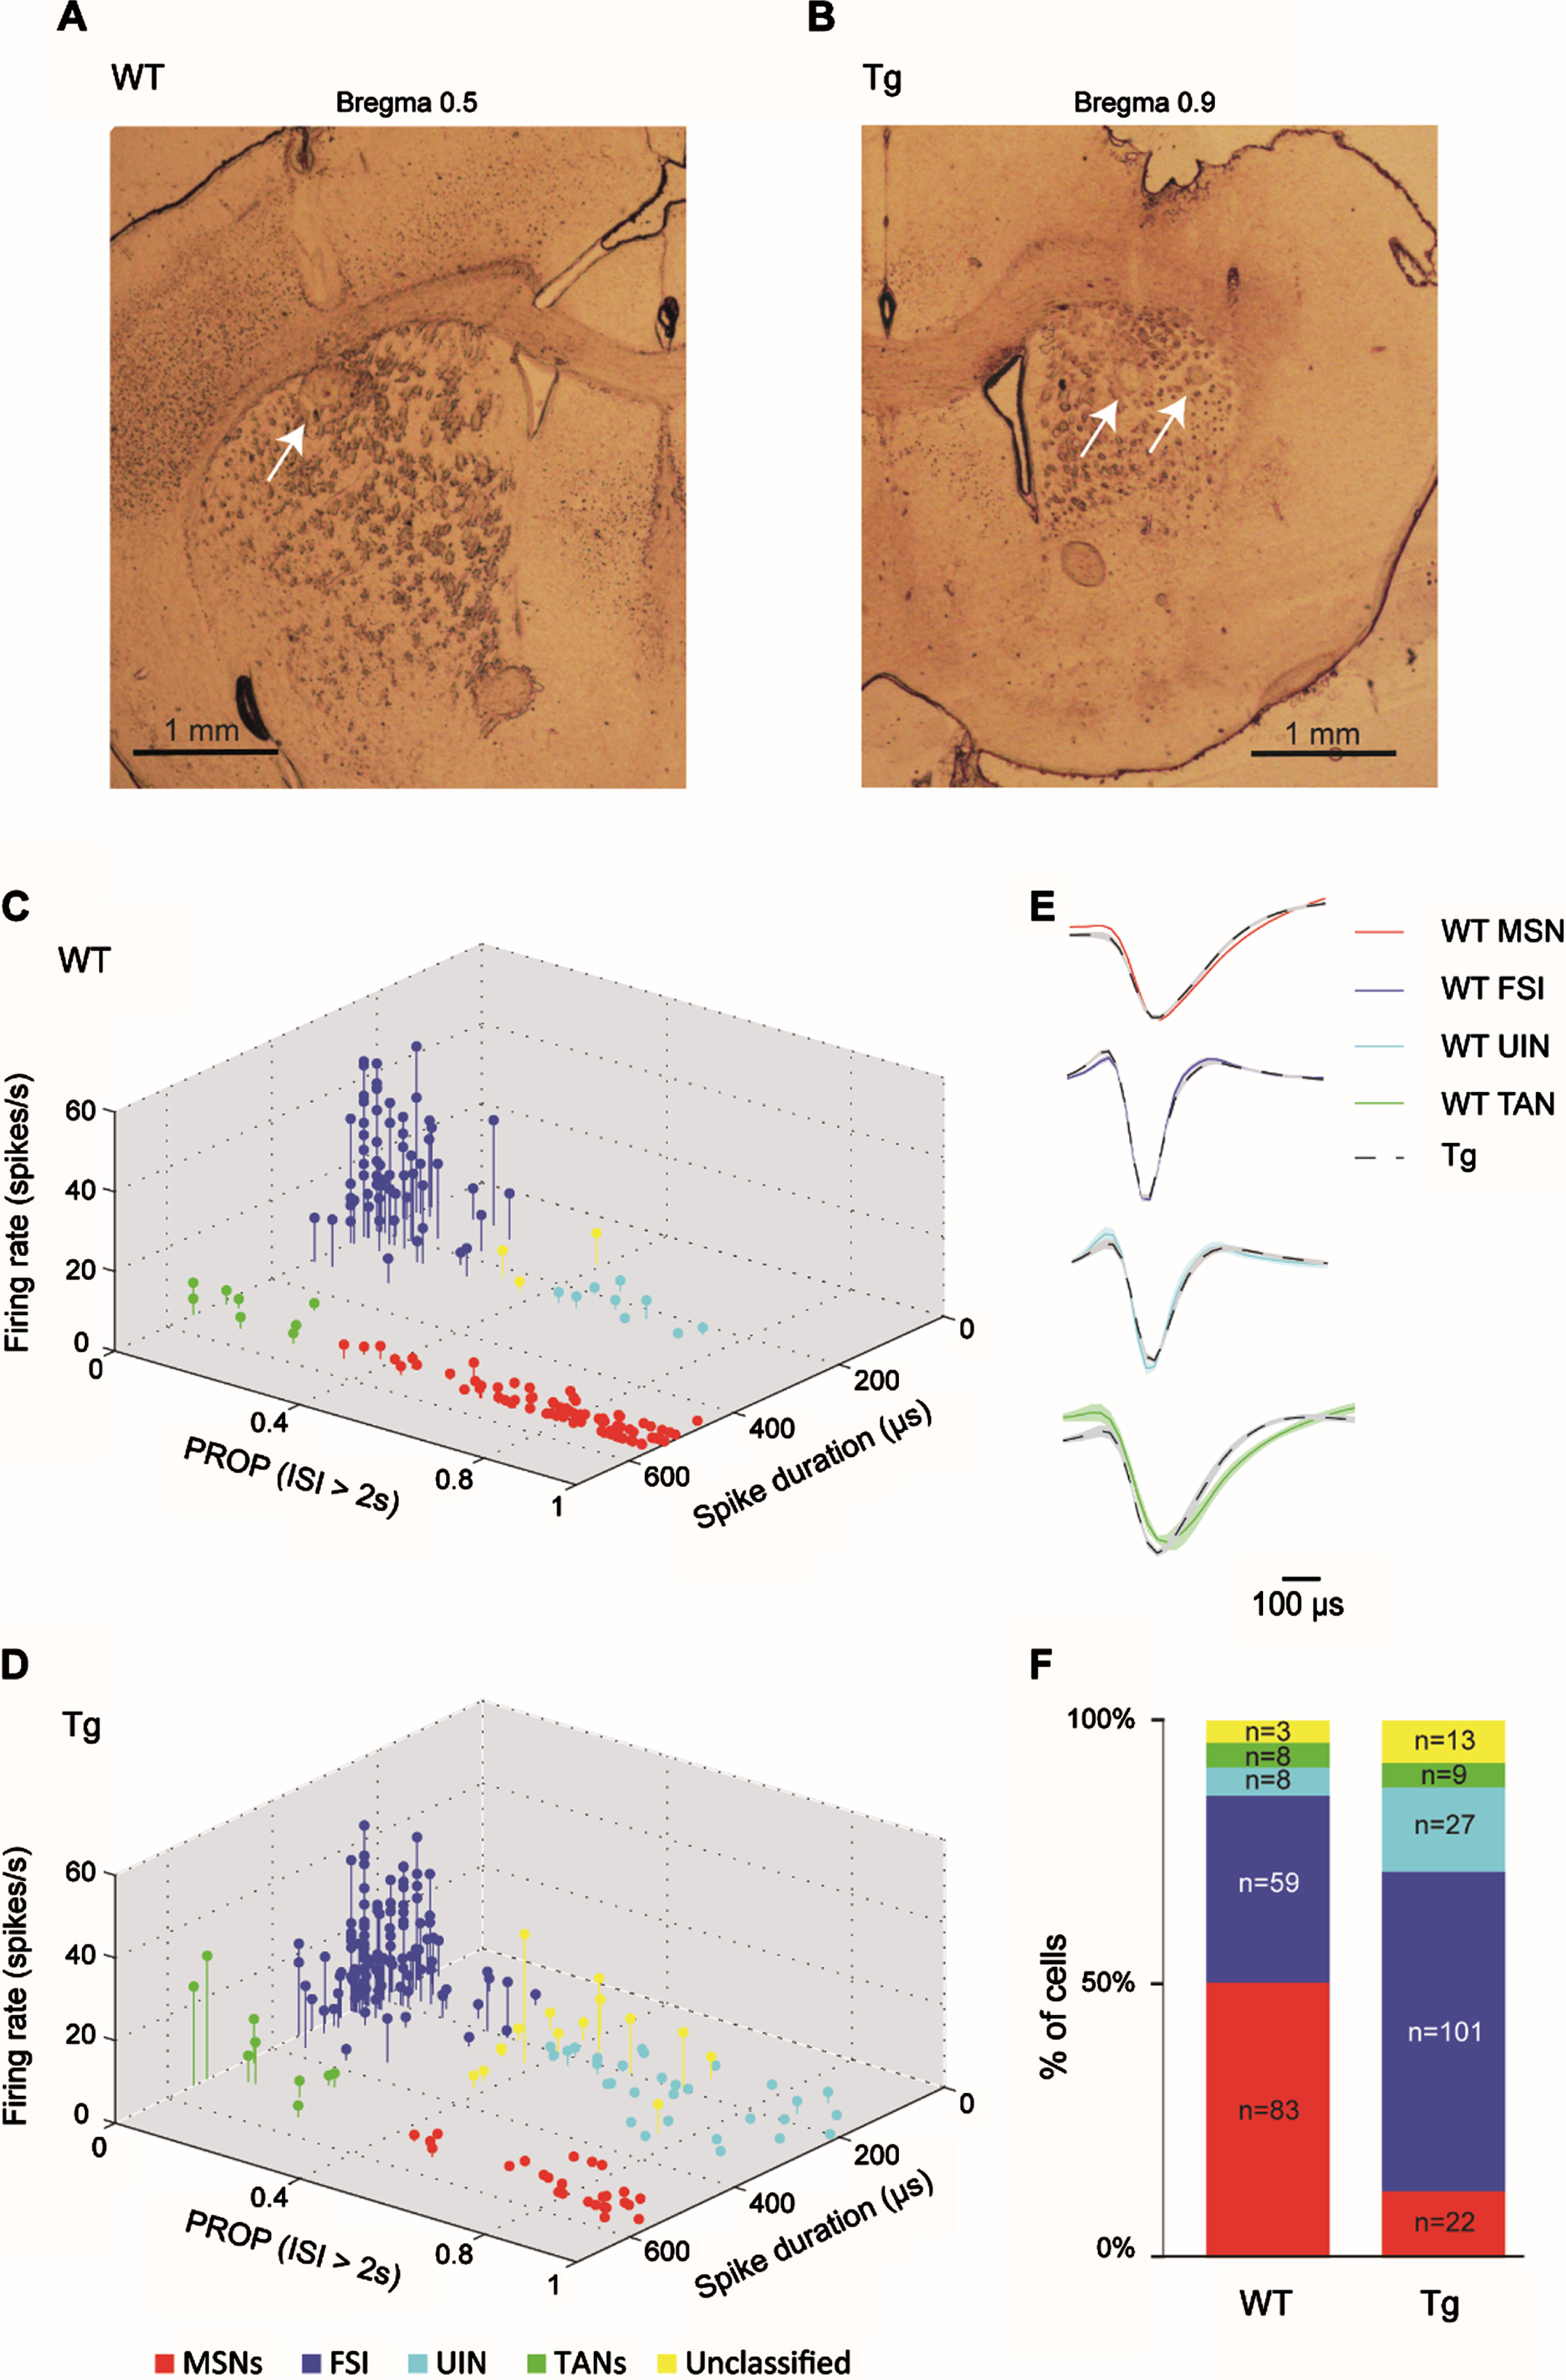
We classified the recorded neurons into different cell types by implementing a classification scheme based on firing properties and spike waveform, as previously proposed in [22] (see Methods). Figure 2C and 2D show the genotype-specific clusters representing putative MSNs (red), FSIs (blue), tonically active interneurons (TANs, green), and a subset of yet unidentified narrow spiking interneurons, dubbed UINs (cyan), which express properties similar to those previously described at length in [22]. These cell-type clusters did not differ across genotypes (Fig. 2C, D), though the FSI and UIN clusters were harder to differentiate in Tg mice than in the WT group, possibly due to their high prevalence and alterations in their firing properties caused by HD. Therefore, in order to minimize the likelihood of an error in cell type identification, we set the boundaries between clusters using a conservative approach, adopting the same classification parameters as previously reported in a different mouse strain ([22], Table 1; see Methods), thus creating a small subset of unclassified neurons (marked in yellow in Fig. 2C, D). This “buffer zone” primarily reduced the likelihood of erroneously identifying FSIs displaying prolonged silence periods as UINs, and vice versa. Figure 2E demonstrates that the cell-type waveform characteristics did not differ across genotypes.
Table 1
Classification criteria for different neuronal subgroups
| MSNs | FSIs | UINs | TANs | |
| Baseline firing rate (spikes/s) | No restriction | No restriction | < 4 | No restriction |
| Valley to peak duration (μs) | > 400 | ≤400 | ≤400 | > 400 |
| PROPISI >2s | ≥0.32 | < 0.3 | > 0.4 | < 0.32 |
Parameters for cell type classification. MSNs, medium spiny neurons; FSIs, fast spiking interneurons; UINs, unidentified neurons; TANs, tonically active neurons; PROPISI >2s, proportion of interspike intervals exceeding 2 s.
A comparable number of cells was recorded from each genotype, but the prevalence of different striatal cell populations was significantly different across genotypes (Fig. 2F; χ2 test, df = 4, p = 0.0001). Specifically, Tg mice had a very low percentage of identified MSNs (13%) as compared to WT mice (52%; post-hoc χ2; df = 1, p = 0), and a high percentage of FSIs (59%) and UINs (16%) as compared to WT mice (FSIs: 37%; post-hoc χ2; df = 1, p = 0.00004; UINs: 5%; post-hoc χ2; df = 1, p = 0.001). TANs had an equivalent prevalence in both genotypes (5%). The UINs and the TANs were excluded from further analysis due to their small percentage. As both genotypes had a similar type of recording electrodes, this factor cannot account for the altered cell population prevalence observed in Tg mice. We suggest that the increased prevalence of interneurons in Tg mice may reflect increased inhibition within the striatum [16, 37, 38], which may, in turn, lead to the observed decreased prevalence of MSNs in these animals. The low prevalence of MSNs may also be attributed to MSN-specific neurodegenerative processes in Tg mice [39, 40].
Altered neuronal activity in R6/2 Tg mice during baseline
The firing properties of each cell type were compared between genotypes during baseline activity to avoid masking of their differences due to task-induced factors, such as arousal and stress level. No differences were found in the firing rate of MSNs during BL between genotypes ([0.09 –3.51], 0.99±0.09 spikes/s and [0.12 –2.19], 0.78±0.09 spikes/s; range, mean±STD for MSNs from WT and Tg mice, respectively; one-way ANOVA, F = 1.33, df = 1, p = 0.25). However, FSIs in Tg mice displayed lower firing rates during BL than controls ([3.1 –44.03], 18.55±1.39 spikes/s and [1.65 –43.39], 13.23±0.85 spikes/s; range, mean±STD for WT and Tg mice, respectively; one way ANOVA, F = 12.03, df = 1, p = 0.0007). Despite the observed reduction in FSI firing rate in Tg mice, we cannot discount the possibility that the inhibition exerted on MSNs may be higher in Tg mice than in WT mice since the prevalence of inhibitory interneurons was significantly higher in Tg mice (Fig. 2F).
The firing of striatal MSNs is episodic in nature, therefore, we checked for differences in the burst-like phasic spontaneous activity between the genotypes. We compared the percentage of spikes that were fired during bursts and the burst rate (bursts/s; see Methods) between genotypes. We found that while the burst rate of MSNs from Tg mice did not differ from that of MSNs from WT mice (0.1±0.01 and 0.1±0.01 bursts/s for MSNs from WT and Tg mice, respectively; one way ANOVA, F = 0, df = 1, p = 0.95), MSNs from Tg mice fired fewer spikes during these bursts as compared to MSNs from WT mice (36±1 %and 27±2 %for MSNs from WT and Tg mice, respectively; one way ANOVA, F = 10.48, df = 1, p = 0.0016). Taken together, these results show that during baseline activity striatal FSIs from Tg mice had a decreased firing rate, and striatal MSNs from Tg mice had a reduced ability to maintain bursts that was not reflected in their firing rate.
Changes in neural response patterns in R6/2 Tg mice
Different striatal cell-types display different distributions of response patterns when animals are exposed to a novel environment [22]. Each recorded neuron was identified as either task-related or nonresponsive to the behavioral paradigm (Fig. 3A, see Methods). We tested whether the responsiveness displayed during the task by MSNs and FSIs differed across genotypes. No differences were found in the number of task-related MSNs across genotypes (Fig. 3A, left; χ2 test, χ2 = 0.23, df = 1, p = 0.6). However, the percentage of task-related FSIs was significantly higher in Tg mice than in WT mice (Fig. 3A, right; χ2 = 7.85, df = 1, p = 0.005).
Fig. 3
Response patterns of distinct striatal subpopulations varied across genotypes. A) The proportion of responsive and non-responsive MSNs (left) and FSIs (right) from WT and Tg mice. FSIs from Tg mice had a significantly higher percentage of responsive cells than those from WT mice (χ2, df = 1, p = 0.005). B) An example of a FSI from a Tg animal that increased its firing rate relative to baseline when transferred to the novel environment. This neuron maintained the same firing rate even when the animal was placed back in the home cage and was categorized as ‘Total responsive’. (Left) Firing rate histogram calculated in 5 s bins for the entire period of a session. The orange lines and the black arrows mark the transition times from the home cage to the novel environment and then from the novel environment back to the home cage. (Right) The firing rate histogram of the same neuron calculated in 2.5 min bins. C) Same as (B) for a FSI from a WT animal that decreased its firing rate relative to baseline only when the animal remained in the novel environment and was categorized as ‘NE’. D) Same as (B) for a MSN from a Tg animal that increased its firing rate when the animal was placed back in its home cage, and was categorized as ‘HC’. E, F) Same as (B, right) for FSI from WT animal that responded to transitions (E), and MSN from Tg animal that had a nonspecific response (F). G) Firing pattern distributions of the different neuronal response groups of MSNs (left) and FSIs (right) from WT and Tg mice. No significant difference in response pattern distribution was found between genotypes (χ2, df = 4, p > 0.14). The color code for the different categories appears beneath the figure.
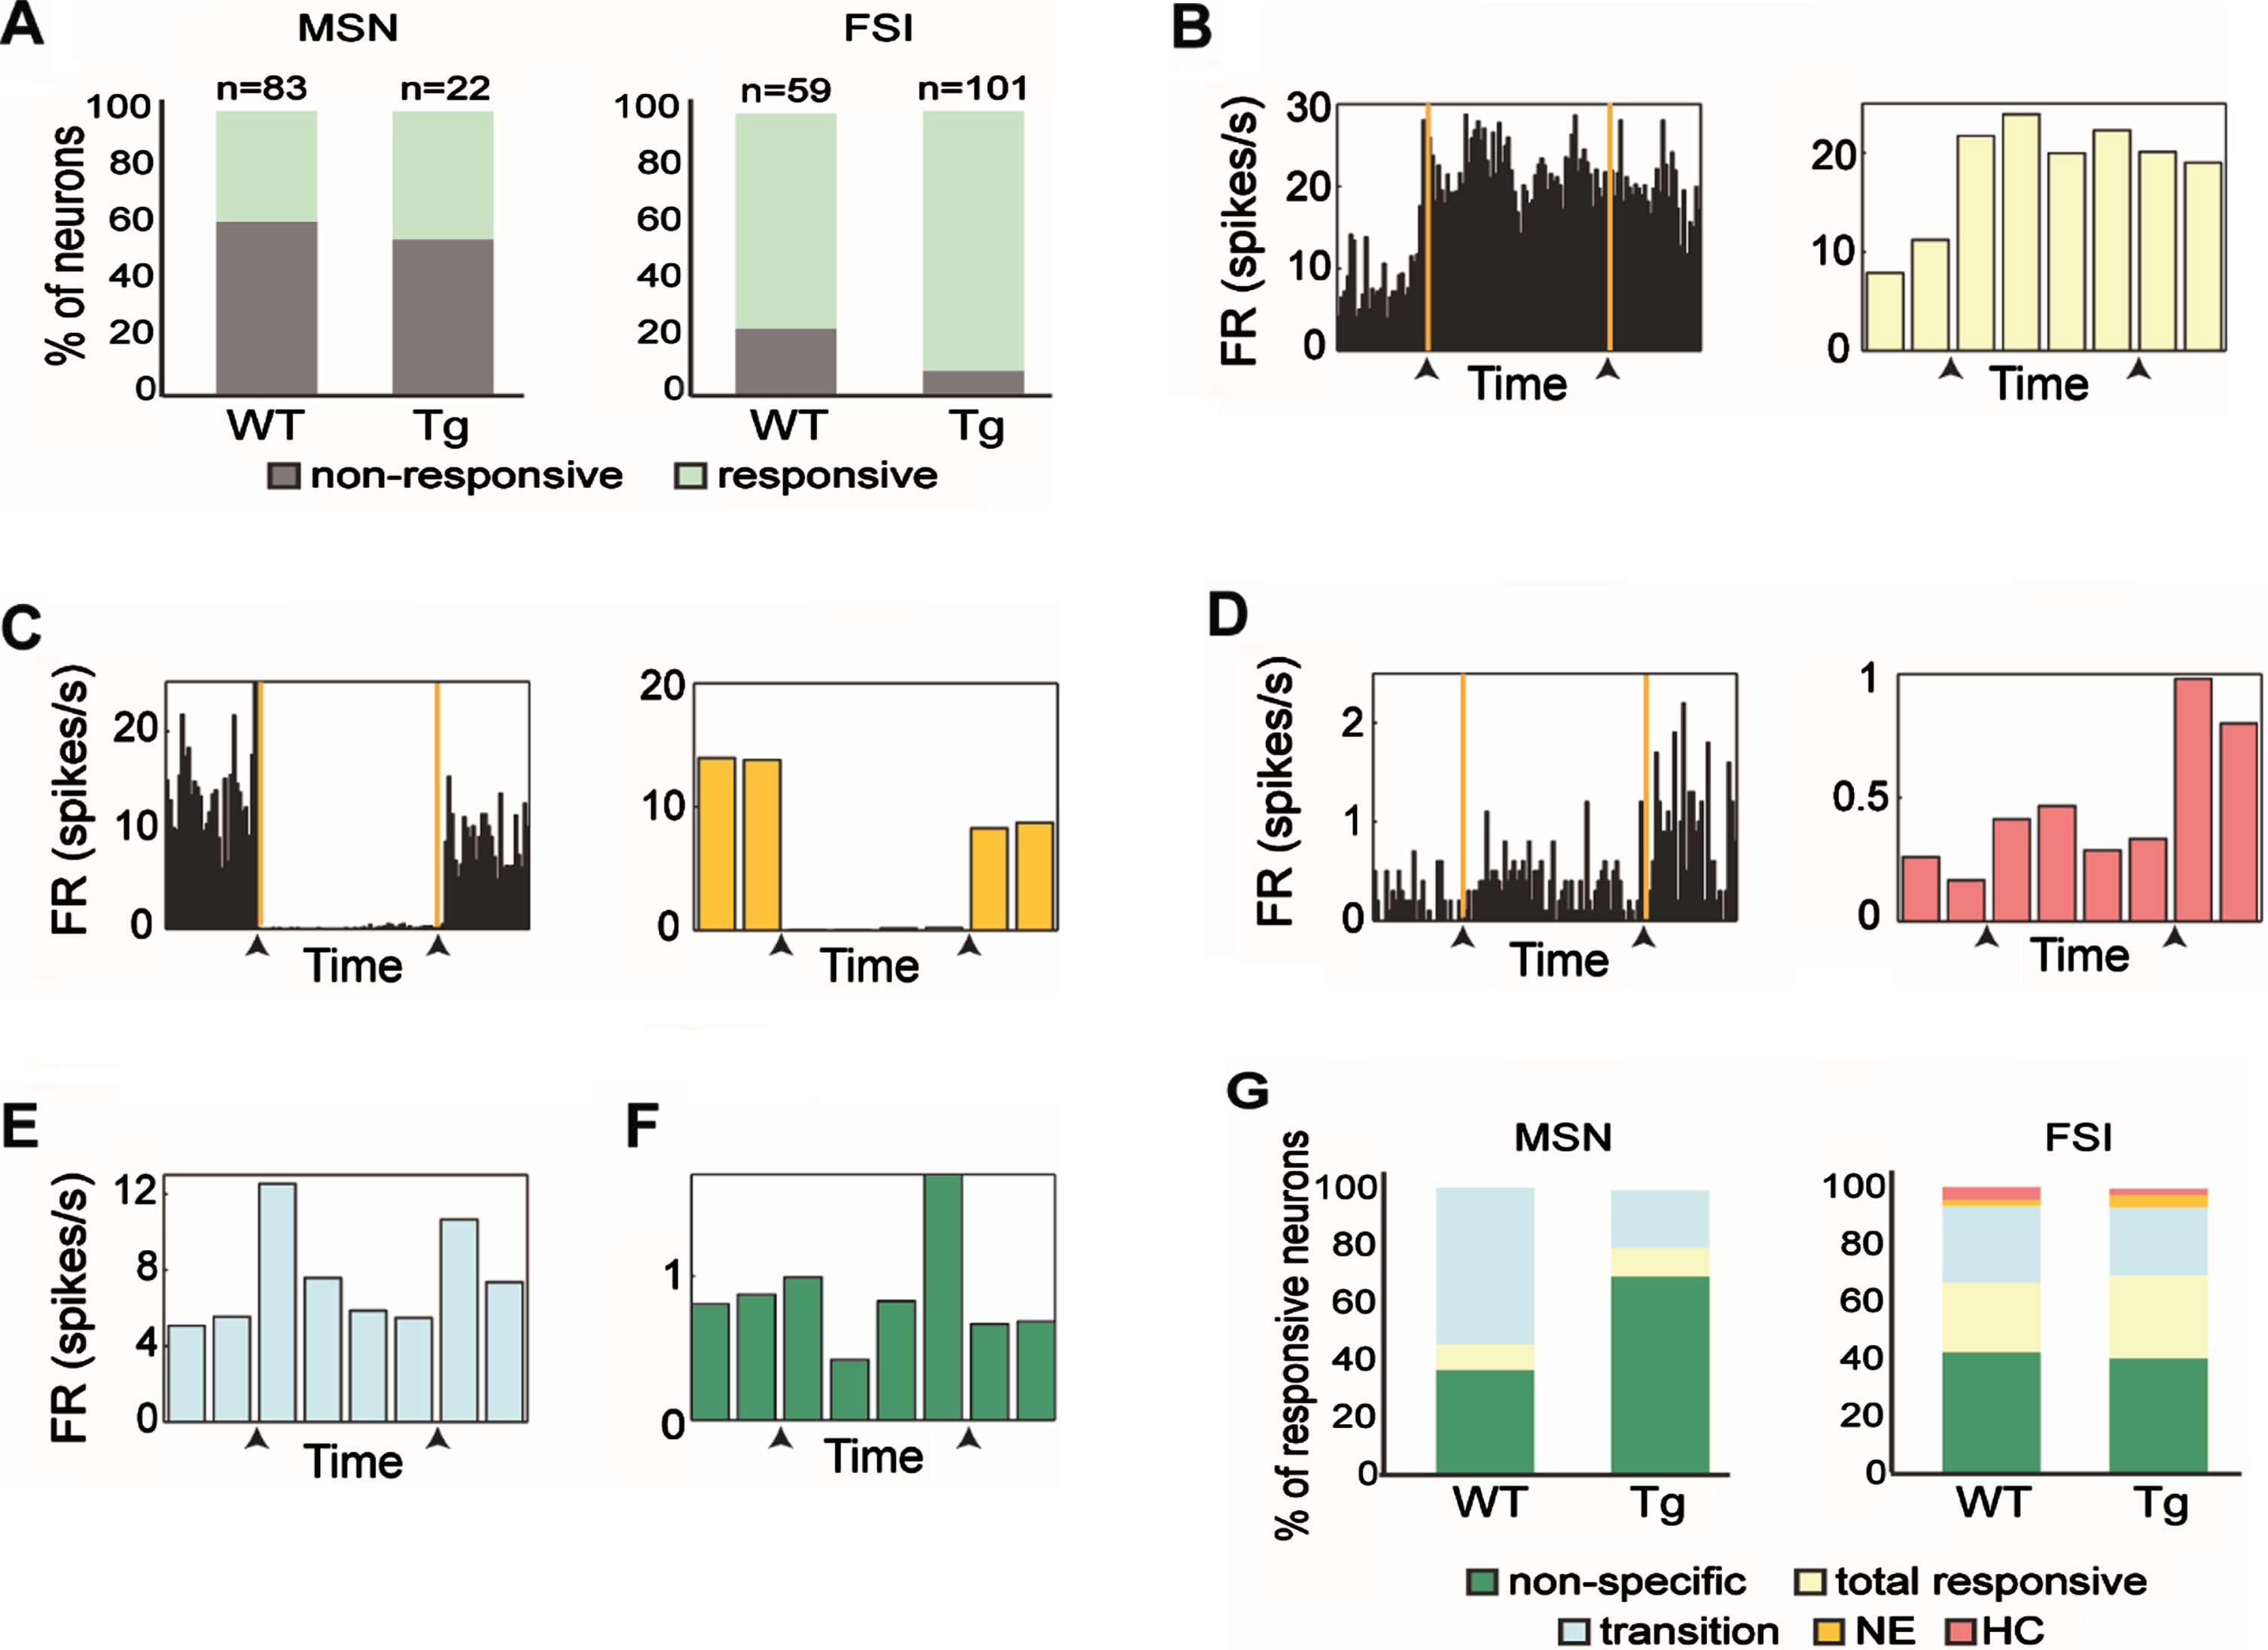
Next, we classified the obtained response patterns into five dominant categories: ‘total responsive’, ‘NE’, ‘HC’, ‘transition’ and ‘non-specific’. The ‘total responsive’ category included neurons that changed their firing rate as compared to baseline activity throughout the entire paradigm (see example neuron in Fig. 3B). The ‘NE’ category included neurons that changed their firing rate while the animal was in the novel environment, but returned to baseline firing when placed back in the home cage (see example neuron in Fig. 3C). The ‘HC’ category included neurons that changed their firing rate when placed back in the home cage (see example neuron in Fig. 3D). The ‘transition’ category included neurons that briefly changed their firing rate when the animal was transferred to the novel environment, back into the home cage or both (see example neuron in Fig. 3E). The ‘non-specific’ category included neurons that changed their firing rate in at least one behavioral epoch that was not included in the other categories (see example neuron in Fig. 3F). We compared the response pattern distributions of the MSNs and FSIs from young and old Tg mice and found that they did not differ (χ2 (df = 4, n = 22) = 1.58, p = 0.66. And χ2 (df = 4, n = 102) = 2.05, p = 0.72, for MSNs and FSIs, respectively), thus the data were merged across ages. We then compared response pattern distributions across genotypes and found that they did not differ for the two cell types (Fig. 3G; χ2 test, χ2 = 3.94, df = 4, p = 0.14 and χ2 = 1.27, df = 4, p = 0.87, for MSNs and FSIs, respectively). This result supports the notion that striatal cell-types maintain their characteristic response distributions in the R6/2 model mice.
Impairment of locomotion encoding in FSIs is age-dependent
It was previously demonstrated using a similar novel environment exposure task that populations of MSNs and FSIs encode the mean locomotion [22]. Here, we examined the effect of the observed alterations in neuronal firing properties on striatal encoding of locomotion in Tg mice. We first evaluated how a model comprising all sampled neurons estimates the animals’ locomotion for each genotype, and then evaluated each cell population by itself (see Methods).
To estimate the average animal locomotion from striatal activity we used linear regression. Tg mice were separated into two different models by age group, due to the observed significant age-dependent differences in Tg mice locomotion. Figure 4A-C summarizes the model results using both MSNs (n = 83, 10 and 12 for WT, Tg young and Tg old, respectively) and FSIs (n = 59, 38 and 68 from WT, Tg young and Tg old, respectively; green trace in Fig. 4A-C), only MSNs (red trace in Fig. 4A-C) and only FSIs (blue trace in Fig. 4A-C). All regression models were significant, yet the model using only MSNs yielded a distinctly reduced locomotion estimation accuracy in Tg mice (see figure legend for statistics and R2 values). To control for the low prevalence of MSNs from Tg mice, we recalculated the regression analysis for MSNs from WT mice using different random samples of n = 10 or n = 12 MSNs (the sample size of MSNs from Tg young and old, respectively). Our calculation yielded R2 distributions as shown in Fig. 4D-E. The probability of obtaining an R2 equal to or lower than that of the 10/12 MSNs from Tg mice was 0.35 and 0.13, respectively, indicating that the impaired locomotion estimation by striatal Tg MSNs can probably be attributed to their low prevalence (Fig. 4D-E). Finally, considering that regression quality tends to rise with the number of predictors, we calculated the distributions of R2 values for these models against a varying number of FSIs (see Methods). Figure 4F depicts the mean value of R2 per number of units for each model. The models’ performance of FSIs from WT and from young Tg mice were similar and better than those of FSIs from old Tg mice. To quantify this outcome, we calculated the effect size of the difference between the R2 distributions per number of units using Cohen’s d (see Methods). FSIs from old Tg mice had a big effect size as compared to FSIs from young Tg mice starting at 10 units and onwards, and as compared to FSIs from WT mice starting at 15 units and onwards (see Table 2 for Cohen’s d values). These results indicate that locomotion encoding by FSIs deteriorates in old Tg mice; i.e., more FSIs from Tg old mice are needed to yield a similar locomotion fit to that encoded by FSIs from Tg young and WT mice.
Fig. 4
Age dependent deterioration of the ability of FSIs from Tg mice to estimate locomotion. A-C) Linear regression analysis calculated using the activity of all the MSNs and FSIs from WT (A) young Tg mice (B) and old tg mice (C). Black lines represent the locomotion averaged over all animals and experiments. Green, red and blue lines represent the outcome of the linear regression using all units, only MSNs and only FSIs, respectively. All regressions were significant (WT all units: R2 = 0.9, F = 6.19, df = 142, p = 8×10–19, WT MSNs: R2 = 0.78, F = 6.7, df = 83, p = 1.5×10⁻²⁴, WT FSIs: R2 = 0.77, F = 10.3, df = 59, p = 3.2×10⁻³⁴, young Tg all units: R2 = 0.70, F = 9.1, df = 48, p = 2.5×10⁻²⁹, old Tg all units: R2 = 0.68, F = 4.6, df = 75, p = 2.1×10⁻¹⁶, young Tg MSNs: R2 = 0.23, F = 6.7, df = 10, p = 3.7×10⁻⁹, old Tg MSNs: R2 = 0.21, F = 4.9, df = 12, p = 3.2×10⁻⁷, young Tg FSIs: R2 = 0.65, F = 9.9, df = 38, p = 2.4×10⁻²⁹, old Tg FSIs: R2 = 0.65, F = 5.3, df = 63, p = 1.3×10⁻¹⁸). D, E) Distribution of R2 values calculated from 10,000 repetitions of the linear regression using random selections of 10 (D) or 12 (E) MSNs from WT mice. The R2 value of the regression analysis for MSNs from Tg mice (n = 10 or 12 for young and old tg mice, respectively) is indicated in red. The likelihood of obtaining equal R2 value or less from different selections of MSNs from WT mice is higher than p = 0.05, thus we conclude that the low R2 value obtained for Tg mice is due to their low prevalence. F) Mean R2 values calculated from 10,000 repetitions of the linear regression using a growing number of neurons of each cell type. The red circle and triangle are the same values shown in red in E and D, respectively. Cohen’s d values are stated in Table 2.
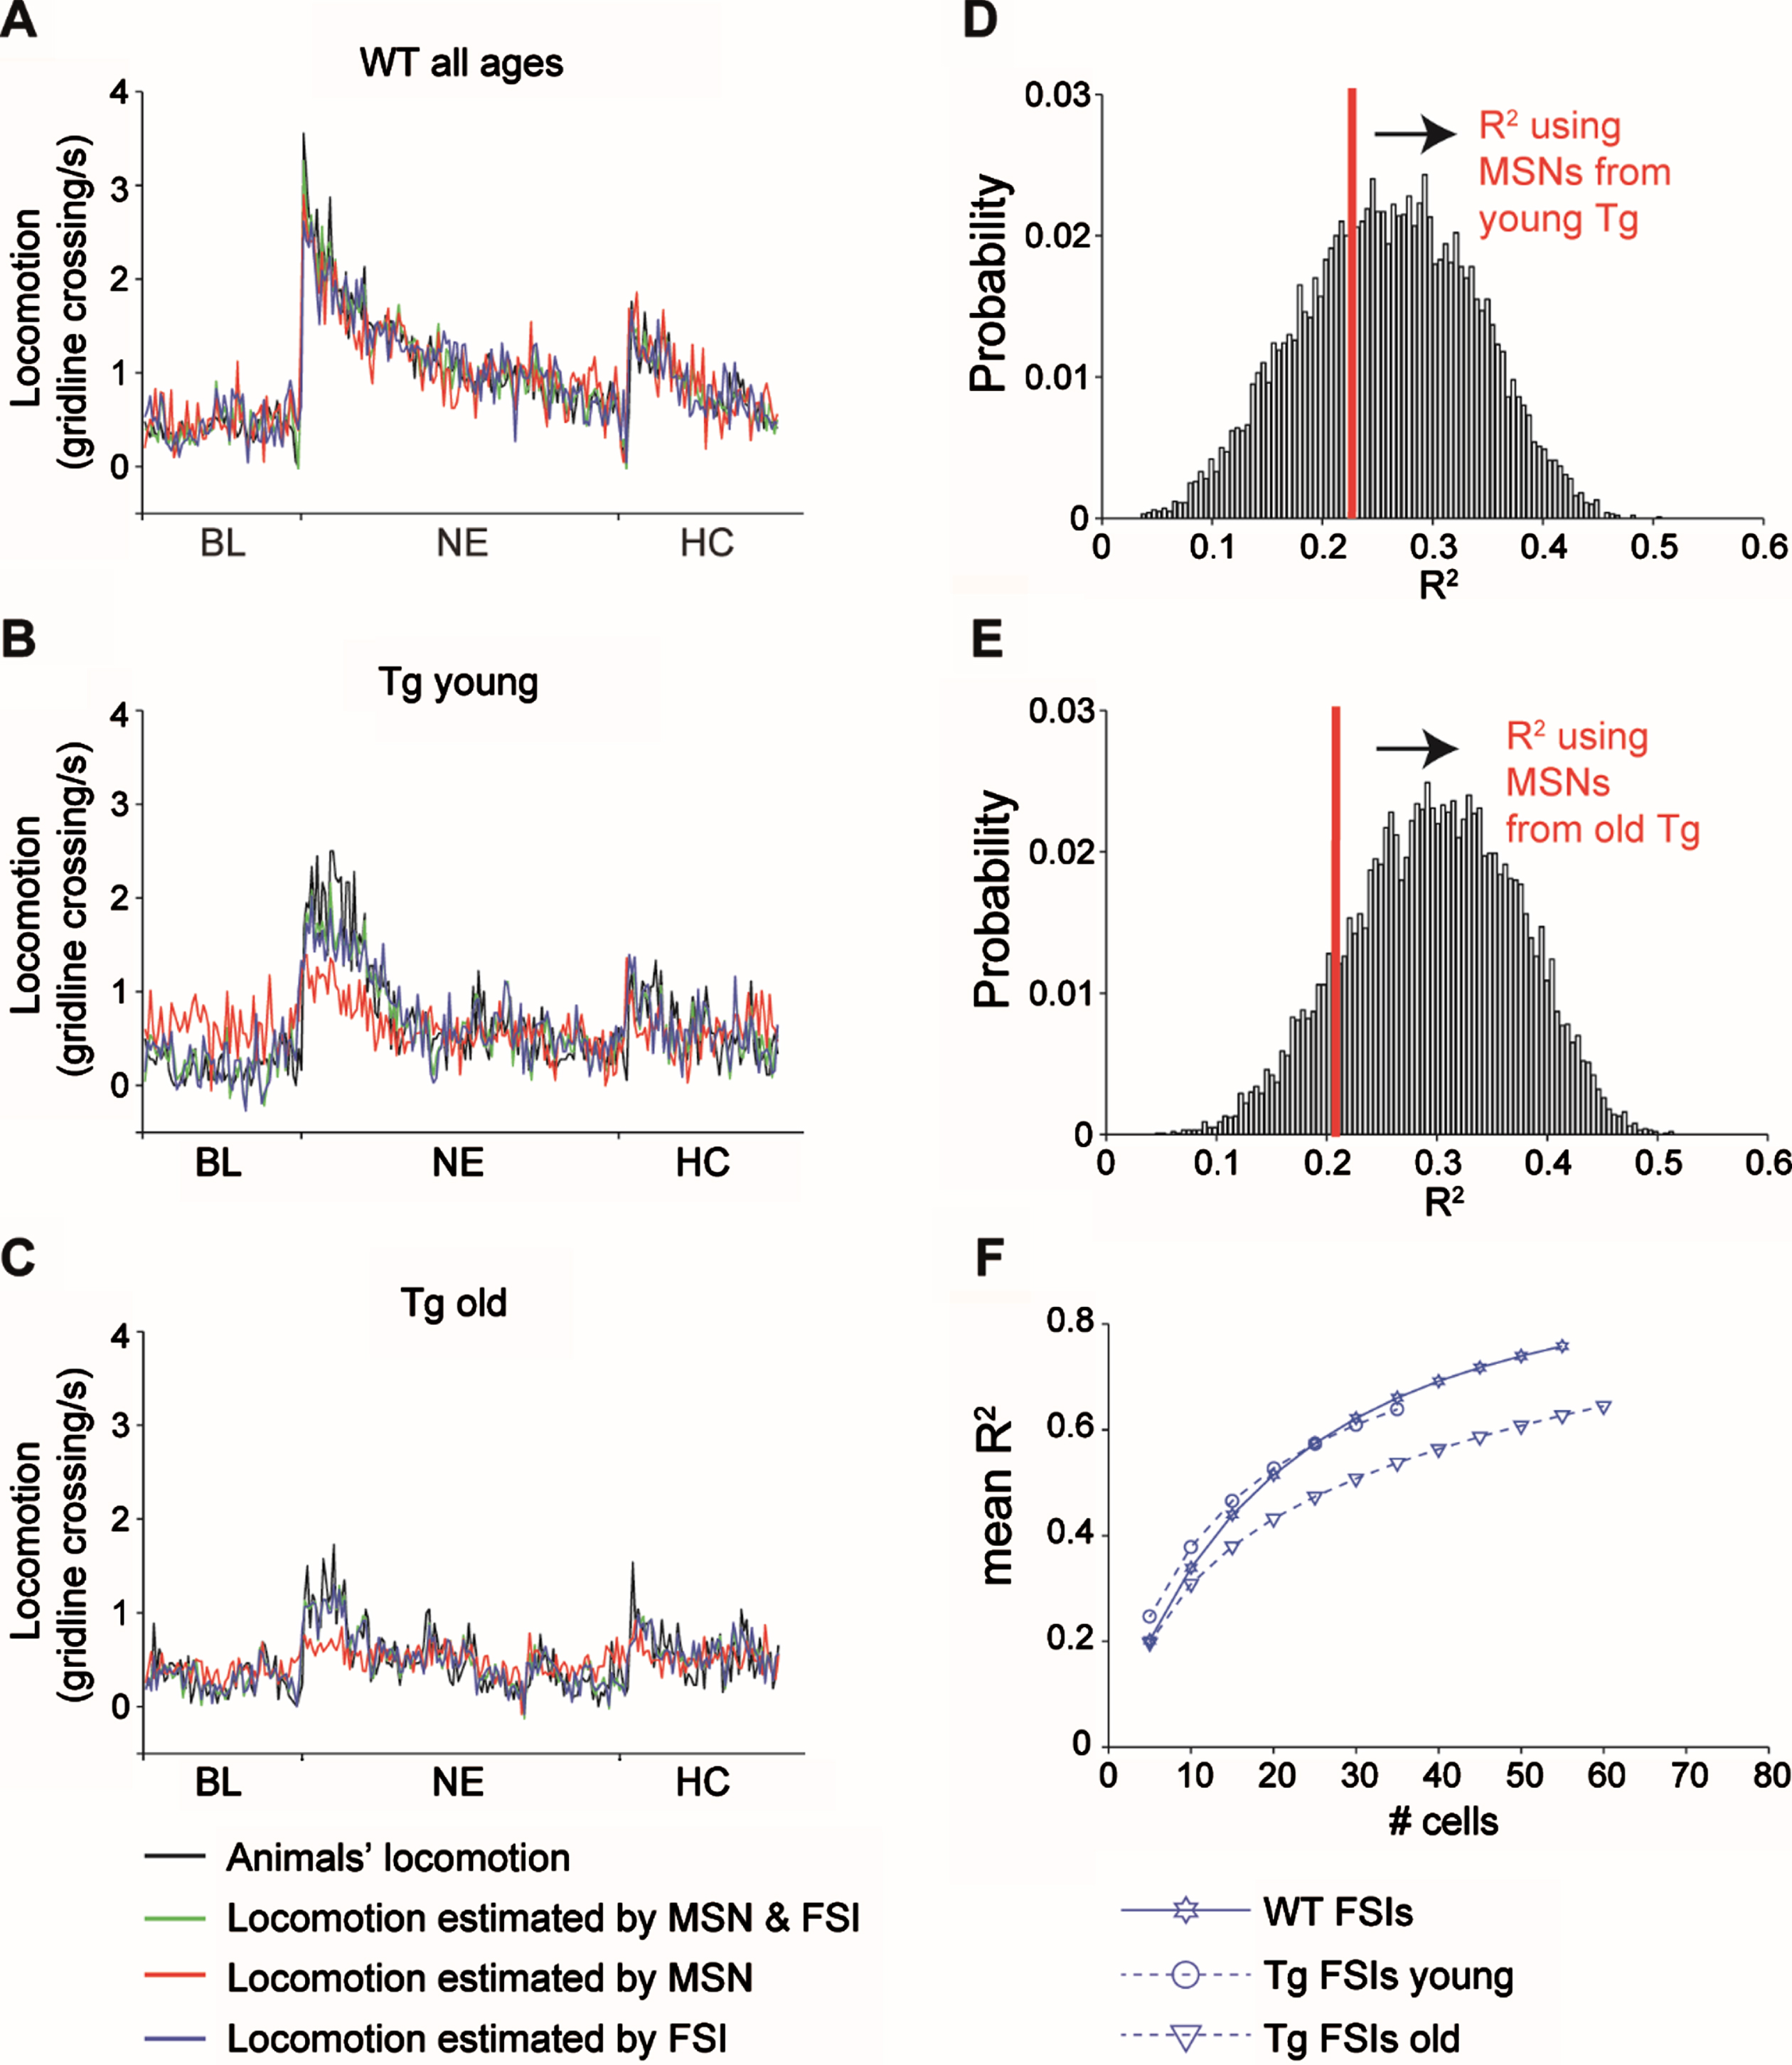
Table 2
Effect size values of R2 as measured by Cohen’s d between genotypes
| Number of units | 5 | 10 | 15 | 20 | 25 | 30 | 35 | 40 | 45 | 50 | 55 |
| Tg young –WT all | 0.56 | 0.51 | 0.40 | 0.20 | –0.03 | –0.31 | –0.7 | NA | NA | NA | NA |
| Tg old –WT all | 0.05 | 0.37 | 0.84 | 1.35 | 1.95 | 2.59 | 3.35 | 4.23 | 5.42 | 7.18 | 10.85 |
| Tg Young –Tg old | 0.69 | 1.13 | 1.75 | 2.34 | 3.04 | 3.82 | 4.71 | NA | NA | NA | NA |
Cohen’s d values between the R2 distributions calculated for models with different number of FSIs recorded from Tg mice at two age groups (young and old) and WTs (all ages). Values higher than 0.8 are considered big effects (see Methods). Tg, transgenic; WT, wild type littermate controls
DISCUSSION
In this study, we showed age-dependent deterioration in the exploration of a novel environment by R6/2 mice. The activity of striatal neurons was recorded throughout the paradigm, and cells were classified into different subtypes. We encountered fewer MSNs and more FSIs in Tg mice compared to WT mice. The firing rates of the MSNs from Tg mice did not differ from that of WT mice, while the firing rates of FSIs were lower in Tg mice than in WT controls. MSNs from Tg mice fired fewer spikes in a burst without altering their burst rate as compared to WTs. In addition, the responsiveness of MSNs from Tg mice did not differ from that of WT mice while the responsiveness of FSIs from Tg mice was significantly higher than that of FSIs from WT mice. Finally, the ability of FSIs from Tg mice to encode the animals’ locomotion significantly deteriorated with age. The ability of MSNs from Tg mice to encode the animals’ locomotion was low for both age groups due to a significant reduction in their quantity. Our results indicate that DS circuits involved in the encoding of locomotion deteriorate with age in symptomatic R6/2 Tg animals.
A major drawback of extracellular recordings is that neuronal subtypes cannot be unequivocally identified but only be classified based on their waveform and firing properties. In the striatum, and in other brain areas, the use of waveform shape and firing properties has been a common practice in the field for more than a decade. The first attempt to identify striatal neurons based on their properties was reported in Berke, Okatan [28]. This paper which became the gold standard in striatal cell classification was further expanded in [22]. A couple of recently published papers [41, 42] also used this method suggesting it is still commonly used. HD related pathophysiology increases ambiguity in cell classification, therefore it should be considered whether HD related alterations in waveform and firing properties may cause erroneous identification of striatal neurons. With respect to the waveforms, in vitro recordings demonstrated that the width of action potentials of MSNs from R6/2 mice at 6 weeks of age is unchanged whereas a minor waveform widening of 6%occurs at age 13 weeks [15]. Our study was done on 7–10 weeks old mice suggesting that the likelihood of observing a change in waveform shape is low and bounded by approximately 6%. Hence, in the worst case scenario the expected widening of waveform in MSNs from Tg mice would have shifted the MSN cluster away from the FSIs which have narrow waveforms. In other words, the reliability of the classification would increase in this case. With respect to the firing rate, if the MSNs were to be falsely identified as FSIs their firing rate would be increased. We have not encountered a single paper describing an increase in the firing rate of tagged MSNs from R6/2 mice. It has been reported that the number of action potentials within a train decreased in symptomatic R6/2 but remained unchanged in presymptomatic mice [15] suggesting that the overall firing rate is likely to decrease in symptomatic mice. Taken together these results indicate that the likelihood of falsely identifying MSNs as FSIs is highly unlikely. As for the other direction of falsely identifying FSIs as MSNs, the published data are lacking. However, in addition to the low prevalence of Tg MSNs it is highly unlikely that Tg FSIs would have a broad enough waveform to be included in the MSN cluster. Moreover, the fact that the criteria for cell identification were adopted from yet another strain of WT mice (see Methods) further indicates that this classification method is reliable.
The prevalence of distinct cell populations differed between genotypes: projection neurons were rarely encountered, whereas interneurons were encountered more often in Tg animals compared to controls. A similar difference in neuronal prevalence has been described in the R6/1 HD mouse model [43]. Striatal atrophy is a known symptom found in postmortem brains of human HD patients [44, 45], and is mainly caused by degeneration of striatal projection neurons [5, 46–48]. R6/2 mice exhibit reduced striatal volume starting at 6 weeks of age, followed by reduced neuronal area and subsequent cell loss at 12 weeks of age [6, 12, 40, 49]. We recorded from mice aged 7–10 weeks, hence, we assume that cell loss had a minor contribution to the reduced MSN prevalence in Tg mice. The low MSN prevalence may be accounted for by considering the reported alterations in both passive and active membrane properties of MSNs from R6/2 Tg mice, such as increased membrane input resistance, depolarized resting membrane potential and a reduction in both inwardly and outwardly rectifying K+ currents [15, 50, 51] and by the altered excitatory and inhibitory inputs to the MSNs reported in the Q175 mouse model of HD [52]. Furthermore, previous studies in R6/2 Tg mice, and other HD model mice, have shown increased inhibition of MSNs by local GABAergic interneurons, mainly by FSIs [16, 38, 53–56]. Our findings of a high prevalence of FSIs in Tg mice may indicate more inhibitory inputs onto MSNs in Tg mice.
Cortical and thalamic glutamatergic input exert a stronger influence on FSI activity as compared to MSNs, and in turn, FSIs exert strong unidirectional inhibition on MSNs [57–61]. In HD, the number of excitatory postsynaptic potentials measured in the striatum is reduced thus raising the question of why we encountered more FSIs in Tg mice as compared to WTs. A possible explanation is that the reduction in glutamatergic input to the striatum decreases the firing of the FSIs, which in turn, decreases the mutual lateral inhibition among the FSIs mediated by both chemical and electrical synapses [58, 62]. This would be expected to raise the membrane potential of the FSIs closer to threshold, resulting in recruitment of many FSIs in Tg mice. This suggested chain of events is strengthened by a study from Q175 HD mice showing that resting membrane potentials of FSIs from symptomatic animals were significantly more depolarized than those from WTs [63]. Put together, it is expected that more FSIs from Tg mice will be recruited, however, at a lower firing rate without affecting the upper range of FSI firing rate which conforms with our results.
The firing rate of spared MSNs from Tg mice remained unchanged, yet their ability to fire bursts was impaired compared to MSNs in WT mice, which is consistent with previous reports [20]. In accordance with our results, others have found no changes in MSN firing rate between genotypes [43]. In contrast to these findings, Miller, Walker [20] reported an elevation of firing rates of MSNs from Tg mice compared to WTs and an equivalent number of MSNs from both genotypes. The discrepancy between the studies might be due to differences in the age of the mice. The average age of the mice in Miller, Walker [20] was 7.7±0.3 weeks (mean±std), whereas most of the data in our study were from animals older than 8 weeks (9.2±0.92 weeks, mean±std). In vitro recordings indicated the biphasic nature of striatal activity; hyperactivity at younger ages (6 weeks) was replaced by hypoactivity at later stages (12 weeks) of disease progression in R6/2 Tg mice [15, 50, 64], which may account for the differences between our results and those described in [20].
Many studies have demonstrated a gradual decrease in exploratory behavior of an open field by Tg R6/2 mice starting as early as 4 weeks of age [49, 65–69]. These studies reported a reduction in the distance traveled and an increase in the time spent in an inactive mode at a similar time course as reported here in Tg mice. We found that locomotion encoding by MSNs from Tg mice was impaired in both age groups. The degraded ability of MSNs to encode the animals’ locomotion is likely due to their low prevalence in Tg mice as compared to WTs. MSN activity tends to be uncorrelated and occur phasically during different movement segments [70–72] suggesting that motor information is best conveyed downstream when a sufficient number of MSNs are active. Under the assumption that the low MSN prevalence reflects neurodegenerative processes in Tg mice it is reasonable to assume that information downstream of the striatum is lacking already in the young age group.
FSIs from Tg mice displayed age-dependent deterioration in the encoding of the animals’ locomotion. At 7–8 weeks of age, locomotion encoding by FSIs was similar across genotypes while the locomotion of Tg mice was reduced as compared to age-matched WTs. Taken together with our result that FSIs from Tg mice were more task responsive as compared to WTs, these results suggest that the FSIs may act as a compensatory mechanism for the MSN malfunction. This possibility is supported by work by Gritton, Howe [73] who showed that FSIs facilitate movement by refining the activation of MSN networks responsible for movement execution. Additionally, Gittis, Leventhal [74] demonstrated that chemical selective suppression of striatal FSIs caused akinesia, and Giampa, Middei [75] showed that protecting FSIs from degeneration alleviates motor symptoms in R6/2 Tg mice.
We propose that striatal FSIs compensate for alterations in MSN electrophysiological properties by reducing their own activity, which in turn causes further reduction of MSN activity, thus enhancing the severity of motor symptoms in the R6/2 HD mouse model. In this model, the HD neostriatal pathophysiology is a network phenomenon in which different populations of neurons interact in a complex manner in an attempt to preserve overall homeostasis of activity and therefore influence the downstream basal ganglia activity.
ACKNOWLEDGMENTS
This research was supported by the Israel Science Foundation (grant No. 1786/16) and by SYNCH project funded by the European Commission under H2020 FET Proactive programme (Grant agreement ID: 824162). The authors would like to thank Prof. Gilad Silberberg, Karolinska Institute, department of Neuroscience, Sweden, for his comments and fruitful discussion.
CONFLICT OF INTEREST
The authors have no conflict of interest to report
REFERENCES
[1] | Young AB , Shoulson I , Penney JB , Starosta-Rubinstein S , Gomez F , Travers H , et al. Huntington’s disease in Venezuela: Neurologic features and functional decline. Neurology. (1986) ;36: (2):244–9. |
[2] | Augood SJ , Faull RL , Love DR , Emson PC . Reduction in enkephalin and substance P messenger RNA in the striatum of early grade Huntington’s disease: A detailed cellular in situ hybridization study. Neuroscience. (1996) ;72: (4):1023–36. |
[3] | Deng YP , Albin RL , Penney JB , Young AB , Anderson KD , Reiner A . Differential loss of striatal projection systems in Huntington’s disease: A quantitative immunohistochemical study. J Chem Neuroanat. (2004) ; 27: (3):143–64. |
[4] | Lange H , Thorner G , Hopf A , Schroder KF . Morphometric studies of the neuropathological changes in choreatic diseases. J Neurol Sci. (1976) ;28: (4):401–25. |
[5] | Reiner A , Albin RL , Anderson KD , D’Amato CJ , Penney JB , Young AB . Differential loss of striatal projection neurons in Huntington disease. Proc Natl Acad Sci U S A. (1988) ;85: (15):5733–7. |
[6] | Mangiarini L , Sathasivam K , Seller M , Cozens B , Harper A , Hetherington C , et al. Exon 1 of the HD gene with an expanded CAG repeat is sufficient to cause a progressive neurological phenotype in transgenic mice. Cell. (1996) ;87: (3):493–506. |
[7] | Ciamei A , Morton AJ . Rigidity in social and emotional memory in the R6/2 mouse model of Huntington’s disease. Neurobiol Learn Mem. (2008) ;89: (4):533–44. |
[8] | Ciamei A , Morton AJ . Progressive imbalance in the interaction between spatial and procedural memory systems in the R6/2 mouse model of Huntington’s disease. Neurobiol Learn Mem. (2009) ;92: (3):417–28. |
[9] | Li JY , Popovic N , Brundin P . The use of the R6 transgenic mouse models of Huntington’s disease in attempts to develop novel therapeutic strategies. NeuroRx. (2005) ;2: (3):447–64. |
[10] | Walker AG , Ummel JR , Rebec GV . Reduced expression of conditioned fear in the R6/2 mouse model of Huntington’s disease is related to abnormal activity in prelimbic cortex. Neurobiol Dis. (2011) ;43: (2):379–87. |
[11] | Wood NI , Morton AJ . Social behaviour is impaired in the R6/2 mouse model of Huntington’s disease. J Huntingtons Dis. (2015) ;4: (1):61–73. |
[12] | Aggarwal M , Duan W , Hou Z , Rakesh N , Peng Q , Ross CA , et al. Spatiotemporal mapping of brain atrophy in mouse models of Huntington’s disease using longitudinal in vivo magnetic resonance imaging. Neuroimage. (2012) ;60: (4):2086–95. |
[13] | Stack EC , Kubilus JK , Smith K , Cormier K , Del Signore SJ , Guelin E , et al. Chronology of behavioral symptoms and neuropathological sequela in R6/2 Huntington’s disease transgenic mice. J Comp Neurol. (2005) ;490: (4):354–70. |
[14] | Kung VW , Hassam R , Morton AJ , Jones S . Dopamine-dependent long term potentiation in the dorsal striatum is reduced in the R6/2 mouse model of Huntington’s disease. Neuroscience. (2007) ;146: (4):1571–80. |
[15] | Klapstein GJ , Fisher RS , Zanjani H , Cepeda C , Jokel ES , Chesselet MF , et al. Electrophysiological and morphological changes in striatal spiny neurons in R6/2 Huntington’s disease transgenic mice. J Neurophysiol. (2001) ;86: (6):2667–77. |
[16] | Cepeda C , Starling AJ , Wu N , Nguyen OK , Uzgil B , Soda T , et al. Increased GABAergic function in mouse models of Huntington’s disease: Reversal by BDNF. J Neurosci Res. (2004) ;78: (6):855–67. |
[17] | Rangel-Barajas C , Rebec GV . Dysregulation of corticostriatal connectivity in Huntington’s disease: A role for dopamine modulation. J Huntingtons Dis. (2016) ;5: (4):303–31. |
[18] | Parievsky A , Moore C , Kamdjou T , Cepeda C , Meshul CK , Levine MS . Differential electrophysiological and morphological alterations of thalamostriatal and corticostriatal projections in the R6/2 mouse model of Huntington’s disease. Neurobiol Dis. (2017) ;108: :29–44. |
[19] | Rebec GV , Conroy SK , Barton SJ . Hyperactive striatal neurons in symptomatic Huntington R6/2 mice: Variations with behavioral state and repeated ascorbate treatment. Neuroscience. (2006) ;137: (1):327–36. |
[20] | Miller BR , Walker AG , Shah AS , Barton SJ , Rebec GV . Dysregulated information processing by medium spiny neurons in striatum of freely behaving mouse models of Huntington’s disease. J Neurophysiol. (2008) ;100: (4):2205–16. |
[21] | Beaumont V , Zhong S , Lin H , Xu W , Bradaia A , Steidl E , et al. Phosphodiesterase 10A inhibition improves cortico-basal ganglia function in Huntington’s disease models. Neuron. (2016) ;92: (6):1220–37. |
[22] | Yamin HG , Stern EA , Cohen D . Parallel processing of environmental recognition and locomotion in the mouse striatum. J Neurosci. (2013) ;33: (2):473–84. |
[23] | Costa RM , Cohen D , Nicolelis MA . Differential corticostriatal plasticity during fast and slow motor skill learning in mice. Curr Biol. (2004) ;14: (13):1124–34. |
[24] | Hof PR , Young WG , Bloom FE , Belichenko PV , Celio MR Comparative cytoarchitectonic atlas of the C57BL/6 and 129/Sv mouse brains: Amsterdam: Elsevier Health Sciences; (2000) . |
[25] | Lewicki MS . A review of methods for spike sorting: The detection and classification of neural action potentials. Network. (1998) ;9: (4):R53–78. |
[26] | Gage GJ , Stoetzner CR , Wiltschko AB , Berke JD . Selective activation of striatal fast-spiking interneurons during choice execution. Neuron. (2010) ;67: (3):466–79. |
[27] | Schmitzer-Torbert NC , Redish AD . Task-dependent encoding of space and events by striatal neurons is dependent on neural subtype. Neuroscience. (2008) ;153: (2):349–60. |
[28] | Berke JD , Okatan M , Skurski J , Eichenbaum HB . Oscillatory entrainment of striatal neurons in freely moving rats. Neuron. (2004) ;43: (6):883–96. |
[29] | Altman N , Krzywinski M . P values and the search for significance. Nat Methods. (2017) ;14: (1):3–4. |
[30] | Friston K . Ten ironic rules for non-statistical reviewers. Neuroimage. (2012) ;61: (4):1300–10. |
[31] | Halsey L , Curran-Everett D , Vowler S , Drummond G . The fickle P value generates irreproducible results. Nat Methods. (2015) ;12: :179–85. |
[32] | Cohen J . The statistical power of abnormal-social psychological research: A review. J Abnorm Soc Psychol. (1962) ;65: :145–53. |
[33] | Cohen J Statistical power analysis for the behavioral sciences. 2nd ed. Hillsdale, N.J.: L. Erlbaum Associates; (1988) . xxi, pp. 567. |
[34] | Minnig S , Bragg RM , Tiwana HS , Solem WT , Hovander WS , Vik ES , et al. Early detection of apathetic phenotypes in Huntington’s disease knock-in mice using open source tools. Sci Rep. (2018) ;8: (1):2304. |
[35] | Covey DP , Dantrassy HM , Yohn SE , Castro A , Conn PJ , Mateo Y , et al. Inhibition of endocannabinoid degradation rectifies motivational and dopaminergic deficits in the Q175 mouse model of Huntington’s disease. Neuropsychopharmacology. (2018) ;43: (10):2056–63. |
[36] | Heath CJ , O’Callaghan C , Mason SL , Phillips BU , Saksida LM , Robbins TW , et al. A touchscreen motivation assessment evaluated in Huntington’s disease patients and R6/1 model mice. Front Neurol. (2019) ;10: , 858. |
[37] | Hsu YT , Chang YG , Liu YC , Wang KY , Chen HM , Lee DJ , et al. Enhanced Na(+) -K(+) -2Cl(-) cotransporter 1 underlies motor dysfunction in huntington’s disease. Mov Disord. (2019) ;34: (6):845–57. |
[38] | Cepeda C , Galvan L , Holley SM , Rao SP , Andre VM , Botelho EP , et al. Multiple sources of striatal inhibition are differentially affected in Huntington’s disease mouse models. J Neurosci. (2013) ;33: (17):7393–406. |
[39] | Sun Z , Del Mar N , Meade C , Goldowitz D , Reiner A . Differential changes in striatal projection neurons in R6/2 transgenic mice for Huntington’s disease. Neurobiol Dis. (2002) ;11: (3):369–85. |
[40] | Dodds L , Chen J , Berggren K , Fox J Characterization of striatal neuronal loss and atrophy in the R6/2 mouse model of Huntington’s disease. PLoS Curr. 2014;6:ecurrents.hd.48727b68b39b82d5fe350f753984bcf9. |
[41] | Peters AJ , Fabre JMJ , Steinmetz NA , Harris KD , Carandini M . Striatal activity topographically reflects cortical activity. Nature. (2021) ;591: (7850):420–25. |
[42] | Sjulson L , Peyrache A , Cumpelik A , Cassataro D , Buzsaki G . Cocaine place conditioning strengthens location-specific hippocampal coupling to the nucleus accumbens. Neuron. (2018) ;98: (5):926–34 e5. |
[43] | Cayzac S , Delcasso S , Paz V , Jeantet Y , Cho YH . Changes in striatal procedural memory coding correlate with learning deficits in a mouse model of Huntington disease. Proc Natl Acad Sci U S A. (2011) ;108: (22):9280–5. |
[44] | Bamford KA , Caine ED , Kido DK , Plassche WM , Shoulson I . Clinical-pathologic correlation in Huntington’s disease: A neuropsychological and computed tomography study. Neurology. (1989) ;39: (6):796–801. |
[45] | de la Monte SM , Vonsattel JP , Richardson EP Jr. , Morphometric demonstration of atrophic changes in the cerebral cortex, white matter, and neostriatum in Huntington’s disease. J Neuropathol Exp Neurol. (1988) ;47: (5):516–25. |
[46] | Albin RL , Reiner A , Anderson KD , Dure LSt , Handelin B , Balfour R , et al. Preferential loss of striato-external pallidal projection neurons in presymptomatic Huntington’s disease. Ann Neurol. (1992) ;31: (4):425–30. |
[47] | Richfield EK , Maguire-Zeiss KA , Vonkeman HE , Voorn P . Preferential loss of preproenkephalin versus preprotachykinin neurons from the striatum of Huntington’s disease patients. Ann Neurol. (1995) ;38: (6):852–61. |
[48] | Slow EJ , van Raamsdonk J , Rogers D , Coleman SH , Graham RK , Deng Y , et al. Selective striatal neuronal loss in a YAC128 mouse model of Huntington disease. Hum Mol Genet. (2003) ;12: (13):1555–67. |
[49] | Samadi P , Boutet A , Rymar VV , Rawal K , Maheux J , Kvann JC , et al. Relationship between BDNF expression in major striatal afferents, striatum morphology and motor behavior in the R6/2 mouse model of Huntington’s disease. Genes Brain Behav. (2013) ;12: (1):108–24. |
[50] | Cepeda C , Wu N , Andre VM , Cummings DM , Levine MS . The corticostriatal pathway in Huntington’s disease. Prog Neurobiol. (2007) ;81: (5-6):253–71. |
[51] | Levine MS , Klapstein GJ , Koppel A , Gruen E , Cepeda C , Vargas ME , et al. Enhanced sensitivity to N-methyl-D-aspartate receptor activation in transgenic and knockin mouse models of Huntington’s disease. J Neurosci Res. (1999) ;58: (4):515–32. |
[52] | Indersmitten T , Tran CH , Cepeda C , Levine MS . Altered excitatory and inhibitory inputs to striatal medium-sized spiny neurons and cortical pyramidal neurons in the Q175 mouse model of Huntington’s disease. J Neurophysiol. (2015) ;113: (7):2953–66. |
[53] | Centonze D , Rossi S , Prosperetti C , Tscherter A , Bernardi G , Maccarrone M , et al. Abnormal sensitivity to cannabinoid receptor stimulation might contribute to altered gamma-aminobutyric acid transmission in the striatum of R6/2 Huntington’s disease mice. Biol Psychiatry. (2005) ;57: (12):1583–9. |
[54] | Cummings DM , Cepeda C , Levine MS . Alterations in striatal synaptic transmission are consistent across genetic mouse models of Huntington’s disease. ASN Neuro. (2010) ;2: (3):e00036. |
[55] | Fernandez-Garcia S , Conde-Berriozabal S , Garcia-Garcia E , Gort-Paniello C , Bernal-Casas D , Garcia-Diaz Barriga G , et al. M2 cortex-dorsolateral striatum stimulation reverses motor symptoms and synaptic deficits in Huntington’s disease. Elife. (2020) ;9: :e57017. |
[56] | Zucker B , Luthi-Carter R , Kama JA , Dunah AW , Stern EA , Fox JH , et al. Transcriptional dysregulation in striatal projection- and interneurons in a mouse model of Huntington’s disease: Neuronal selectivity and potential neuroprotective role of HAP1. Hum Mol Genet. (2005) ;14: (2):179–89. |
[57] | Planert H , Szydlowski SN , Hjorth JJ , Grillner S , Silberberg G . Dynamics of synaptic transmission between fast-spiking interneurons and striatal projection neurons of the direct and indirect pathways. J Neurosci. (2010) ;30: (9):3499–507. |
[58] | Koos T , Tepper JM . Inhibitory control of neostriatal projection neurons by GABAergic interneurons. Nat Neurosci. (1999) ;2: (5):467–72. |
[59] | Tepper JM , Koos T , Wilson CJ . GABAergic microcircuits in the neostriatum. Trends Neurosci. (2004) ;27: (11):662–9. |
[60] | Tepper JM , Abercrombie ED , Bolam JP . Basal ganglia macrocircuits. Prog Brain Res. (2007) ;160: :3–7. |
[61] | Tepper JM , Wilson CJ , Koos T . Feedforward and feedback inhibition in neostriatal GABAergic spiny neurons. Brain Res Rev. (2008) ;58: (2):272–81. |
[62] | Gittis AH , Nelson AB , Thwin MT , Palop JJ , Kreitzer AC . Distinct roles of GABAergic interneurons in the regulation of striatal output pathways. J Neurosci. (2010) ;30: (6):2223–34. |
[63] | Holley SM , Galvan L , Kamdjou T , Cepeda C , Levine MS . Striatal GABAergic interneuron dysfunction in the Q175 mouse model of Huntington’s disease. Eur J Neurosci. (2019) ;49: (1):79–93. |
[64] | Laforet GA , Sapp E , Chase K , McIntyre C , Boyce FM , Campbell M , et al. Changes in cortical and striatal neurons predict behavioral and electrophysiological abnormalities in a transgenic murine model of Huntington’s disease. J Neurosci. (2001) ;21: (23):9112–23. |
[65] | Bolivar VJ , Manley K , Messer A . Exploratory activity and fear conditioning abnormalities develop early in R6/2 Huntington’s disease transgenic mice. Behav Neurosci. (2003) ;117: (6):1233–42. |
[66] | Menalled L , El-Khodor BF , Patry M , Suarez-Farinas M , Orenstein SJ , Zahasky B , et al. Systematic behavioral evaluation of Huntington’s disease transgenic and knock-in mouse models. Neurobiol Dis. (2009) ;35: (3):319–36. |
[67] | Hong SL , Cossyleon D , Hussain WA , Walker LJ , Barton SJ , Rebec GV . Dysfunctional behavioral modulation of corticostriatal communication in the R6/2 mouse model of Huntington’s disease. PLoS One. (2012) ;7: (10):e47026. |
[68] | Rattray I , Smith E , Gale R , Matsumoto K , Bates GP , Modo M . Correlations of behavioral deficits with brain pathology assessed through longitudinal MRI and histopathology in the R6/2 mouse model of HD. PLoS One. (2013) ;8: (4):e60012. |
[69] | Chen JY , Tran C , Hwang L , Deng G , Jung ME , Faull KF , et al. Partial amelioration of peripheral and central symptoms of Huntington’s disease via modulation of lipid metabolism. J Huntingtons Dis. (2016) ;5: (1):65–81. |
[70] | Barbera G , Liang B , Zhang L , Gerfen CR , Culurciello E , Chen R , et al. Spatially compact neural clusters in the dorsal striatum encode locomotion relevant information. Neuron. (2016) ;92: (1):202–13. |
[71] | Kimura M . Behaviorally contingent property of movement-related activity of the primate putamen. J Neurophysiol. (1990) ;63: (6):1277–96. |
[72] | Fobbs WC , Bariselli S , Licholai JA , Miyazaki NL , Matikainen-Ankney BA , Creed MC , et al. Continuous representations of speed by striatal medium spiny neurons. J Neurosci. (2020) ;40: (8):1679–88. |
[73] | Gritton HJ , Howe WM , Romano MF , DiFeliceantonio AG , Kramer MA , Saligrama V , et al. Unique contributions of parvalbumin and cholinergic interneurons in organizing striatal networks during movement. Nat Neurosci. (2019) ;22: (4):586–97. |
[74] | Gittis AH , Leventhal DK , Fensterheim BA , Pettibone JR , Berke JD , Kreitzer AC . Selective inhibition of striatal fast-spiking interneurons causes dyskinesias. J Neurosci. (2011) ;31: (44):15727–31. |
[75] | Giampa C , Middei S , Patassini S , Borreca A , Marullo F , Laurenti D , et al. Phosphodiesterase type IV inhibition prevents sequestration of CREB binding protein, protects striatal parvalbumin interneurons and rescues motor deficits in the R6/2 mouse model of Huntington’s disease. Eur J Neurosci. (2009) ;29: (5):902–10. |


