
A Multi-Omic Huntington’s Disease Transgenic Sheep-Model Database for Investigating Disease Pathogenesis
Abstract
Background:
The pathological mechanism of cellular dysfunction and death in Huntington’s disease (HD) is not well defined. Our transgenic HD sheep model (OVT73) was generated to investigate these mechanisms and for therapeutic testing. One particular cohort of animals has undergone focused investigation resulting in a large interrelated multi-omic dataset, with statistically significant changes observed comparing OVT73 and control ‘omic’ profiles and reported in literature.
Objective:
Here we make this dataset publicly available for the advancement of HD pathogenic mechanism discovery.
Methods:
To enable investigation in a user-friendly format, we integrated seven multi-omic datasets from a cohort of 5-year-old OVT73 (n = 6) and control (n = 6) sheep into a single database utilising the programming language R. It includes high-throughput transcriptomic, metabolomic and proteomic data from blood, brain, and other tissues.
Results:
We present the ‘multi-omic’ HD sheep database as a queryable web-based platform that can be used by the wider HD research community (https://hdsheep.cer.auckland.ac.nz/). The database is supported with a suite of simple automated statistical analysis functions for rapid exploratory analyses. We present examples of its use that validates the integrity relative to results previously reported. The data may also be downloaded for user determined analysis.
Conclusion:
We propose the use of this online database as a hypothesis generator and method to confirm/refute findings made from patient samples and alternate model systems, to expand our understanding of HD pathogenesis. Importantly, additional tissue samples are available for further investigation of this cohort.
INTRODUCTION
Huntington’s disease (HD; OMIM#143100) is a neurodegenerative genetic disorder caused by an expanded polyglutamine-coding repeat (CAG) in the Huntingtin gene (HTT) [1]. The CAG repeat length ranges from 6–35 units in unaffected individuals while repeat lengths > 39 unequivocally result in the disease. There is a strong inverse correlation with repeat length and age at onset of symptoms, functionally linking the mutation to the disease mechanism [2–4]. The functions of the protein product huntingtin and altered actions of the mutant protein in HD are not completely defined. Although there is promising progress with HTT-expression knockdown approaches, no therapeutic to prevent or delay the onset of HD has been approved for clinical use.
Many animal models of HD have been made to investigate its pathogenic mechanism, with mice being the most widely used [5]. Our laboratory generated the first large mammalian model of HD using sheep, with the aim of taking advantage of their larger brain (∼100 grams) and longer life (∼12 years) to follow the more gradual progression of the disease. This transgenic sheep model, termed OVT73, expresses an 11.6 kb transgene that comprises the full length human HTT mRNA as cDNA with an expanded pure CAG repeat of 69 units. The pure CAG repeat is immediately followed by a CAACAGCAACAG tract, to encode a total polyglutamine repeat of 73 units. Human HTT expression is driven by a 1.1 kb genomic fragment of the human HTT promoter which is located immediately upstream of the ATG site as part of the transgene [6]. Even at 11 years of age, OVT73 sheep show no overt symptoms or neuronal loss but do develop huntingtin positive inclusions in a graded manner across different brain regions that is reminiscent of HD pathology [7]. OVT73 sheep also have measurable circadian changes including increased activity overnight [8], comparable to that observed in patients [9], and significant alterations in the abundance of metabolites found in the cerebellum and liver [10]. Metabolic profiling of plasma collected in an independent OVT73 study also revealed significant changes in the levels of sphingolipids, biogenic amines, and amino acids [11] similar to that observed in HD patients [12]. The OVT73 brain has region-specific elevated levels of urea and increased transcript levels of the urea transporter SLC14A1 [13]. SLC14A1 has been reported as the most significant differentially expressed transcript in a microarray study of HD patient brain tissue [14]. Importantly we have also identified raised urea in the postmortem HD brain [13, 15]. Together, these findings indicate that the OVT73 model captures an early, prodromal disease stage, recapitulating a range of genetic, proteomic, metabolic, and behavioural phenotypes.
During the course of our investigations using the OVT73 model, a large set of data has been gene-rated from tissues collected from a single mixed-sex cohort of 5-year-old sheep (OVT73 = 6, control = 6). This includes high-throughput transcriptomic, metabolomic, and proteomic data from blood, brain, and other peripheral tissues, as well as basic biometric measurements (e.g., weight, sex, age). In order to fully utilise this valuable and complex source of data collected from the same animals at a single postmortem timepoint, we integrated multiple datasets into a single multi-omic platform in R, facilitating exploratory visual and statistical analyses of OVT73 as a biological system.
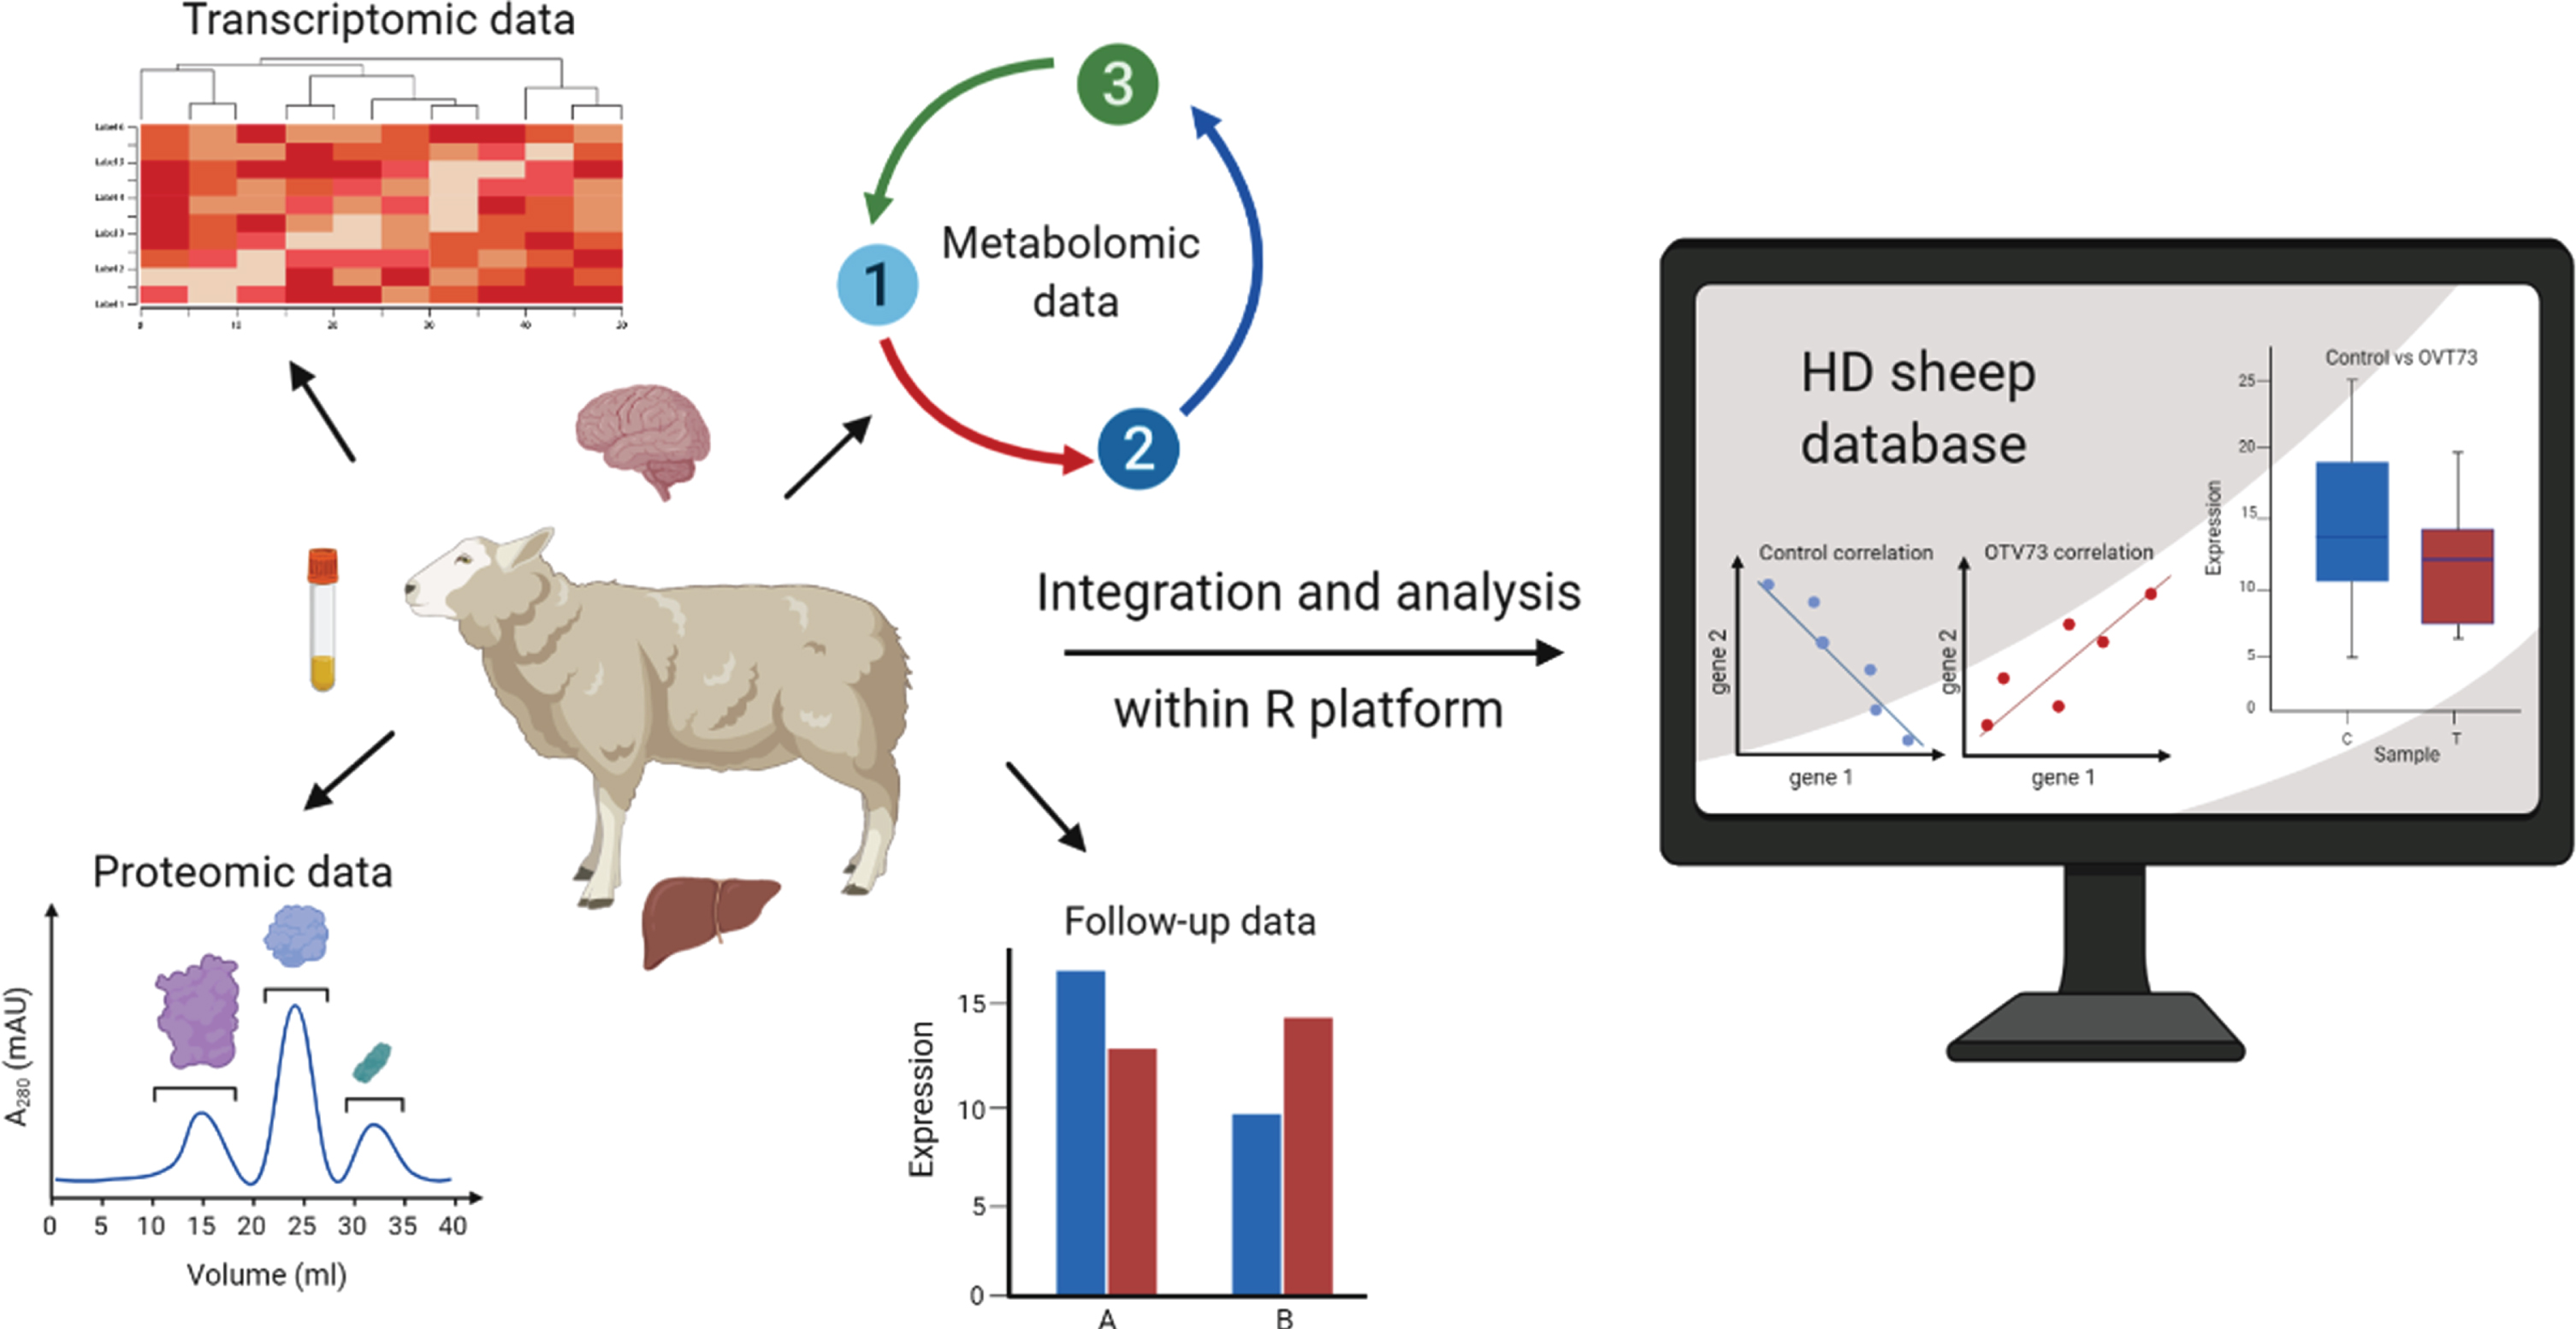
To promote data sharing and facilitate future discoveries, this resource has been made publicly available through an interactive web-based database: https://hdsheep.cer.auckland.ac.nz. Users can query specific genes/metabolites/proteins of interest within each dataset and perform basic statistical analyses for OVT73 versus control comparisons. An overview of the approach is shown in Fig. 1.
Fig. 1
An overview of our approach to the integration and exploratory analysis of multi-omic data from a sheep model of Huntington’s disease. Seven datasets (transcriptomic, metabolic, and proteomic) collected from brain and peripheral tissues of a single cohort of 5-year-old OVT73 (n = 6) and control (n = 6) sheep were integrated into a multi-omic platform in R for multivariate analyses. Within the platform, individual datasets can be analysed and visualised using a range of exploratory multivariate techniques as presented in this report. The data and a selection of statistical functions have been made available as a user-queryable, interactive, online database https://hdsheep.cer.auckland.ac.nz/Figure created with BioRender.com.
Here we report the development of the multi-omic HD transgenic sheep database and provide examples of how it can be utilised for multivariate analyses. Complex data is presented using a range of graphical tools, demonstrating how data visualisation can provide new insights and facilitate the interpretation of results. We also developed a package in R (exCorr) to undertake differential correlation analyses and this functionality is implemented within the database. We have focused on changes in correlation structures (i.e., between a control and test group) to gain insight into underlying regulatory networks and how these may be implicated in the disease process. This unique resource is primarily a tool for the HD research community, allowing others to explore data from a large animal model of HD. The database is also a rich resource of biological data for control sheep and therefore may also find wider value in the sheep research community for understanding basic biological processes in sheep, particularly the brain.
MATERIALS AND METHODS
The 5-year-old OVT73 sheep cohort
All datasets were generated from samples obtained from the same cohort of 5-year-old South Australian Merino (n = 12). These animals were generated using juvenile in-vitro embryo transfer (JIVET), involving artificial insemination of eggs harvested from 6-week-old transgenic ewes, with all animals born as singletons from surrogate mothers. The cohort consists of two groups of siblings; six G1 generation animals (Table 1) were the progeny from crossing the founder (G0) transgenic ewe with a control ram (Ram A), six G2 generation animals (Table 1) were the progeny from crossing another G1 transgenic ewe (a full sibling to the six G1 animals in the cohort) with another control ram (Ram B). The sheep were maintained at the South Australian Research and Development Institute (SARDI) in accordance with the SARDI/PIRSA (Department of Primary Industries and Regions South Australia) Animal Ethics Committee (Approval number 19/02). Animals were kept as part of mixed wild-type/transgenic flocks in large paddocks typical of South Australian farming conditions, grazing pasture ad libitum with feed supplementation during dry season periods when there was little or no pasture feed on offer. Rams and ewes were kept in separate flocks but in the same locality. In June 2012, the animals were euthanized, and tissue necropsy was performed at the Large Animal Research and Imaging Facility (LARIF), Adelaide, Australia in accordance with the SARDI/PIRSA Animal Ethics Committee (Approval number 05/12) and LARIF/SA Pathology Animal Ethics Committee (Approval number 31/12). Sheep were killed by rapid intravenous injection of pentobarbitone sodium solution (Lethabarb, 1 ml/2 kg body weight). Brain and peripheral tissues were immediately sampled and snap frozen in liquid nitrogen as described in [10]. Transgenic status of each sheep was confirmed by PCR amplification of the transgene from tail-tissue genomic DNA using methods described in [16]. All samples were stored at –80°C until use. Necropsy and biometric data for each animal is summarised in Table 1.
Table 1
HD Sheep harvest and biometric information
| Sheep ID | Sex | Status | Generation | DOB | Age | Body weight (kg) | Date of harvest | Brain weight (g) | Cerebrum length (cm) | PM delay (min) |
| C373EG2 | Ewe | C | G2 | 25/02/2007 | 5y 4m | 76.4 | 6/06/2012 | 128.87 | 8 | 52 |
| C382EG2 | Ewe | C | G2 | 01/03/2007 | 5y 4m | 86.6 | 7/06/2012 | 132.46 | 8 | 41 |
| C337RG1 | Ram | C | G1 | 24/08/2006 | 5y 10m | 94.4 | 8/06/2012 | 126.09 | 8 | 62 |
| C335RG1 | Ram | C | G1 | 23/08/2006 | 5y 10m | 74.2 | 12/06/2012 | 123.67 | 8 | 50 |
| C357RG1 | Ram | C | G1 | 26/08/2006 | 5y 10m | 104 | 13/06/2012 | 138.63 | 8 | 56 |
| C334RG1 | Ram | C | G1 | 23/08/2006 | 5y 10m | 104 | 14/06/2012 | 143.71 | 8.5 | 63 |
| T372EG2 | Ewe | T | G2 | 25/02/2007 | 5y 4m | 72 | 6/06/2012 | 124.18 | 8 | 47 |
| T377EG2 | Ewe | T | G2 | 27/02/2007 | 5y 4m | 75.6 | 7/06/2012 | 128.19 | 8.5 | 45 |
| T376EG2 | Ewe | T | G2 | 27/02/2007 | 5y 4m | 73.2 | 8/06/2012 | 118.24 | 7.5 | 46 |
| T317RG1 | Ram | T | G1 | 20/08/2006 | 5y 10m | 85.8 | 12/06/2012 | 124.58 | 8 | 61 |
| T339RG1 | Ram | T | G1 | 24/08/2006 | 5y 10m | 88 | 13/06/2012 | 123.75 | 7.5 | 55 |
| T383RG2 | Ram | T | G2 | 25/02/2007 | 5y 4m | 91.4 | 14/06/2012 | 129.24 | 7.5 | 62 |
Harvest details and biometric data from the 5-year-old sheep cohort (OVT73 = 6, Control = 6). C, Control sheep; T, Transgenic sheep (OVT73); DOB, date of birth; PM, postmortem; y, years; m, months; kg, kilograms; g, grams; cm, centimetres; min, minutes.
Datasets used in this research
Seven individual datasets sourced from OVT73 researchers were incorporated into the HD sheep platform/database (Table 2). These datasets were generated from brain and peripheral tissue samples taken from the 5-year-old cohort (OVT73 = 6, Control = 6). Included are two high-throughput RNA-Seq datasets collected from sub-regions of the striatum, a targeted transcription dataset validating the quantification of transcripts from 24 selected striatal genes via NanoString, proteomic datasets generated from striatum, cerebellum, and motor cortex, and two metabolic datasets quantifying metabolite abundance in brain (cerebellum, motor cortex and hippocampus) and peripheral (liver and plasma) tissues. In addition, a targeted dataset was sourced from a follow-up study which quantified the metabolite urea in 11 tissues. A description of each dataset including experimental and data normalisation procedures, and previous publications, is provided in the Supplementary Material. Individual datasets have been assigned a unique number for reference in this report (Table 2).
Table 2
Summary of datasets integrated into the multi-omic HD sheep platform/database
| Ref. data number | Data type | # Detected variables | Tissue (Nominally significant) | Study Description | Associated Publications |
| 1 | Transcriptomic | 25860 | Striatum dorsal-medial portion (652) | RNA sequencing analysis to identify differentially expressed genes in the striatum. | [13] |
| 2 | Transcriptomic | 25 | Striatum DL (2) DM portions (11) | nanoString quantification of 24 genes to validate findings identified in Ref.data 1. | [13] |
| 3 | Transcriptomic | 18280 | Striatal matrix-derived neurons via laser-captured microdissection - LCM (310) | RNA sequencing analysis to identify differentially expressed genes in striatal neurons specifically. | unpublished |
| 4 | Metabolomic | Up to 62 | Motor cortex (2) Cerebellum (3) Hippocampus (0) Liver (0) | GS-MS metabolite assessment of ∼50 metabolites. | [10] |
| 5 | Metabolomic | Up to 168 | Motor cortex (7) Cerebellum (8) Plasma (4) Liver (7) | Biocrates LC-MS metabolite assessment of ∼180 metabolites. | unpublished |
| 6 | Proteomic | 2075 (Cerebellum) 2171 (Motor cortex) 2287 (Striatum) | Striatum (39) Motor cortex (17) Cerebellum (21) | Relative quantification of protein abundance in sub-regions of the brain via LC-MS-MS coupled with isobaric mass tagging (iTRAQ). | Unpublished |
| 7 | Follow-up | 2 | Cerebellum (0) Hippocampus (0) Motor cortex (0) Striatum (1) Bladder (0) Heart (0) Kidney (0) Liver (0) Testes (0) Serum (2) Urine (0) | Biochemical quantification of urea via enzymatic assay as further investigation of findings in Ref data 1. and 2. | [13] |
All data was collected from the same cohort of 5-year-old sheep (OVT73 = 6, control = 6). For the purpose of this report, each dataset has been assigned a unique reference number, detailed here, together with the type of ‘omic’ data collected, tissues analysed, a brief description of the study and the associated publications. The number of detected variables is included along with the number of these variables in OVT73 vs. control comparison that are nominally significant (split by tissue type where relevant). DE, differentially expressed; GC-MS, Gas chromatography–mass spectrometry; LC-MS, Liquid chromatography–mass spectrometry; LC-MS-MS, liquid chromatography-tandem mass spectrophotometry; iTRAQ, Isobaric tags for relative and absolute quantitation.
Assembly of the HD sheep platform, initial analyses, and data visualisation
R programming language (R Core Team 2018) was chosen as a tool to assemble the ‘multi-omic’ platform due to the abundance of add-on packages relevant to this research, and publication-quality graphics. R is freely available from the Comprehensive R Archive Network (CRAN, https://cran.r-project.org/), under the GNU General Public License. This work was undertaken using RStudio (RStudio Team 2018), a powerful integrated development environment (IDE) where visible panes display useful outputs simultaneously. The R package, ‘tidyverse’ (version 1.2.1, downloaded 2017) [18], containing six additional core packages, was installed on base R software, for data manipulation, analysis, and visualisation.
Organizational inconsistencies between each data-set, specifically sample naming and the arrangement/format of data, were adjusted according to Hadley Wickham’s ‘Tidy Data’ [19]. Within each dataset, the data was rearranged so that variables formed columns and samples were represented by rows. Categorical information, including transgenic/control status (T or C) and ewe/ram sex (E or R) was also added to each dataset as two new variable columns. For datasets that contained measurements from multiple tissue types a third categorical variable was included signifying the sample region (e.g., striatum, motor cortex). All other variables were numeric, consisting of values representing data-specific measurements. A unique identifier name was created for each of the 12 sheep and was used to denote the animal that each sample in a dataset was derived from. These sheep ID numbers were used consistently across all datasets to allow for pairwise comparisons. Specific R functions for data analyses and visualisation are described in the results section and can be found in the raw R scripts.
Development of the web-based HD sheep database and a summary of the statistics and analyses as presented under each database tab
R Shiny [20] was used to build a web application to serve as a public interface for query-based HD sheep data exploration and analyses. Our local HD sheep R platform was converted into a queryable web-based interface (the HD sheep database) and is accessible at https://hdsheep.cer.auckland.ac.nz. This online database hosts all the data described in Table 2 and allows each dataset to be queried using statistical functions implemented in the specific analysis tabs, summarised below.
Student’s t-test
This analysis tab gives the user a brief introduction into the spread of the data within the two groups. We employ the central limit theorem to justify using the studentised t-test to calculate an unadjusted p value for nominal significance.
Bootstrap and permutation tests
Bootstrapping was applied to gather further insight and better predict a population mean from the small sample size. Bootstrap distributions have been created individually for both transgenic and control groups. The permutation test result, comparing transgenics and controls, is a non-parametric resampling test for significance that takes the small sample size into consideration.
Principal components analysis (PCA)
PCA was used to visualise the variance within variables measured in a population in reduced dimensions.
Differential correlation statistics
Pearson R-score correlation statistics have been calculated for pairwise variables in the data set, independently for both conditions. The Z statistic is a significance score indicating the degree by which the correlation structure changes between the two conditions.
Differential correlation plots
The figures produced under this tab are a graphical representation of the Differential Correlation Statistics tab, showing how the correlation structure between two variables changes between the two conditions. A Pearson’s R correlation value and Fisher Z-score are given to indicate the strength of the relationship between the two variables of interest and the significance of the change between the two conditions.
Some of the queries implemented on the online database are dynamic and others utilise precomputed results for speed. The raw datasets and outputs from the analyses can be downloaded from the website. All R scripts for data importation, website development, and exploratory queryable analyses using R Shiny are publicly available on the following GitHub repository: https://github.com/Applied-Translational-Genetics/HDSheep_WebApp_Code.
Implementation of the ‘exCorr’ R package, for differential correlation analysis within the HD sheep database
To investigate differential correlations between any two variables and compare OVT73 and control groups in the HD sheep database, we developed the R package, exCorr, and implement it under the differential correlation analysis tabs. The exCorr package implements six functions for exploratory diff-erential correlation analysis, calculating pairwise correlation coefficients (r) and associated p-values for variable-variable combinations, with separation of two groups for differential comparison (e.g., control and test). The exCorr R package is open-source and available for download (including documentation) via the GitHub repository: https://github.com/emily5/exCorr.
RESULTS
To further enable the investigation of the molecular mechanisms of HD pathogenesis, we assembled a multi-omic mutant HTT cDNA transgenic sheep platform in R containing multiple datasets generated from the OVT73 sheep model of HD. All datasets are from a single cohort of 5-year-old OVT73 (n = 6) and control (n = 6). The platform includes high throughput RNA-Seq, proteomic and metabolomic data from brain and peripheral tissue samples, as well as further data collected from targeted investigative and validation studies. Each dataset has been assigned a unique number for reference in this report (Table 2).
The results are presented in two sections. The first section describes the methods used to validate data after its integration into the multi-omic HD sheep R platform. The second section presents the HD sheep database, a queryable web-based interface for the HD research community.
Validation of data integrity in the multi-omic HD sheep R platform
As the datasets were re-formatted to enable integration in R, we first sought to confirm that the integrity of each dataset was intact within the platform. To do this, each dataset was analysed for known results, including our previously published observations. A selection of these validation results is described.
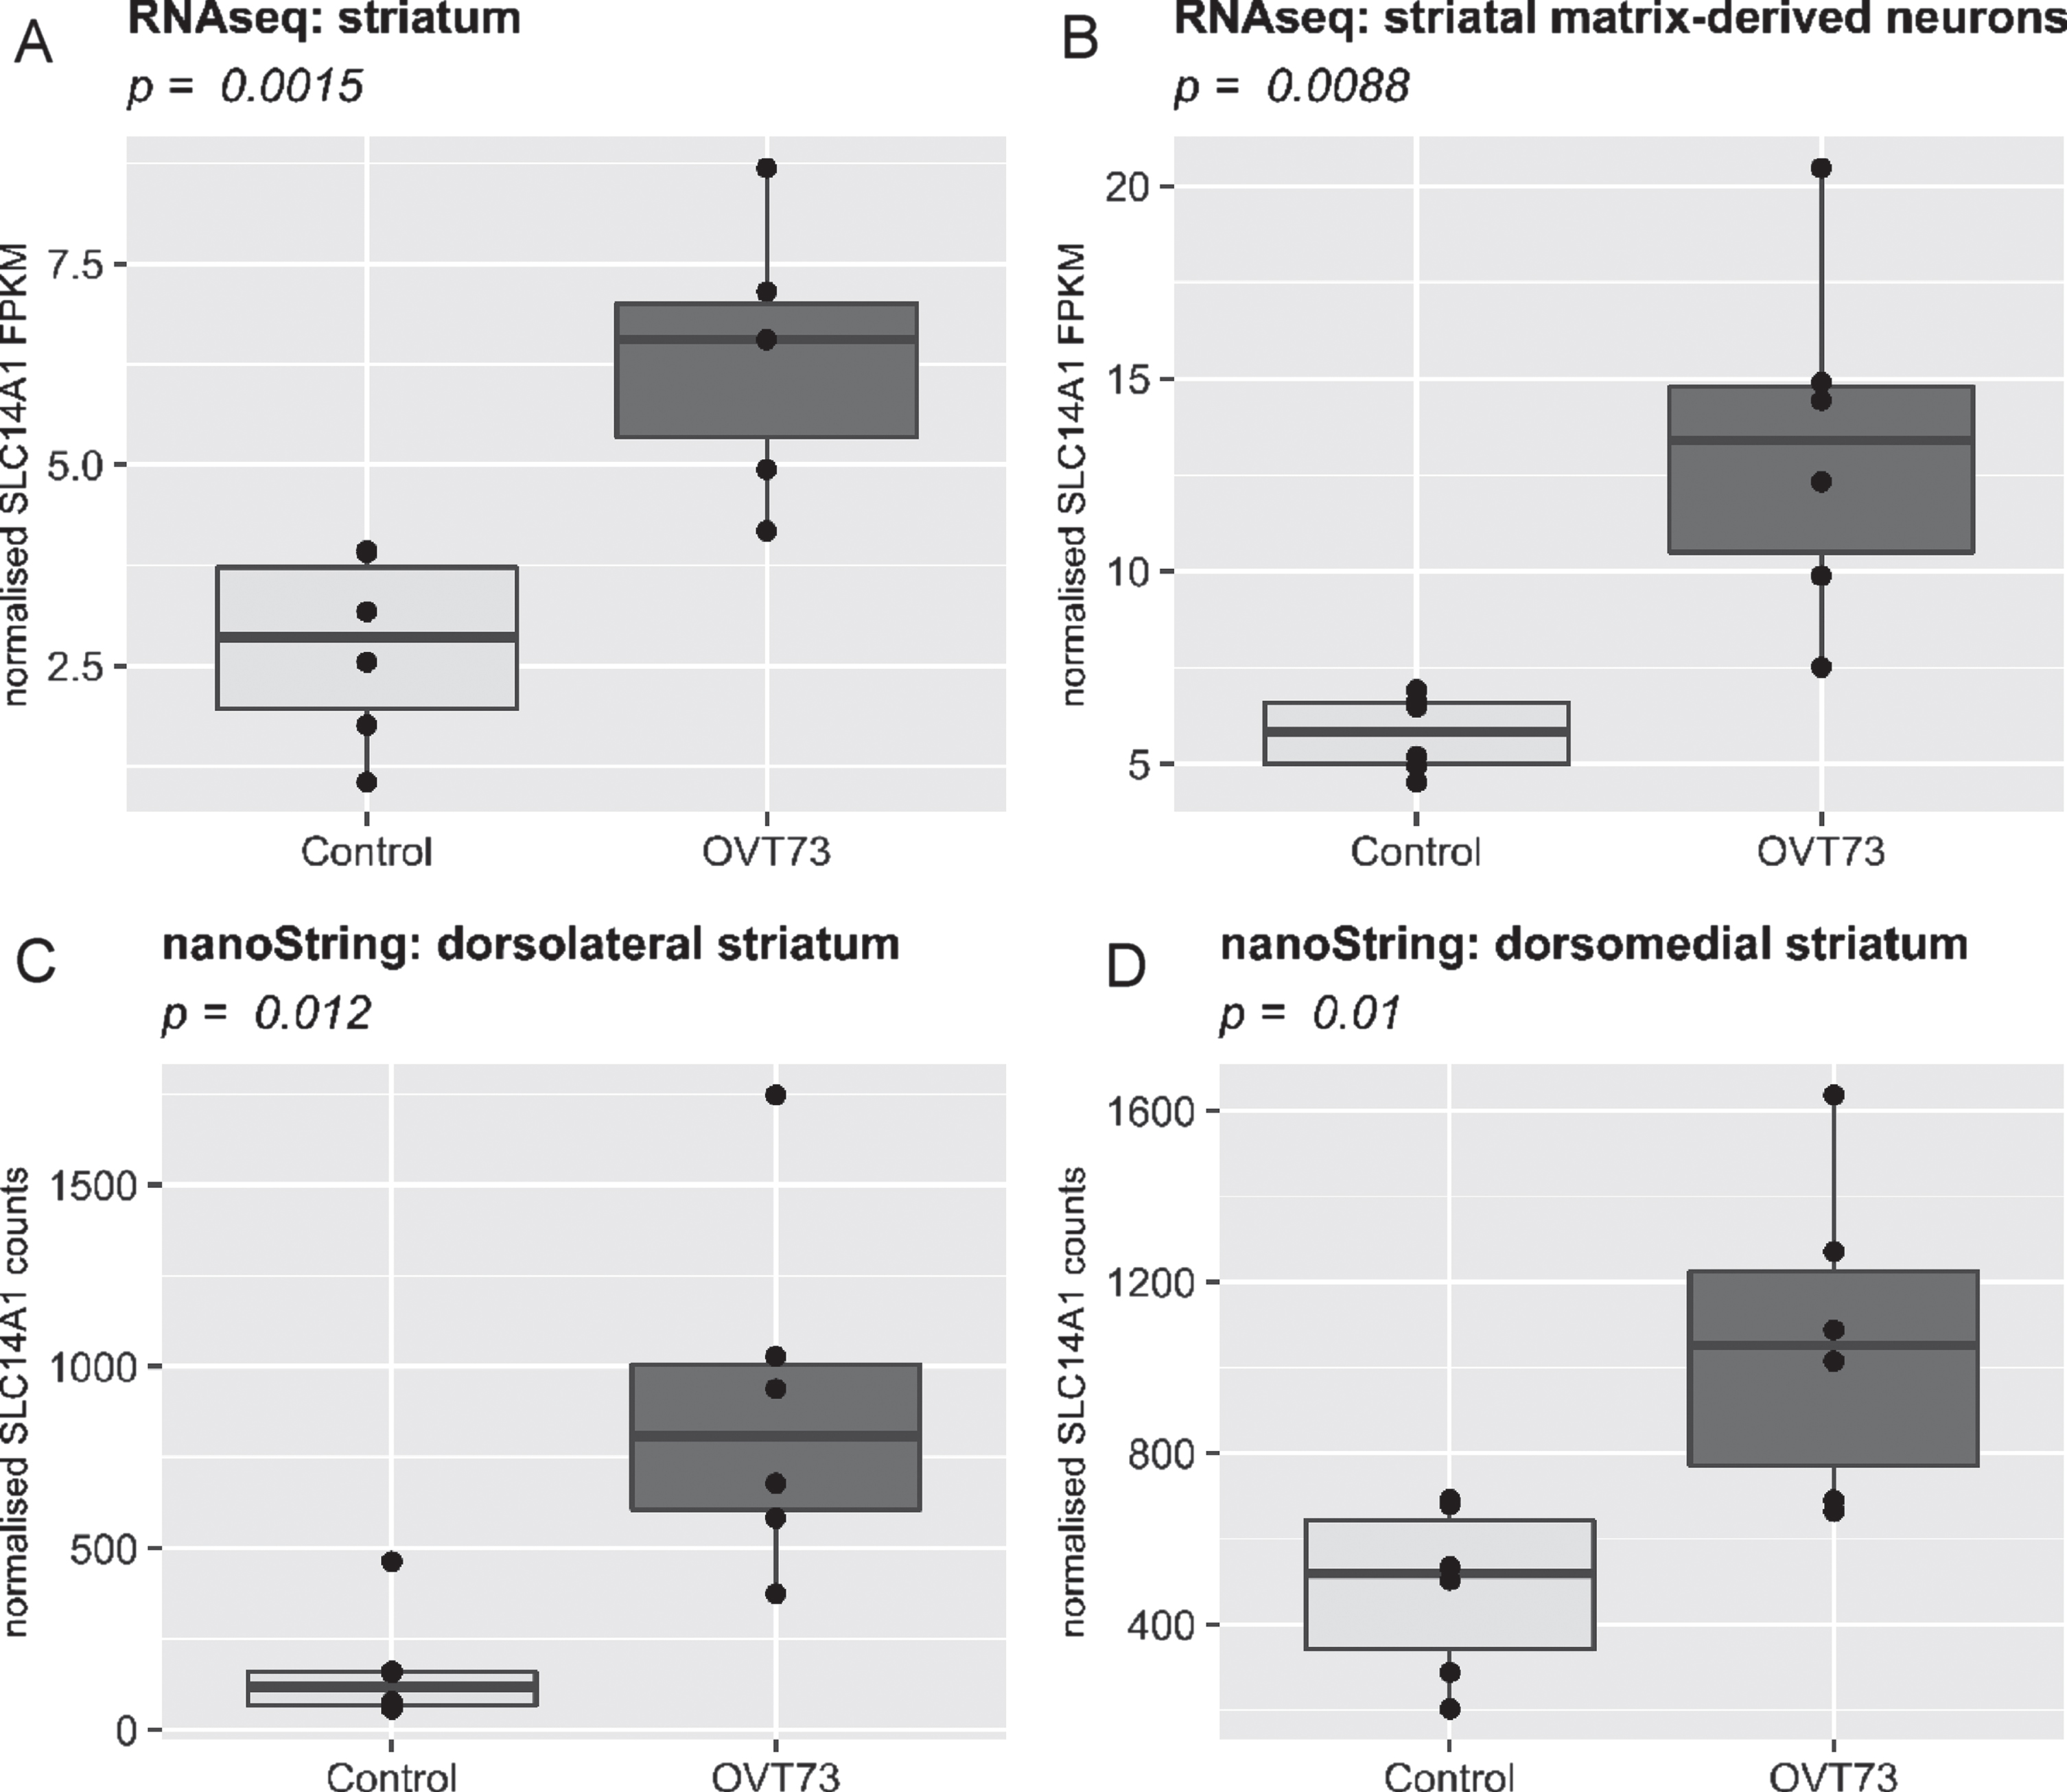
We previously reported that expression of the urea transporter SLC14A1 is upregulated in the OVT73 str-iatum (Ref. data 1 and 2) [13]. Repeated investigation of this transcript in the same dataset (Ref. data 1 and 2) in the HD sheep platform confirmed this result, validating the accurate transfer of data into the database context (Fig. 2A, C, D). Moreover, we report here that SLC14A1 is also upregulated in a separately generated RNA-Seq dataset derived from laser captured striatal matrix-derived neurons obtained from the same animals (Ref. data 3) (Fig. 2B). This finding provides additional support to our hypothesis that there is a urea cycle defect in HD, where resulting elevated levels of urea in the brain [13, 15] could be contributing to cell dysfunction and death.
Fig. 2
Comparison of SLC14A1 expression in four different transcriptomic datasets within the multi-omic HD sheep platform. SLC14A1 is significantly upregulated (p < 0.05, two tailed T-test) in the OVT73 brain (n = 6) relative to control animals (n = 6). A) Ref. data 1: An RNA-Seq analysis conducted on striatum samples, B) Ref. data 3: An RNA-Seq analysis conducted on striatal matrix-derived neurons preferentially captured via laser-captured microdissection. C, D) Ref. data 2: nanoString quantification of 24 genes conducted on samples taken from dorsolateral (C) and dorsomedial (D) striatum. In all graphs the x-axis displays the transgenic status of the sheep (Control or OVT73) and the y-axis displays normalised SLC14A1 levels (FPKM for RNA-Seq data and normalised counts for nanoString data). Direct visual comparison of datasets as shown was performed using the ggplot2 package in R.
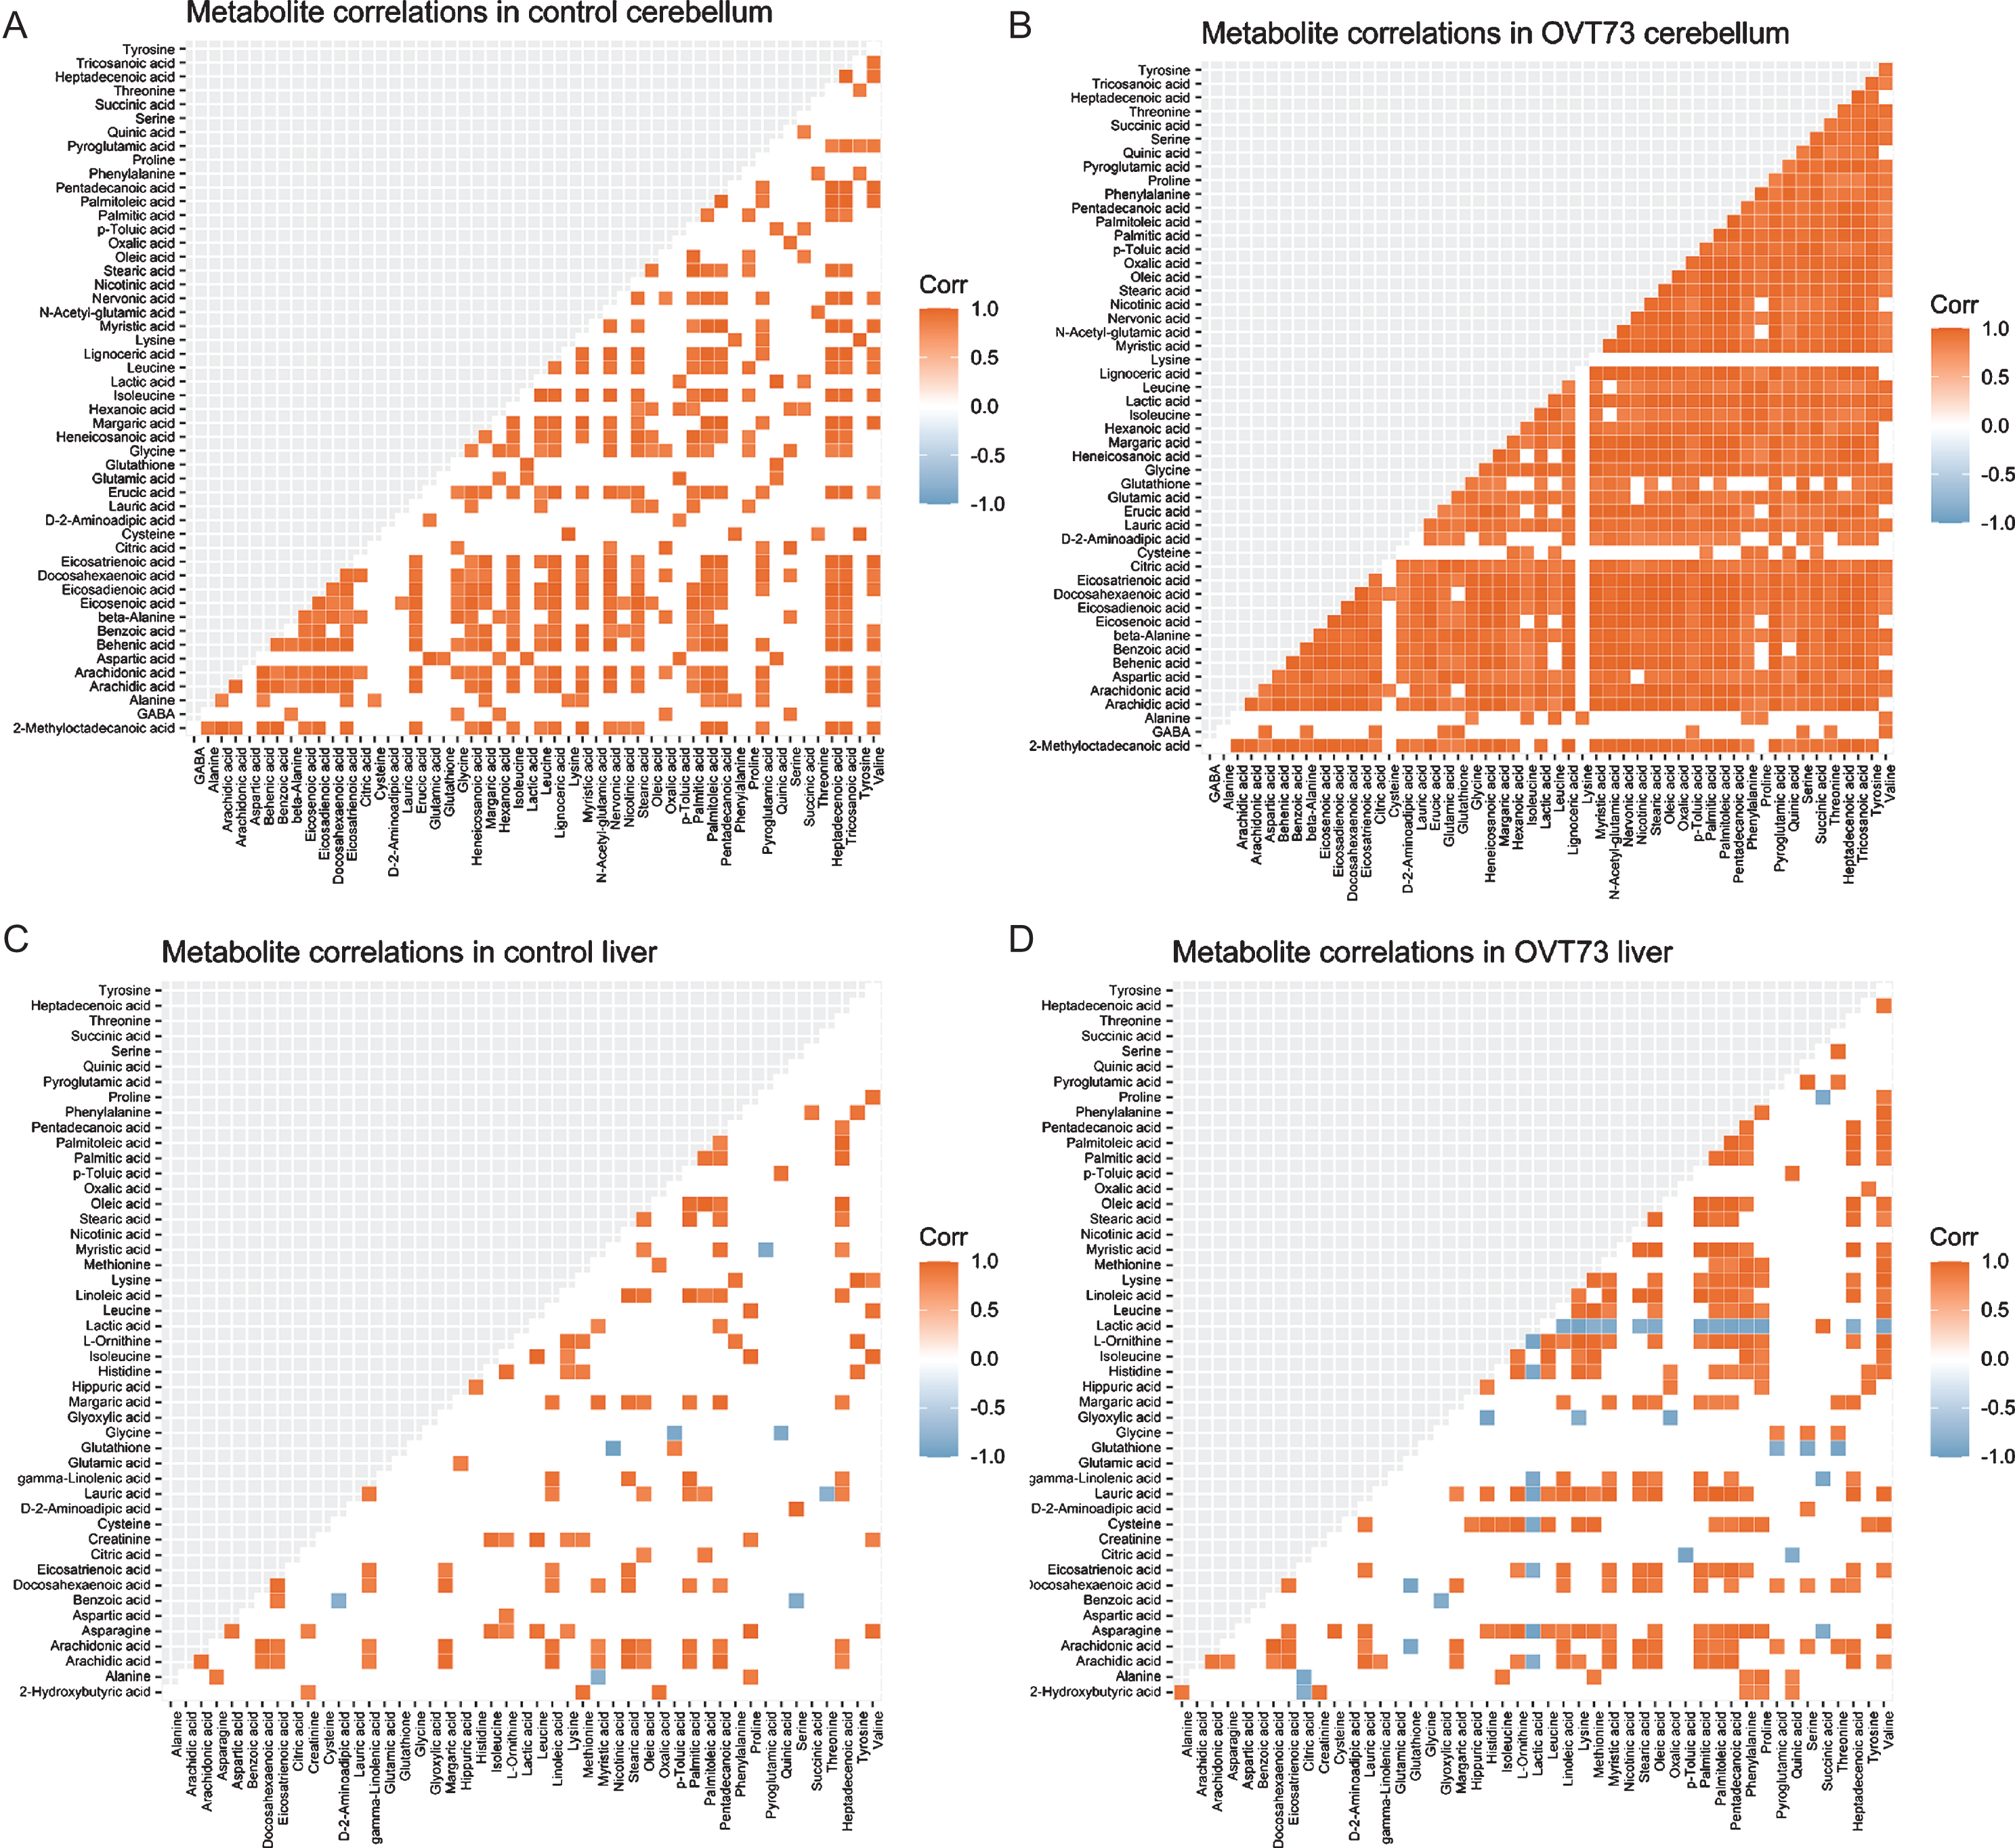
Another previously reported observation is a hy-per-regulation of metabolites measured in the OVT73 cerebellum and liver compared to control samples (Ref. data 4) [10]. This newly formatted metabolite data within our HD sheep R platform, was analysed using the R package, ggcorrplot, generating pairwise correlation matrices and heatmaps for visualisation and interpretation (Fig. 3) (Ref. data 4). An excess of strong metabolite pairwise correlations were again seen in the OVT73 cerebellum and liver samples compared with controls, supporting a hypothesis that metabolic pathways are more tightly regulated in the prodromal OVT73 sheep model.
Fig. 3
OVT73 have more significant metabolite-metabolite correlations than controls. The ggcorrplot() function in R was applied to GC-MS metabolomics dataset (Ref. data 4), producing correlation coefficients, p-values and visual plots, as shown, for every variable-variable pair, with comparison of OVT73 and control groups. Significantly positively correlated metabolites are displayed as red squares and significantly negatively correlated metabolites are displayed as blue squares (p < 0.05) according to the figure legend. As shown by the number of coloured squares, there were more significantly correlated metabolite-metabolite pairs in the OVT73 cerebellum (B) and liver (D) compared to their respective control plots; control cerebellum (A) and control liver (C).
These initial validation analyses were conducted on each individual dataset within the multi-omic HD sheep platform and confirmed that the integrity of each dataset was intact and were directly comparable to previously reported results. Moreover, the platform enables data to be visualised in a way that can be easily interpreted, especially when comparing multiple variables.
To expand on the dataset validation, two tables are presented in the supplemental data showing add-itional comparisons between the striatal gene expression results. The nominal significance values and direction of change of gene expression of OVT73 versus control sheep measured by three methods (selected gene nanostring RNA quantification, striatal RNA-Seq, and the LCM striatal neurone RNA-Seq) are given in Supplementary Table 1. In addition, the intersect between the nominally significant differentially expressed genes in both the striatal RNA-Seq and the LCM striatal neurone RNA-Seq data sets are presented for comparison in Supplementary Table 2.
Development and utilisation of the online HD transgenic sheep database
To promote data sharing and accelerate the dis-covery of mechanisms involved in HD pathogen-esis, we converted our local HD transgenic sheep platform in R, into an interactive web-based RShiny database that can be utilised by HD researchers. The online database, which is accessible at https://hdsheep.cer.auckland.ac.nz/, contains detailed information regarding the OVT73 model, the 5-year-old cohort specifically, and includes a list of previously published journal articles for reference. The database hosts all the data described in Table 2 and contains specific analysis tabs for various statistical tests with visual outputs. The user can query the database without programming knowledge and use it to investigate specific transcripts/proteins/metabolites within the HD sheep system, providing another layer of HD data for the investigation of potential disease mechanisms.
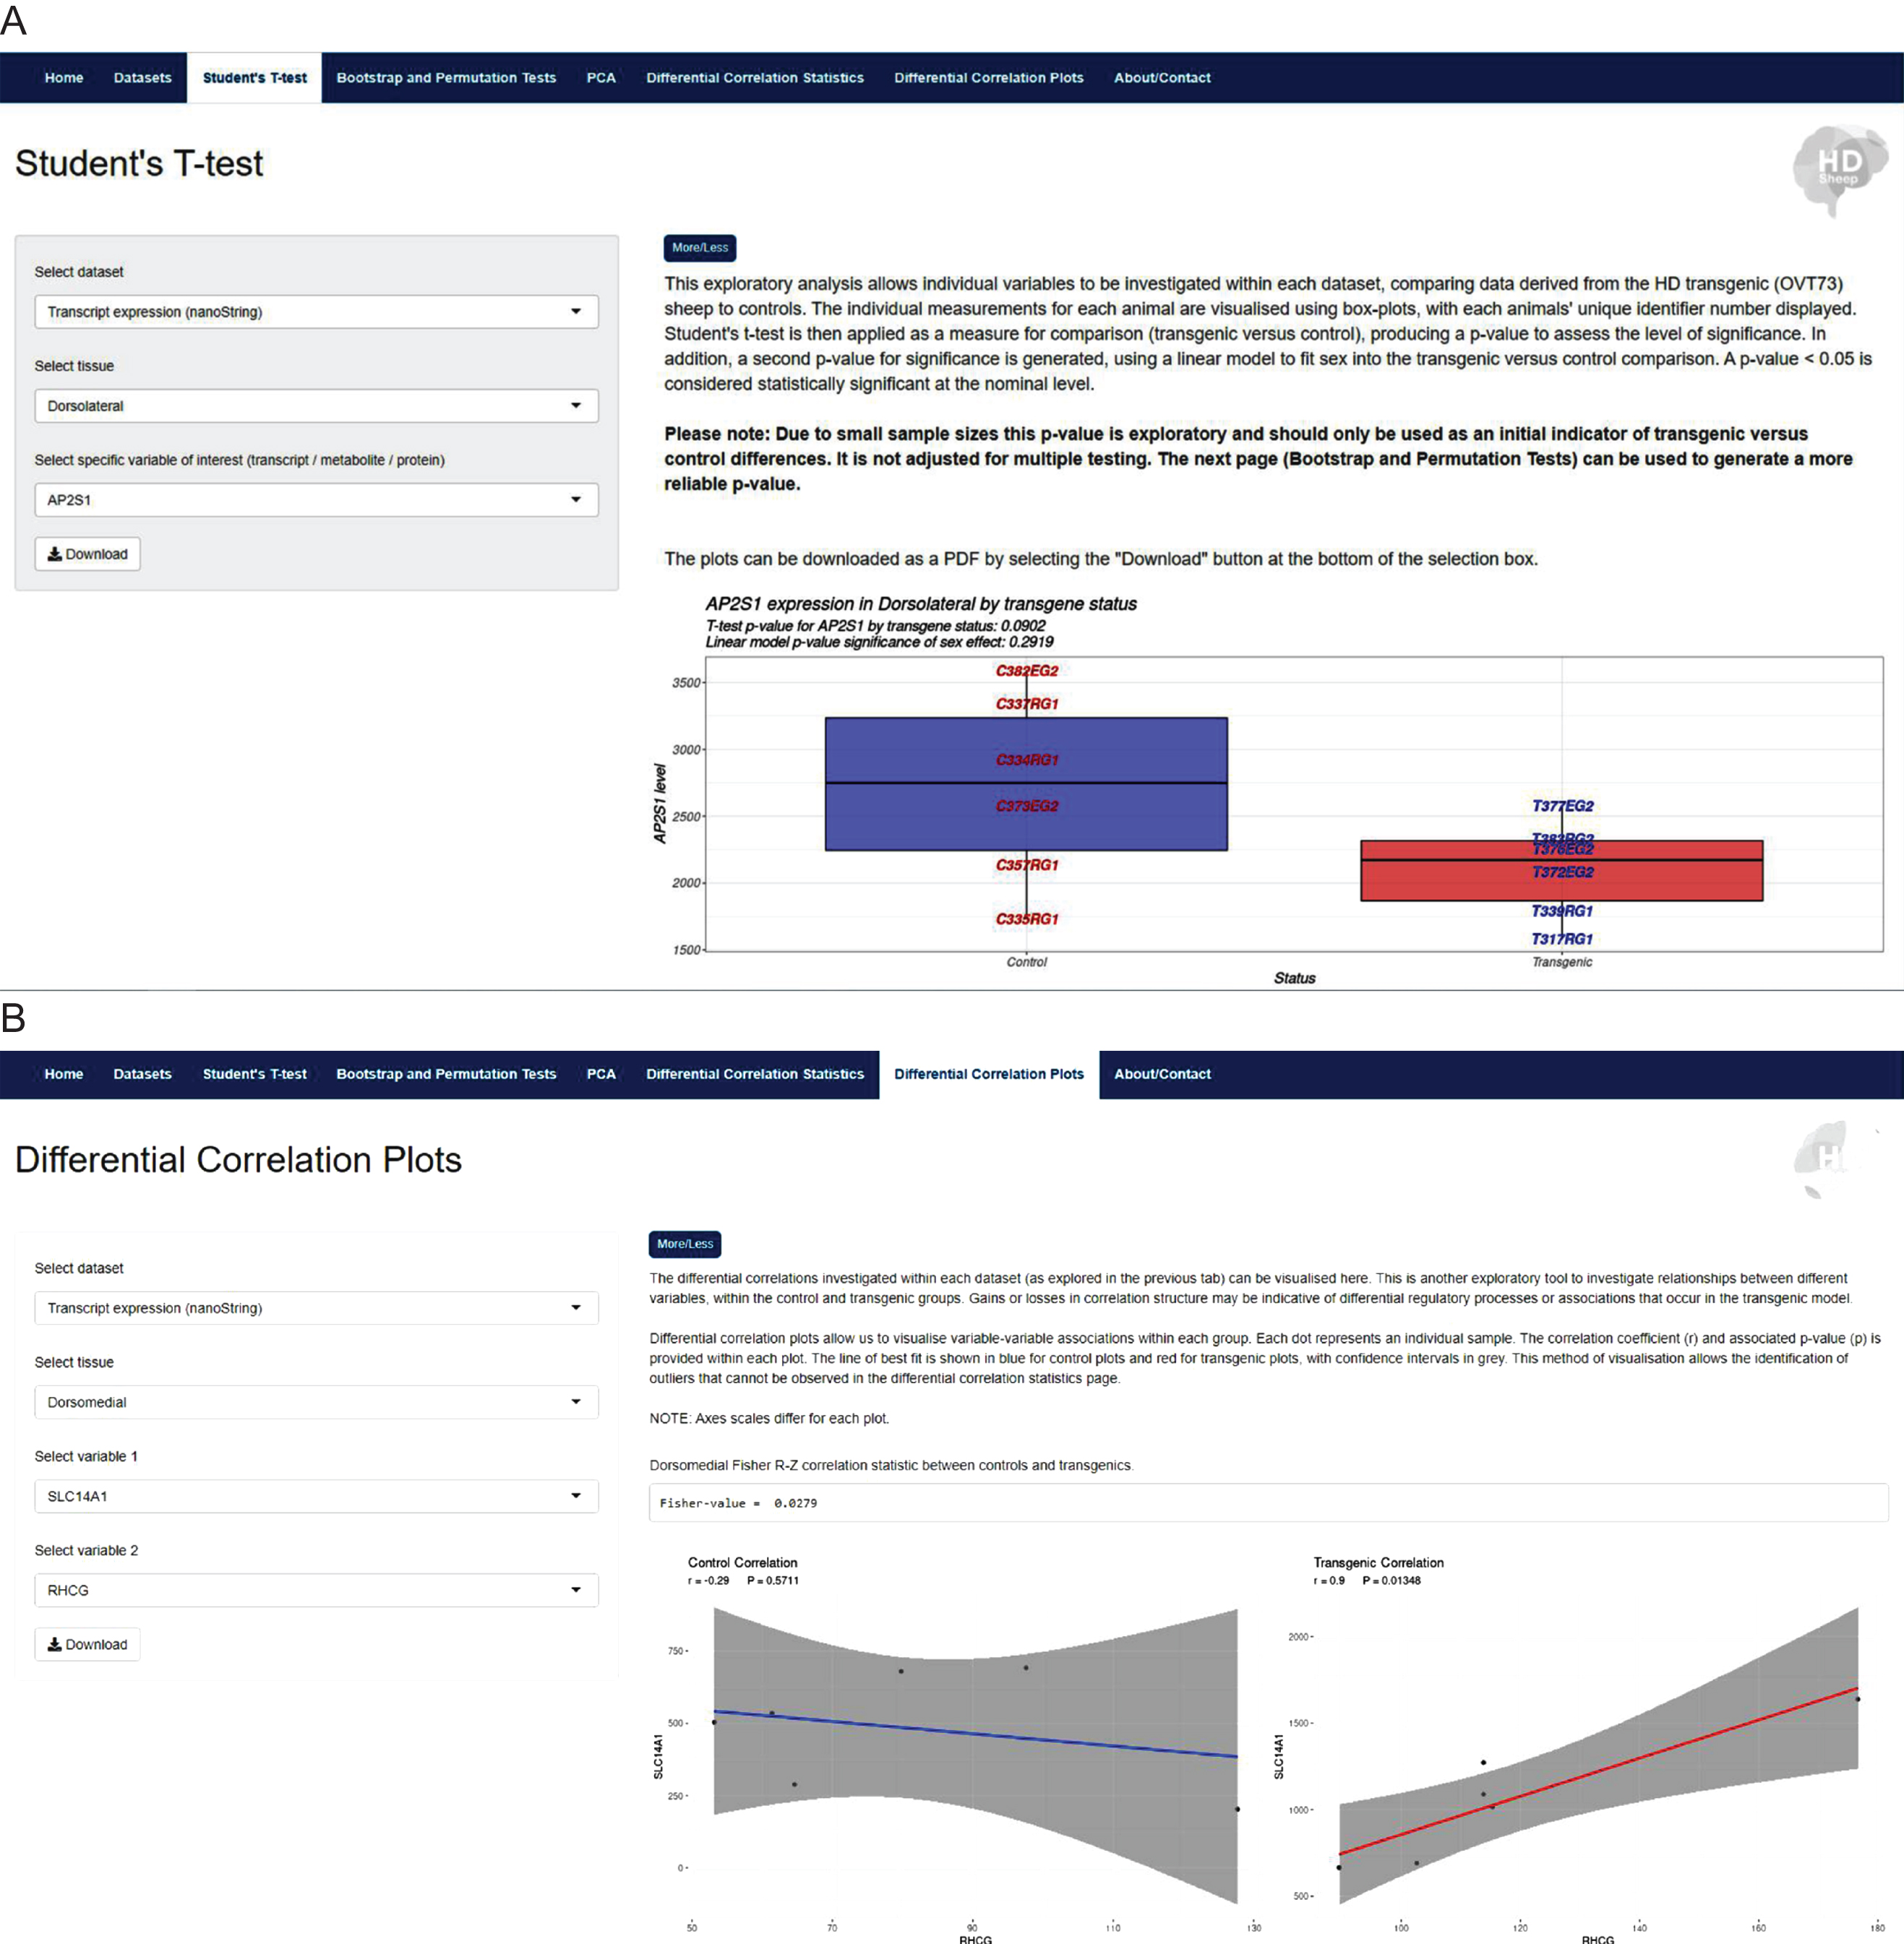
Each ‘Analysis’ tab presents a basic statistical tool that allows selected data comparisons between OVT73 and control samples. These analyses include: student’s t-test, bootstrap and permutation tests, principle component analyses and differential correlation analyses, each with refined visualisation outputs for interpretation of the results. The structure of the website allows researchers to query user-specified variables and tissues of interest, producing outputs for interpretation. An example of the website interface highlighting two ‘Analysis’ tabs is shown in Fig. 4. The outputs from each analysis can be downloaded as PDF or CSV files for simplicity of use.
Fig. 4
The HD sheep database https://hdsheep.cer.auckland.ac.nz/. Examples of two analyses tabs within the HD sheep database: A) Student’s T-test and B) Differential correlation plots. These analyses can be used to investigate data in a query-based manner, comparing OVT73 sheep to controls, with variable selection. Results are displayed as informative graphical outputs for interpretation by the researcher. A shows a significant difference in OVT73 vs. control SLC14A1 expression in the dorsomedial striatal tissue (p < 0.007). B shows differential correlation structures in OVT73 vs. control for SLC14A1 and RHCG transcript expression in dorsomedial striatal tissue.
Due to the computationally demanding analysis that is implemented in some of the functions on the website, the more complex datasets have been reduced in size. This includes the three proteomics datasets, the striatum RNA-Seq and striatal neurone RNA-Seq datasets. The full datasets can be downloaded from the website. These datasets (Ref. data 1, 3, and 6) were partitioned based on the individual OVT73 versus control statistical significance to include the comparisons unadjusted T-test: p < 0.05 threshold. However, to continue our ethos of data sharing, all the raw datasets can be downloaded for user defined analyses.
DISCUSSION
In this report we describe the integration of multiple molecular datasets collected from a single cohort of 5-year-old OVT73 and control sheep and make the resulting multi-omic platform publicly available as a queryable web-based database. OVT73 is a unique large animal model that expresses full-length HTT cDNA with a pure CAG repeat expansion of 69 units (and 73 unit total polyglutamine tract encoded) that captures outcomes of an early disease process also observed in HD. In the database the statistical significance of molecular variables can be assessed, comparing OVT73 to control, and relationships in the data explored. In particular, our ‘association by correlation’ approach using differential correlation analysis allows us to investigate potential regulatory associations between variables within each data set. This can be especially insightful when comparisons are made between transgenic OVT73 sheep and controls. We also demonstrate how packages and functions implemented in the programming language R can be used to perform multivariate analyses and display complex results in meaningful ways for interpretation. The selection of examples presented from the database analysis tabs gives an overview of how the data can be investigated. We also make the raw datasets available for download, so the researcher can conduct their own analyses.
A potential avenue for further research is to analyse this HD transgenic sheep data using high dimensionality multi-omic approaches (expanding upon the association by correlation method presented here). For example, a multi-omic approach has previously been used to investigate HD in a mouse model system [21], revealing highly correlated gene clusters that are associated with proteins, in addition to CAG repeat length. This mouse database is accessible via https://www.hdinhd.org/, which serves as a portal for the sharing of other HD datasets to facilitate HD research.
Due to the inclusion of control sheep, the online database may also find wider applications for sheep research. To our knowledge this is the first publicly available database for South Australian Merino (or any sheep breed), containing multi-omic biological data from multiple tissues, and therefore has the potential to enhance our understanding of any biological process in sheep.
Other publicly available HD databases include Enroll-HD: a worldwide longitudinal observational study of HD patients [22] and HDNetDB: a molecular interaction database for network-oriented investigations into HD using data from human, mouse, fly worm and yeast [23]. The existence of these databases demonstrates the increasing need for a systems’ approach to understand the complexity of HD in the research community, which the sheep database now contributes to.
Acknowledging that the study sample population is relatively small (OVT73 = 6, control = 6), we consider that the greatest value of the OVT73 database will be realised through its use by HD researchers as a hypothesis generator, or for comparative analyses further investigating the researchers own hypotheses. Importantly, we have a range of tissue samples from this cohort that are available for further investigation upon request.
In summary, our HD transgenic sheep database is the first publicly-accessible, interactive database consisting of multi-omic data from a large animal model of HD. The database bridges the genetic gap between open-source HD mouse model and human data, providing additional depth and complexity of HD data for comparative molecular investigation.
ACKNOWLEDGMENTS
This project was initiated and supported through the generosity of the Freemasons Foundation and Freemasons of New Zealand. This work also was funded by CHDI Foundation, Inc., a non-profit biomedical research organization exclusively dedicated to developing therapeutics that will substantially improve the lives of HD-affected individuals. Generous support for this work was also provided by Brain Research New Zealand (BRNZ). Proteomics data acquisition was supported by the NIHR Manchester Biomedical Research Centre.
CONFLICT OF INTEREST
JFG is a Scientific Advisory Board member and has a financial interest in Triplet Therapeutics, Inc. His NIH-funded project is using genetic and genomic approaches to uncover other genes that significantly influence when diagnosable symptoms emerge and how rapidly they worsen in Huntington’s disease. The company is developing new therapeutic approaches to address triplet repeat disorders such Huntington’s disease, myotonic dystrophy, and spinocerebellar ataxias. His interests were reviewed and are managed by Massachusetts General Hospital and Partners HealthCare in accordance with their conflict of interest policies. JFG has also acted as a consultant for Wave Life Sciences USA, Inc.
SUPPLEMENTARY MATERIAL
[1] The supplementary material is available in the electronic version of this article: https://dx.doi.org/10.3233/JHD-210482.
REFERENCES
[1] | HDCRG. A novel gene containing a trinucleotide repeat that is expanded and unstable on Huntington’s disease chromosomes. The Huntington’s Disease Collaborative Research Group. Cell. (1993) ;72: (6):971–83. doi: 10.1016/0092-8674(93)90585-E |
[2] | Andrew SE , Goldberg YP , Kremer B , Telenius H , Theilmann J , Adam S , et al. The relationship between trinucleotide (CAG) repeat length and clinical features of Huntington’s disease. Nat Genet. (1993) ;4: (4):398–403. doi: 10.1038/ng0893-398 |
[3] | Duyao M , Ambrose C , Myers R , Novelletto A , Persichetti F , Frontali M , et al. Trinucleotide repeat length instability and age of onset in Huntington’s disease. Nat Genet. (1993) ;4: (4):387–92. doi: 10.1038/ng0893-387 |
[4] | Snell RG , MacMillan JC , Cheadle JP , Fenton I , Lazarou LP , Davies P , et al. Relationship between trinucleotide repeat expansion and phenotypic variation in Huntington’s disease. Nat Genet. (1993) ;4: (4):393–7. doi: 10.1038/ng0893-393 |
[5] | Menalled LB , Chesselet MF . Mouse models of Huntington’s disease. Trends Pharmacol Sci. (2002) ;23: (1):32–9. doi: 10.1016/s0165-6147(00)01884-8 |
[6] | Jacobsen JC , Bawden CS , Rudiger SR , McLaughlan CJ , Reid SJ , Waldvogel HJ , et al. An ovine transgenic Huntington’s disease model. Hum Mol Genet. (2010) ;19: (10):1873–82. doi: 10.1093/hmg/ddq063 |
[7] | Huntington’s Disease Sheep Collaborative Research Group. Further molecular characterisation of the OVT73 transgenic sheep model of Huntington’s disease identifies cortical aggregates. J Huntingtons Dis. (2013) ;2: (3):279–95. doi: 10.3233/JHD-130067 |
[8] | Morton AJ , Rudiger SR , Wood NI , Sawiak SJ , Brown GC , McLaughlan CJ , et al. Early and progressive circadian abnormalities in Huntington’s disease sheep are unmasked by social environment. Hum Mol Genet. (2014) ;23: (13):3375–83. doi: 10.1093/hmg/ddu047 |
[9] | Morton AJ . Circadian and sleep disorder in Huntington’s disease. Exp Neurol. (2013) ;243: :34–44. doi: 10.1016/j.expneurol.2012.10.014 |
[10] | Handley RR , Reid SJ , Patassini S , Rudiger SR , Obolonkin V , McLaughlan CJ , et al. Metabolic disruption identified in the Huntington’s disease transgenic sheep model. Sci Rep. (2068) ;6: :20681. doi: 10.1038/srep20681 |
[11] | Skene DJ , Middleton B , Fraser CK , Pennings JL , Kuchel TR , Rudiger SR , et al. Metabolic profiling of presymptomatic Huntington’s disease sheep reveals novel biomarkers. Sci Rep. (2017) ;7: :43030. doi: 10.1038/srep43030 |
[12] | Underwood BR , Broadhurst D , Dunn WB , Ellis DI , Michell AW , Vacher C , et al. Huntington disease patients and transgenic mice have similar pro-catabolic serum metabolite profiles. Brain. (2006) ;129: (Pt 4):877–86. doi: 10.1093/brain/awl027 |
[13] | Handley RR , Reid SJ , Brauning R , Maclean P , Mears ER , Fourie I , et al. Brain urea increase is an early Huntington’s disease pathogenic event observed in a prodromal transgenic sheep model and HD cases. Proc Natl Acad Sci U S A. (2017) ;114: (52):E11293–E302. doi: 10.1073/pnas.1711243115 |
[14] | Hodges A , Strand AD , Aragaki AK , Kuhn A , Sengstag T , Hughes G , et al. Regional and cellular gene expression changes in human Huntington’s disease brain. Hum Mol Genet. (2006) ;15: (6):965–77. doi: 10.1093/hmg/ddl013 |
[15] | Patassini S , Begley P , Reid SJ , Xu J , Church SJ , Curtis M , et al. Identification of elevated urea as a severe, ubiquitous metabolic defect in the brain of patients with Huntington’s disease. Biochem Biophys Res Commun. (2015) ;468: (1-2):161–6. doi: 10.1016/j.bbrc.2015.10.140 |
[16] | Chiang C , Jacobsen JC , Ernst C , Hanscom C , Heilbut A , Blumenthal I , et al. Complex reorganization and predominant non-homologous repair following chromosomal breakage in karyotypically balanced germline rearrangements and transgenic integration. Nat Genet. (2012) ;44: :390. doi: 10.1038/ng.2202 |
[17] | Patassini S . Discovery and validation of relevant markers of Huntington’s disease progression using a transgenic sheep model. Auckland, New Zealand: The University of Auckland (PhD Thesis); (2014) . |
[18] | Wickham H , Averick M , Bryan J , Chang W , D’Agostino McGowan L , François R , et al. Welcome to the tidyverse. J Open Source Softw. 4: (43):1686. doi: 10.21105/joss.01686 |
[19] | Wickham H . Tidy data. J Stat Softw. (2014) ;59: (10):1–23. doi: 10.18637/jss.v059.i10 |
[20] | RStudio Team. RStudio: Integrated Development Environment for R. Boston, MA: RStudio, Inc.; 2018. Available from: http://www.rstudio.com/ |
[21] | Langfelder P , Cantle JP , Chatzopoulou D , Wang N , Gao F , Al-Ramahi I , et al. Integrated genomics and proteomics define huntingtin CAG length-dependent networks in mice. Nat Neurosci. (2016) ;19: (4):623–33. doi: 10.1038/nn.4256 |
[22] | Enroll-HD. Enroll-HD: A user guide to the clinical datasets and biosamples available from Enroll-HD. CHDI Foundation. 2016;Version 2016-10-R1. |
[23] | Kalathur RKR , Pedro Pinto J , Sahoo B , Chaurasia G , Futschik ME . HDNetDB: A molecular interaction database for network-oriented investigations into Huntington’s disease. Sci Rep. (2017) ;7: (1):5216. doi: 10.1038/s41598-017-05224-0 |
[24] | Xu J , Patassini S , Rustogi N , Riba-Garcia I , Hale BD , Phillips AM , et al. Regional protein expression in human Alzheimer’s brain correlates with disease severity. Commun Biol. (2019) ;2: (1):43. doi: 10.1038/s42003-018-0254-9 |


