
Taming the Huntington’s Disease Proteome: What Have We Learned?
Abstract
Mass spectrometry (MS) is a physical technique used to identify specific chemicals and molecules by precise analysis of their mass and charge; this technology has been adapted for biological sciences applications. Investigators have used MS to identify differential expressions of proteins in Huntington’s disease (HD), to discover Huntingtin (HTT) interacting proteins and to analyze HTT proteoforms. Using systems biology and computational approaches, data from MS screens have been leveraged to find differentially expressed pathways. This review summarizes the data from most of the MS studies done in the HD field in the last 20 years and compares it to the protein data reported before the use of MS technology. The MS results validate early findings in the field such as differential expression of PDE10a and DARPP-32 and identify new changes. We offer a perspective on the MS approach in HD, particularly for identification of disease pathways, the challenges in interpreting data across different studies, and its application to protein studies moving forward.
INTRODUCTION
Huntington’s disease (HD) is a rare neurodegenerative disorder caused by the aberrant expression of mutant HTT protein containing an expanded polyglutamine tract [1]. Researchers have noted the expression of this protein to be highly enriched in the brain relative to other tissues with highest expression in neurons [2–4]. The most remarkable changes found in HD postmortem brain is a selective loss of medium spiny neurons (MSNs) [4], severe atrophy of the caudate nucleus and putamen, and whole brain atrophy that includes cortical gray and white matter also occurs [5, 6]. In laboratory studies before the HD gene was cloned, investigators studied protein changes in postmortem human brain tissue with various techniques such as high performance liquid chromatography (HPLC), gel permeation chromatography, immunofluorescence, and radioimmunoassay. This early research showed that levels of Somatostatin were increased and Met-enkephalin and Substance P were decreased in HD brains [7, 8]. Moreover, the density of N-Methyl-D-aspartate receptors (NMDARs) was reported decreased by around 50%in postmortem HD putamen [9]. After the identification of the HD gene, investigators identified a reduction in the HD striatum in the levels of both Dopamine receptor D1 and Dopamine and cAMP regulated neuronal phosphoprotein (DARPP-32; also commonly found in gene databases as Protein phosphatase 1 regulatory subunit 1B (PP1R1B)) [10]. Neurofilament protein observed by immunofluorescent staining of the cortex showed progressive loss [11].
HTT is now known to have a wide variety of post translational modifications (PTMs). A few of these were found before the widespread use of mass spectrometry (MS) by using immunoblotting techniques. Serine residue 421 (s421) in HTT can be phosphorylated by AKT and by serum- and glucocorticoid-inducible kinase (SGK) [12, 13]; the modification is present in normal physiological conditions of mouse tissue and in human brain tissue [14]. Other phosphorylation sites were identified at S1181 and S1201 [15]. Additionally, investigators found a palmitoylation site at C214 that allows for proper trafficking of the protein in the cell using radiolabeling of metabolic precursors [16] and site-directed point mutations in HTT cDNAs.
In the early 2000s, MS was used to identify Hap40 as part of protein complex with HTT [17]. Zabel et al. used MS techniques to investigate the difference in wild-type and HD proteomes [18]. Following this study, several other investigators performed whole proteome studies in both human and mouse HD models. Many researchers have taken this a step further to investigate the HTT interactome using MS. A great number of known PTMs are thought to occur within the HTT protein including: phosphorylation, sumoylation, acetylation, palmitoylation, ubiquitination, and protease cleavage [19]. MS has been essential to identifying novel PTMs in HTT.
In the last twenty years, MS emerged as an approach in HD research in concert with the availability of numerous cell and animal models of the disease. This attention on high throughput methods to investigate protein changes in HD and the HTT protein itself (Proteomics) was hypothesized to be a way to better understand disease pathogenesis. In addition to gathering data on the levels of numerous proteins, proteomic approaches can reveal complex protein interactions (interactor/interactome data and protein complex formation), as well as attain PTM profiles. Transcriptomic methods such as microarray and mRNAseq are also widely used to identify changes in HD. These studies hold great value for accurately determining the impact of mutant Huntingtin on transcription which is a major site of primary pathology in HD. However, these approaches are not designed to examine the functional complexities of proteins at the cellular level. Protein synthesis and protein turnover, both of which may occur locally at the synapse, are not reflected by transcription (mRNA synthesis) and thus not measured by microarray or RNAseq methods. The impact of synthesis and turnover on protein levels are of interest in neurodegenerative diseases such as HD where altered proteostasis is thought to have a major bearing on cellular function. Both aging and disease can affect proteasomal degradation and autophagic processes hindering clearance of mutant proteins [20]. Furthermore, PTMs often regulate protein function, interactions, or cellular targeting and can only be observed by looking directly at the protein level. Improvements in methods of sample preparation and in sensitivity of instrumentation have created an explosion of protein level data using MS.
In this review, we consider in brief the MS method itself and its application to study of HD over the last 20 years. The studies evaluated were separated into four different groups: proteome studies in HD models (Table 2), proteome studies in CSF from HD patients (Table 3), interactome studies (Table 4), and PTM studies (Table 5). The proteome study group encompasses those that analyzed protein changes from whole tissue or a sub-fraction from any models. The interactome group includes studies in which investigators specifically isolated HTT protein complexes of interest. Finally, the PTM group highlights studies in which MS techniques were used to investigate PTMs of the HTT protein.
Table 2
Proteomic changes identified in HD cell and animal models measured using mass spectrometry
| Paper | Model & age | Tissue preparation | Detection methods | # of proteins “significant” | Differentially expressed pathways. (Top pathways most significant) |
| Agrawal et al. 2019 [36] | - R6/2 (Exon1 of human HTT < 150Q), transgenic mice, 12 weeks | Flash frozen < 5 min after dissection, Cerebral cortical Mitochondrial preparations | 2D SDS-PAGE MALDI-TOF/ TOF MS | 17/386 differentially expressed proteins in R6/2 | N/A |
| -YAC128 (full length human HTT ∼128 polyQ), transgenic mice,15 months | 12/306 differentially expressed protein in YAC128 | ||||
| Chodhurry et al. 2016 [55] | STHdhQ111/Q111 StHdh Q7/Q7 | “Post acetone precipitation” | 2D SDS-PAGE MALDI TOF/TOF MS | 31 proteins – differentially expressed by 2D DIGE | Neuron apoptosis |
| Response to superoxide | |||||
| 2D-DIGE | |||||
| Deschepper et al. 2012 [67] | - Hdhq150 (129SvEv/CD1 crossed with C57BL/6J), knock-in mice, 15 and 18 months - Hdhq92 (129SvEv/CD1 crossed with C57BL/6J), knock-in mice, 10, 12 &18 months | Snap frozen: Striatum, Cortex, Hippocampus and Cerebellum | SELDI TOF->MALDI TOF/TO | Hdhq92: Cytochrome c oxidase subunit VIb isoform 1 (12 months), Cytochrome b-c1 complex subunit 7 (18 months), Hemoglobin subunit ∝ (10 months), Calmodulin (18 &10 months), FK506-binding protein 1A (12 months), Myelin basic protein 14 kDa (12 months), Hemoglobin subunit ∝ (18 months) | KEGG pathway analysis: Alzheimer’s disease Amyotrophic lateral sclerosis Huntington’s disease Nitrogen metabolism Arginine and proline metabolism |
| Hdhq150: 10 kDa heat shock protein (mitochondrial) (15 &18 months), Cytochrome c oxidase subunit VIb isoform 1(18 months), Cytochrome c (18 months), Calmodulin (18 months), Ubiquitin (15 months), Cytochrome c oxidase subunit VIb isoform 1 (15 &18 months), Stathmin (18months) | |||||
| Hosp et al. 2017 [63] | R6/2 (Exon1 of human HTT < 150Q), transgenic mice, 5, 8, &12 weeks | Soluble and insoluble proteome separated from: Striatum, Cortex, Hippocampus and Cerebellum | LC-MS/MS | On the order of 100s of changes identified | PCA analysis/GO enrichment: Regulation of synaptic part |
| Neuron projection | |||||
| Associated with oxidative phosphorylation | |||||
| Langfelder et al. 2016 [39] | Hdh Q175 6 month | Total striatum | LC -MS/MS (MaxLFQ) | 1370 Proteins | N/A (Higher order Networks of RNA data only); see Sapp et al., 2020 [38] for KEGG enrichment analysis of this data |
| Liu et al. 2007 [56] | R6/2 (B6CBA-TgN Hdexon1 | Flash frozen striatum and cortex | LC-MS/MS | N/A | |
| Wt littermate controls | |||||
| McQuade et al. 2014 [37] | Human embryonic stem cells (ESCs) and neurons, NON- isogenic | Lysed using various methods for different cell types | LC MS/MS | Human ESC: 61 upregulated proteins | IPA: Mitochondrial dysfunction Protein ubiquitination pathway Histone 1 Cluster proteins TCA Cycle II (eukaryotic) Glutaryl- CoA Degradation |
| Genea 017 (Q12/Q40) | Neuro differentiated cells | 225 down regulated proteins | |||
| Genea018 (Q17/Q46) | Human Neuro differentiated Cells:136 differentially expressed (I could go through and count how many up and down) | ||||
| Genea020 (Q17/Q48) | |||||
| Genea046 (Q23/Q45) | |||||
| Genea089 (Q19/Q41) | |||||
| Genea090 (Q19/Q46) | |||||
| Genea091 (Q21/Q42) | |||||
| Ratovitski et al. 2016 [66] | Human Brain- superior frontal gyrus | Homogenized in non-ionic buffer | iTRaq | 1211 proteins changed | IPA pathways |
| 12 control | LC-MS/MS | Signaling by Rho family GTPases | |||
| 12 HD | Rho GDI signaling | ||||
| Actin cytoskeleton signaling | |||||
| Mitochondrial dysfunction | |||||
| RhoA signaling | |||||
| Also, Ephirin B signaling, integrin signaling, endocytosis, axonal guidance, PKA signaling, DNA/RNA processing, and protein transport | |||||
| Skotte et al. 2017 [46] | R6/2 (Exon1 of human HTT < 150Q), transgenic mice, 12 weeks | Microdissection: fresh tissue Striatum, cortex, hippocampus, midbrain | LC -MS/MS | 750 increase in HD | IPA pathways: Metabolism of amino acids and derivatives |
| 764 decreased in HD | Synapse function and neurotransmitter homeostasis | ||||
| Divalent metal ion transport | |||||
| Extracellular vesicular exosome | |||||
| Glutamate signaling pathway | |||||
| Sorolla et al. 2008 [42] | Post-mortem Human brain | Frozen on dry ice postmortem delay from 3 -15.2hrs | 2D SDS Page | 11 proteins | N/A – no pathway analysis complete |
| MALDI TOF | GFAP (str), tubulin 1chain (str &cor), Peroxiredoxin 1 (cor), (Peroxiredoxin 6 (str), glutathione peroxidase 1 (str &cor), Glutathione peroxidase 6(str&cor), ∝-crystalin B-Chain (cor), Fructose bisphosphate aldolase C neural (cor), Ferritin light chain (cor), aconitase (str) | ||||
| Sapp et al. 2020 [38] | Q140/Q7 mouse, knock-in 2 &6 months | Synaptosomes from Striatum &Cortex | LC MS/MS | Changed in HD with no gender bias: | KEGG pathway for synaptosomes: |
| Striatum, 6 months, 97 proteins | Parkinson’s disease | ||||
| Striatum, 2 months, 7 proteins | Huntington’s disease | ||||
| Cortex, 6 months 4, proteins | Oxidative phosphorylation | ||||
| Cortex, 2 months 8, proteins | Alzheimer’s disease | ||||
| Non-alcoholic fatty acid liver disease | |||||
| Others, Citrate cycle, Pyruvate metabolism | |||||
| KEGG pathway on Langfelder data set for total striatum: | |||||
| Calcium signaling pathway | |||||
| Amphetamine addiction | |||||
| Rap1 signaling pathway | |||||
| Aldosterone synthesis and secretion | |||||
| Cholinergic synapse | |||||
| Zabel et al. 2002 [18] | R6/2 (Exon1 of Human HTT > 150Q), cba×cb7bl/6 controls transgenic,4, 8, &12 week | specific fractionation for improving 2d gel resolution | 2D large gel electrophoresis ->MALDI TOF MS | Close to Terminal Disease R6/2 Brains Show Exhaustion or Reduced Expression of α1-Antitrypsin and αB-Crystallin, Respectively | N/A |
| HD IPSC consortium 2017 [68] | Neuronal stem cells Q33, Q60, Q109 control and HD IPSCs | Total cell lysates | LC MS/MS | 356 upregulated | Cell cycle, Axonal guidance, Neuronal development 2 more?? |
| 191 down regulated | Connective tissue disorders, genetic disorder, dermatological disease and conditions | ||||
| Cellular growth and proliferation, Cellular assembly and organization, cellular function and maintenance |
2D, 2 dimensional; DIGE, differential gel electrophoresis; HTT, Huntingtin; HD, Huntington’s disease; IPA, Ingenuity Pathway Analysis, KEGG, Kyoto Encyclopedia of Genes and Genomes; LC, liquid chromatography; MALDI, matrix assisted laser desorption/ionization: MaxLFQ, label-free quantification by delayed normalization and maximal peptide ratio extraction; MS, mass spectrometry; N/A, not available; SELDI, surface enhanced laser desorption/ionization; TOF, time of flight.
Table 3
Proteomic changes identified between control and HD patient cerebral spinal fluid (CSF) identified by mass spectrometry
| Paper | Cohort size and disease status (as reported in publication) | Average age and CAG repeats | Detection methods | # of proteins “significant” | Implicated functions |
| Fang et al. 2009 [60] | 10 controls | N/A | 1D &2D gel, LC Ion trap | 20 most increased and 20 most decreased reported of hundreds | Neurodegeneration Microgliosis Astrogliosis |
| 10 HD gene-positive Early stage | Instruments: HCT-Ultra, LTQ-FT, LTQ OrbiTrap XL | Top5 increased: SERPINC1, APOH, FGG, PGLYRP2, APOA4 | |||
| 10 HD gene-positive Midstage | Data obtained and compiled across 5 laboratories each using different methods | Top 5 decreased: EPHA4, CHGB, TTR, SIAE, MEGF8 | |||
| Huang et al. 2011 [61] | 6 Controls | Controls: 45.863.0 (26– 64) y | 2D SDS-PAGE MALDI-TOF MS/MS | Upregulated in HD: prothrombin, Apo A-IV (APOA4), and haptoglobin | Inflammation |
| 6 HD patients | HD: 43.463.4 (25– 57) y | Hypothalamic activity | |||
| Average CAG repeats: 46.162.3 (41– 62) | Antioxidant activity | ||||
| Niemela et al. 2020 [62] | 38 Controls | N/A | NanoLC-MS/MS | Upregulated in HD: 26 proteins | IPA pathway enrichment |
| 13 HD preManifest | After depletion of over-abundant proteins | Downregulated in HD: 12 downregulated | Clathrin-mediated endocytosis signaling | ||
| 12 HD manifest | Top5 increased: AEBP1, LTBP4, APOA4, PRELP; MST161, SORCS3 | LXR/RXR activation | |||
| Top 5 decreased: SPARCL1, SEZ6, CLSTN1, ALCAM, NELL2, PENK | FXR/RXR activation | ||||
| Atherosclerosis signaling | |||||
| Coagulation system |
Table 4
Huntington associated proteins identified by mass spectrometry
| Paper | Species/model | Tissue preparation | Isolation method | Detection methods | # of differentially interacting proteins | Pathway analysis of differentially interacting protein |
| Culver et al. 2012 [77] | FQ7Q7 vs FQ140/Q7 knock-in mice, postnatal day 15 | Fresh brain lysates, Post nuclear supernatant | FLAG tagged M2 antibody | LC- MS/MS | N/A | GO: |
| Translational initiation (14 fold enrich.) | ||||||
| Ribosomal (18 fold enrich.) | ||||||
| RNA binding (12 fold enrichment) | ||||||
| Nucleic acid binding | ||||||
| Cytoskeletal regulation by rho GTPase | ||||||
| Kaltenbach et al. 2007 [73] | Human brain Mouse brain Human cells: HEK 293, M17 neuroblastoma, HeLa | Co-affinity purification using GST-HTT N terminal fragments incubated with brain tissue and cell lysates | (GST-HTT N terminal fragments) affinity pulldown | MALDI MS/MS | 145 proteins | Manual annotation to pathways; no enrichment analysis |
| Highlighted pathways: | ||||||
| Mitochondrial energy metabolism | ||||||
| Vesicle trafficking | ||||||
| Axonal transport | ||||||
| Ubiquitin mediated proteolysis | ||||||
| Synapse | ||||||
| Ratovitski et al. 2012 [75] | Human stem cells, transgenic cells Q20/Q20 vs Q50/Q50 | Purification of HTT complexes using “interplay mammalian TAP system kit” | 586 aa HTT fragment generated by caspase 6 (N586) | LC MS/MS | 349 proteins | IPA: |
| Mitochondrial dysfunction | ||||||
| Oxidative phosphorylation | ||||||
| Purine metabolism | ||||||
| Estrogen receptor signaling | ||||||
| Regulation of eIF4 and p7056K signaling | ||||||
| Shirasaki et al. 2012 [76] | BACHD 97Q, full-length human HTT transgenic mice 2 &12 week | Fresh brain lysates | Immunoprecipitation using monoclonal antibody clone: (HDB4E10) | Nano LC-MS/MS | 747 HTT associating proteins analyzed | IPA: |
| 14-3-3 signaling | ||||||
| Mitochondrial dysfunction | ||||||
| Axonal guidance | ||||||
| Oxidative phosphorylation | ||||||
| IL-1 signaling | ||||||
| Protein Kinase A signaling | ||||||
| Creb Signaling in Neurons | ||||||
| Weighted Gene Correlation Network Analysis (WGCNA) | ||||||
| Yao et al. 2014 [74]* | Wild-type mouse Black 6 background: Mouse brain | Synaptosomes | Reversible crosslinking followed by Affinity purification using Mab2166 | LC -MS | Identified presynaptic binding partners: Basson, Piccolo/Aczonin and Ahnak | N/A |
*Yao et al is a study classifying Htt interaction in WT mice. GO, gene ontology; HTT or Htt, Huntingtin (as reported in original paper); HD, Huntington’s disease; IPA, Ingenuity Pathway Analysis, KEGG, Kyoto Encyclopedia of Genes and Genomes; LC, liquid chromatography; MALDI, matrix assisted laser desorption/ionization; MS, mass spectrometry; N/A, not available; Q, glutamine; TOF, time of flight.
Table 5
Mass spectrometry analysis of HTT post translational modifications
| Paper | Model | Tissue preparation | Detection methods | Major findings |
| Jeong et al. 2009 [79] | Transfected Cos-7 cells with aa1–480 of HTT, 68Q | HTT 480-68Q Immunoprecipitated from Cos-7 cells using anti-HTT MAb5492 | Tandem MS -> LC MS/MS | Mutant HTT is acylated at K444 -> confirmed via western blot |
| Ratovitski et al. 2012 [75] | - Neuronal progenitor cells STHdh transfected w/ full length HTT | HTT Immunoprecipitation and subcellular fractionation | Tandem Mass spectrometry MS/MS | Novel lysine acetylation sites 23 PTM site in human brain tissue |
| - Human brain | ||||
| Schilling et al. 2006 [78] | 293T and PC12 cells transfected w/ myc-tagged full length HTT with Q23 &Q148 | Post-nuclear supernatant | MALDI MS peptide mass fingerprinting (PMF) and nano-HPLC-ESI-MS, MS/MS) | Identification of phosphorylation sites (6 novel) in HTT: |
| MALDI MS/MS with on-target phosphatase and protease treatment | aa421, aa533/5/6, aa1181, aa1201, aa2076, aa2653, aa2657 | |||
| Thompson et al. 2009 [81] | ST14A transfected w/ | Post-nuclear supernatant | LC MS/MS | S13 and S16 can be phosphorylated Acetylation at K9 |
| -Htt25Qp-HBH+IKK-aby | ||||
| -Htt25Qp-HBH + CBP + IKK-b (Exon1 of Human HTT with C-terminal HBH tag) |
MASS SPECTROMETRY HOW DOES IT ALL WORK?
MS is a chemistry technique that has existed for over a century; however, proteins were not commonly analyzed until more modern ionization methods such as Electrospray Ionization (ESI) and Matrix-Assisted Desorption/Ionization (MALDI) became available. The development and application of these methods were originally implemented by John Fenn and Koichi Tanaka for ESI and MALDI, respectively. In recognition of their innovative technologies each of them was awarded a portion of the 2002 Nobel prize in chemistry [21, 22].
MS is an analytical tool that is used to measure mass to charge (m/z) ratios of molecules. The results are usually displayed as a mass spectrum (Fig. 1) which is a plot of intensity as a function of mass/charge (m/z) ratio. The masses are measured in terms of unified mass units which are better known as Daltons (da). These mass/charge (m/z) ratios can be compared to a database of known values to provide identity to each of the spectral peaks (Table 1). The database used depends on the input sample and moiety being measured (protein versus lipid versus small anolyte, etcetera).
Fig. 1
Determining peptide composition using mass references values. This graph shows an example mass spectrum with intensity graphed on the y-axis and Mass/Charge (m/z) ratio graphed on the x-axis. In this case the first 3 amino acids of the HTT protein, methionine, alanine, and threonine are deducted from the graph by determining the change in mass between each peak and referring to Table 1. Charted here is the first three amino acids of the HTT peptide (MATLEKLMKA . . .).
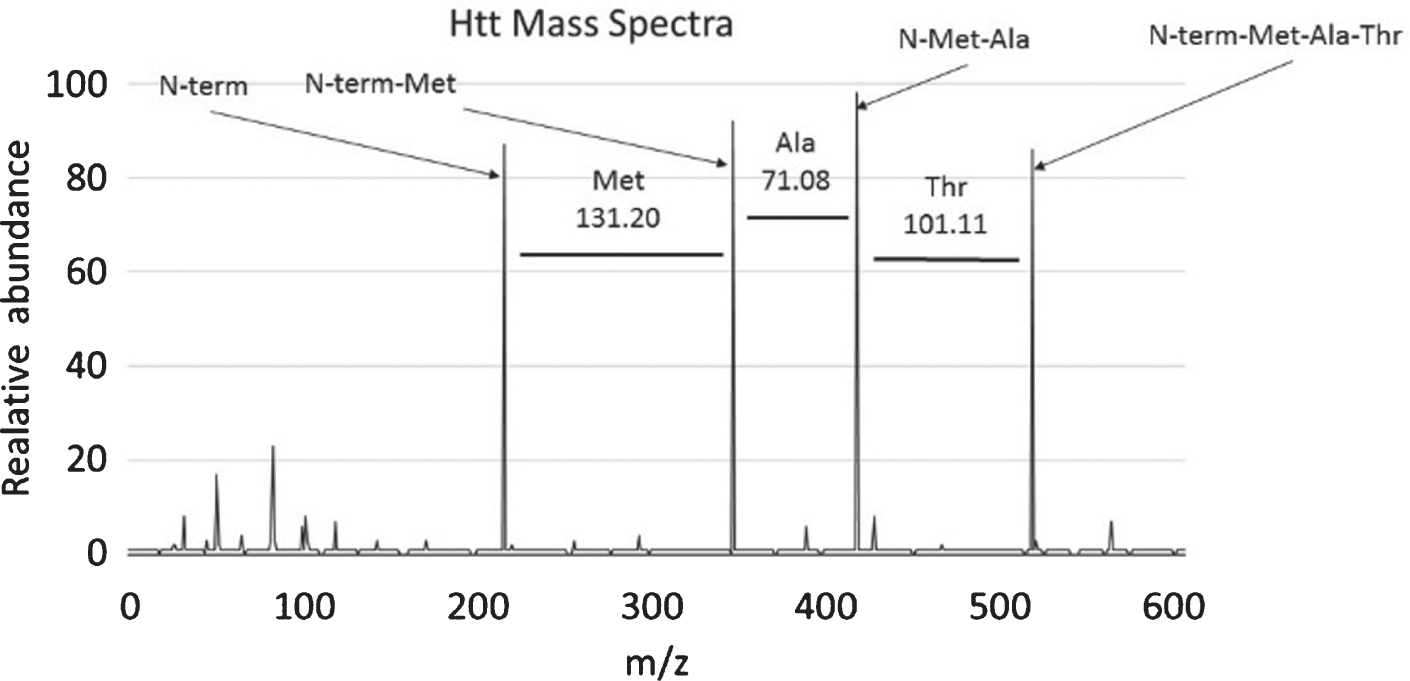
Table 1
The reference values for mass of the twenty amino acids with their abbreviations and chemical formulas
| Amino acid | 3-letter code | Residue mass | Formula |
| Alanine | Ala | 71.03711 | C3H5NO |
| Arginine | Arg | 156.10111 | C6H12N4O |
| Asparagine | Asn | 114.04293 | C4H6N2O2 |
| Aspartic acid | Asp | 115.02694 | C4H5NO3 |
| Cysteine | Cys | 103.00919 | C3H5NOS |
| Glutamic acid | Glu | 129.04259 | C5H7NO3 |
| Glutamine | Gln | 128.05858 | C5H8N2O2 |
| Glycine | Gly | 57.0146 | C2H3NO |
| Histadine | His | 137.05891 | C6H7N3O |
| Isoleucine | Ile | 113.05891 | C6H11NO |
| Leucine | Leu | 113.08406 | C6H11NO |
| Lysine | Lys | 128.09496 | C6H12N2O |
| Methionine | Met | 131.04049 | C5H9NOS |
| Phenylalanine | Phe | 147.06841 | C9H9NO |
| Proline | Pro | 97.05276 | C5H7NO |
| Serine | Ser | 87.03203 | C3H5N2O |
| Threonine | Thr | 101.04768 | C4H7N2O |
| Trytophan | Trp | 186.07931 | C11H10N2O |
| Tyrosine | Tyr | 163.06333 | C9H9NO2 |
| Valine | Val | 99.06841 | C5H9NO |
While MS is a very accurate and powerful tool, it has trouble analyzing complex mixtures. MS methods can be combined with liquid chromatography (LC) methods which separate complex mixtures first. LC is commonly paired with ESI-MS in series, which allows for analysis of more complex mixtures with higher specificity than traditional LC. LC’s increased popularity is also attributable to the broad range of molecules such as metabolites and lipids that can be analyzed by this method. Improved sensitivity and resolution has occurred in recent years which in turn allows for detection and correct identification of low level proteins. Furthermore, increased scan speed of instruments enables identification of hundreds of proteins in a reasonable amount of time (reviewed by Iwamoto and Shimada [23]). Consequently, screening of large numbers of proteins from small biological samples can be accomplished.
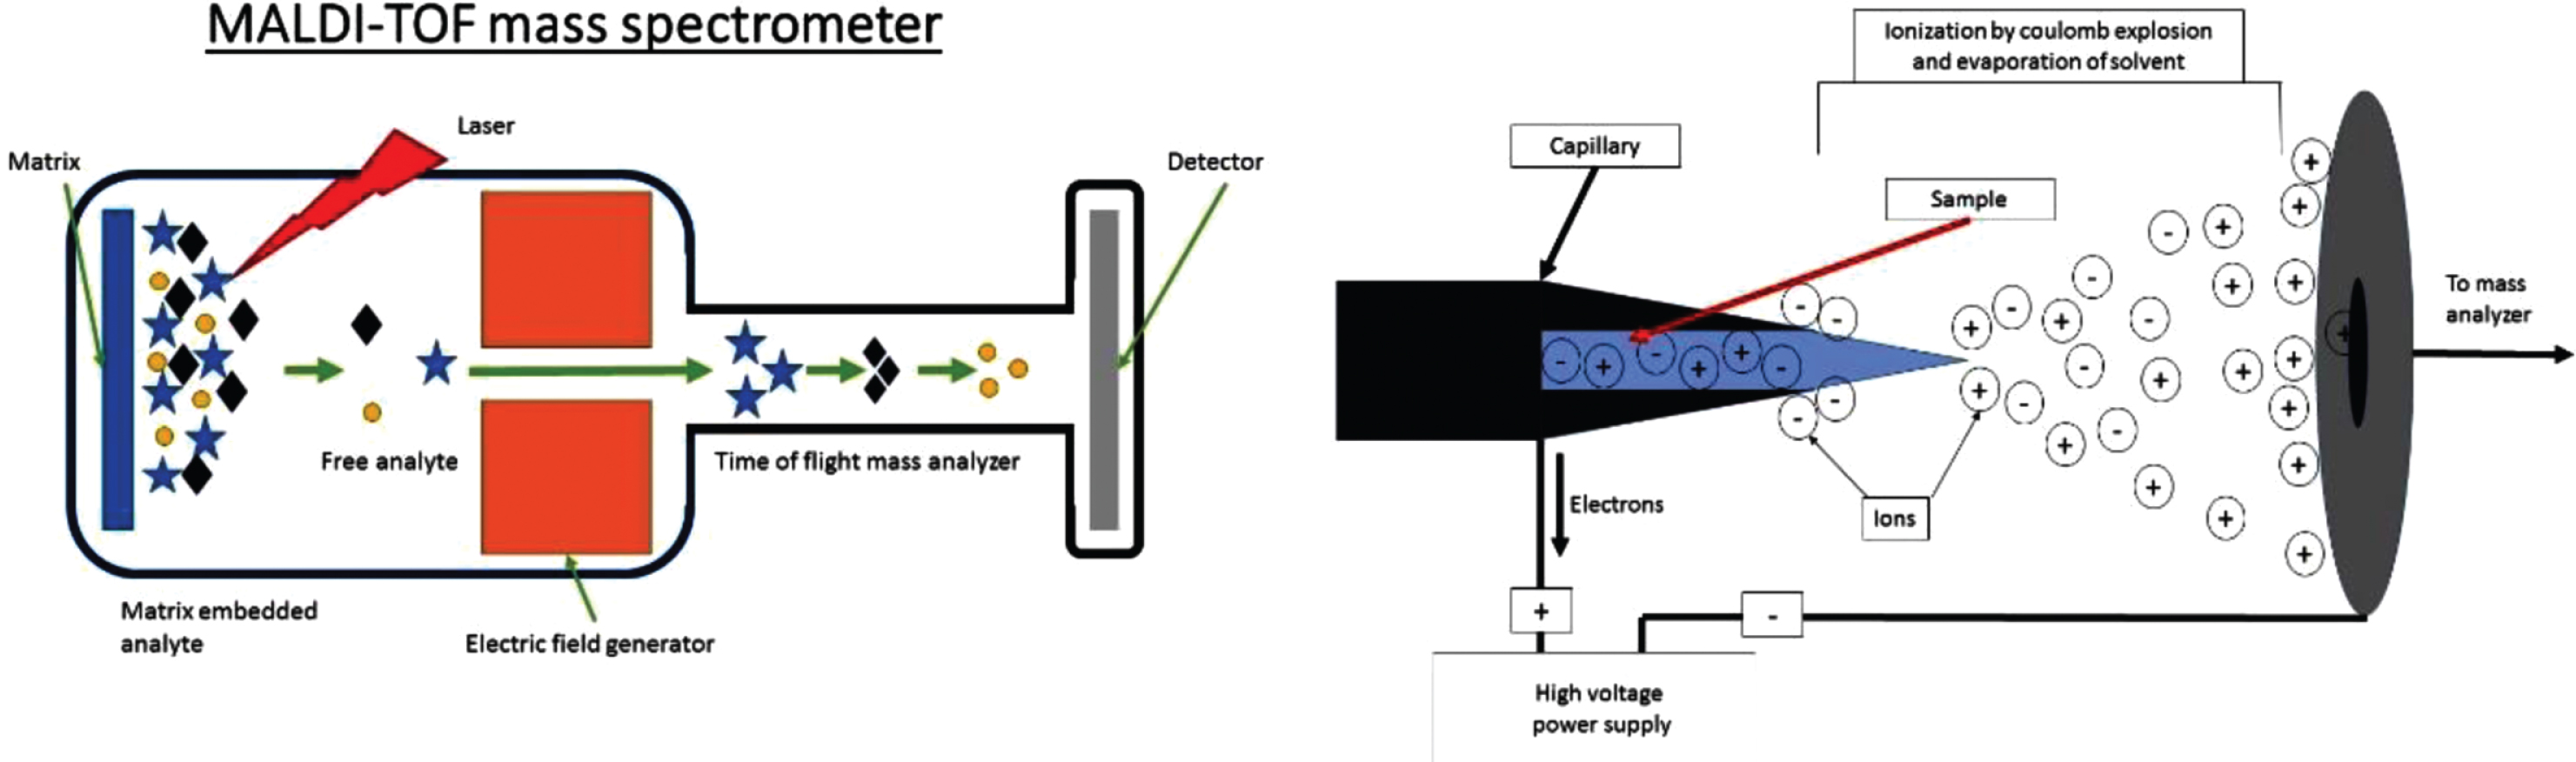
All mass spectrometers consist of three core components: an ionization source, a mass analyzer, and an ion detector (Fig. 2). The ionization source is used to convert the sample into ions. There are a variety of ionization techniques that can be used for different samples types. The ions are then sorted and separated based on mass by the mass analyzer. This signal is generally measured as an induced charge or current produced as the molecule interacts with the detector. The results are expressed as m/z ratios plotted on the x-axis and their intensity/relative abundance plotted on the y-axis (Fig. 1). This allows for cross referencing with known values to determine the identity of the peptide sequence.
MS investigations vary greatly in methodology to answer specific questions. The two commonly used techniques for ionization of input materials for MS have improved analysis of proteins. These are MALDI-TOF (time of flight) [22] and ESI [21]. In MALDI samples are embedded in an organic matrix that functions to reduce aggregation. The matrix is then pulsed with a laser to absorb energy. This vaporizes and ionizes the matrix and analytes that it contains [24] (Fig. 2A). In ESI, fluid is electrostatically sprayed from a capillary to produce small droplets (Fig. 2B). These droplets are further reduced by evaporation followed by successive Coulomb explosions: These explosions occur because of coulomb repulsion overcoming the surface tension forces of a droplet allowing for dissociation. This occurs until droplets contain a single macromolecule [25].
Fig. 2
A) Crude schematic of a MALDI TOF MS set up with the three essential components; Ion source, mass analyzer (electric or magnetic field) and a detector. For MALDI the sample is on a solid support. B) Crude schematic of the Ionization chamber of an ESI mass spectrometer. The sample enters the chamber as a liquid through a capillary. The sample is then aerosolized by the high voltage. Note the charge can be manipulated to select for either positive or negatively charged ions which are sent to mass analyzer and detector as in A.
The type of mass analyzer within an apparatus is also variable, though the same two fundamental equations govern the mass calculations: the Lorentz force law (Equation 1) and Newton’s second law of motion (Equation 2) and the resultant differential equation when equating both the force applied to the ion (Equation 3).
(1)
(2)
(3)
By manipulation of these equations, variables can be held constant in order to solve for mass or charge of ions. With time of flight types potential is held at a constant value and the time it takes for ions to arrive at the detector is measured. Mass analyzers known as “ion traps” trap ions before sequentially ejecting them towards the detector. A commonly used variation of this method used by ThermoFisher is known as the Orbitrap. In this apparatus, ions are trapped in “orbit” around a central electrode. While the ions circle around the electrode, they travel along its long axis. This movement produces an image current which can be related to the m/z charge of individual ions using more complex computational strategies that are beyond the scope of this review.
MS has two different approaches when designing a protein study. The “Top down” approach is used to measure the mass of intact proteins. One of the strengths of this type of investigation is its ability to identify various proteoforms. This includes proteolytic fragments, phosphorylated peptides, ubiquitinated, sumoylated, glycosylated, and other post-translationally modified proteoforms [26]. The top down approach can be a powerful tool for understanding the relationship between proteoform and function. A major disadvantage of the top down approach is the relatively low throughput. These investigations usually focus on a single protein and require a large amount of starting material which can be difficult to obtain from the tissue of interest, especially if the protein is not abundant. For in-depth identification of modifications of a single protein, top down MS analysis is virtually irreplaceable.
The other approach is to use “bottom up proteomics”. This involves the proteolytic digestion of samples prior to analysis by MS to identify numerous peptides/proteins at once (so called “shotgun proteomics”). Usually LC-ESI-MS/MS is used for these studies due to its high throughput rate. These smaller peptides are more uniform and easier to analyze such that there is more accurate identification of the sequences [27]. Digestion of samples is typically achieved using trypsin, resulting in “Tryptic peptides” [28]. The resulting digestions are then analyzed strictly for peptides by MS and related back to a database to map overlapping peptides to proteins of origin based on mass of the 20 mammalian amino acids (Table 1). Almost any biological sample can be studied so long as it can be ionized for MS. To collect information about relative protein amounts in the same MS run, proteins within a sample can be labeled with a unique identifier tag then mixed together with one or more sample(s), each labeled with its own identifier tag, and analyzed together in a single MS run. This technique known as isobaric tandem mass tag (TMT) is often used in proteomic studies and can reduce noise when comparing changes between two samples (genotypes or treatment groups for instance), as well as reduce run times. More accurate methods of quantification, such as MaxLFQ have also been developed for comparing unlabeled mixtures [29].
There are advantages to the “bottom up” proteomics approach in the potential for high proteome coverage and fast scanning rates [30]. The disadvantages could be incomplete protein sequences, the uncertainty from which protein the fragment peptides originated (incorrect annotation), and loss of labile post-translational modifications [30]. Since proteins are digested, no information can be ascertained on native protease cleaved fragments. During computational analysis, protein annotation can be affected by numerous factors such as whether the peptides derived from tryspin digestion are taken into account and the types of methods of filtering data [31, 32]. Sample preparation including methods of organelle fractionation and use of detergents to solubilize material can affect the outcome of MS analysis [33], making it a challenge to compare studies from independent laboratories that have used different techniques.
PTMs can be identified in a bottom up approach by tandem MS (MS/MS or MS2) in which one sample is analyzed for strictly peptides and the other is analyzed for peptides along with their modifications, the deficit of mass and addition of mass to specific signals matched up with data about the mass of modifications allows for knowledge of their presence [34]. Tandem MS can also be used to increase the specificity by sending ions through 2 independent mass analyzers. Not all PTMs will be identified using this method, only stable PTMs that can withstand conditions of MS [35].
PROTEIN EXPRESSION DICTATES PATHWAY ANALYSIS
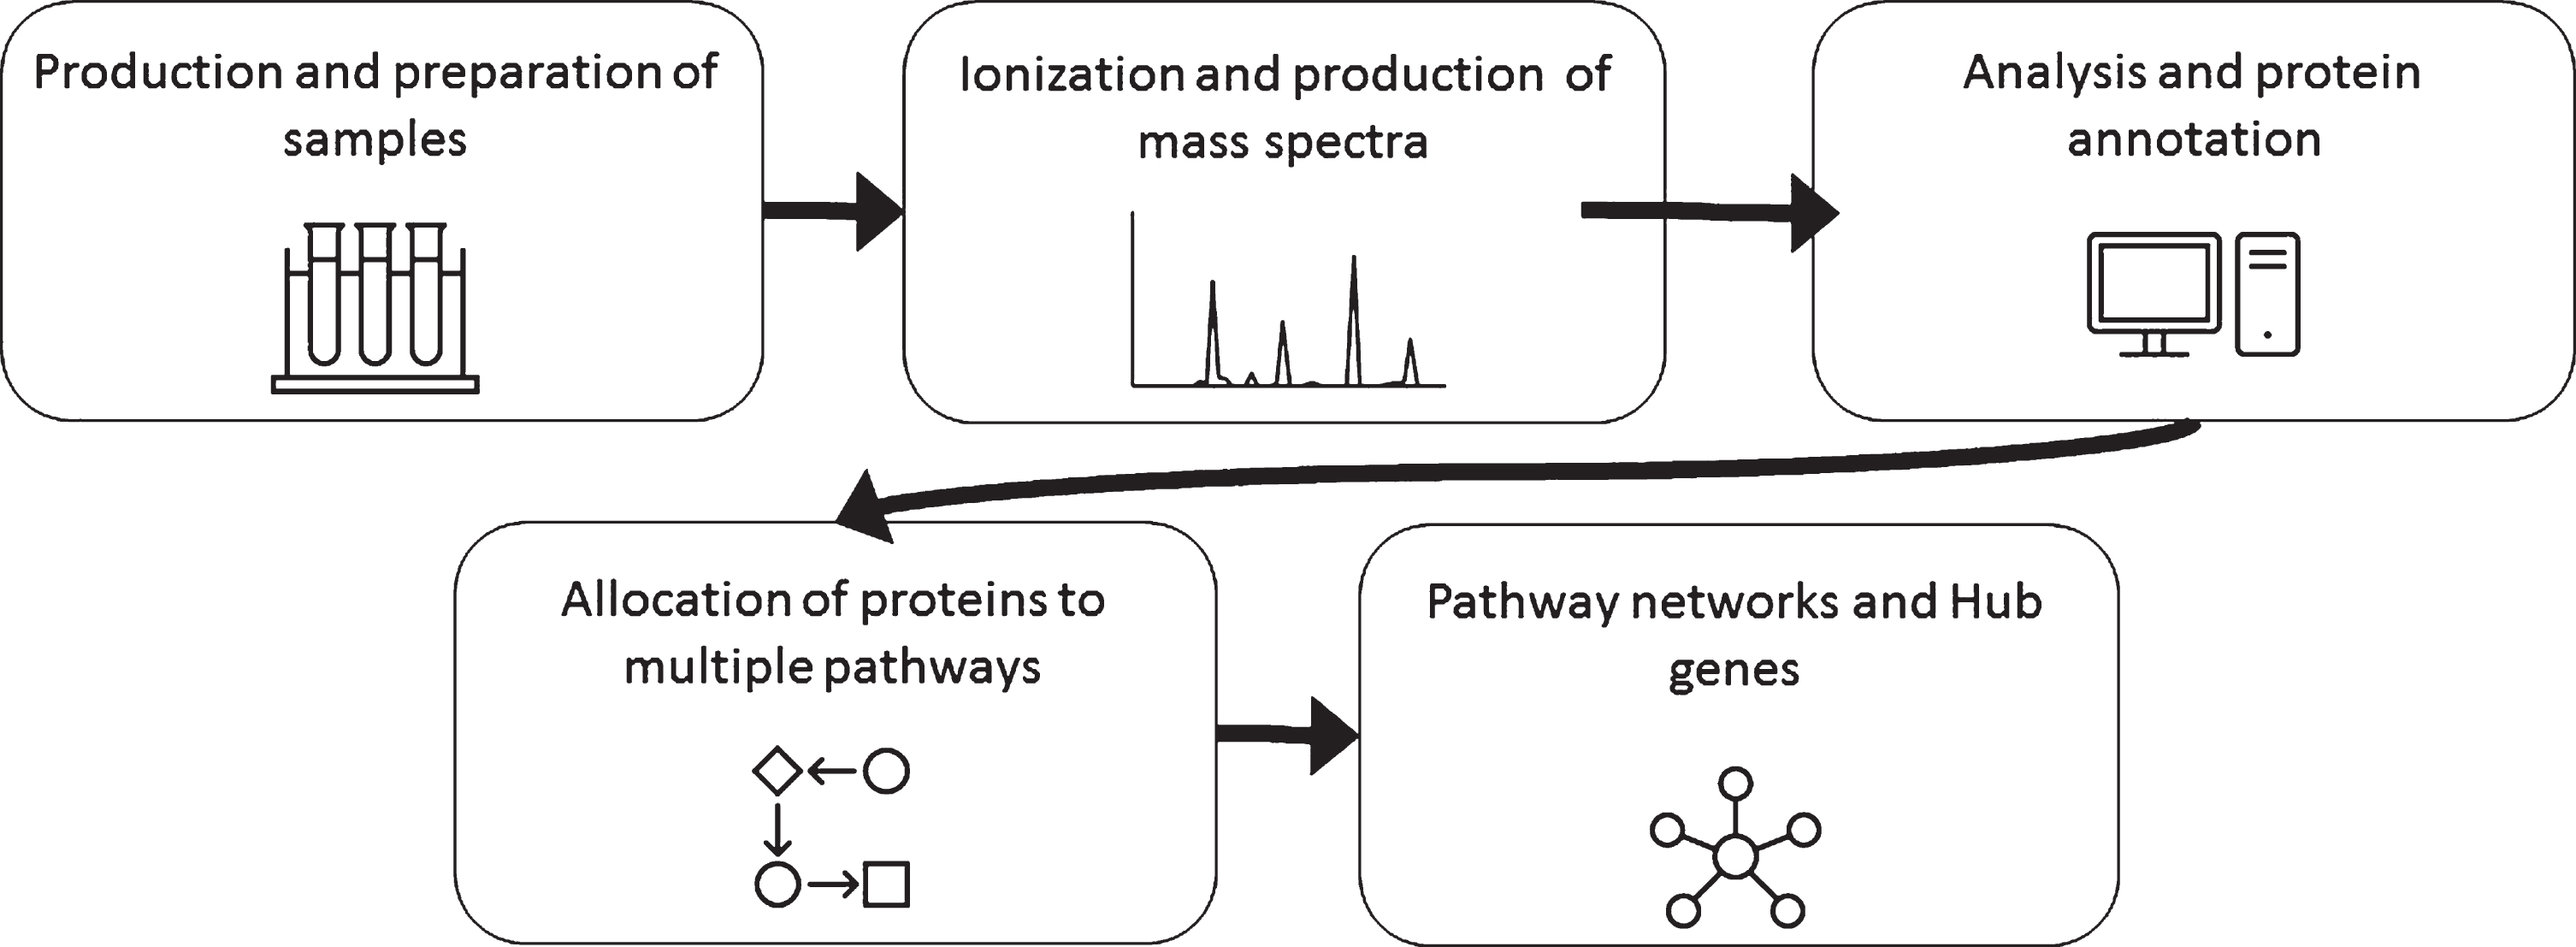
Pathway enrichment analysis is commonly used with “-omics” data including MS proteomics to make sense of the large data sets and numerous differentially expressed proteins. Some of the common pathway analysis software/databases are KEGG (Kyoto encyclopedia of genes and genomes), IPA (Ingenuity Pathway Analysis), and Reactome. As a first step, many people identify the category of the gene/protein using Gene Ontology (GO) terms which give a general label such as “synapse” or “mitochondria” based on cellular location or proposed function without determining enrichment in a pathway. These databases use literature to place specific proteins into pathways and then analyze large data sets to look for statistically significant enrichment or over representation of proteins in specific pathways that are related to mechanisms within the cell. Many of these software packages for pathway analysis stem from genomic data and don’t always translate perfectly to proteomic type data. Both open access and commercially based options are available. For example, KEGG is open access and IPA is a commercial service. This type of analysis can be used to understand the cumulative effect of many simultaneous changes in protein expression on a cell. Though results can be interesting and could steer researchers in the correct direction, pathway analysis can also be vague and misleading due to the incomplete/poor annotation of proteins and pathways. An additional level of complexity can be interrogated using custom algorithms to create higher order networks projected as so-called “hairballs” or Hubs. The general pipeline for sample, analysis and data is shown in Fig. 3.
Fig. 3
General workflow for mass spectrometry analysis of proteins.
PROTEIN CHANGES IN HUMAN POSTMORTEM BRAIN, CSF, AND HD MODELS DETERMINED BY MASS SPECTROMETRY: HD PROTEOME
The HD proteome, which refers to the group of proteins expressed in the presence of mutant HTT, has been analyzed in several ways including the bottom up proteomic approach. Table 2 shows 12 studies completed using MS to analyze the HD proteome in cell and animal models, indicating the HD model used in each analysis, method of cell/tissue preparation, and what type of MS was used. Additionally, Table 2 shows the number of differentially expressed proteins found and any pathway analysis data that was created, if available. One appreciates that no two studies are exactly alike: varied models were used, different tissue preparations were employed, distinct MS methods were used (MALDI, SELDI, LC/ESI) quantification methods very (labeled and unlabeled) and ages of animals differed. Although these investigations produced a plethora of data there is little overlap of proteins and pathways identified. Noteworthy is the confirmation of some MS results with findings from earlier non-MS studies.
Table 2 shows one interesting differentially expressed protein, ATP5A, that was found in four separate studies [36–39]. The differentially reduced expression of ATP5A has not been highlighted in the field of HD. ATP5A provides a catalytic function in the F1 portion of the ATP synthase protein complex which serves an important role of regenerating ATP from ADP by catalyzing the addition of the gamma-phosphate group. The resultant product, ATP, is the main source of energy for the cell and organism. Thus, alteration in protein expression of ATP5A could play a role in the common finding of mitochondrial dysfunction HD. Metabolic dysfunction of mitochondria was described as early as the mid-90s in postmortem human brains [40] and has been attributed to oxidative damage downstream of problems with glucose uptake and glycolysis [41].
Many proteins found as differentially regulated in the MS studies in Table 2 have cell functions previously implicated as dysfunctional in the HD field including Peroxiredoxin-1 (PRDX1), Peroxiredoxin-2 (PRDX2), Peroxiredoxin-3 (PRDX3), Peroxiredoxin-6 (PRDX6), Phosphodiesterase 10a (PDE10a), and DARPP-32 (PP1R1B). The peroxiredoxin proteins are involved with antioxidant activity and can reduce hydrogen peroxide to water. PRDX2 was differentially expressed (reduced) in two of the proteome studies [36, 42]. The other three peroxiredoxin proteins were found only in a single study to be differentially expressed [36, 42]. Peroxiredoxins 2 and 3 were found to be decreased in each of the studies in which they were differentially expressed, whereas peroxiredoxin-6 was increased. Together, these results do suggest that the antioxidant activity of peroxiredoxins is important in HD. Oxidative damage to energy systems is a common theme in HD [41]. Consistent with these findings, at least two studies have used MS to show abnormal oxidation of proteins including α-enolase, γ-enolase (neuron-specific enolase), aconitase, the voltage-dependent anion channel 1, heat shock protein 90, and creatine kinase in R6/2 mice [43] and proteins from synaptosomes including synaptophysin, synapsin 2, syntaxin 1, calmodulin, cytoplasmic actin 2, neurofilament, and tubulin from Q140/Q140 striatum [44]. Thus, boosting antioxidant capacity in HD may be a beneficial therapeutic strategy and numerous agents have shown protection in cell and animal models of HD; however, clinical trials for antioxidants have failed to show therapeutic benefit to HD patients with the exceptions of creatine and Vitamin E which showed limited benefit [45].
MS studies replicated protein changes found by others in the HD field impinging on cAMP regulated pathways: reduced levels of PDE10a were found in three studies (Table 2) [38, 39, 46] and DARPP-32 (PP1R1B) was also reduced in one study [46]. PDE10A is a phosphodiesterase that plays a role in hydrolyzing a cyclic nucleotide to a nucleoside; cAMP is a substrate and it has shown to be lost in pre-symptomatic HD gene carriers [47]. DARPP-32 (PP1R1B) is a phosphoprotein that is enriched in the striatum of the brain and involved in dopaminergic signaling through cAMP [48]. The change in both DARPP-32 and PDE10A suggest downregulation of this cAMP dependent signaling pathway. It is surprising, however, that loss of DARPP-32 is not reported more often in MS studies, since it is consistently found to be lowered in HD mouse striatum using methods such as immunofluorescence and western blot. Indeed, we found decreased DARPP-32 levels by western blot in striatal synaptosomes at 6 months but did not find the corresponding changed level by MS in the exact same synaptosomal preparations despite good detection of DARPP-32 peptides and excellent protein coverage [38]. One might speculate that DARPP-32 either does not undergo efficient proteolysis or is not readily soluble for ionization. However, we identified numerous peptides that mapped across the entire polypeptide for DARPP-32 in our MS study. One possibility is that the antibody to DARPP-32 used for western blot recognizes a modified form of DARPP-32 that is not captured by MS well.
Another interesting protein identified as changed at the protein level by MS and implicated previously in HD is SCN4b ([38, 46] in Table 2). SCN4b encodes an axonal sodium channel auxiliary subunit found in unmyelinated fibers of striatum [49] which is reduced in synaptosomes from Q140/Q7 HD mice measured by MS [38] and in R6/2 striatum [46], has reduced mRNA in human embryonic HD IPSC-derived MSNs [50], and was originally identified as an mRNA downregulated in R6/2 mice as early as 4 weeks [51]. Given the role of SCN4b in regulating neurite outgrowth, cell adhesion and sodium current [49] and the reproducible finding of its loss in early in HD, SCN4b is emerging as an excellent candidate protein which may be responsible for pathological events in HD downstream of transcriptional changes. SCN4b is also downregulated in drug resistant temporal lobe epilepsy and part of a suite of co-expressed genes that include calcium regulate potassium channels [52] and mutations in SCN4B have been linked to atrial fibrillation [53] so there is interest in developing pharmacology around SCN4b. Knock-out of SCN4b in mice showed changes in electrophysiology of medium spiny neurons including reduced resurgent sodium current and lower repetitive firing frequencies and higher rates of failure for post synaptic inhibitory currents [49]. It is not clear if any electrophysiology changes that occur with reduced levels of SCN4b are mirrored in HD, but small early changes might be compensated during development by subtle rewiring which could weaken overall circuitry [54].
Changes across studies also arise for numerous members of the chaperone family, including hsp90 [55, 56] and synaptic proteins [38, 56]. Chaperones are important for normal protein folding and aid to prevent aggregation especially of proteins with regions of hydrophobicity. In HD, changed levels of chaperones has been described with age and swamping of proteolytic degradation has been hypothesized as a mechanism of pathology (reviewed by [57]). We also found a significant decrease at 2 months in striatum of DNAJC16 which is predicted to direct proteins for proteasomal degradation, although client proteins for this chaperone are unknown [38]. Normal and mutant Huntingtin interact with HSP90 and inhibitors of HSP90 promote degradation of both Huntingtins [58]; this would suggest a method of promoting mutant Huntingtin clearance, but pharmacological inhibition of HSP90 is extremely toxic.
Perhaps the most important application of MS is for discovery of potential biomarkers in human CSF and peripheral fluids such as blood and plasma. Table 3 shows three studies completed using MS to analyze the HD proteome in human CSF and summarizes what type of MS was used, the number of differentially expressed proteins found, and pathway analysis data that was created. Currently HTT levels and neurofilament levels in CSF and plasma are being used or investigated in clinical trials [59]. However, while HTT is useful for pharmacodynamics to assess whether HTT lowering compounds are effective, access to numerous biomarkers to determine clinical benefits and/or disease modification have been elusive. One large collaborative study distributed the same control and HD CSF samples to five laboratories for MS analysis using different MS methods then collated the data to obtain increased and decreased proteins [60]. The authors reported considerable variation of results among labs, but published numerous proteins found to be both increased and decreased in HD (see Table 3 for the Top 5 increased and decreased proteins; [60]). A 2011 study by Chen and colleagues showed increased levels of prothrombin, apolipoprotein A-IV (APOA4), and haptoglobin in CSF from a small group of control versus HD patients (Table 3) [61]. Recently, a study using a larger cohort of patients reported changes in proenkephalin (PENK) and transthyretin between manifest and premanifest HD carriers which was confirmed in a second cohort, as well as numerous proteins changed between controls and HD carriers [62]. Interestingly, all three studies found increased APOA4 (Table 3). Of note, none reported changes in neurofilament proteins or HTT levels for which immunoassays have been developed. One study in mice also performed a comparison between mouse CSF and mouse brain from R6/2 mice and reported detection of proteolytic enzymes involved in inflammation [63]; little correlation between soluble protein changes identified in brain could be correlated with changes found in CSF [63], casting doubt on whether many protein changes in CSF reflect changes in brain tissue. More studies on control and HD human CSF are merited. Biomarker discovery in humans is complex, and experts suggest that much larger numbers of patients should be tested to find meaningful results (review by Edina Silajdžić and Maria Björkqvist [64]).
Pathways identified in the HD proteome
We examined the differentially expressed proteins across these proteomic analyses (Table 2) for similarities in pathway enrichment. The results covered a number of diverse pathways such as axonal guidance, oxidative phosphorylation, and protein ubiquitination pathways. Though not many direct similarities were observed among studies, two of the six studies reported changes in oxidative phosphorylation pathway [38, 63]. Changes in oxidative phosphorylation in HD have been described in literature previously [65]. Several studies reported differences in metabolic pathways, three of which were directly related to cellular respiration; these pathways were called “associated with oxidative phosphorylation”, “Citrate Cycle (TCA cycle)”, and “Mitochondrial Dysfunction” [37, 38, 63, 66]. The other two notable similarities in pathways were related to amino acid metabolism and are as follows: “Proline and Arginine Metabolism” [67] and “Metabolism of Amino Acids and Derivatives” [46]. Though these pathways are defined by slightly different mechanisms, they all point to dysfunction in energy production in the cell, consistent with previous hypotheses in HD. Also, commonality in pathways including neurotransmitter homeostasis occurred for both GABA and glutamate in R6/2 [46, 56]. A comparison of control and HD human brain identified changes in Rho GTPase signaling and actin cytoskeleton regulation, integrin and Ephrin B signaling (Table 2) [66]; implications for cytoskeleton signaling and Rac1 function also were implicated in studies from human stem cells [68].
Some pathways appeared in only a single study. For instance, the HD IPSC consortium found the IPA Cell Cycle pathway to be differentially expressed between HD and wild-type cells while none of the other studies had found similar pathways to be changed. Although at first the finding of Cell Cycle appears to contradict not only the studies we have reviewed here, but also previous studies that have not found perturbations in the cell cycle [69], this finding could be a result of the cell culture model which was analyzed, which contained at least some cycling cells. Alternatively, the rather broad nature of annotation of proteins to pathways and the presence of multifunctional “moonlighting” proteins may cause surprising pathways to be identified. In fact, IPA Cell Cycle cluster also includes terms like cell organization and assembly. These other terms are more commonly associated with HD.
Sample preparation can impact outcome of results. Langfelder et al. (2016) performed an exhaustive search using whole tissue to identify mRNA transcripts and proteins (using MS) that change in a CAG dependent manner [39]; raw data for all protein changes are available to the public. We mined MS data for all significant changes in whole striatal tissue and compared to our MS results from striatal synaptosomes [38] from the same knock-in mouse model (Q140/7Q versus wild-type mice at 6 months age). Little overlap in pathways defined by high confidence proteins occurred (compared results reported in Sapp et al., 2020 [38]). This suggests that focusing on a specific cellular compartment can significantly changes MS results and improve detection of changed proteins for a given compartment. However, the tissue dissections, sample preparations, MS and data analysis were performed in different labs which also likely affected the outcomes.
Age dependent findings in the HD proteome
MS studies indicate clear age dependent changes in the HD proteome (Table 2 studies). In younger mice fewer significant changes are reported between wild-type and HD. As the disease progresses the differences can increase greatly. This is highlighted clearly by Mann and colleagues in Table 2 using transgenic R6/2 HD mice: at 5 weeks, the expression patterns of the soluble proteome for wild-type and HD are largely identical; however, by 8 weeks of age, there are thousands of differentially expressed proteins [63]. Significant down regulations in “energy transport across the mitochondrial electron transport chain” and “proteins associated with the ribosome” pathways were reported along with upregulation of clusters containing TCP1 chaperone and proteasome [63]. PCA analysis showed that age + genotype together could explain most of the proteome remodeling [63]. In an earlier study, an age dependent increase of dihydrolipoamide S-succinyltransferase and aspartate aminotransferase and decrease of pyruvate dehydrogenase was found described in R6/2 comparing 4 and 10 weeks [43].
Similar trends were observed in knock-in HdhQ92 and HdhQ150 mouse with number of significantly changed proteins increasing with age (Table 2) [67]. This was also true when comparing knock-in Q140/Q7 and Q7/Q7 striatal synaptosomes where few protein changes occurred at 2 months and numerous protein changes occurred at 6 months; PCA analysis indicated age and genotype were responsible for similar changes with age again being a significant driver [38]. The work by Mann and colleagues suggests an inflexion point where soluble proteins are increasingly recruited into insoluble aggregates which may result in loss of function for numerous proteins [63]. This “tipping point” observed in the aggressive R6/2 model which overexpresses a small fragment of mutant HTT and accumulates numerous aggregates may not occur so abruptly in transgenic mice expressing full length mutant HTT or knock-in models of HD (or HD patients) where mutant HTT is expressed at endogenous levels and aggregate formation is slower.
Although many more proteins are changed with age, one might infer that early protein changes reflect the most important direct changes due to mutant HTT that cause early cognition and behavioral changes in HD or changes in neurodevelopment. This line of thinking often supposes that later changes are mostly compensatory or inflammatory and that perhaps by intervening early, later events could be averted. Furthermore, the smaller number of proteins/pathways to target would seem to present an ideal situation. While early changes are likely directly due to interactions of mutant HTT and should be investigated as therapeutic targets, it is plausible that a second larger event (a tipping point of mutant HTT aggregation and proteome remodeling) becomes a more significant driver of disease at the protein level. However, despite good evidence of a proteome remodeling in HD R6/2 mice discovered using MS and sophisticated computational analyses, there is a lack of correlation between data from MS analysis and neuron death and aggregation both in these mice [70] and other systems [71, 72].
In summary studies generally show increased number of protein changes with age indicating age as a significant driver.
ALTERED PROTEIN INTERACTIONS IN HUMAN POSTMORTEM AND HD MODELS DETERMINED BY MASS SPECTROMETRY: INTERACTOME
MS has also been used to study the HTT Interactome or the network of proteins with which HTT interacts (Table 4). In this group of studies, we highlight four studies that looked at differential interactions between wild-type and HD samples using MS. Additionally, we included a study analyzing the interactions found in solely WT HTT. For all five studies, we noted the model, tissue type, and the isolation methods. Table 4 shows the detection methods used, the number of proteins found different by MS, and any type of pathway analysis completed. Of note, many proteins identified by one MS screen were also found in a second MS screen from another laboratory. Our own comparisons showed about 30%of all identified hits show up in at least one other MS study, despite disparate models and pulldown techniques used. However, correspondence between MS hits and interactions identified by yeast two-hybrid, which is thought to be a demonstration of direct interactions, are not always forthcoming as demonstrated by Kaltenbach et al. who reported and compared both types of screens in the same publication [73]. In this regard, MS studies are a superior method to identify members of protein complexes, but direct interactions need to be shown using other methods. One study that focused only on wild-type HTT interactors in synaptosomes used a crosslinking approach and identified presynaptic proteins by MS that had not identified by others including Bassoon, Piccalo/Aczonin and Ahnak [74].
Pathway analysis for Interactome data sets
Three of the five interactome studies using MS completed a proper pathway enrichment analysis (Table 4). Two of these three had differential interactions in the IPA pathway “Oxidative phosphorylation” [75, 76]. Oxidative phosphorylation had been found to be deficient in HdhQ111/Q111 striatal cells previously which led to compromised mitochondrial energy production [65]. All three studies had associations with mitochondria; two found the IPA pathway “mitochondrial dysfunction” to be differentially expressed [75, 76]. A third study found many proteins related to mitochondrial function did not use a pathway analysis but highlighted “mitochondrial energy metabolism” to be of specific interest based on their protein findings [73]. Mitochondrial dysfunction has been noted many times in HD especially in terms of ATP production and, as noted above, metabolic pathways are also implicated by MS proteome changes. Severe deficiencies of around 50%have been found in the succinate dehydrogenase complexes II and III [40] and these findings could be the result of any of the upstream processes that feed into normal mitochondrial function such as glycolysis and the Citric acid cycle. The correspondence of findings related to metabolism and mitochondria between pathways identified in the Proteome versus Interactome strengthen the idea these pathways are important in HD and altered levels may stem from changes in HTT function related to the same protein. Indeed, many proteins altered in striatal HD synaptosomes at 6 months were also HTT interactors [38]. Similarly, “PKA signaling” was found enriched in HTT interactome data by Shirasaki et al. and corresponds to findings using HD proteomics showing altered levels of proteins regulating levels of cAMP such as PDE10a and dopamine receptors [38, 46].
Pathway analysis of interactomes shown in Table 4 have implied a dysfunction in neuronal development with significant enrichment of pathways entitled “Neuronal projection” [63] and “Axonal guidance” [68, 76]. Kaltenbach also highlighted proteins involved in axonal transport and synaptic function in their study [73].
Culver et al. found a strong enrichment for “Cytoskeletal regulation by Rho GTPase” for wild-type HTT interactors but profound enrichment of pathways involved in ribosome function including “Ribosomal”, “translation initiation”, and “RNA binding” in cells with mutant HTT. These pathway analyses directed them to identify a novel function in cap dependent translation [77].
Attempts to make sense of affinity purification-mass spectrometry (AP-MS) proteomics data have also been performed using Weighted Gene Correlation Network Analysis (WGCNA) by Shirasaki et al. (Table 4) [76]. They defined 8 modules described by color and proteins or IPA pathways enriched within them including Red (HTT/Proteostasis/14-3-3), Blue (Pre-synaptic Function), Pink (Calcium Signaling/Mitochondria), Yellow (Post-synaptic Function), Green (Actin Cytoskeleton Organization), and Cyan (Aging/Mitochondria) [76].
POST-TRANSLATIONAL MODIFICATION OF HTT PROTEIN IDENTIFIED BY MASS SPECTROMETRY
Post translational modifications are another area of proteomic research that has greatly benefited from the implementation of MS technologies. PTMs identification by MS generally uses “top down” type workflow by isolating a single protein, in this case HTT. There are four MS studies investigating PTMs of HTT that we looked at in this review (Table 5). The information in this table highlights the model used, tissue preparation, MS methods, and the PTM/ PTMs that were found or investigated.
In the past, PTMs have been investigated primarily using immunoblotting techniques. In the four studies highlighted in this review various novel PTM sites have been discovered. The first MS study analyzed immunopurified myc-tagged full length HTT expressed in 293T and PC12 cells [78]. Six novel phosphorylation sites were identified in addition to the known p421 site (Table 5). Several of these phosphorylation sites have been since investigated/validated by others such as the 1181 and 1201 sites [15]. Using MS techniques, a new acetylation site was found at K444 [79]. The acetylation of this site is thought to aid in degradation of mutant HTT. MS techniques also elucidated phosphorylation sites at S13 and S16 [80]. Further investigation of these modifications showed that IKK was responsible for their phosphorylation [81]. Phosphorylation of S13 and S16 facilitates degradation by proteasome and lysosomal pathways and presence of a polyglutamine tract has been shown to hinder this degradation. Ratovinski et al. identified 18 novel PTM sites in the HTT protein, as well as validating older PTM findings [75]. This study acts to validate the use of MS investigations in discovery of novel PTMs.
CONCLUSIONS: WHAT HAVE WE LEARNED?
HD is a devastating neurodegenerative disorder caused by CAG expansion in the HD gene and expression of mutant HTT protein. Over the last 40–50 years, even before the gene was cloned, researchers have found changes in protein expression present in the disease. With the use of modern MS techniques, researchers have further validated changes in levels of proteins that were previously identified such as those in the cAMP pathway. Alterations in many new proteins have been discovered using MS proteomics as well, suggesting previously unappreciated mechanisms at play.
However, there is a surprising lack of consistency between studies or even a failure for changes to be replicated by other protein analysis techniques. MS proteomic studies have illuminated divergent and sometime confusing information. While related proteins or similar isoforms may be changed, often the exact same proteins are not changed among studies. Part of this is likely due to use of the diverse models: mouse and human cell lines of various differentiation states, HD mouse models including transgenic models overexpressing fragments or full length mutant HTT, and knock-in mouse models. This is compounded by aging which has been shown to be a significant driver of proteomic phenotype in every HD study where multiple timepoints where studied. The idea that biomarkers of mutant HTT pathology that are useful across models and human patients seems elusive, with a few exceptions. The best “model” would be human of course, but for ethical reasons brain tissue can never be harvested for such studies. Unfortunately, human autopsy tissue represents the end stage of disease and may not be high quality due to long postmortem intervals, so models have been necessary. In our opinion, a study using one mouse model with varied CAG repeats comparing across numerous timepoints would be of value to understand why there is not a higher correspondence of changes at the individual protein level in the literature. Additional studies, on human CSF and peripheral biofluids are also warranted.
One of the most interesting pieces of information that MS studies have allowed for is pathway enrichment analysis by generating a great number of proteins for comparison of whole networks of proteins within these tissues. Though this pathway analysis can be quite helpful for pulling together a large amount of information about 100 s–1000 s of proteins, it also has its complications. MS is a highly accurate technique that allows identification of peptides sequences with just one amino acid difference; however, when paired with a technique like pathway analysis where annotation of pathways is subjective and incomplete at best, vague and inconsistent information can be interpreted incorrectly.
In HD, there is a high likelihood to find differential expression in oxidative stress, energy metabolism, and proteostasis pathways. One area that was implicated largely due to pathway/higher order analysis of MS interactome data is actin cytoskeleton and its complex biology [76, 77]. When HD proteome results are coupled with findings discovered using yeast-two hybrid approaches and other interactor approaches [82–85] the case is strong for HTT regulation of small GTPases whose molecular functions impinge on numerous cellular processes such as vesicle/membrane trafficking (through Rabs) and actin cytoskeletal dynamics (through Rac1), and nuclear transport (through Rans). Proteins of the synapse were also identified [73, 76] implicating altered synaptic function as a potential cause for early cognitive changes in HD.
Top down MS studies on the HTT protein are producing extremely interesting information about phosphorylation status and other modifications of HTT. Correlating these HTT proteoforms with functions should be fruitful in identifying mechanisms of pathology that can be targeted for intervention. Finally, additional studies comparing control and HD CSF are warranted to discover and develop novel biomarkers for clinical applications.
ACKNOWLEDGMENTS
We are indebted to Marian DiFiglia for her critical reading of this manuscript and Ellen Sapp for editing. KKG and CS are funded by CHDI Foundation and the Dake Family Foundation.
CONFLICT OF INTEREST
KKG spouse owns individual stock in the following companies: Bristol-Myers Squibb Company, Cisco Systems, Inc., GE Healthcare Life Sciences, Generex Biotechnology Corporation, GlaxoSmithKline, Metabolix Bioplastics, Nanogen, Inc., Repligen Corporation. CS has no conflict of interest to report.
REFERENCES
[1] | A novel gene containing a trinucleotide repeat that is expanded and unstable on Huntington’s disease chromosomes. (1993) The Huntington’s Disease Collaborative Research Group. Cell 72: (6):971–83. |
[2] | DiFiglia M , Sapp E , Chase K , Schwarz C , Meloni A , Young C , et al. Huntingtin is a cytoplasmic protein associated with vesicles in human and rat brain neurons. Neuron. (1995) ;14: (5):1075–81. |
[3] | Sharp AH , Loev SJ , Schilling G , Li SH , Li XJ , Bao J , et al. Widespread expression of Huntington’s disease gene (IT15) protein product. Neuron. (1995) ;14: (5):1065–74. |
[4] | Trottier Y , Devys D , Imbert G , Saudou F , An I , Lutz Y , et al. Cellular localization of the Huntington’s disease protein and discrimination of the normal and mutated form. Nat Genet. (1995) ;10: (1):104–10. |
[5] | Sagar SM , Beal MF , Marshall PE , Landis DM , Martin JB . Implications of neuropeptides in neurological diseases. Peptides. (1984) ;5: (Suppl 1):255–62. |
[6] | Vonsattel JP , DiFiglia M . Huntington disease. J Neuropathol Exp Neurol. (1998) ;57: (5):369–84. |
[7] | Aronin N , Cooper PE , Lorenz LJ , Bird ED , Sagar SM , Leeman SE , et al. Somatostatin is increased in the basal ganglia in Huntington disease. Ann Neurol. (1983) ;13: (5):519–26. |
[8] | Beal MF , Bird ED , Langlais PJ , Martin JB . Somatostatin is increased in the nucleus accumbens in Huntington’s disease. Neurology. (1984) ;34: (5):663–6. |
[9] | Albin RL , Young AB , Penney JB , Handelin B , Balfour R , Anderson KD , et al. Abnormalities of striatal projection neurons and N-methyl-D-aspartate receptors in presymptomatic Huntington’s disease. N Engl J Med. (1990) ;322: (18):1293–8. |
[10] | Bibb JA , Yan Z , Svenningsson P , Snyder GL , Pieribone VA , Horiuchi A , et al. Severe deficiencies in dopamine signaling in presymptomatic Huntington’s disease mice. Proc Natl Acad Sci U S A. (2000) ;97: (12):6809–14. |
[11] | DiProspero NA , Chen EY , Charles V , Plomann M , Kordower JH , Tagle DA . Early changes in Huntington’s disease patient brains involve alterations in cytoskeletal and synaptic elements. J Neurocytol. (2004) ;33: (5):517–33. |
[12] | Humbert S , Bryson EA , Cordelieres FP , Connors NC , Datta SR , Finkbeiner S , et al. The IGF-1/Akt pathway is neuroprotective in Huntington’s disease and involves Huntingtin phosphorylation by Akt. Dev Cell. (2002) ;2: (6):831–7. |
[13] | Rangone H , Poizat G , Troncoso J , Ross CA , MacDonald ME , Saudou F , et al. The serum- and glucocorticoid-induced kinase SGK inhibits mutant huntingtin-induced toxicity by phosphorylating serine 421 of huntingtin. Eur J Neurosci. (2004) ;19: (2):273–9. |
[14] | Warby SC , Chan EY , Metzler M , Gan L , Singaraja RR , Crocker SF , et al. Huntingtin phosphorylation on serine 421 is significantly reduced in the striatum and by polyglutamine expansion in vivo. Hum Mol Genet. (2005) ;14: (11):1569–77. |
[15] | Anne SL , Saudou F , Humbert S Phosphorylation of huntingtin by cyclin-dependent kinase 5 is induced by DNA damage and regulates wild-type and mutant huntingtin toxicity in neurons. J Neurosci. (2007) ;27: (27):7318–28. |
[16] | Yanai A , Huang K , Kang R , Singaraja RR , Arstikaitis P , Gan L , et al. Palmitoylation of huntingtin by HIP14 is essential for its trafficking and function. Nat Neurosci. (2006) ;9: (6):824–31. |
[17] | Peters MF , Ross CA . Isolation of a 40-kDa Huntingtin-associated protein. J Biol Chem. (2001) ;276: (5):3188–94. |
[18] | Zabel C , Chamrad DC , Priller J , Woodman B , Meyer HE , Bates GP , et al. Alterations in the mouse and human proteome caused by Huntington’s disease. Mol Cell Proteomics. (2002) ;1: (5):366–75. |
[19] | Ehrnhoefer DE , Sutton L , Hayden MR . Small changes, big impact: Posttranslational modifications and function of huntingtin in Huntington disease. Neuroscientist. (2011) ;17: (5):475–92. |
[20] | Saez I , Vilchez D . The mechanistic links between proteasome activity, aging and age-related diseases. Curr Genomics. (2014) ;15: (1):38–51. |
[21] | Fenn JB , Mann M , Meng CK , Wong SF , Whitehouse CM . Electrospray ionization for mass spectrometry of large biomolecules. Science. (1989) ;246: (4926):64–71. |
[22] | Tanaka K , Waki H , Ido I , Akita S , Yoshido Y , Yoshido T , et al. Protein and polymer analyses up tom/z 100 000 by laser ionization time-of-flight mass spectrometry. Rapid Commun Mass Spectrom. (1988) ;2: (8):151–3. |
[23] | Iwamoto N , Shimada T . Recent advances in mass spectrometry-based approaches for proteomics and biologics: Great contribution for developing therapeutic antibodies. Pharmacol Ther. (2018) ;185: :147–54. |
[24] | Dreisewerd K . The desorption process in MALDI. Chem Rev. (2003) ;103: (2):395–426. |
[25] | Wilm M , Shevchenko A , Houthaeve T , Breit S , Schweigerer L , Fotsis T , et al. Femtomole sequencing of proteins from polyacrylamide gels by nano-electrospray mass spectrometry. Nature. (1996) ;379: (6564):466–9. |
[26] | Donnelly DP , Rawlins CM , DeHart CJ , Fornelli L , Schachner LF , Lin Z , et al. Best practices and benchmarks for intact protein analysis for top-down mass spectrometry. Nat Methods. (2019) ;16: (7):587–94. |
[27] | Chait BT . Mass spectrometry in the postgenomic era. Annu Rev Biochem. (2011) ;80: :239–46. |
[28] | Chait BT . Chemistry. Mass spectrometry: Bottom-up or top-down? Science. (2006) ;314: (5796):65–6. |
[29] | Cox J , Hein MY , Luber CA , Paron I , Nagaraj N , Mann M . Accurate proteome-wide label-free quantification by delayed normalization and maximal peptide ratio extraction, termed MaxLFQ. Mol Cell Proteomics.. (2014) ;13: (9):2513–26. |
[30] | Yates JR , Ruse CI , Nakorchevsky A . Proteomics by mass spectrometry: Approaches, advances, and applications. Annu Rev Biomed Eng. (2009) ;11: :49–79. |
[31] | Schiffman C , Petrick L , Perttula K , Yano Y , Carlsson H , Whitehead T , et al. Filtering procedures for untargeted LC-MS metabolomics data. BMC Bioinformatics. (2019) ;20: (1):334. |
[32] | Schittmayer M , Fritz K , Liesinger L , Griss J , Birner-Gruenberger R . Cleaning out the litterbox of proteomic scientists’ favorite pet: Optimized data analysis avoiding trypsin artifacts. J Proteome Res. (2016) ;15: (4):1222–9. |
[33] | Klont F , Bras L , Wolters JC , Ongay S , Bischoff R , Halmos GB , et al. Assessment of sample preparation bias in mass spectrometry-based proteomics. Anal Chem. (2018) ;90: (8):5405–13. |
[34] | Larsen MR , Trelle MB , Thingholm TE , Jensen ON . Analysis of posttranslational modifications of proteins by tandem mass spectrometry. Biotechniques. (2006) ;40: (6):790–8. |
[35] | Parker BL , Shepherd NE , Trefely S , Hoffman NJ , White MY , Engholm-Keller K , et al. Structural basis for phosphorylation and lysine acetylation cross-talk in a kinase motif associated with myocardial ischemia and cardioprotection. J Biol Chem. (2014) ;289: (37):25890–906. |
[36] | Agrawal S , Fox JH . Novel proteomic changes in brain mitochondria provide insights into mitochondrial dysfunction in mouse models of Huntington’s disease. Mitochondrion. (2019) ;47: :318–29. |
[37] | McQuade LR , Balachandran A , Scott HA , Khaira S , Baker MS , Schmidt U . Proteomics of Huntington’s disease-affected human embryonic stem cells reveals an evolving pathology involving mitochondrial dysfunction and metabolic disturbances. J Proteome Res. (2014) ;13: (12):5648–59. |
[38] | Sapp E , Seeley C , Iuliano M , Weisman E , Vodicka P , DiFiglia M , et al. Protein changes in synaptosomes of Huntington’s disease knock-in mice are dependent on age and brain region. Neurobiol Dis. (2020) ;141: :104950. |
[39] | Langfelder P , Cantle JP , Chatzopoulou D , Wang N , Gao F , Al-Ramahi I , et al. Integrated genomics and proteomics define huntingtin CAG length-dependent networks in mice. Nat Neurosci. (2016) ;19: (4):623–33. |
[40] | Gu M , Gash MT , Mann VM , Javoy-Agid F , Cooper JM , Schapira AH . Mitochondrial defect in Huntington’s disease caudate nucleus. Ann Neurol. (1996) ;39: (3):385–9. |
[41] | Dubinsky JM . Towards an understanding of energy impairment in Huntington’s disease brain. J Huntingtons Dis. (2017) ;6: (4):267–302. |
[42] | Sorolla MA , Reverter-Branchat G , Tamarit J , Ferrer I , Ros J , Cabiscol E . Proteomic and oxidative stress analysis in human brain samples of Huntington disease. Free Radic Biol Med. (2008) ;45: (5):667–78. |
[43] | Perluigi M , Poon HF , Maragos W , Pierce WM , Klein JB , Calabrese V , et al. Proteomic analysis of protein expression and oxidative modification in r6/2 transgenic mice: A model of Huntington disease. Mol Cell Proteomics. (2005) ;4: (12):1849–61. |
[44] | Valencia A , Sapp E , Kimm JS , McClory H , Ansong KA , Yohrling G , et al. Striatal synaptosomes from Hdh140Q/140Q knock-in mice have altered protein levels, novel sites of methionine oxidation, and excess glutamate release after stimulation. J Huntingtons Dis. (2013) ;2: (4):459–75. |
[45] | Paul BD , Snyder SH . Impaired redox signaling in Huntington’s disease: Therapeutic implications. Front Mol Neurosci. (2019) ;12: :68. |
[46] | Skotte NH , Andersen JV , Santos A , Aldana BI , Willert CW , Norremolle A , et al. Integrative characterization of the R6/2 mouse model of Huntington’s disease reveals dysfunctional astrocyte metabolism. Cell Rep. (2018) ;23: (7):2211–24. |
[47] | Wilson H , Niccolini F , Haider S , Marques TR , Pagano G , Coello C , et al. Loss of extra-striatal phosphodiesterase 10A expression in early premanifest Huntington’s disease gene carriers. J Neurol Sci. (2016) ;368: :243–8. |
[48] | Ouimet CC , Miller PE , Hemmings HC Jr. . Walaas SI , Greengard P . DARPP-32, a dopamine- and adenosine 3’:5’-monophosphate-regulated phosphoprotein enriched in dopamine-innervated brain regions. III. Immunocytochemical localization. J Neurosci. (1984) ;4: (1):111–24. |
[49] | Miyazaki H , Oyama F , Inoue R , Aosaki T , Abe T , Kiyonari H , et al. Singular localization of sodium channel beta4 subunit in unmyelinated fibres and its role in the striatum. Nat Commun. (2014) ;5: :5525. |
[50] | Mehta SR , Tom CM , Wang Y , Bresee C , Rushton D , Mathkar PP , et al. Human Huntington’s disease iPSC-derived cortical neurons display altered transcriptomics, morphology, and maturation. Cell Rep. (2018) ;25: (4):6. |
[51] | Oyama F , Miyazaki H , Sakamoto N , Becquet C , Machida Y , Kaneko K , et al. Sodium channel beta4 subunit: Down-regulation and possible involvement in neuritic degeneration in Huntington’s disease transgenic mice. J Neurochem. (2006) ;98: (2):518–29. |
[52] | Sheilabi MA , Takeshita LY , Sims EJ , Falciani F , Princivalle AP . The sodium channel B4-subunits are dysregulated in temporal lobe epilepsy drug-resistant patients. Int J Mol Sci. (2020) ;21: (8):2955. |
[53] | Li R-G , Wang Q , Xu Y-J , Zhang M , Qu X-K , Liu X , et al. Mutations of the SCN4B-encoded sodium channel β4 subunit in familial atrial fibrillation. Int J Mol Med. (2013) ;32: (1):144–50. |
[54] | Tereshchenko A , Magnotta V , Epping E , Mathews K , Espe-Pfeifer P , Martin E , et al. Brain structure in juvenile-onset Huntington disease. Neurology. (1939) ;92: (17):e1939–e47. |
[55] | Choudhury KR , Das S , Bhattacharyya NP . Differential proteomic and genomic profiling of mouse striatal cell model of Huntington’s disease and control; probable implications to the disease biology. J Proteomics. (2016) ;132: :155–66. |
[56] | Liu X , Miller BR , Rebec GV , Clemmer DE . Protein expression in the striatum and cortex regions of the brain for a mouse model of Huntington’s disease. J Proteome Res. (2007) ;6: (8):3134–42. |
[57] | Soares TR , Reis SD , Pinho BR , Duchen MR , Oliveira JMA . Targeting the proteostasis network in Huntington’s disease. Ageing Res Rev. (2019) ;49: :92–103. |
[58] | Baldo B , Weiss A , Parker CN , Bibel M , Paganetti P , Kaupmann K . A screen for enhancers of clearance identifies huntingtin as a heat shock protein 90 (Hsp90) client protein. J Biol Chem. (2012) ;287: (2):1406–14. |
[59] | Wild EJ , Boggio R , Langbehn D , Robertson N , Haider S , Miller JR , et al. Quantification of mutant huntingtin protein in cerebrospinal fluid from Huntington’s disease patients. J Clin Invest. (2015) ;125: (5):1979–86. |
[60] | Fang Q , Strand A , Law W , Faca VM , Fitzgibbon MP , Hamel N , et al. Brain-specific proteins decline in the cerebrospinal fluid of humans with Huntington disease. Mol Cell Proteomics. (2009) ;8: (3):451–66. |
[61] | Huang YC , Wu YR , Tseng MY , Chen YC , Hsieh SY , Chen CM . Increased prothrombin, apolipoprotein A-IV, and haptoglobin in the cerebrospinal fluid of patients with Huntington’s disease. PLoS One. (2011) ;6: (1):e15809. |
[62] | Niemela V , Landtblom AM , Nyholm D , Kneider M , Constantinescu R , Paucar M , et al. Proenkephalin decreases in cerebrospinal fluid with symptom progression of Huntington’s disease. Mov Disord. (2021) ;36: (2):481–91. |
[63] | Hosp F , Gutierrez-Angel S , Schaefer MH , Cox J , Meissner F , Hipp MS , et al. Spatiotemporal proteomic profiling of Huntington’s disease inclusions reveals widespread loss of protein function. Cell Rep. (2017) ;21: (8):2291–303. |
[64] | Silajdzic E , Bjorkqvist M . A critical evaluation of wet biomarkers for Huntington’s disease: Current status and ways forward. J Huntingtons Dis. (2018) ;7: (2):109–35. |
[65] | Milakovic T , Johnson GV . Mitochondrial respiration and ATP production are significantly impaired in striatal cells expressing mutant huntingtin. J Biol Chem. (2005) ;280: (35):30773–82. |
[66] | Ratovitski T , Chaerkady R , Kammers K , Stewart JC , Zavala A , Pletnikova O , et al. Quantitative proteomic analysis reveals similarities between Huntington’s disease (HD) and Huntington’s disease-like 2 (HDL2) human brains. J Proteome Res. (2016) ;15: (9):3266–83. |
[67] | Deschepper M , Hoogendoorn B , Brooks S , Dunnett SB , Jones L . Proteomic changes in the brains of Huntington’s disease mouse models reflect pathology and implicate mitochondrial changes. Brain Res Bull. (2012) ;88: (2-3):210–22. |
[68] | HD iPSC Consortium. Developmental alterations in Huntington’s disease neural cells and pharmacological rescue in cells and mice. Nat Neurosci. (2017) ;20: (5):648–60. |
[69] | Jedrak P , Mozolewski P , Wegrzyn G , Wieckowski MR . Mitochondrial alterations accompanied by oxidative stress conditions in skin fibroblasts of Huntington’s disease patients. Metab Brain Dis. (2018) ;33: (6):2005–17. |
[70] | Davies SW , Turmaine M , Cozens BA , DiFiglia M , Sharp AH , Ross CA , et al. Formation of neuronal intranuclear inclusions underlies the neurological dysfunction in mice transgenic for the HD mutation. Cell. (1997) ;90: (3):537–48. |
[71] | Arrasate M , Finkbeiner S . Protein aggregates in Huntington’s disease. Exp Neurol. (2012) ;238: (1):1–11. |
[72] | Arrasate M , Mitra S , Schweitzer ES , Segal MR , Finkbeiner S . Inclusion body formation reduces levels of mutant huntingtin and the risk of neuronal death. Nature. 431. (2004) ;431: (7010):805–10. |
[73] | Kaltenbach LS , Romero E , Becklin RR , Chettier R , Bell R , Phansalkar A , et al. Huntingtin interacting proteins are genetic modifiers of neurodegeneration. PLoS Genet. (2007) ;3: (5):e82. |
[74] | Yao J , Ong SE , Bajjalieh S . Huntingtin is associated with cytomatrix proteins at the presynaptic terminal. Mol Cell Neurosci. (2014) ;63: :96–100. |
[75] | Ratovitski T , Chighladze E , Arbez N , Boronina T , Herbrich S , Cole RN , et al. Huntingtin protein interactions altered by polyglutamine expansion as determined by quantitative proteomic analysis. Cell Cycle. (2012) ;11: (10):2006–21. |
[76] | Shirasaki DI , Greiner ER , Al-Ramahi I , Gray M , Boontheung P , Geschwind DH , et al. Network organization of the huntingtin proteomic interactome in mammalian brain. Neuron. (2012) ;75: (1):41–57. |
[77] | Culver BP , Savas JN , Park SK , Choi JH , Zheng S , Zeitlin SO , et al. Proteomic analysis of wild-type and mutant huntingtin-associated proteins in mouse brains identifies unique interactions and involvement in protein synthesis. J Biol Chem. (2012) ;287: (26):21599–614. |
[78] | Schilling B , Gafni J , Torcassi C , Cong X , Row RH , LaFevre-Bernt MA , et al. Huntingtin phosphorylation sites mapped by mass spectrometry. Modulation of cleavage and toxicity. J Biol Chem. (2006) ;281: (33):23686–97. |
[79] | Jeong H , Then F , Melia TJ Jr. , Mazzulli JR , Cui L , Savas JN , et al. Acetylation targets mutant huntingtin to autophagosomes for degradation. Cell. (2009) ;137: (1):60–72. |
[80] | Gu X , Greiner ER , Mishra R , Kodali R , Osmand A , Finkbeiner S , et al. Serines 13 and 16 are critical determinants of full-length human mutant huntingtin induced disease pathogenesis in HD mice. Neuron. (2009) ;64: (6):828–40. |
[81] | Thompson LM , Aiken CT , Kaltenbach LS , Agrawal N , Illes K , Khoshnan A , et al. IKK phosphorylates Huntingtin and targets it for degradation by the proteasome and lysosome. J Cell Biol. (2009) ;187: (7):1083–99. |
[82] | Tourette C , Li B , Bell R , O’Hare S , Kaltenbach LS , Mooney SD , et al. A large scale Huntingtin protein interaction network implicates Rho GTPase signaling pathways in Huntington disease. J Biol Chem. (2014) ;289: (10):6709–26. |
[83] | Goehler H , Lalowski M , Stelzl U , Waelter S , Stroedicke M , Worm U , et al. A protein interaction network links GIT1, an enhancer of huntingtin aggregation, to Huntington’s disease. Mol Cell. (2004) ;15: (6):853–65. |
[84] | Harjes P , Wanker EE . The hunt for huntingtin function: Interaction partners tell many different stories. Trends Biochem Sci. (2003) ;28: (8):425–33. |
[85] | Wanker EE , Ast A , Schindler F , Trepte P , Schnoegl S . The pathobiology of perturbed mutant huntingtin protein-protein interactions in Huntington’s disease. J Neurochem. (2019) ;151: (4):507–19. |


