
Approaches to Sequence the HTT CAG Repeat Expansion and Quantify Repeat Length Variation
Abstract
Background:
Huntington’s disease (HD) is an autosomal dominant neurodegenerative disorder caused by the expansion of the HTT CAG repeat. Affected individuals inherit ≥36 repeats and longer alleles cause earlier onset, greater disease severity and faster disease progression. The HTT CAG repeat is genetically unstable in the soma in a process that preferentially generates somatic expansions, the proportion of which is associated with disease onset, severity and progression. Somatic mosaicism of the HTT CAG repeat has traditionally been assessed by semi-quantitative PCR-electrophoresis approaches that have limitations (e.g., no information about sequence variants). Genotyping-by-sequencing could allow for some of these limitations to be overcome.
Objective:
To investigate the utility of PCR sequencing to genotype large (>50 CAGs) HD alleles and to quantify the associated somatic mosaicism.
Methods:
We have applied MiSeq and PacBio sequencing to PCR products of the HTT CAG repeat in transgenic R6/2 mice carrying ∼55, ∼110, ∼255 and ∼470 CAGs. For each of these alleles, we compared the repeat length distributions generated for different tissues at two ages.
Results:
We were able to sequence the CAG repeat full length in all samples. However, the repeat length distributions for samples with ∼470 CAGs were biased towards shorter repeat lengths.
Conclusion:
PCR sequencing can be used to sequence all the HD alleles considered, but this approach cannot be used to estimate modal allele size or quantify somatic expansions for alleles ⪢250 CAGs. We review the limitations of PCR sequencing and alternative approaches that may allow the quantification of somatic contractions and very large somatic expansions.
INTRODUCTION
Huntington’s disease (HD) is caused by the expansion of a CAG repeat in exon one of the HTT gene. Affected individuals inherit ≥36 CAG repeats and longer alleles are associated with earlier onset, greater disease severity and faster disease progression [1–3]. The HTT CAG repeat is genetically unstable in the germline, which frequently causes the number of CAG repeats to increase in successive generations [4]. Germline instability of the HTT CAG repeat is thus the cause of the anticipation often seen in HD, i.e., earlier onset and increased disease severity in successive generations. The HTT CAG repeat is also genetically unstable in the soma [5]. The somatic mosaicism of the HTT CAG repeat is cell-type specific [6], expansion-biased and is dependent on both the number of inherited CAG repeats and age [7, 8]. In HD patients and HD mouse models, the largest somatic CAG expansions are observed in the cortex and striatum [9–12], the brain region most affected by HD pathology [13]. Such somatic expansions can contain dozens, hundreds or even thousands of re-peats and are observed early in the course of the disease [9]. Because patients with a larger number of CAG repeats experience earlier onset, greater disease severity and faster progression, somatic CAG expansions are likely determinants of the tissue specificity, onset, severity, and progression of the disease. Several association studies have gathered evidence that supports this hypothesis. Swami et al. [14] inv-estigated somatic expansion in post-mortem DNA samples from HD patients, and showed that patients with particularly early-onset have a higher proportion of large expansions in the cortex. Most recently, genetic association studies in HD patient cohorts have revealed the association between DNA repair gene variants and age at motor signs of HD and HD progression [15–19]. These data suggest that somatic CAG repeat expansions contribute toward HD pat-hology. Nevertheless, it remains unknown whether somatic expansions are required to precipitate pat-hology, or what their relative contribution to HD pathology is. More detailed quantitative analyses of the dynamics of somatic mosaicism should help to answer some of these questions, and further disentangling of the mechanisms by which they are generated should allow for the identification of additional therapeutic targets. Although several components of the DNA mismatch repair pathway have been shown to be critical for somatic expansion [12, 20–23], the pre-cise molecular processes that generate expansions and determine their tissue specificity is unknown [18, 19, 24, 25]. In this context, precise and accurate quantification of HTT CAG somatic mosaicism in patient samples and model systems is warranted, since it may provide a suitable phenotype for genetic association studies aimed at identifying genetic variants that act as modifiers of repeat instability [7, 15]. Somatic mosaicism in HD patients and model organisms is traditionally assessed by gel or capillary electrophoresis of single-molecule, small pool (SP) or bulk-PCR (PCR using thousands of DNA molecules as a template) products [26]. However, using electrophoresis to estimate the number of re-peats in the PCR fragments detected does not provide any information about genetic variants within and around the HTT CAG repeat, which can lead to erroneous electrophoresis estimates of the number of pure CAG repeats [7]. Massively parallel sequencing (MPS) should allow for some of the limitations of electrophoresis to be overcome. However, although short MPS reads (<150 nt) can be used to genotype variants within and around the HTT CAG repeat, longer reads (≥150 bp) are required to be able to phase these variants with the CAG repeat. Identifying these variants and phasing them with the CAG repeat is essential to determine pure CAG length in HD patients and because some of them (e.g., presence or absence of the CAACAG hexamer 3’ of the CAG repeat) are associated with variation in HD onset [7, 16, 27], severity and progression [7].
Indeed, MPS has also recently proven useful for the detection of microsatellite somatic mosaicism in tumour samples [28, 29]. At high read-depth, MPS data should allow precise and accurate quantification of somatic repeat length variants, whilst also pro-viding information about genetic variants within and around the repeat. However, massively parallel seq-uencing is not commonly used to sequence, size and quantify the somatic mosaicism associated with trinucleotide expansions. The main reason for this is that sequencing reads generated by commonly used MPS platforms (<150 nt) are too short for the accurate sizing of the repeat, which requires repeat-spanning sequencing reads. However, long-read sequencing platforms have recently been successfully applied to the sequencing of trinucleotide repeat expansions. Using PacBio single-molecule real-time (SMRT) long-read sequencing, Cumming et al. [30] have demonstrated the usefulness of bulk-PCR sequencing to sequence myotonic dystrophy type 1 (DM1)-assoc-iated DMPK CTG repeat expansions with modal alleles of up to ∼400 CTG repeats. Besides, Hafford-Tear et al. [31] have sequenced Fuchs endothelial corneal dystrophy-associated TCF4 CTG repeat expansions with modal alleles of up to ∼150 CTG repeats and some associated somatic expansions of more than 1,000 repeats, using an amplification-free PacBio SMRT approach. As demonstrated by Ciosi et al. [7] using 400 nt MiSeq reads for sequencing of the HTT CAG repeat, PacBio SMRT long-read sequencing is not required for the sequencing and quantification of somatic mosaicism of shorter trinucleotide repeat expansions. This is likely to apply to several other polyglutamine encoding CAG repeat disorders which are typically associated with smaller repeat expansions (<80 CAG repeats) and for which preliminary evidence also suggest somatic expansion may be important [32].
Although MPS approaches allow some of the limitations of electrophoresis to be overcome by providing information about genetic variants within and around the repeat, they might be limited in their ability to detect very large repeat expansions. However, no formal comparison of electrophoresis and MPS approaches for the quantification of somatic mosaicism of trinucleotide expansions has previously been presented. In this study, we have applied bulk-PCR sequencing approaches using Illumina MiSeq and PacBio SMRT long-read sequencing to assess their usefulness for the estimation of the modal allele, and the quantification of somatic expansions, associated with small (∼50 to ∼100 CAG) and large (∼100 to ∼500 CAG) HTT repeat expansions. Where appropriate, the bulk-PCR sequencing data were compared with more traditional small pool-PCR (SP-PCR) Southern blot analyses and capillary electrophoresis of fluorochrome-labelled bulk-PCR products.
MATERIALS AND METHODS
Samples
In order to evaluate the ability of bulk-PCR seq-uencing approaches to sequence different numbers of CAGs, we used previously described [33] DNA samples from an allelic series of R6/2 transgenic mice [34] carrying a single copy of a human HTT transgene with germline alleles containing ∼55, ∼110, ∼255 or ∼470 CAGs [33, 35] (Table 1). To measure different levels of somatic mosaicism of the HTT CAG repeat, DNA samples isolated from four different tissues, known to harbour different levels of somatic mosaicism, were selected (striatum, liver, cortex and cerebellum, Table 1). To capture some of the age-dependent increase in somatic mosaicism, we analysed samples from one young and one old mouse for each repeat length, aiming at analysing DNA from the oldest available mice. The life span of R6/2 mice carrying 100 to 300 CAGs is much shorter than in mice carrying < 60 and >440 CAGs [35–37]. The oldest available mice carrying ∼110 and ∼255 CAGs were therefore much younger (∼5 months old), than the oldest mice carrying ∼55 and ∼470 CAGs (Table 1). To ensure that somatic mosaicism did not bias the estimation of the number of CAGs in the progenitor allele, a DNA sample of the tail at weaning was also analysed for each of the older mice (Table 1).
Table 1
Characteristics of the R6/2 DNA samples analysed
| PacBio sequencing batch/run | Number of CAGs * | Age (weeks) | Striatum | Liver | Cortex | Cerebellum | Tail at death | Tail at weaning |
| 1 | 53 | 6 | + | + | + | + | + | – |
| 1 | 53 | 117 | + | + | + | + | – | + |
| 1 | 109 | 4.4 | + | + | + | + | – | – |
| 1 | 111 | 20 | + | + | + | + | – | + |
| 2 | 252 | 6 | + | + | + | + | – | – |
| 1 &2 | 258 | 20 | + | + | + | + | – | + |
| 2 | 469 | 6 | + | + | + | + | – | – |
| 2 | 476 | 115.7 | + | + | + | + | – | – |
One row corresponds to one mouse analysed. *: previously estimated by capillary electrophoresis [33].+: sample analysed. – : sample not available.
MiSeq library preparation for four R6/2 mice inheriting HTT transgenes with ∼55 or ∼110 CAGs
The HTT exon one trinucleotide repeat (compr-ising the CAG repeat, a CAACAG hexamer, a CCGCCA hexamer, the CCG repeat and the CCT repeat) was PCR-amplified from 20 ng of genomic DNA using MiSeq-compatible PCR primers [38]. The HTT-specific part of these MiSeq-compatible PCR primers corresponded to the primer pair 31329/33934 [34] that targets the human HHTT exon one trinucleotide repeat from the R6/2 human HTT transgene and not the endogenous mouse Htt CAG repeat. A single PCR per tissue was performed. Each sample, i.e., one tissue from a particular mouse, was associated with a unique pair of indexes, also frequently referred to as a sample barcode. TruSeq CD indexes were used for the samples with ∼55 CAGs, and Nextera XT Index Kit v2 indexes were used for the samples with ∼110 CAGs (Supplementary Tables 1 and 2) [38]. MiSeq sequencing was performed with a 400 nt forward read and a 200 nt reverse read by Glasgow Polyomics (https://www.polyomics.gla.ac.uk). See Ciosi et al. [38] for the full details of the sequencing library preparation and MiSeq sequencing.
Preparation of bulk-PCR products for PacBio SMRT sequencing
Bulk-PCR products of the HTT exon one trinucl-eotide repeat (comprising the CAG repeat, a CAACAG hexamer, a CCGCCA hexamer, the CCG re-peat and the CCT repeat) for PacBio SMRT library preparation were generated by PCR using barcoded PCR primers. PacBio barcodes for the PacBio RS II System in symmetric mode [39] were used as 5’-tails to the R6/2 transgene-specific primers MS1F (5’-GCCCAGAGCCCCATTCATTG-3’) and MS1R (5’-CCGCCATCCCCGCCGTAGCC-3’). These spe-cifically target the human HHTT exon one (which contains the CAG repeat) from the R6/2 transgene and not the endogenous mouse Htt CAG repeat (see Supplementary Table 3 for the full sequence of barcoded primers used). PCRs using the barcoded primers MS1F and MS1R should generate PCR products of 557, 722, 1157 and 1802 bp on R6/2 transgene templates containing 55, 110, 255, or 470 CAGs respectively. Each sample, i.e., one tissue from a particular mouse, was associated with a unique barcode. Fifteen microliter PCRs containing 20 ng of genomic DNA were set up as described by Ciosi et al. [38] using the following cycling conditions: (96°C, 5 min); 28 cycles of (96°C, 45 s), (59°C, 45 s) and (72°C, 3 min); and (72°C, 10 min).
Samples were processed in two batches, depending on the number of CAGs in the modal allele, with the aim to sequence the two batches on two separate PacBio RSII SMRT cells. This precaution was taken because fragment loading on PacBio RSII SMRT cells was known to be biased towards the loading of smaller molecules. The first batch corresponded to the samples with ∼55 and ∼110 CAGs, and the second batch corresponded to samples with ∼255 and ∼470 CAGs. One DNA sample, from the tail at weaning of the 20-week-old mouse with 258 CAGs (Table 1), was included in both batches to allow evaluation of potential inter-SMRT cell heterogeneity in sequencing quality.
The first batch of PCR products corresponded to the R6/2 samples with the shorter modal alleles (four or five tissues for each of the four mice with ∼55 or ∼110 CAGs, Table 1). For this first batch, five PCRs were performed (as described above) for each sample (i.e., tissue from a particular mouse). After amplification, the PCR products were pooled to obtain one pool of ∼70μl per sample. A 15μl aliquot of each of these sample-specific pools of PCR products was resolved on a 1.5% agarose gel to confirm amplification. The remaining PCR products (∼55μl per sample) corresponding to the same number of CAGs were pooled (one pool for ∼55 CAGs, one pool for ∼110 CAGs and one pool for ∼255 CAGs) and purified using a 1.4X AMPure® XP (Beckman Coulter) clean-up procedure [38] with a final elution volume equal to 1/4 the volume of beads used. The quality of the three PCR product pools (∼55, ∼110 and ∼255) post-AMPure purification was assessed by capillary electrophoresis on a Bioanalyzer (Agilent) to check that the fragments had the expected size and that primer dimers were absent. These three pools (∼55, ∼110 and ∼255 CAGs) were then combined to form an equimolar pool (i.e., the same number of molecules per sample based on Bioanalyzer-es-timated molarity), containing ≥500 ng of PCR product at ≥13 ng μl −1 as required by the PacBio RSII sequencing facility at the Earlham Institute (Norwich, UK – https://www.earlham.ac.uk).
The second batch of PCR products corresponded to the R6/2 samples with the longer modal alleles (four or five tissues for each of the four mice with ∼255 and ∼470 CAGs, Table 1). Five PCRs were performed (as described above) for each sample (i.e., tissue from a particular mouse) with ∼255 CAGs. After amplification, the PCR products were pooled to obtain one pool of ∼70μl per sample. A 7.5μl aliquot of each of these sample-specific pools of PCR products was resolved on a 1.5% agarose gel to confirm amplification. The remaining PCR products (∼60μl per sample) were then pooled and purified using the 1.4X AMPure® XP clean-up procedure described above. The quality of the pool of ∼255 CAGs PCR products was then assessed on a Bioanalyzer (Agilent) as described above.
Eight to 60 PCRs were performed (as described above) for each sample with ∼470 CAGs depending on PCR yield (i.e., more PCRs were performed for samples associated with lower PCR yield). After amplification, the PCR products were pooled to obtain one pool per sample. Each of these pools was purified using a 0.6X AMPure® XP clean-up procedure [38] with a final elution volume equal to 1/2 the volume of beads used. This lower amount of 0.6X AMPure® XP beads, relative to the amount used for the samples with ∼55, ∼110 and ∼255 CAGs, was used for the samples with ∼470 CAGs in an attempt to remove smaller fragments that would, if present, be preferentially sequenced. The quality and quantity of each of these PCR product pools were then assessed on a Bioanalyzer (Agilent) as described above. The pools of ∼470 CAGs PCR products were then combined with the pool of ∼255 CAGs PCR products to form an equimolar pool (same number of molecules per sample based on Bioanalyzer-estimated mol-arity). The equimolar pool was then concentrated using a 1.6X AMPure® XP clean-up procedure to obtain a solution containing ≥500 ng of PCR product at ≥13 ng μl −1 as required by the PacBio RSII sequencing facility at the Earlham Institute (Norwich, UK).
The 500 ng PCR product pools from batch one and two were sent separately to the Earlham Institute (Norwich, UK) for PacBio RSII library preparation and sequencing on one SMRT cell per batch. Magbead loading, 150,000 zero-mode waveguides per SMRT cell and the C4-P6 chemistry were used for the PacBio RSII SMRT sequencing. Circular consensus sequencing (CCS) reads (the consensus sequence resulting from the alignment between subreads obt-ained from a single DNA molecule [40]) were produced from the raw PacBio subreads using the SMRT Portal’ RS_ReadsOfInsert protocol (settings used: Minimum Full Passes = 2; Minimum Predicted Accuracy = 90%; Minimum Length of Reads of Insert (In Bases) = 500; Maximum Length of Reads of Insert (In Bases) = 9,000). Demultiplexing of the PacBio reads was carried out as part of the same protocol (Minimum Barcode Score = 23, which is equivalent to 99.5% calling accuracy [39]) to obtain a fastq file containing CCS reads for each sample.
Estimation of the percentage of on-target and full-length reads for each experiment
The percentage of on-target and full-length reads for each experiment (i.e., a particular number of CAGs sequenced on a particular sequencing platform) was estimated for one representative sample per experiment (the cerebellum of the older mice) by subsequently aligning the sequencing reads to reference sequences corresponding to the 5’-flank plus CAGs, the 3’-flank plus CAGs, or only to a CAG repeat (See Supplementary File 1 for more details). Reads aligned to both flanks were considered full-length. Reads aligned to at least one of the flanks or the pure CAG repeat reference sequence were considered on-target but not full-length. Reads that did not align to either flank or to the pure CAG repeat reference sequence, were considered off-target. Assuming that the most likely source of off-target reads would be non-specific PCR of mouse DNA, the most likely source of the off-target reads was determined using Blastn [41] against all Mus musculus sequences available in NCBI Nucleotide collection (nr/nt) [42]. If no Mus musculus match was obtained, we attempted to determine the most likely source of the off-target reads using Blastn [41] against all sequences available in NCBI Nucleotide collection (nr/nt) [42]. These analyses revealed: i) that nearly all reads (>99.4%) in each experiment were on-target; ii) that most reads (>66.6%) were full length, except for the MiSeq sequencing of the sample with ∼110 CAGs; and, iii) that most of the very rare off-target reads (<0.6%) were derived from primer-dimers in the MiSeq experiments, and non-specific amplification of the mouse Foxe1 locus in the PacBio experiments (Supplementary File 1).
Genotyping of HTT alleles by aligning the sequencing reads to synthetic reference sequences
The sequencing reads obtained were processed on the Galaxy instance of the University of Glasgow (https://heighliner.cvr.gla.ac.uk) [43] using an align-ment-based approach. Before alignment, Illumina sequencing adapters were trimmed from the 3’-end of the single-end forward (R1) MiSeq reads. Both types of reads (single-end forward (R1) MiSeq re-ads or PacBio CCS reads) were then aligned using BWA-MEM [44] to multiple synthetic reference seq-uences each containing a different number of CAGs. To facilitate alignment of each sequencing read to the reference sequence with the same number of CAG repeats, BWA-MEM alignment parameters were modified to use a mismatch cost markedly lower than gap-related costs [45]. This gives greater weight to the alignment of each read to the reference sequence containing the most similar number of CAGs and less weight to base-base mismatches not related to CAG length variation. The default BWA-MEM para-meters were used, except for three parameters that were set as follows: penalty for a mismatch = 1; and, gap open penalties = 2,2; gap extension penalties =2,2. Synthetic reference sequences were designed to include sequences flanking the HTT repeat up to the binding site of the PCR primers used. For the MiSeq read alignments, the longest synthetic reference sequence considered contained 123 CAGs as it is the maximum theoretical number of CAGs that could have been sequenced using the primer pair 31329/33934 and 400 nt MiSeq reads. For the alignment of the PacBio CCS reads obtained for the R6/2 samples with ∼55 and ∼110 CAGs, the longest synthetic reference sequence considered contained 200 CAGs. For the PacBio CCS reads obtained for the R6/2 samples with ∼255 and ∼470 CAGs, the longest synthetic reference sequence considered con-tained 600 CAGs. Post alignment, we discarded reads with a MAPQ score of 0 (obtained for reads aligned equally well to >1 reference sequence) and/or reads associated with an alignment that did not start in the 5’-flanking sequence of the CAG repeat. The higher the number of sequencing errors and the number of reference sequences considered for the alignment, the higher the probability of a sequencing read being aligned equally well to more than one of the synthetic reference sequences considered (i.e., MAPQ score = 0). Higher numbers of CAG repeats, and sequencing platforms associated with more seq-uencing errors, are thus expected to be associated with a higher proportion of discarded reads post alignment. The number of reads aligned to each reference sequence, after discarding the aforementioned reads, was used to generate a CAG length frequency distribution. The Galaxy workflow used is available at https://www.myexperiment.org/workflows/5147.html. Alignments of MiSeq reads to synthetic refer-ences containing ≥[(modal allele)+5 CAGs] were visually inspected in Tablet 1.19.09.03 [46] to con-firm whether they corresponded to alignments over the full length of the CAG repeat in the synthetic reference. All alignments of PacBio CCS reads were inspected in this way. PacBio CCS reads stopping within the CAG repeat or containing two concatenated copies of the HTT repeat (probably originating from the concatenation of two PCR products during the ligation of the adapters in the PacBio library preparation) were discarded. The number of CAGs was manually assigned to a sequencing read if the read was aligned to a reference sequence with at least one gap >2 nt within the CAG repeat.
PCR-capillary electrophoresis for the two R6/2 mice carrying ∼55 HTT CAG repeats
The HTT exon one repeat was PCR-amplified from 80 ng of genomic DNA using a previously described [47] human-specific PCR assay that amplifies the HTT CAG repeat from the R6/2 transgene without amplifying the mouse Htt CAG repeat. Three independent PCRs were performed per sample (i.e., tissue from each of the two R6/2 mice carrying ∼55 HTT CAG repeats). The forward primer was fluorescently labelled with 6-FAM and PCR products were resolved using the ABI 3730xl DNA analyzer (Applied Biosystems) with GeneScan 500 LIZ as internal size standard (Applied Biosystems). GeneMapper v3.7 (Applied Biosystems) was used to generate CAG repeat size distribution traces. Peaks falling below the threshold of intensity, 50 fluorescent units, were excluded from the analysis. The final CAG frequency distribution considered for each sample was the mean distribution over the three obtained for each sample, i.e., one per PCR.
Small pool-PCR
Previous small-pool PCR (SP-PCR) experiments using the striatum from the 117-week-old R6/2 mo-use with ∼55 CAGs showed that a small percentage of somatic CAG expansions are very large (>90 CAGs) [33]. It is not clear if these very large somatic CAG expansions can also be detected by capillary electrophoresis or either of the parallel-sequencing approaches in combination with bulk-PCR. To investigate this, we used SP-PCR to quantify these very large CAG expansions in the striatum sample of the R6/2 mouse with ∼55 CAGs. The SP-PCR quantification involved a combination of single-molecule PCRs (to derive the overall length distribution and precisely quantify the amount of input DNA) and PCRs using higher template concentrations (to estimate the frequency of the rarer large repeat length increases) [48]. A concentration range experiment between 5 and 50 pg of template DNA per PCR was first conducted to establish the correct quantity of template DNA to achieve single-molecule PCRs and 17.5 pg per PCR was selected. Overall, 288 PCRs with 17.5 pg (single molecule level), 132 with 150 pg, and 44 with 250 pg of genomic DNA template as starting material, were performed as previously described [33]. The PCR products obtained were resolved by agarose gel electrophoresis, Southern blotted and hybridised as previously described [33]. Individual bands (>250 CAG) were identified and sized by comparing against the 1 Kb Plus DNA Ladder (Invitrogen) using the CLIQS 1D gel analysis software (TotalLabs, UK). Assuming the number of bands is proportional to the amount of template, the 17.5 pg data were used to calculate expected bands/lane at 150 pg under assumptions of a Poisson distribution [48] and the frequency of very long expansions in the 150 pg PCR products was determined.
Data availability
The sequencing reads for this study have been deposited in the European Nucleotide Archive (ENA) at EMBL-EBI under accession number PRJEB41395 (https://www.ebi.ac.uk/ena/browser/view/PRJEB41395).
RESULTS
Qualitative assessment of the usefulness of MiSeq and PacBio SMRT sequencing to quantify somatic mosaicism in R6/2 mice with ∼55 CAGs and comparison with capillary electrophoresis
For each organ analysed, regardless of the method used to size the number of CAGs in the PCR pro-ducts (capillary electrophoresis, MiSeq or PacBio se-quencing) we could identify a mode of the CAG frequency distribution ∼55 CAGs (Fig. 1). These esti-mates are in the same range as those previously estimated by SP-PCR Southern blot and bulk-PCR capillary electrophoresis (Table 1) [33]. The percen-tage of MiSeq reads that uniquely aligned to a synthetic reference sequence (i.e., reads not discarded post alignment) was very high for both young and old mice with ∼55 CAGs (96.5% and 96.15% on average for the 6-week-old and the 117-week-old mouse respectively). These percentages were slightly lower for both mice for the PacBio CCS reads (80.91% and 81.20% on average for the 6-week-old and the 117-week-old mouse respectively). These lower percentages for the PacBio CCS reads might be exp-lained by the fact that sequencing errors are more frequent in PacBio CCS reads (Fig. 2C and Supple-mentary Figure 1) than MiSeq reads (Fig. 2A and Supplementary Figure 1), and the fact that more reference sequences were considered for the PacBio CCS reads (200 and 123 reference sequences were considered for the PacBio CCS and MiSeq reads respectively – see above). Indeed, a higher number of sequencing errors and of reference sequences considered both increase the likelihood for a sequencing read to be aligned equally well to two or more reference sequences and therefore to be discarded post-alignment. It was very clear from all the MiSeq forward alignments, as well as from all the PacBio CCS reads alignments, that all the mice with ∼55 CAGs carried an HTT allele with a pure CAG tract, seven CCGs and a typical HTT all-ele structure, i.e., an HTT allele of structure (CAG)n(CAACAG)1(CCGCCA)1(CCG)7(CCT)2 [7]. This allele structure could also be confirmed by alig-ning the reverse MiSeq reads to the synthetic ref-erence sequence (CAG)100(CAACAG)1(CCGCCA)1(CCG)7(CCT)2-3’-flank (Supplementary Figure 2). A qualitative assessment of somatic mosaicism in the different tissues of the two mice analysed can be performed by comparing the CAG frequency distributions obtained. The CAG frequency distributions obtained for different tissues in the 117-week-old mouse should be interpreted relative to the inherited progenitor allele which corresponds to the modal number of CAGs in the tail at weaning (Fig. 1). For all three approaches (capillary electrophoresis, MiSeq or PacBio sequencing), the CAG frequency distributions obtained reflect the expected age-dependent and tissue-specific nature of HTT CAG somatic mosaicism [33]. Indeed, variation in the number of CAGs was higher in the 117-week-old mouse than the 6-week-old one and was higher in the striatum than in the other tissues in the 117-week-old mouse (Fig. 1). Over the range 55 to 80 repeats, almost identical CAG frequency distributions were obtained with MiSeq and capillary electrophoresis (Fig. 1). The CAG frequency distributions obtained from the PacBio CCS reads were broadly similar to the ones obtained by MiSeq and capillary electrophoresis but were generally broader around the mode. This might be because PacBio subreads contain many indels (Fig. 2 and Supplementary Figure 1) which, in turn, leads to an inaccurate number of CAGs in the PacBio CCS reads (which are produced by the alignment between subreads obtained from a single DNA molecule [40]). Even though the percentage of uniquely aligned PacBio CCS reads (i.e., reads not discarded post alignment) was high (>76%) for all samples with ∼55 CAGs, the CAG frequency distributions obtained with these reads contained only 382 CCS reads on average (Fig. 1). The comparison with capillary electrophoresis and MiSeq sequencing demonstrates that this low number of CCS reads is associated with a high sampling error of somatic variants. Indeed, the CAG frequency distributions obtained with the PacBio CCS reads were very discontinuous, while they were very smooth with capillary electrophoresis and MiSeq sequencing (Fig. 1). These jagged discontinuous distributions still allow us to observe that there are more somatic expansions in cortex and liver than in the cerebellum (Fig. 1) but could lead to inaccurate estimates of the absolute frequency of these somatic expansions.
Fig. 1
Qualitative assessment of somatic mosaicism comparing CAG frequency distributions obtained by capillary electrophoresis, MiSeq or PacBio SMRT sequencing of bulk-PCR products obtained for different tissues of one 6-week-old and one 117-week-old R6/2 mouse with ∼55 CAGs. Capillary electrophoresis data in black, MiSeq sequencing data in white and PacBio SMRT sequencing data in grey.
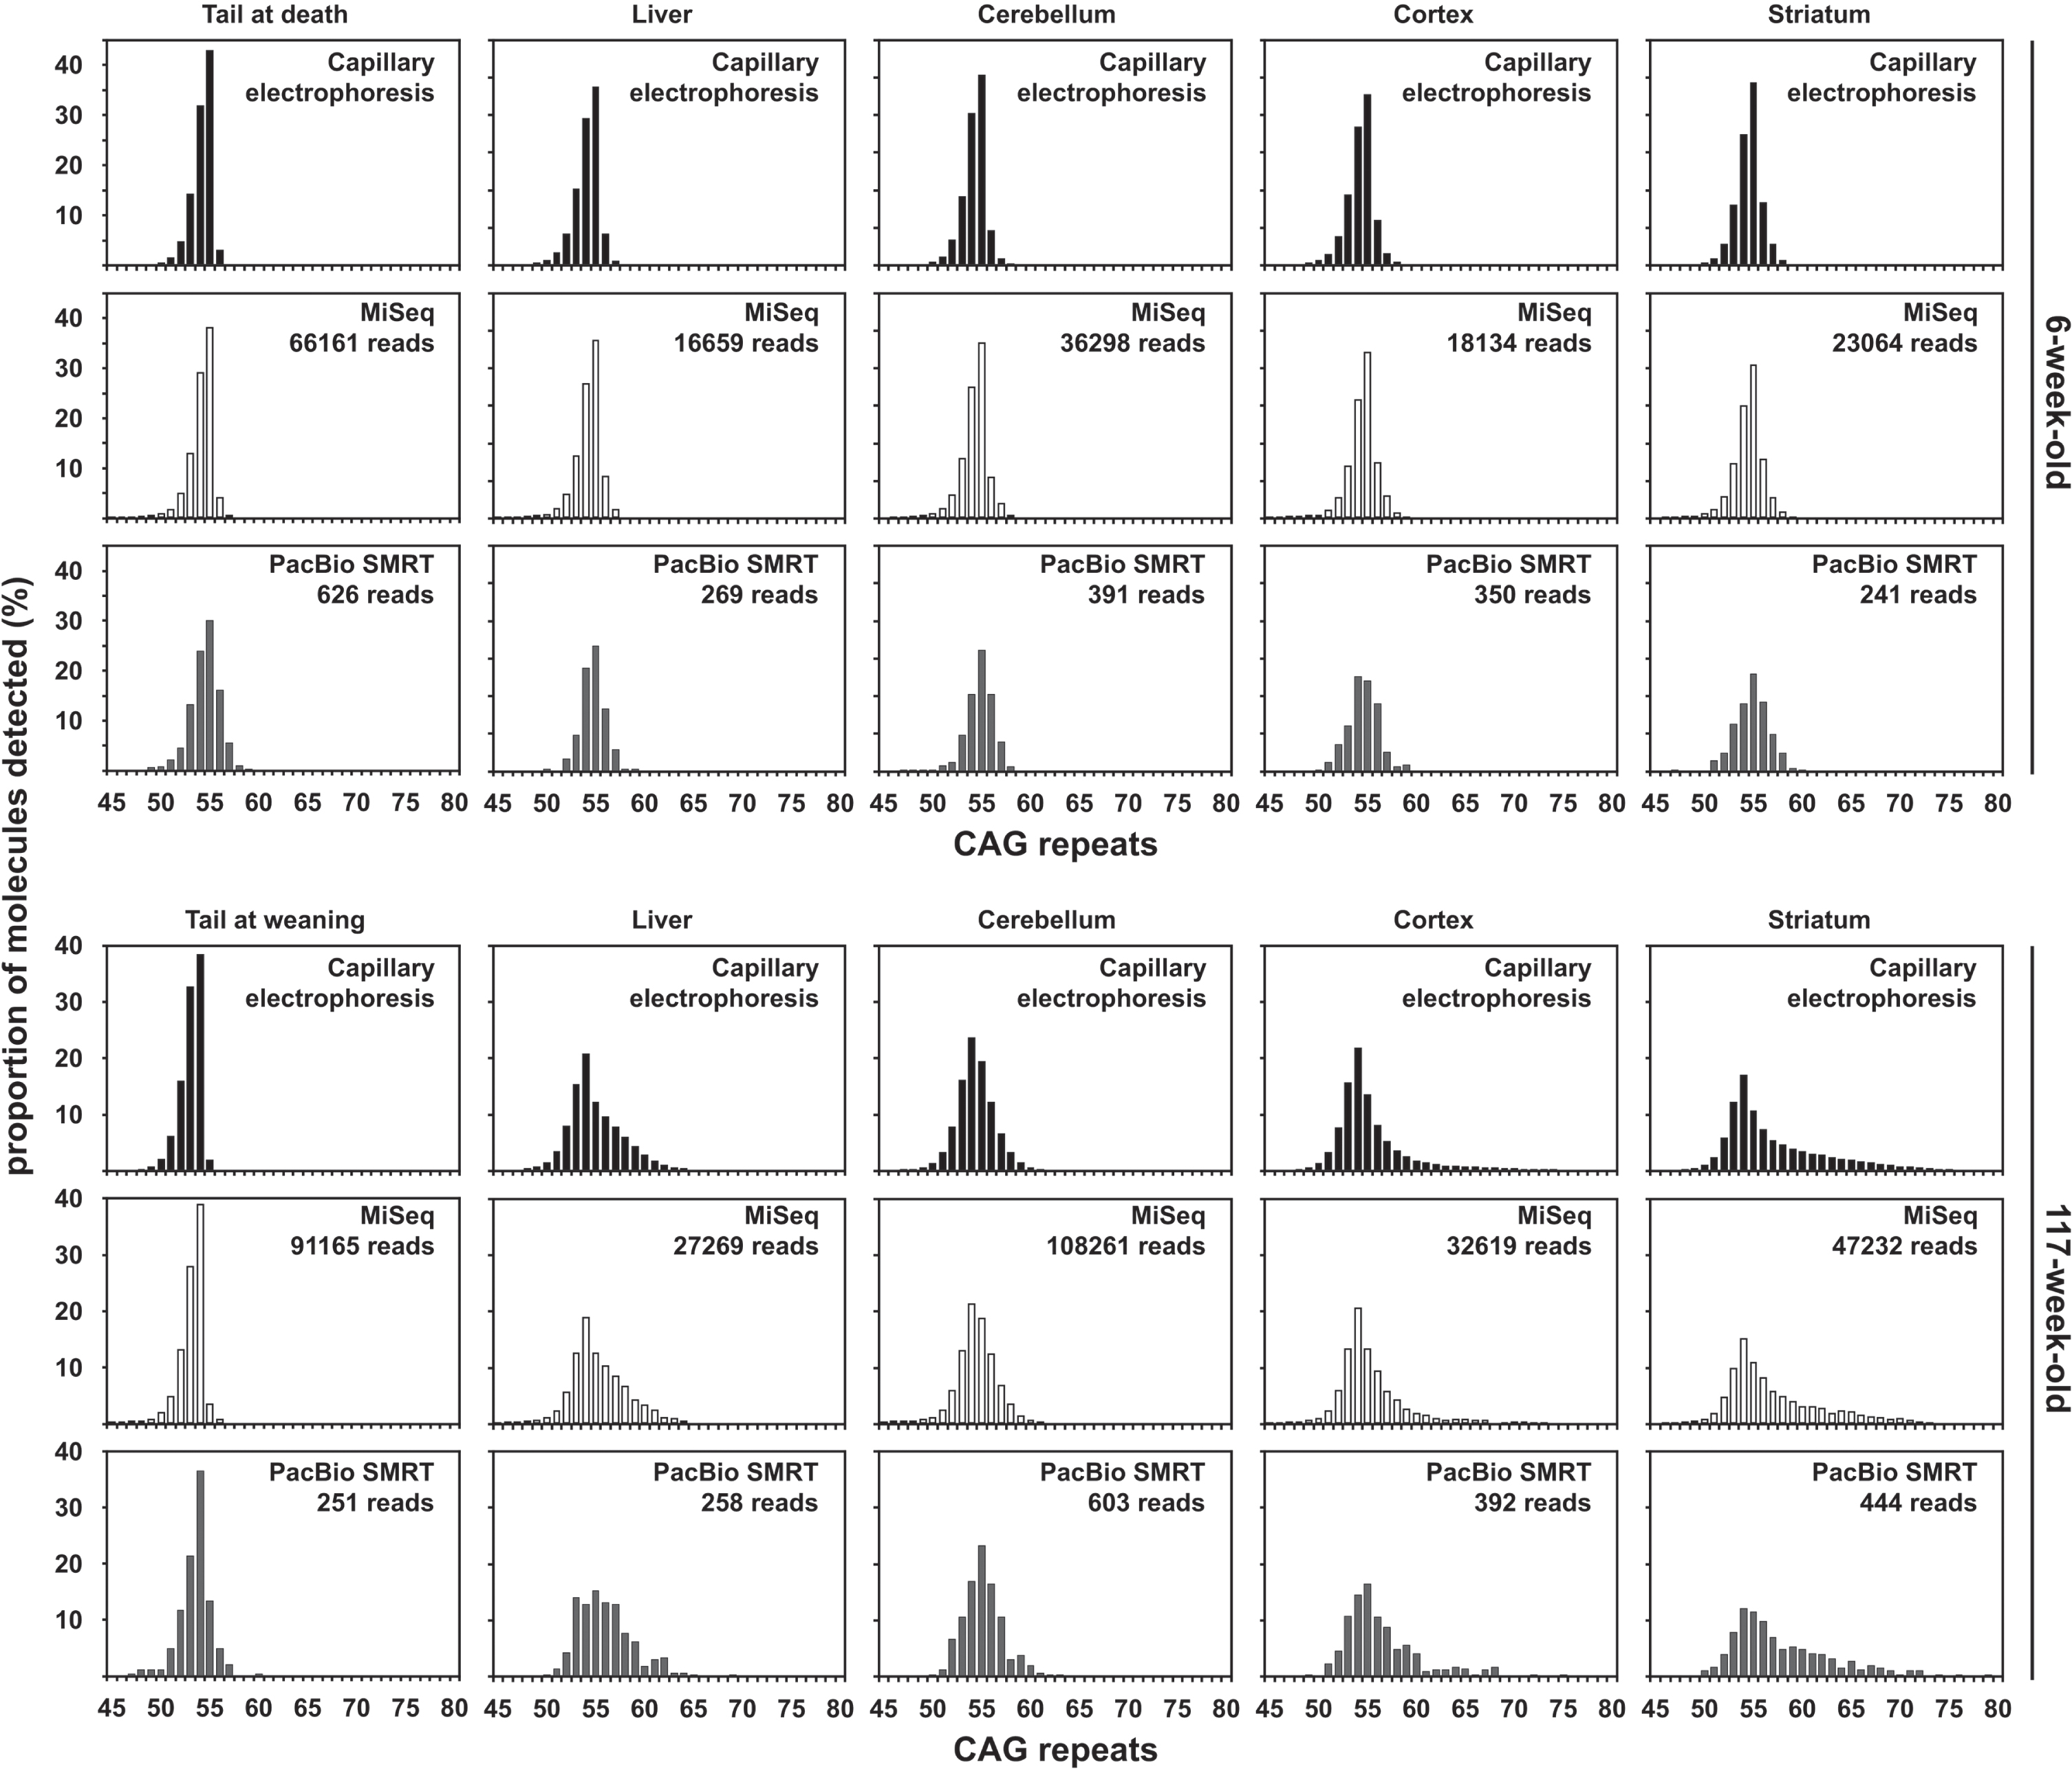
Fig. 2
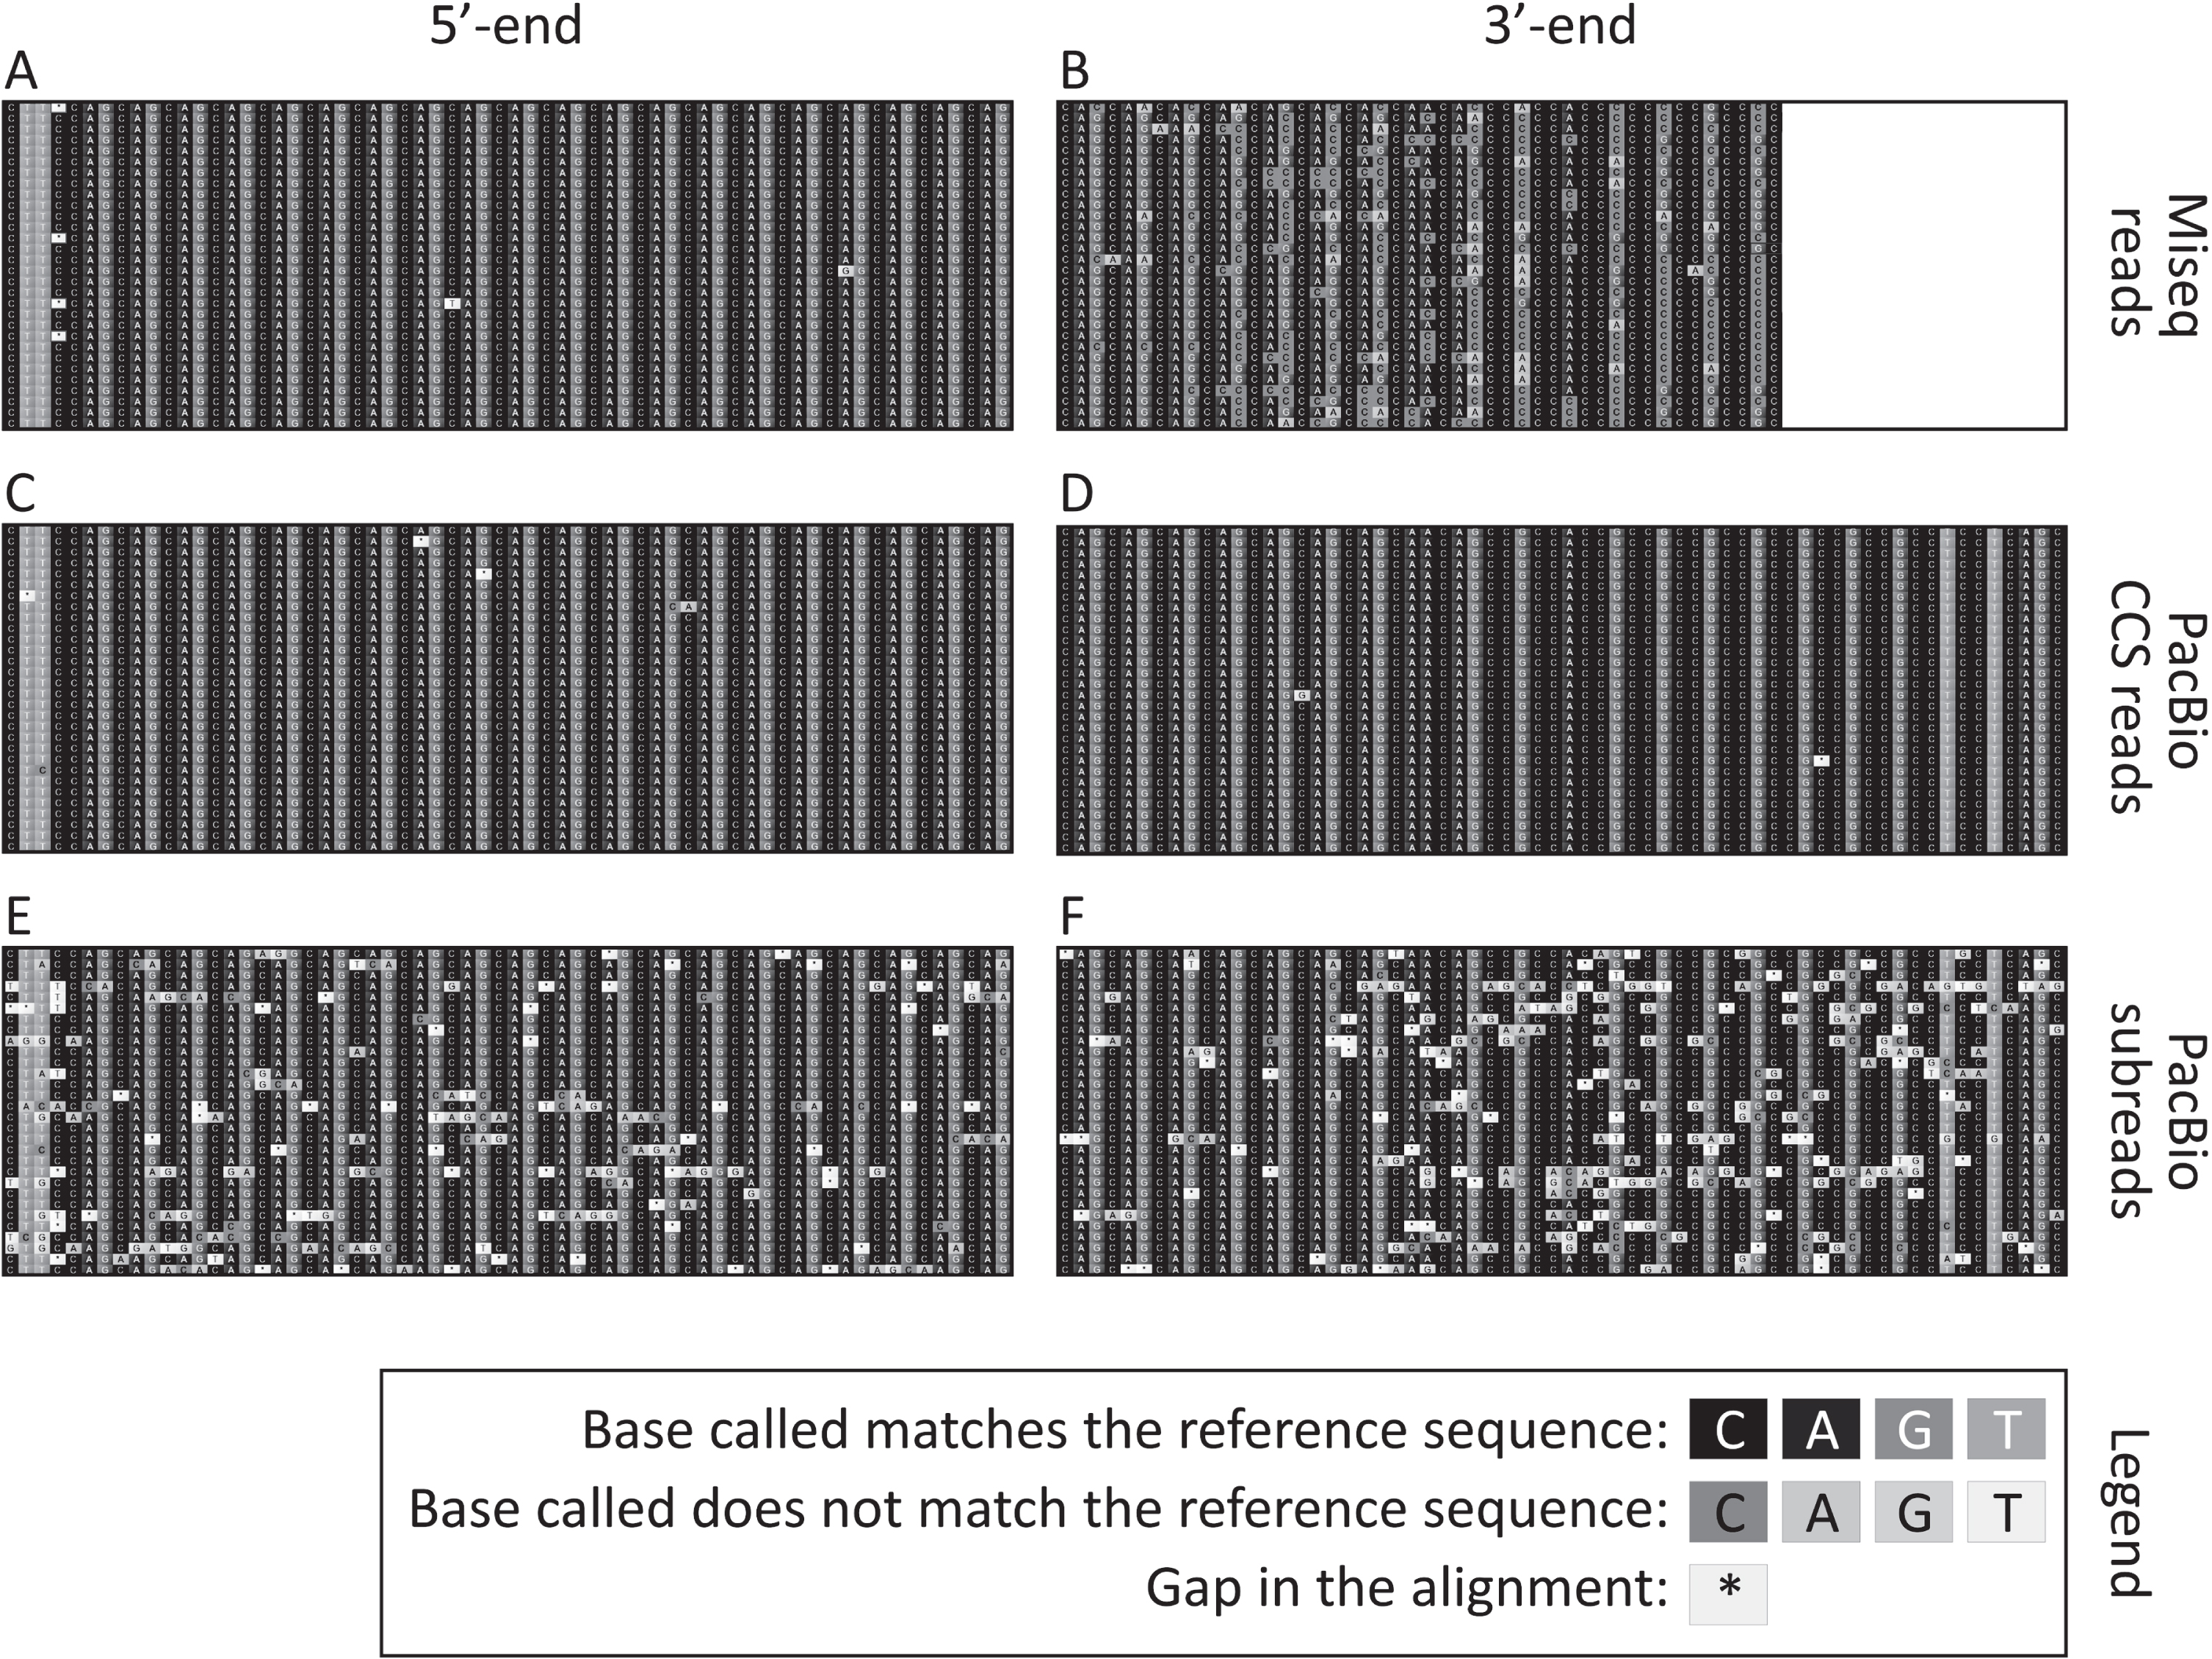
Representative sequence alignments of the 400 nt MiSeq reads (A and B), PacBio CCS reads (C and D) and PacBio subreads (E and F) uniquely aligned (i.e., reads not discarded post alignment) to a synthetic reference sequence with 115 CAGs. Alignments shown correspond to 30 sequencing reads obtained from the tail at weaning of the 20-week-old mouse with ∼110 CAGs. The part of the alignment shown corresponds to the four nucleotides in the immediate 5’–flank of the HTT CAG repeat, followed by the first 20 CAGs (A, C and E), as well as the last 7 CAGs followed by (CAACAG)1(CCGCCA)1(CCG)7(CCT)2 and the four nucleotides in the immediate 3’-flank of that sequence (B, D and F). Note that the last nucleotide sequenced for the sample with the 400 nt MiSeq reads end was the first C of the seventh CCG (B). The white box on the right-hand side of panel B represents the part of the PCR products containing 115 CAGs that could not be sequenced using 400 nt MiSeq reads.
Comparison of three bulk-PCR approaches with SP-PCR on the 117-week-old striatum sample with ∼55 CAGs
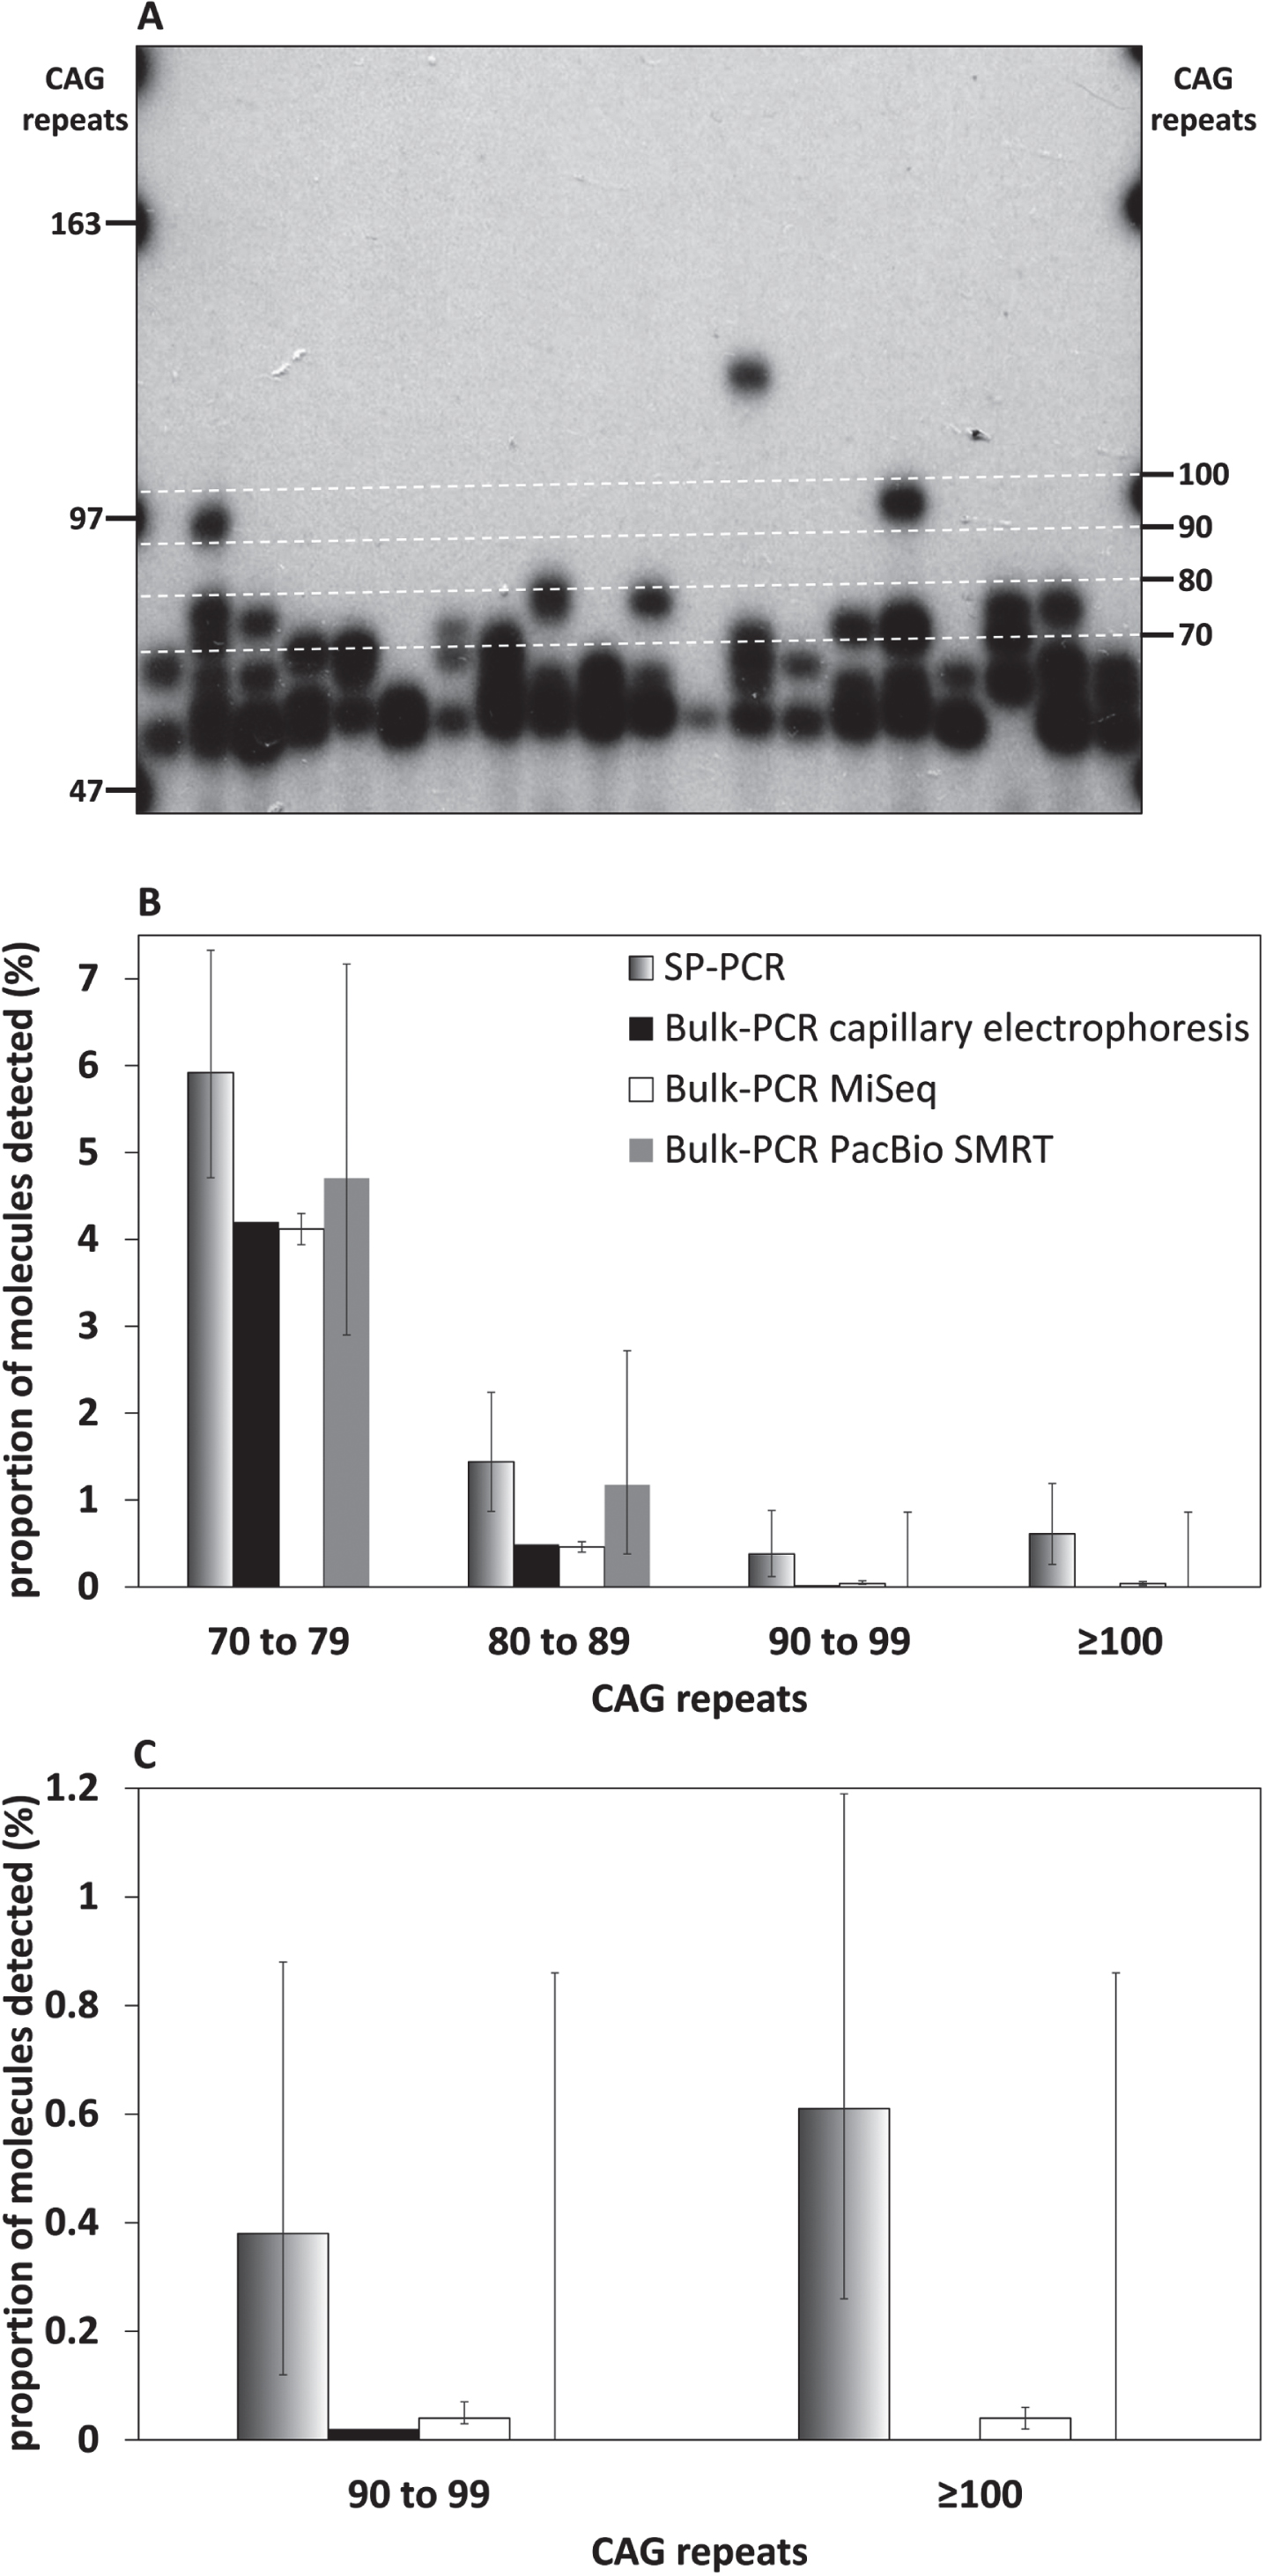
As previously shown [33], SP-PCR revealed a high frequency of somatic expansions in the striatum of the 117-week-old R6/2 mouse with ∼55 CAGs (Fig. 3A). Most of these somatic expansions can be seen on the autoradiographs as bands between 55 CAGs (i.e., size of the modal allele) and 70 CAGs (Fig. 3A). SP-PCR also detected frequent somatic expansions with 70 to 80 CAGs, and rarer somatic expansion ≥80 CAGs (Fig. 3A). The frequency of somatic expansions ≥70 CAGs detected by SP-PCR was estimated by genotyping ∼1,300 molecules across 464 SP-PCRs. This allowed a quantitative comparison between SP-PCR and the three bulk-PCR approaches presented here (capillary electrophoresis, MiSeq and PacBio SMRT) that demonstrates that large expansions are better detected by SP-PCR. The percentage of somatic expansions with 70 to 80 CAGs was similar for the three bulk-PCR approaches (∼4.5%, Figs. 1 and 3B) and lower than the one estimated by SP-PCR (∼6%, Fig. 3B). Similar percentages of somatic expansions with 80 to 89 CAGs were detected by bulk or SP-PCR (∼1%, Fig. 3B). No somatic expansions ≥90 CAGs were detected by bulk-PCR PacBio SMRT sequencing (Fig. 3B, C). The percentage of somatic expansions with 90 to 99 CAGs estimated by SP-PCR (0.38%, Fig. 3B, C) was one order of magnitude higher than that estimated by bulk-PCR capillary electrophoresis and MiSeq (0.02% and 0.04% respectively, Fig. 3B, C). No somatic expansions ≥100 CAGs were detected by capillary electrophoresis and the percentage of such somatic expansion estimated by SP-PCR (0.61%, Fig. 3B, C) was one order of magnitude higher than that estimated by bulk-PCR MiSeq (0.04%, Fig. 3B). Read depth must be considered when directly comparing the results obtained by bulk-PCR PacBio SMRT sequencing and bulk-PCR MiSeq sequencing. For example, the much lower number of PacBio CCS reads obtained for the samples with ∼55 CAGs (Fig. 1) is a very likely explanation why somatic expansion with >90 CAGs could be detected with 23,064 MiSeq reads for the striatum with 55 CAGs, but not with 444 CCS PacBio reads (Fig. 3B, C).
Fig. 3
SP-PCR can detect very large HTT CAG somatic expansions (≥90 CAGs) that cannot be detected using bulk-PCR approaches. A) Representative small pool PCR autoradiograph from 150 pg template DNA obtained for the striatum of the 117-week-old R6/2 mouse with ∼55 CAGs. The number of CAG repeats, equivalent to each molecular weight marker (left) and the boundaries of the categories represented in panel A (right), is indicated. The boundaries of the categories represented in panel A (right) are also indicated by white dashed lines. B) Percentage of large (≥70 CAGs) HTT CAG somatic expansions detected by SP-PCR (black to white gradient), or bulk-PCR capillary electrophoresis (black), bulk-PCR MiSeq (white), bulk-PCR PacBio SMRT (grey) in the striatum of the 117-week-old R6/2 mouse with progenitor allele ∼55 CAGs. C: HTT CAG somatic expansions >90 CAGs from panel B. Error bars indicate the 95% confidence intervals (they could not be estimated for the bulk-PCR capillary electrophoresis because the fluorescence units measured cannot be transformed into a count of PCR products detected).
Qualitative assessment of the usefulness of MiSeq and PacBio SMRT sequencing to quantify somatic mosaicism in R6/2 mice with ∼110 CAGs
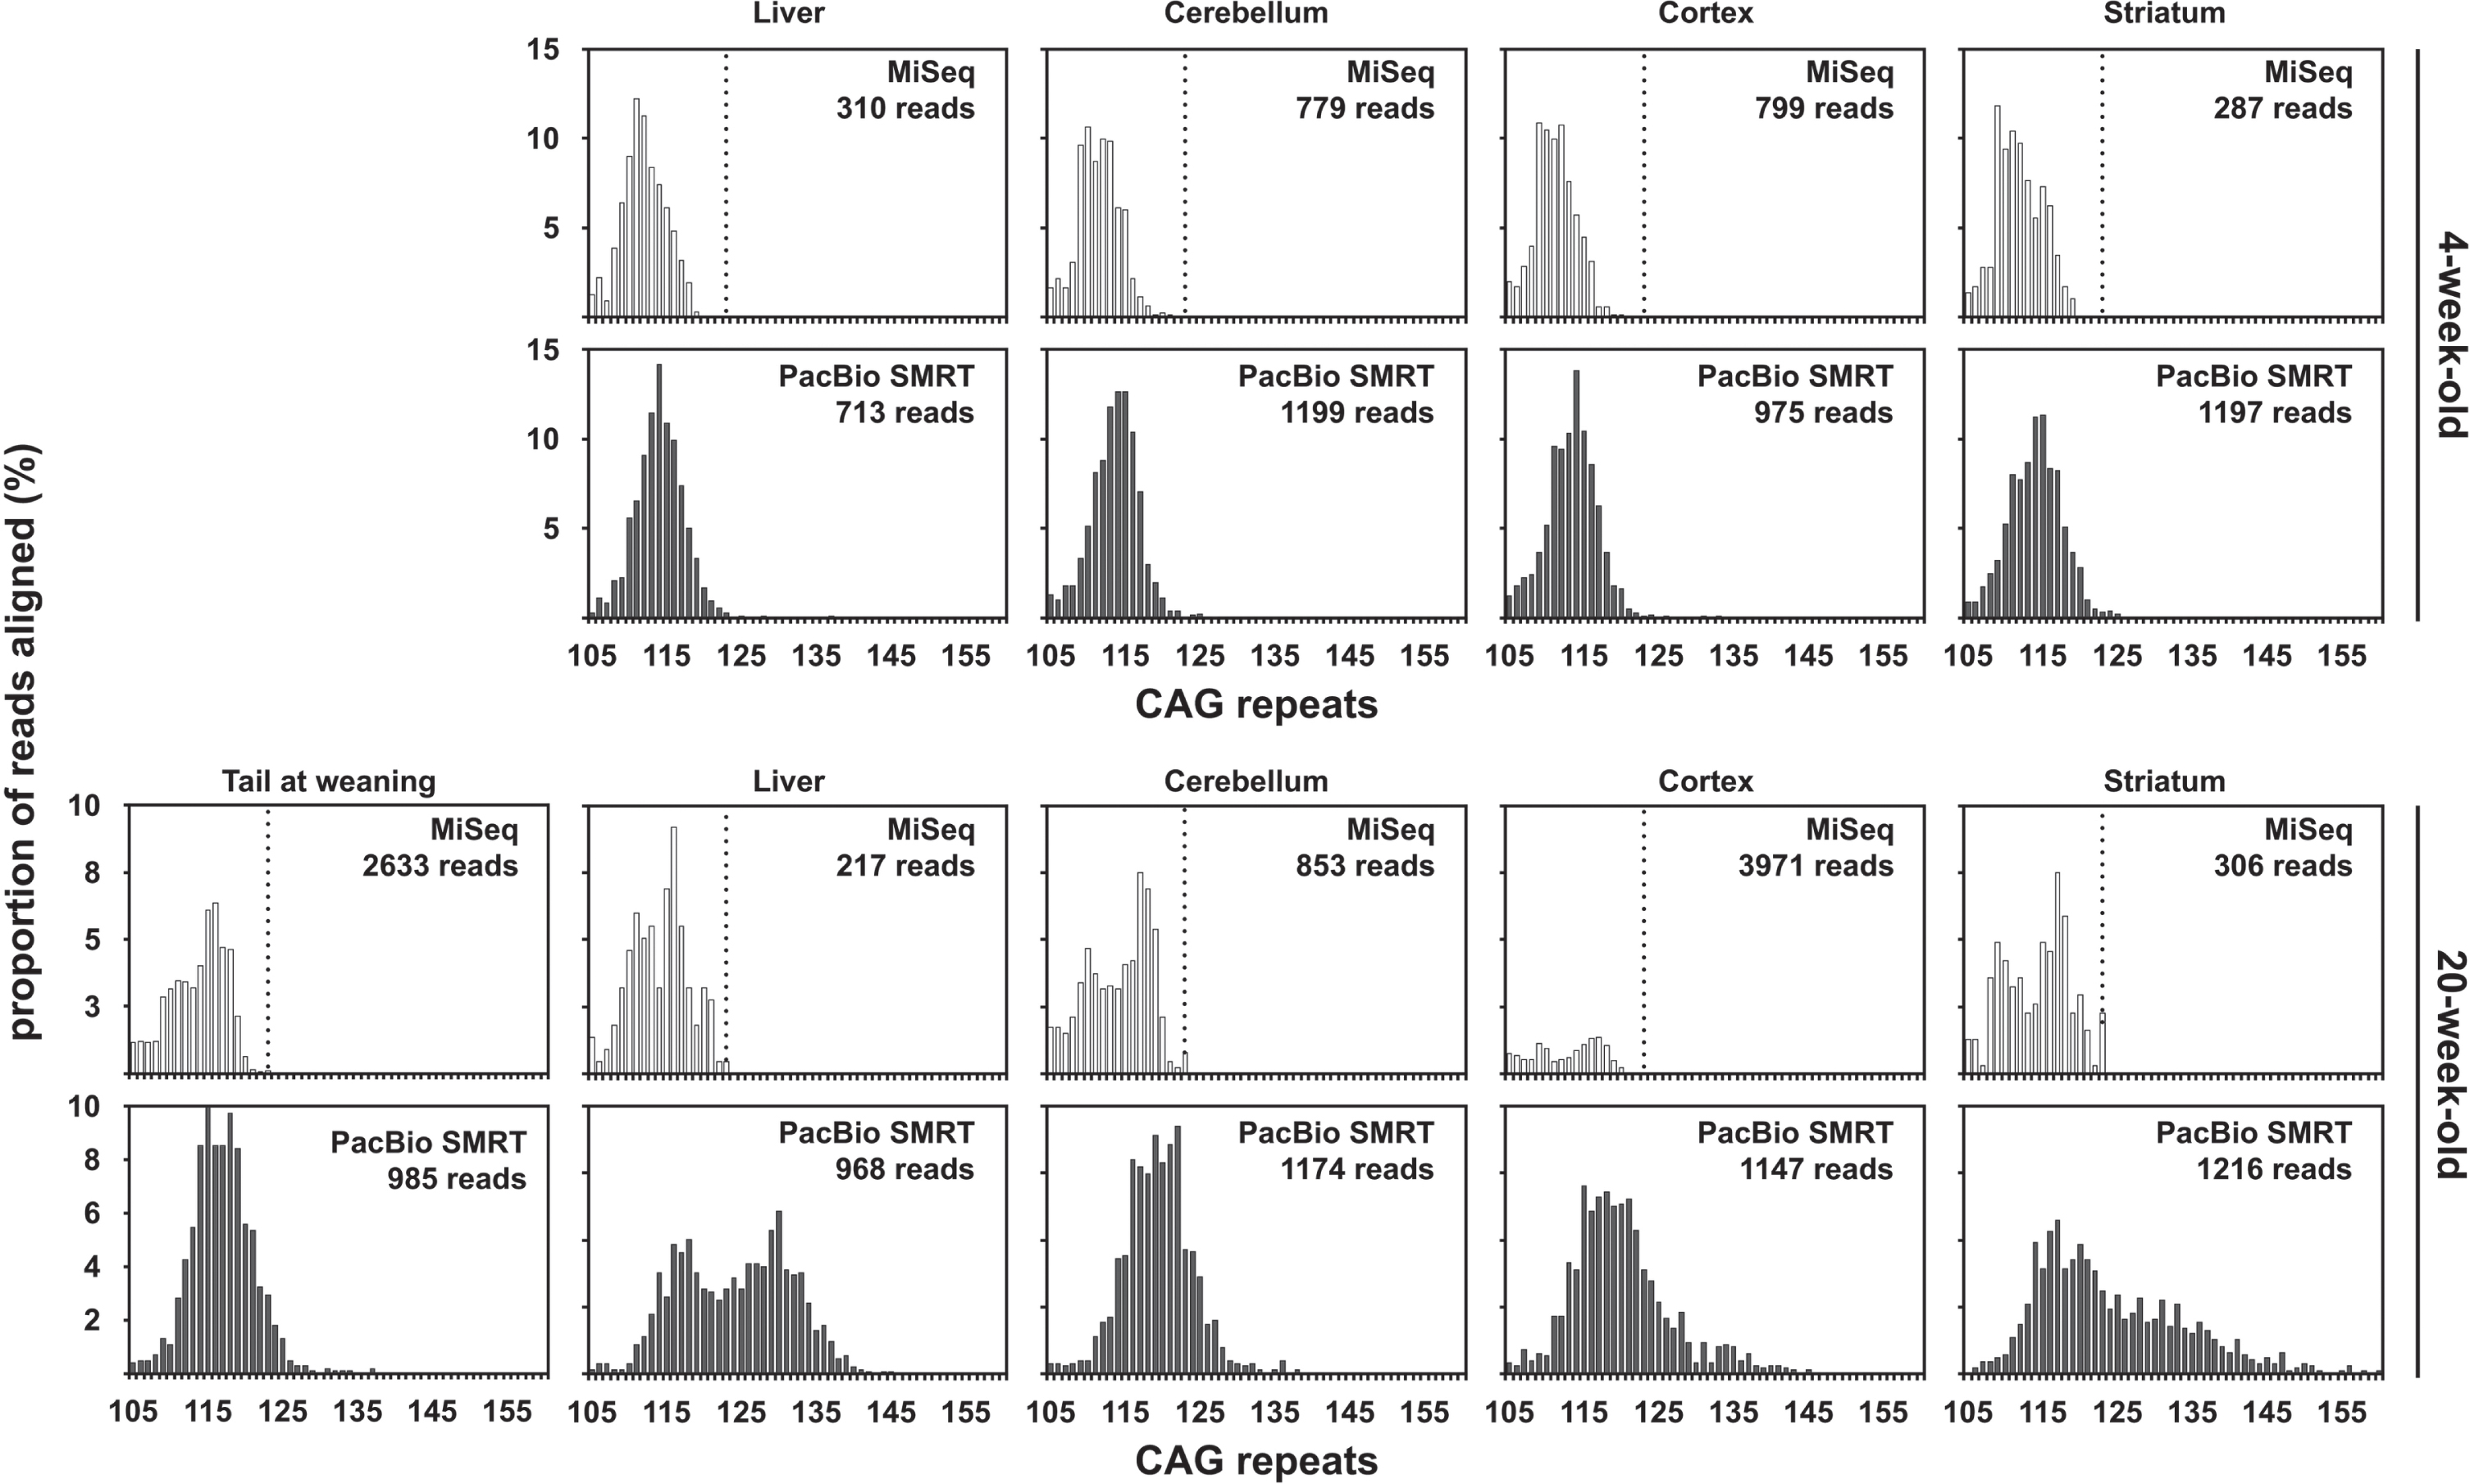
The percentage of MiSeq reads uniquely aligned to a synthetic reference sequence (i.e., reads not discarded post alignment) for samples from mice with ∼110 CAGs was much lower (24.99% and 22.10% on average for the 4-week-old and the 20-week-old mouse respectively) than observed the mice with ∼55 repeats. This is most likely due to the high frequency of sequencing errors at the end of the CAG repeat in 400 nt MiSeq reads containing ∼110 CAGs (Fig. 2B). These sequencing errors are probably caused by the fact that the base calling accuracy drops sharply at the end of the MiSeq reads, with the sharp drop in base calling accuracy happening downstream of the CAG repeat for reads with <60 CAGs and within the end of the CAG repeat for reads with ≥60 CAGs (Supplementary Figure 3). The percentage of uniquely aligned PacBio CCS reads (i.e., reads not discarded post alignment) was much higher than that of MiSeq reads and similar for samples from both mice with ∼110 CAGs (71.77% and 66.50% on average for the 4-week-old and the 20-week-old mouse respectively for the PacBio CCS reads). The mode of the CAG frequency distribution obtained with PacBio CCS reads for the liver of the 20-week-old mouse was bimodal with a mode at ∼117 CAGs (like the progenitor allele identified in the tail at weaning) and a mode at ∼130 CAGs (Fig. 4). We could identify a mode of the CAG frequency distributions between 110 and 120 CAGs for all the other organs analysed with both MiSeq and PacBio data (Fig. 4). These estimates are in the same range as the ones previously estimated by SP-PCR Southern blot and bulk-PCR capillary electrophoresis (Table 1) [33]. However, it must be noted that the mode of the CAG distributions obtained using the MiSeq read was ∼5 CAGs smaller than the ones obtained using the PacBio CCS reads. Given the amount of somatic mosaicism in the samples analysed (as illustrated by the CAG frequency distributions obtained using the PacBio CCS reads), we would have expected a large proportion of the MiSeq reads to align to references sequences with ≥120 CAGs. In particular, all reads containing ≥123 CAGs should have aligned to the reference sequence containing 123 CAGs, the theoretical maximum number of CAGs that could have been sequenced with the PCR primer pair used and a 400 nt MiSeq read. However, only a small proportion of the MiSeq reads aligned to references sequences with ≥120 CAGs. Together with the low percentage of MiSeq reads aligned (∼23%) and the high frequency of sequencing errors at the end of the 400 nt MiSeq reads, this illustrates that the CAG length frequency distributions obtained for the samples from mice with ∼110 CAGs using MiSeq (Fig. 4) cannot be relied upon for the estimation of modal allele sizes or the quantification of somatic expansions. The maximum number of CAGs that can reliably be sequenced using 400 nt MiSeq reads probably lies ∼115 CAGs.
Fig. 4
CAG frequency distributions obtained by MiSeq or PacBio SMRT sequencing of bulk-PCR products obtained for different tissues of one 6-week-old and one 117-week-old R6/2 mouse with ∼110 CAGs. MiSeq sequencing data in white and PacBio SMRT sequencing data in grey. The dotted line on the MiSeq sequencing data panels indicates 123 CAGs, which is the theoretical maximum number of CAGs that could have been sequenced using the PCR primer pair (31329/33934) and a 400 nt MiSeq read.
It was very clear from all the PacBio CCS re-ads alignments that all mice with ∼110 CAGs car-ried a typical HTT allele with a pure CAG tract and seven CCGs (i.e., HTT allele of structure (CAG)n(CAACAG)1(CCGCCA)1(CCG)7(CCT)2 [7]). Alth-ough it was clear from the forward MiSeq read ali-gnment (Fig. 2A, B) that the CAG tract was pure, the many sequencing errors at the ends of these reads (Fig. 2B) did not allow us to confidently determine the allele structure. However, it was possible to det-ermine the allele structure by aligning the reverse MiSeq reads to the synthetic reference sequence (CAG)100(CAACAG)1(CCGCCA)1(CCG)7(CCT)2-3’-flank (Supplementary Figure 2).
As previously illustrated for the mice with ∼55 CAGs, a qualitative assessment of somatic mosaicism in the different tissues of the two mice analysed should be possible by comparing the CAG frequency distributions obtained. The CAG frequency distributions obtained for different tissues in the 20-week-old mouse should be interpreted relative to the progenitor allele which corresponds to the modal number of CAGs in the tail at weaning (Fig. 4). The CAG frequency distributions obtained with the PacBio CCS reads reflect the expected age-dependent and tissue-specific nature of HTT CAG somatic mosaicism [33]. Indeed, the variation of the number of CAGs in the PacBio data was higher in the old mouse than the young one, and was higher in the striatum than in the other tissues in the old mouse (Fig. 4). However, the CAG frequency distributions obtained with the PacBio CCS reads were very jagged and discontinuous (Fig. 4). These jagged discontinuous distributions still allowed us to observe that there are more somatic expansions in cortex and liver than in the cerebellum (Fig. 4), but could lead to inaccurate estimates of the frequency of these somatic expansions. On the contrary, the MiSeq data failed to capture any of the expected age-dependent and tissue-specific variation in somatic mosaicism of the HTT CAG repeat (Fig. 4).
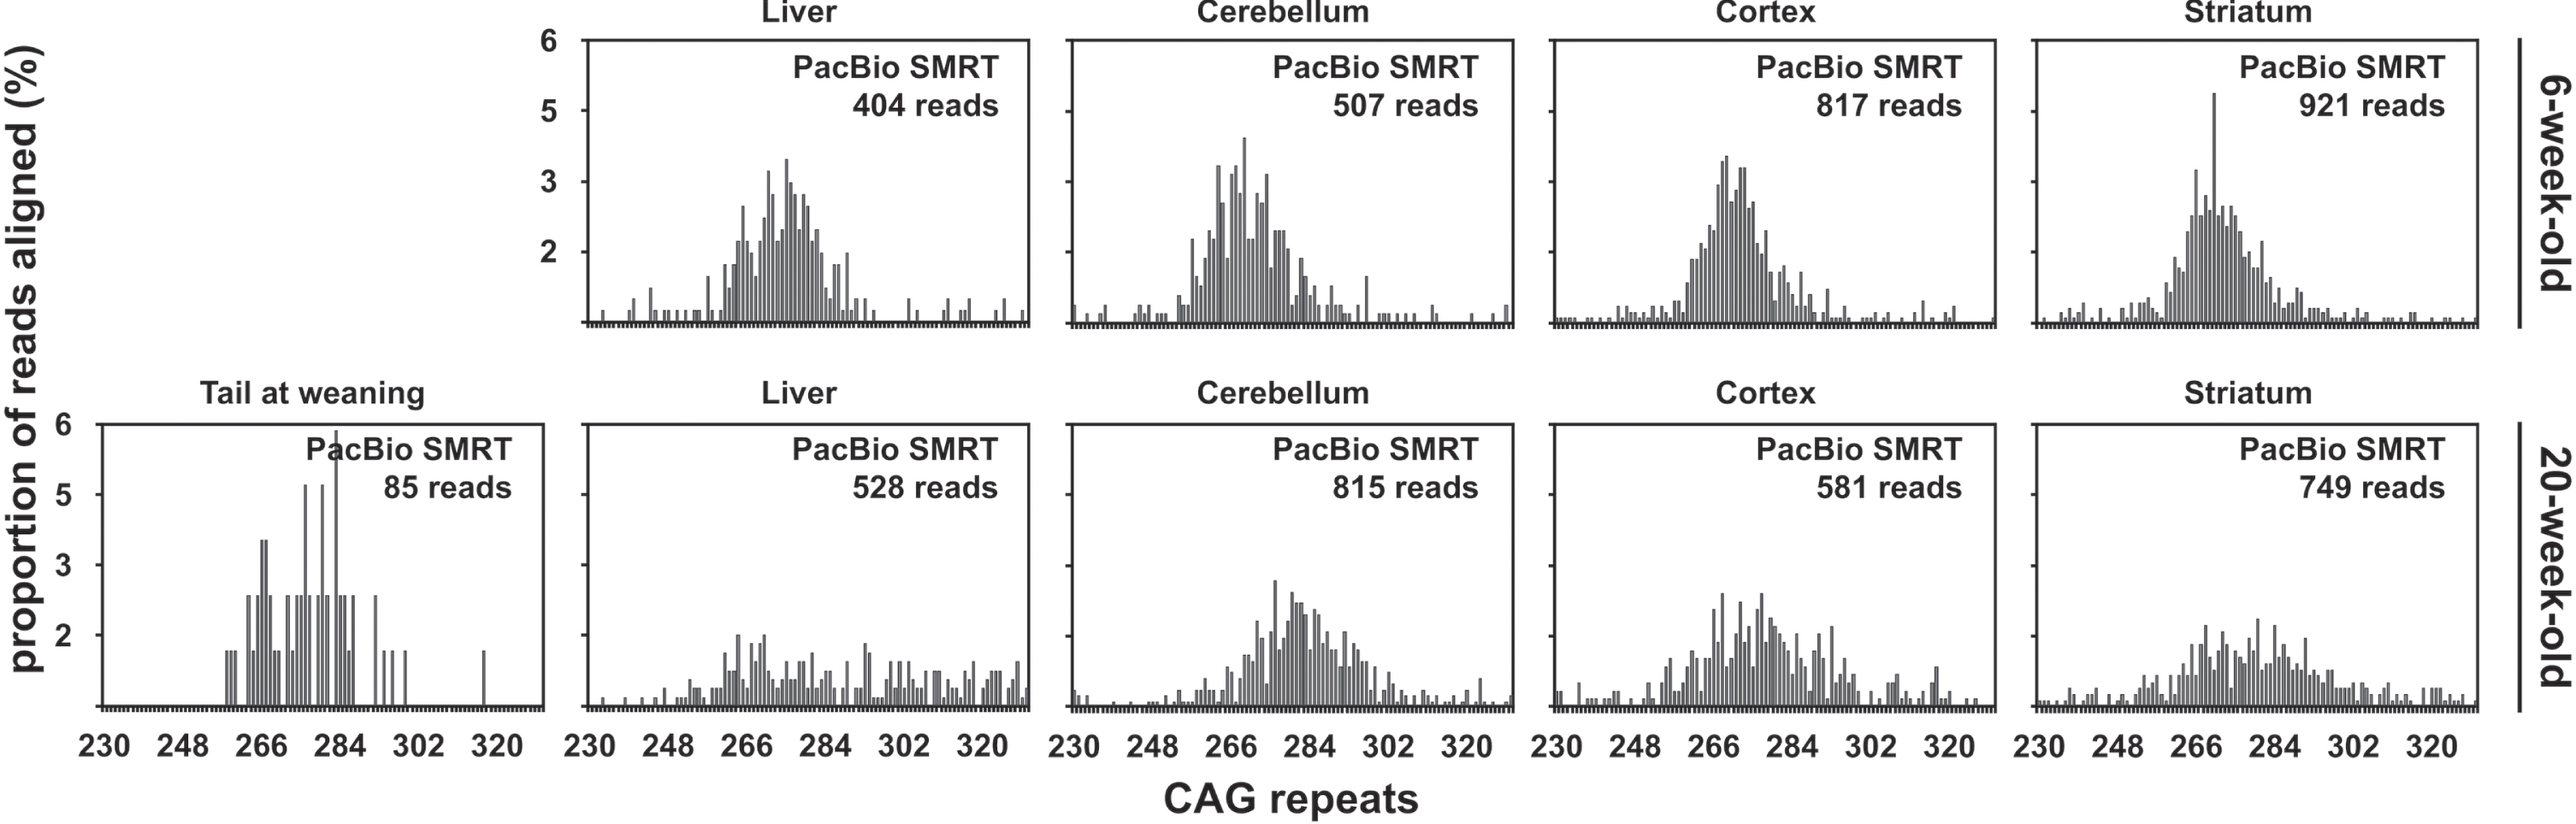
Qualitative assessment of the usefulness of PacBio sequencing to quantify somatic mosaicism in R6/2 mice with ∼255 CAGs
PCR products for one sample, the cerebellum of the 6-week-old mouse with ∼255 CAGs, were gen-erated and sequenced independently in each of the two PacBio RSII runs performed. For that sample, the percentage of PacBio CCS reads that could be aligned to synthetic reference sequences was higher in PacBio run one than for PacBio run two (28.45% and 4.96%). This is likely a consequence of the fact that the sequencing quality from the second PacBio run was lower (Supplementary File 2). The percentage of PacBio CCS reads aligned to a syn-thetic reference sequence was similar for samples from both mice with ∼255 CAGs (4.76% and 4.65% on average for the 6-week-old and the 20-week-old mouse respectively). No clear mode could be identified in the CAG frequency distribution obtained for the liver of the 20-week-old mouse. For all the other organs analysed, we could identify a mode of the CAG frequency distribution of ∼270 CAGs (Fig. 5). These estimates are in the same range as the ones previously estimated by SP-PCR Southern blot and bulk-PCR capillary electrophoresis (Table 1) [33]. It was very clear from all the PacBio CCS read alignments that both mice with ∼255 CAGs carried a typical HTT allele with a pure CAG tract and seven CCGs (i.e., HTT allele of structure (CAG)n(CAACAG)1(CCGCCA)1(CCG)7(CCT)2 [7]). The CAG frequency distributions obtained for the mouse samples with ∼255 CAGs with the PacBio CCS re-ads broadly reflect the expected age-dependent and tissue-specific nature of the HTT CAG somatic mos-aicism [33]. Indeed, the variation of the number of CAGs in the PacBio data was higher in the 20-week-old mouse than the 4-week-old, and was higher in the striatum than in the other tissues in the old mouse (Fig. 5). However, due to the low read depth obtained (∼600 reads uniquely aligned on average per sample, Fig. 5), the CAG frequency distributions obtained with the PacBio CCS reads were very discontinuous (Fig. 5). This would probably lead to inaccur-ate estimates of the frequency of these somatic expansions. Obtaining CAG frequency distributions with a number of reads an order of magnitude higher would probably be necessary to more accurately characterise the inter-tissue differences in somatic mosaicism [33]. The majority (∼70% for PacBio run one and ∼95% for PacBio run two) of the PacBio CCS reads produced for the samples with ∼255 CAGs did not align to a unique reference sequence, most likely as a function of the within-repeat indels [49].
Fig. 5
CAG frequency distributions obtained by PacBio SMRT sequencing of bulk-PCR products obtained for different tissues of one 6-week-old and one 20-week-old R6/2 mouse with ∼255 CAGs. The tail at weaning data for the 20-week-old mouse is not shown because only two reads with 266 and 274 CAGs were obtained post-alignment and post-discard.
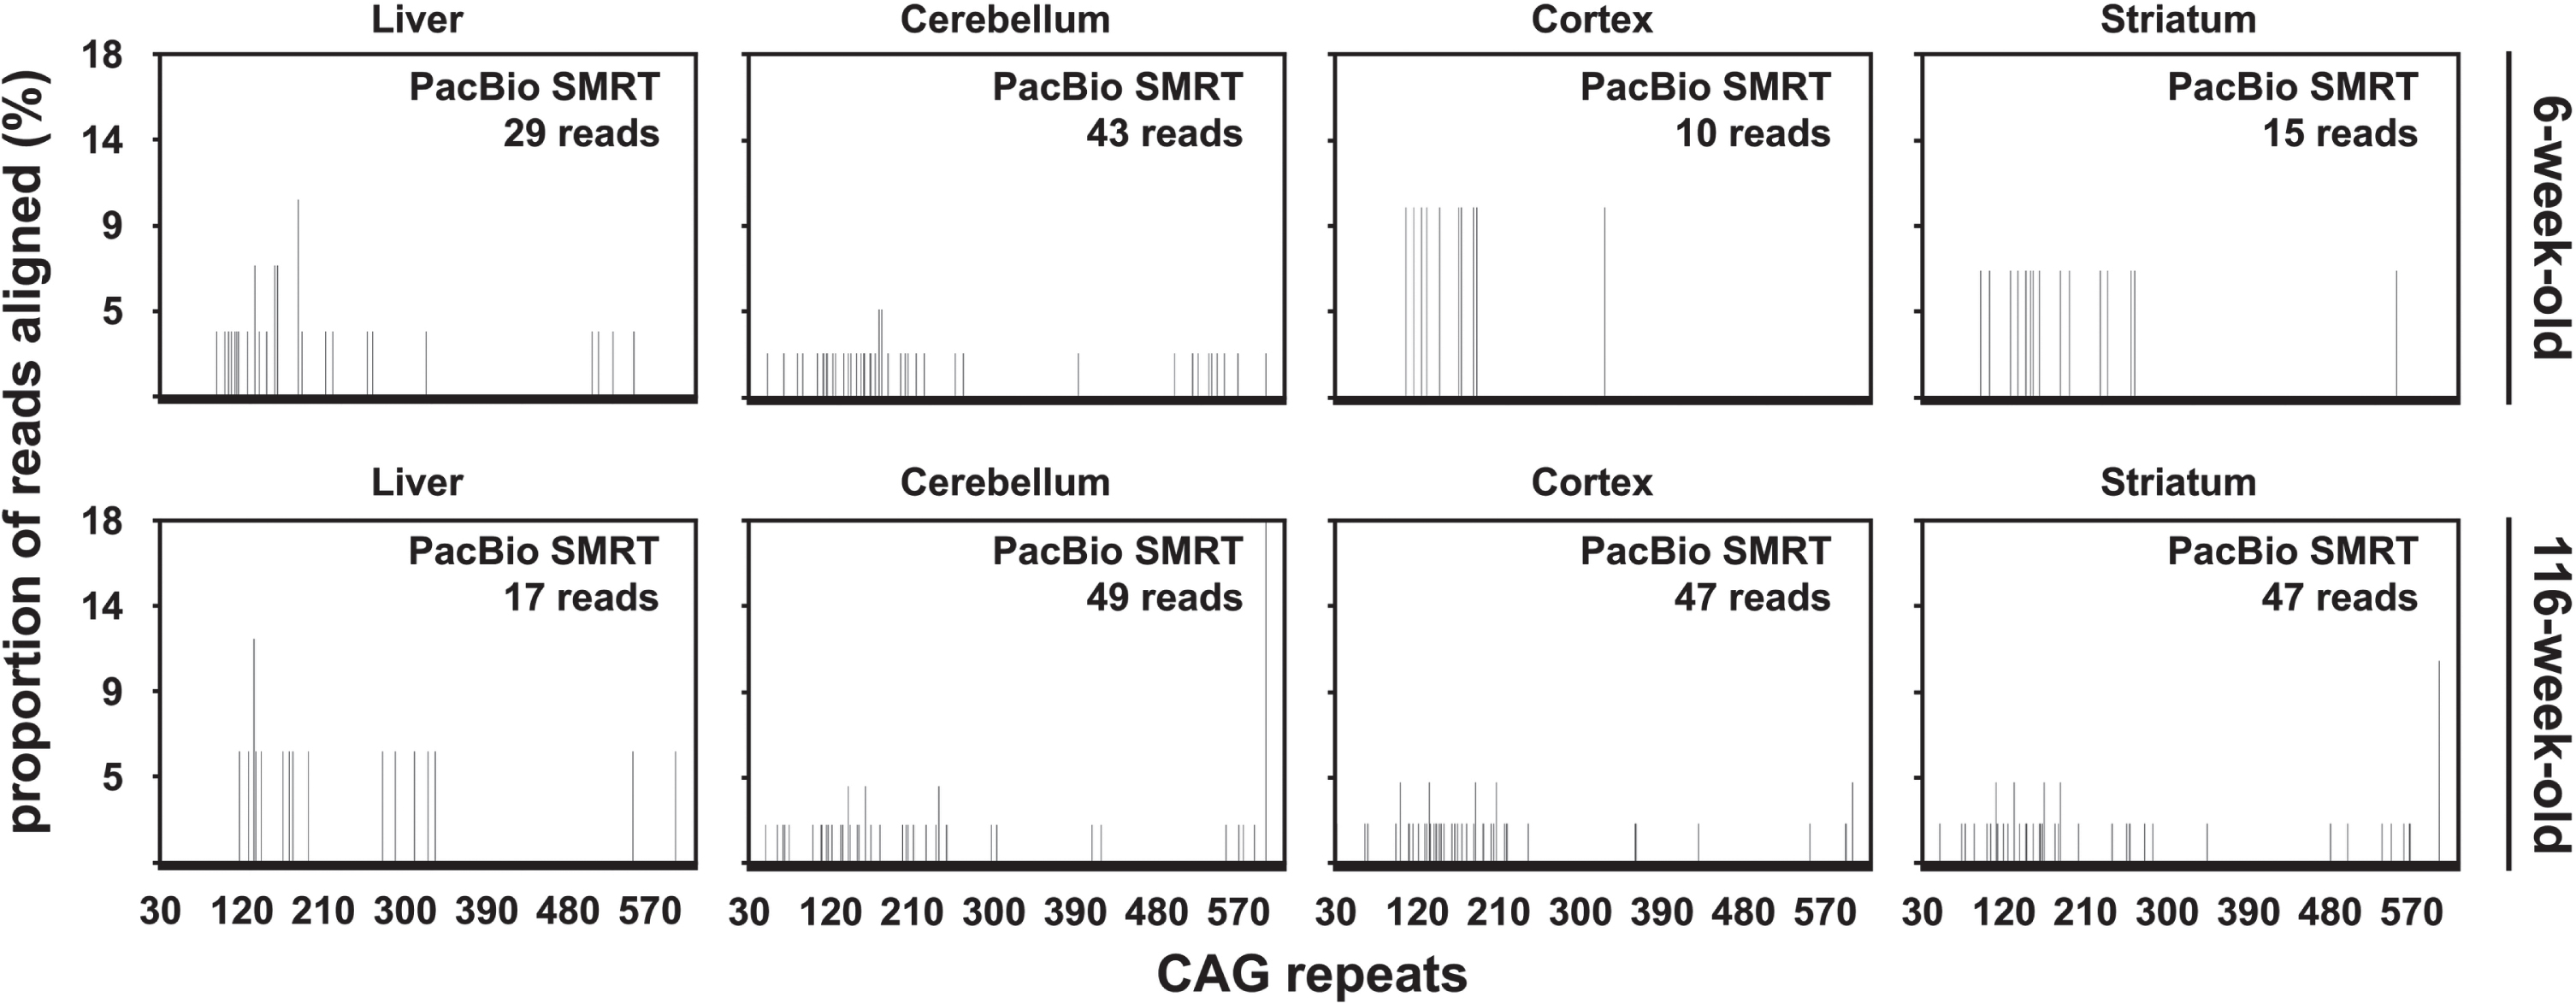
Qualitative assessment of the usefulness of PacBio sequencing to quantify somatic mosaicism in R6/2 mice with ∼470 CAGs
The percentage of PacBio CCS reads aligned to a synthetic reference sequence was similar for samples from both mice with ∼470 CAGs (5.85% and 7.07% on average for the 6-week-old and the 116-week-old mouse respectively). Strikingly, most of the aligned PacBio CCS reads contained between 100 and 200 CAGs (Fig. 6). This is in stark contrast with the CAG repeat distributions previously obtained on the same DNA samples by both SP-PCR and bulk-PCR capillary electrophoresis which had modes ∼500 CAGs (Table 1) [33]. To investigate if this distribution was caused by the data processing post-sequencing, we compared the length distribution of the PCR products before sequencing with the length distribution of the unprocessed PacBio subreads and CCS reads. This revealed that most of the subreads and CCS reads were much shorter than expected based on the size of the PCR products produced for PacBio SMRT sequencing of these samples. Indeed, the estimated modal allele length of the PCR products was ∼577 CAGs (Supplementary Figure 4A) while the mode of the subreads and CCS read length distribution was between 150 and 200 CAGs (Supplementary Figure 4B, C). The skew to-wards lower (<300) CAG lengths observed in the frequency distributions obtained from the alignment of CCS reads (Fig. 6) is thus not caused by the data processing post-sequencing, but corresponds to loading and/or sequencing bias towards smaller fragment on the PacBio RSII sequencing platform. It must be noted, however, that some PacBio CCS reads contained >450 CAGs (Fig. 6). To confirm that PacBio SMRT sequencing was indeed useful to sequence HTT alleles with ∼500 CAGs, we pooled all the PacBio CCS reads obtained for all the tissues considered for each mouse with ∼470 CAGs and collected all the CCS reads longer than 1,740 nt (these reads should contain >450 CAGs). This res-ulted in the collection of 131 and 197 CCS reads for the 6-week-old and the 116-week-old mouse respectively. The collected CCS reads were aligned as described before, except that a single synthetic reference containing 550 CAGs was used. Of these reads, 114 out of 131, and 151 out of 197, CCS re-ads could be aligned to the reference sequence containing 550 CAGs for the 6-week-old and the 116-week-old mouse respectively. Visualisation of the alignment using Tablet [46] revealed that most of the reads obtained from the 6-week-old mouse contained the full sequence of the PCR product while most reads obtained from the 116-week-old mouse contained only one flank (Supplementary Figure 5). This indicates that the CAG repeat in these later reads is longer than in the reference sequence (i.e., 550 CAGs). The presence of germline interruptions should be clearly identifiable in such an alignment as shown for DMPK alleles with ∼400 CAG•CTG repeats [30]. Both alignments clearly showed that both mice with ∼470 CAGs carried a typical HTT allele with a pure CAG tract and seven CCGs (i.e., HTT allele of structure (CAG)n(CAACAG)1(CCGCCA)1(CCG)7(CCT)2 [7]). This thus demonstrates that PacBio SMRT sequencing of HTT alleles with ∼500 CAGs is possible.
Fig. 6
CAG frequency distributions obtained by PacBio SMRT sequencing of bulk-PCR products obtained for different tissues of one 6-week-old and one 116-week-old R6/2 mouse with ∼470 CAGs.
The PacBio sequencing data illustrates the effect of the number of inherited CAG repeats on somatic expansion
Somatic mosaicism of the HTT CAG repeat depends on age, but also on the number of inherited CAG repeats [7, 8]. An illustration of that effect can be seen in the PacBio sequencing data obtained for the older R6/2 mice analysed, where we can see more somatic expansions in some samples with a larger number of inherited CAG repeats. Indeed, we see a longer tail of more frequent somatic expansions in the cortex and striatum of the mouse with ∼255 CAGs (20-week-old, Fig. 5) compared to the mouse with ∼110 CAGs (20-week-old, Fig. 4). Moreover, despite the older mouse with ∼110 CAGs being nearly two years younger than the older mouse with ∼55 CAGs, the PacBio sequencing data shows that there were more somatic expansions in the liver of the 20-week-old mouse with ∼110 CAGs (Fig. 4) than in the 117-week-old mouse with ∼55 CAGs (Fig. 1).
DISCUSSION
Bulk-PCR sequencing
In the present study, we have applied bulk-PCR sequencing approaches to sequence HTT CAG repeat expansions and to quantify the associated somatic mosaicism. In doing so, we have shown that both MiSeq and PacBio technologies can be used to genotype the HTT CAG repeat and to quantify somatic mosaicism. Nevertheless, both sequencing platforms have limitations. For MiSeq, the main limitation is read length. In the present study, we have generated MiSeq sequencing libraries by PCR using a primer in the immediate 5’–flanking DNA of the CAG repeat. This, in combination with MiSeq reads of 400 nt, is expected to limit the sequencing to 123 CAGs. We have shown that, because of this upper limit, the MiSeq approach applies to sequencing HTT alleles containing up to ∼115 CAGs but not to the estimation of modal allele length of ∼110 CAGs and/or the quantification of the somatic mosaicism of such alleles. Considering this upper limit of 123 CAGs, the largest modal alleles for which somatic mosaicism will reliably be quantifiable using bulk-PCR MiSeq are thus probably ∼90 CAGs. This prediction assumes that there would be enough leeway between a progenitor of ∼90 CAGs and the upper sequencing limit of 123 CAGs to reliably quantify somatic expansions. We have also shown that the reverse MiSeq reads allow the determination of the HTT allele structure (presence/absence, organisation and number of CAA, CCA, CCG and CCTs 3’ of the CAG repeat) as accurately in samples with ∼110, as in samples with ∼55 CAGs (Supplementary Figure 2). This thus seems to indicate that the quality of the reverse reads is independent of the number of CAGs. It should thus be possible to use reverse MiSeq reads to determine the allele structure of any HTT alleles that can be PCR amplified.
It is unclear whether larger CAG repeat length and/or inter-run variability inherent to the PacBio technology is/are responsible for the lower sequencing quality associated with PacBio run 2 relative to PacBio run 1 (Supplementary File 2). This difference in sequencing quality between the two runs warrants the future use of a sequencing control, similar to the Illumina PhiX control [50], for PacBio sequencing. Nevertheless, we have shown that the PacBio platform can be used to sequence HTT alleles of up to ∼550 CAGs. Based on studies of other unstable CAG•CTG repeat loci, it is likely possible to sequence an even higher number of HTT repeats with PacBio SMRT sequencing. Indeed, Ardui [51] and Hafford-Tear et al. [31] used PacBio to sequence respectively DMPK and TCF4 CAG•CTG somatic expansions containing up to about 1,500 repeats. However, the bulk-PCR approach we have used in the present study is not appropriate to estimate the modal number of CAGs in tissues where it is very large (like the samples with ∼470 CAGs used in the present study). Our PacBio data for such samples demonstrate that the loading/sequencing bias on PacBio RSII SMRT cells produces CAG frequency distributions biased towards fragments containing <300 CAGs. This bias is similar to the one described by Ardui [51] for the DMPK CAG•CTG repeat where PacBio SMRT sequencing of bulk-PCR fragments with a mode corresponding to ∼750 CAG•CTGs produced reads with a mode at ∼255 CAG•CTGs. Data presented here demonstrate, however, that PacBio sequencing would be useful to quantify somatic mosaicism in individuals with progenitor alleles containing up to ∼250 CAGs.
Comparison of three bulk-PCR approaches with SP-PCR
The CAG frequency distributions obtained using bulk-PCR followed by capillary electrophoresis or MiSeq sequencing for the samples with ∼55 CAGs were very similar for the smaller and more frequent somatic expansions (<85 CAGs, Fig. 1). However, compared to the SP-PCR data, large expansions >90 CAG repeats were underrepresented using the capillary electrophoresis and MiSeq approaches, and undetectable in the PacBio data (Fig. 3). A major factor in driving this disparity is the reduced PCR efficiency in amplifying large alleles compared to smaller ones. This yields a relatively lower number of end-products per input molecule for larger alleles. In SP-PCR, the reduced amplification of larger alleles is at least partially compensated for by greater hybridisation efficiency to a repeat unit probe, and by the spatial resolution offered by the low number of input molecules, multiple reactions and gel electrophoresis. That means that the products of single input molecules can still be readily detected by SP-PCR independent of their size and relative amplification efficiency (at least up to ∼1,000 repeats). In the capillary electrophoresis approach, each PCR product contains only a single fluorescent moiety incorporated into one of the primers independent of the size of the molecule. Thus, large fragments that amplify less efficiently yield a lower signal. When such larger alleles are relatively rare, the signal from such molecules becomes lost in the inevitable background fluorescence observed using this approach. The sequencing-based approaches do not yield any inherent background and, as in the MiSeq data, with high enough read depth (typically ∼45,000 sequencing reads per sample), rare large expansions can be detected, albeit at a lower absolute frequency than the relative frequency of input molecules due to the amplification bias, and probably a higher frequency of sequencing errors that likely reduces alignment efficiency too. It seems reasonable to assume that such large rare expansions would be similarly detectable with PacBio, assuming read depth was high enough.
PacBio sequencing produced similar modal allele estimates to the ones obtained with MiSeq and capillary electrophoresis but showed wider CAG length frequency distributions. This may be due to the high frequency of indels in the PacBio subreads whi-ch may, in turn, lead to an inaccurate number of CAGs in the CCS reads. Previous PacBio analyses of a DM1 patient carrying a single variant CCG repeat within their expanded CTG array revealed that this variant was not detected in 17% of reads, suggesting a possible issue with CCS read generation [30]. Additional analyses are required to establish the absolute utility of the CCS pipeline in handling simple sequence repeats correctly. Nonetheless, like MiSeq and capillary electrophoresis, PacBio sequencing can detect small frequent somatic expansions and capture some of the age-dependent and tissue-specific nature of the somatic mosaicism of the HTT repeat. However, the lower sequencing depth obtained for the PacBio CCS reads does not facilitate accurate estimates of the absolute frequency of somatic expansions. It is likely that ∼5,000 reads per expanded allele are required to accurately measure differences in somatic mosaicism when the variation in CAG lengths is high, as in the tissues of the older R6/2 mice analysed here. It must be noted that the R6/2 mice analysed here carried only one copy of the HTT CAG repeat. When analysing samples containing both a non-HD-causing and an HD-causing allele (e.g., samples from human carriers of HD-causing alleles or knock-in HD animal models) the read depth obtained for the HD-causing allele would be expected to be even lower (at least two to four times lower) due to the preferential PCR amplification of shorter fragments. The most recent Sequel II PacBio platform, with an advertised throughput of up to 4,000,000 CCS reads (∼40X higher than the RSII platform used in this study, [52]), may overcome some of the limitations of the low sequencing depth described in this study (Table 2). However, CCS reads generated on the Sequel II PacBio platform would still be expected to contain many within-repeat indels. Therefore, we expect the issues described in the present study (i.e., the majority of PacBio CCS reads being discarded post-alignment because they align equally well to more than one reference sequence) to also apply to CCS reads generated on the Sequel II PacBio platform. Improved bioinformatics methodology, such as an increase in base calling accuracy [53], the correction of indels [49], the development of more indel-tolerant alignment approaches or alignment-free approaches [49], should benefit the future analysis of similar sequencing data and facilitate greater read depth.
Table 2
Main characteristics of different methods for the preparation of libraries for MiSeq and PacBio for the sequencing of CAG repeats and the quantification of somatic mosaicism
| Library preparation | Sequencing platform | Max CAG repeat size | Max modal CAG size * | Max somatic expansion size | Estimated sequencing cost per sample ** | Quantity of genomic DNA required per sample | Indels | Relative accuracy of the quantification of somatic expansions | Relative accuracy of the quantification of somatic contractions |
| Bulk-PCR | Illumina MiSeq | ∼115 | ∼90 | ∼120 | ∼$8 † | 20 ng | No | + | not detected if |
| PacBio RSII | ≥550 | ∼250 | ≥550 | ∼$50 † | 0.1 to 1.2 μg | Yes | + | not very large | |
| PacBio Sequel | ≥550SM | ∼250SM | ≥550SM | ∼$30 † | 20 to 240 ngSM | Yes | + | ||
| PacBio Sequel II | ≥550SM | ∼250SM | ≥550SM | ∼$10 † | 20 to 60 ngSM | Yes | + | ||
| SP-PCR | Illumina MiSeq | ∼115SM | ∼90SM | ∼120SM | ∼$8 ‡ | 2 ngSLM | No | ++ | + |
| PacBio RSII | ≥1500L | ≥1200L | ≥1500L | ∼$50 ‡ | 10 to 120 ngSLM | Yes | ++ | + | |
| PacBio Sequel | ≥1500LM | ≥1200LM | ≥1500LM | ∼$30 ‡ | 2 to 24 ngSLM | Yes | ++ | + | |
| PacBio Sequel II | ≥1500LM | ≥1200LM | ≥1500LM | ∼$10 ‡ | 2 to 6 ngSLM | Yes | ++ | + | |
| Amplification- | Illumina MiSeq | ∼115S | ∼90S | ∼120S | ∼$20 † | ≥5μgL | No | +++ | +++ |
| free | PacBio RSII | ≥1500L | ≥150L | ≥1500L | ∼$1000 † | ≥5μgL | Yes | +++ | +++ |
| PacBio Sequel | ≥1500LM | ≥150LM | ≥1500LM | ∼$600 † | ≥5μgL | Yes | +++ | +++ | |
| PacBio Sequel II | ≥1500LM | ≥150LM | ≥1500LM | ∼$100 † | ≥5μgL | Yes | +++ | +++ | |
| Amplicon | Illumina MiSeq | ∼115S | ∼90S | ∼120S | ∼$20 # | 20 to 150 ngL | No | +++ | +++ |
| sequencing | PacBio RSII | ≥550SM | ∼250SM | ≥550SM | ∼$1000 # | 2.5 to 30μgSL | Yes | +++ | +++ |
| of barcoded | PacBio Sequel | ≥550SM | ∼250SM | ≥550SM | ∼$600 # | 0.4 to 4.8μgSLM | Yes | +++ | +++ |
| single molecules | PacBio Sequel II | ≥550SM | ∼250SM | ≥550SM | ∼$100 # | 0.2 to 0.6μgSLM | Yes | +++ | +++ |
Observations described in this study are indicated in bold, the other information corresponds to expectations for approaches not used in this study based on observations described in this study (S), on what has been described on other trinucleotide loci in the literature (L) and/or on the manufacturer information available for each sequencing platform (M). *: Max modal allele size for which the modal allele size can be estimated by sequencing and for which somatic mosaicism will reliably be quantified. **: based on [63]. †: assuming a minimum of ∼5,000 reads per sample and a maximum of 384 samples per sequencing run. ‡: assuming 20 SP-PCRs per sample and 250 reads per SP-PCRs. #: assuming ∼20 reads per single molecule and the genotyping of 5,000 single molecules.
The three bulk-PCR approaches (capillary electrophoresis, MiSeq and PacBio SMRT) share the same bulk-PCR pitfalls, i.e., lack of detection of very large and rare expansions that can be detected by SP-PCR (Fig. 3). The use of bulk-PCR makes the sequencing library preparation robust and straightforward, which allows the processing of a high volume of samples. This is particularly true for the MiSeq platform, for which the number of reads produced is much higher than on the PacBio platforms (Table 2). However, bulk-PCR artefacts make it difficult to estimate the size of larger progenitor alleles, hampering our ability to quantify somatic expansions very accurately and making it very difficult to quantify somatic contractions (Table 2).
Future directions in the field for the use of parallel and single-molecule sequencing
Although strongly biased towards expansion, somatic instability is thought to involve a combination of small frequent expansions and contractions [54]. Contractions of the HTT CAG repeat are observed in some animal models [33], but virtually nothing is known about their molecular basis. A first step to improve our understanding of this process would be to be able to quantify somatic repeat contractions. Whereas it is possible to estimate the proportion of somatic expansions using bulk-PCR, repeat contractions cannot be clearly distinguished from PCR slippage artefacts and thus cannot be easily quantified (Table 2). Moreover, as illustrated here, bulk-PCR fails to identify the rare large somatic expansions that can be detected using SP-PCR (Table 2). This is a major problem in the field, as the pathogenic impact of these rare large somatic expansions relative to the more frequent and shorter somatic expansions remains unknown. Improvement of current methods to detect and quantify repeat contractions and accurately measure the net frequency of somatic expansions is thus needed. Such improved methods would expand our understanding of CAG repeat dynamics during the lifetime of an individual and the role of somatic instability in HD disease pathology. More accurately quantifying the full range of somatic repeat length changes could also prove useful in identifying genetic modifiers of somatic instability (it is likely that some variants may act to modify the size and direction of repeat length changes, and not just their absolute frequency), and for the development of outcome measures in clinical trials that aim to suppress somatic repeat expansions and/or induce contractions [55].
Some of the limitations of bulk-PCR may be overcome by using recombinase polymerase amplification, an isothermal replacement to PCR that has been shown to produce fewer HTT CAG slippage pr-oducts [56], or SP-PCR-sequencing which has the potential of allowing the detection of rare large somatic expansions [51]. However, these approaches are still limited to some extent by PCR slippage, confounding the quantification of somatic contractions (Table 2). Using amplification-free methods should allow detection and accurate quantification of both somatic contractions and large somatic expansions that remain undetectable using bulk-PCR (Table 2).
Such an amplification-free approach for sequencing of repeat-expansion loci has been developed by Tsai et al. [57]. This approach, named “no-amp targeted sequencing”, utilises the capture and enrichment of the region(s) of interest using the CRISPR/Cas9 system (Fig. 7A). In trinucleotide expansion studies, no-amp targeted sequencing has so far been used in combination with PacBio or Oxford Nanopore Technologies (ONT) long-read single-molecule sequencing [31, 49, 57–59]. This is because the size of the repeat expansion of interest was expected to be very large [31, 58, 59] but also be-cause the captured fragments are typically several kilobases long [49, 57]. Hafford-Tear et al. [31] have demonstrated that no-amp targeted PacBio SMRT sequencing can capture somatic mosaicism by showing that the variance in the number of repeats increases with the modal number of CAG•CTG in the third intron of TCF4. The application of no-amp targeted PacBio SMRT sequencing to two fully-penetrant HD-causing alleles (>39 CAGs) suggested that no-amp targeted sequencing might be useful to quantify somatic mosaicism at the HTT repeat [49]. However, Höijer et al.’s [49] no-amp HTT PacBio SMRT sequencing data contains frequent intra-individual variation in the number of CAGs associated with the non-HD-causing allele. Because somatic instability of non-HD-causing alleles has not been described before, this is very unexpected. Such variation is, therefore, likely to have been generated by a technical and/or data processing bias and should be investigated to validate the approach for studying the somatic instability of the HTT repeat. Moreover, the CRISPR/Cas9 capture efficiency was not 100% specific to the HTT locus and was associated with a very large fraction of off-target reads (∼95%) [49]. This, together with the fact that Höijer et al. [49] also targeted C9orf72, ATXN10 and FMR1, contributed to a very limited sequencing depth of the HTT repeat (157 HTT repeat reads per sample on average and only 32 reads for each for the two fully-penetrant HD-causing alleles). At that low read depth, the precision in the estimation of the frequency of somatic variants is low. For example, the estimated percentage of somatic expansions estimated was 21.88% with a 95% confidence ranging from 9.28 to 39.97% and 53.13% with a 95% confidence ranging from 34.74 to 70.91% for the two fully-penetrant HD-causing alleles analysed by no-amp HTT PacBio sequencing [49]. No-amp PacBio SMRT sequencing of the HTT repeat thus needs major improvements (reduction of the off-target capture and evaluation of technical artefacts) to be useful in HD research focused on somatic instability of the HTT repeat. Assuming that the HTT read depth would quadruple if Höijer et al.’s [49] no-amp PacBio SMRT was made HTT-specific (because the published data correspond to an assay where HTT was one of four loci targeted), the most recent Sequel II PacBio platform should theoretically produce 10,000 CCS reads per sample if sequencing ∼25 samples per Sequel II PacBio SMRT cell. Such a read depth per sample should allow accurate quantification of the frequency of somatic HTT CAG variants.
No-amp targeted ONT (Oxford Nanopore Technologies) sequencing has so far only been applied to cell line DNA to sequence the C9orf72 GGGGCC and the FMR1 CGG repeats [58]. Its usefulness to estimate somatic mosaicism of the HTT repeat from primary tissue samples thus remains to be demonstrated. Nevertheless, the high error rate of ONT sequencing, including insertion and deletion errors, stands as an obstacle in obtaining sequence information for repeated DNA with the accuracy required for the quantification of somatic mosaicism, at least through conventional alignment-based pipelines. Alignment-free raw-read signal processing algorithms were shown to improve the suitability of ONT for genotyping long repeated DNA regions [58, 60] but are still prone to technical errors even when processing reads from short repeat regions. For example, Liu et al. [60] obtained very broad CAG frequency distributions for non-disease associated alleles at the ATXN3 CAG repeat. This suggests that this type of ONT application would not be appropriate for the quantification of somatic mosaicism of small CAG•CTG expansions, although it might be sufficient for estimating the modal number of CAG•CTGs. Sequencing library preparation techniques, that allow the sequencing of the same starting molecule multiple times using a single ONT read, have been proposed to generate more accurate ONT consensus sequencing reads (conceptually similar to PacBio CCS reads) [61, 62]. In the future, these ONT consensus sequencing reads might prove more useful than standard ONT reads for the accurate quantification of somatic mosaicism of CAG•CTG expansions.
The no-amp targeted long-read sequencing approaches published so far [31, 49, 57–59] are of great utility to sequence and size very large repeat expansions (⪢3,000 repeats at some loci in some tissues) that are refractory to PCR and can only be assessed by relatively crude Southern blot analysis of restriction digested genomic DNA, or that can only be detected by SP-PCR. However, they have several major limitations that make them unsuitable, in their current form, for high-throughput analysis of low levels of variation and for modifier studies that require the analysis of large cohorts. Indeed, they require micrograms of DNA (Table 2) and produce low numbers of reads (∼5,000 on target PacBio CCS reads per RSII SMRT cell [49] and < 1,000 on target ONT reads per MinION flow cell [58]) at a high cost (assuming a best-case scenario of 5% on-target reads and the production of 4,000,000 PacBio CCS reads on one Sequel II SMRT cell, the sequencing cost would be ∼$100 per sample (Table 2) [63] with a requirement of 5,000 reads per sample to quantify somatic mosaicism). MiSeq sequencing-based methods, that offer higher throughput, remain more cost-effective for routinely quantifying somatic mosaicism in primary tissue samples from individuals having inherited HD-causing alleles with <100 CAGs (sequencing cost would be ∼$8 per sample (Table 2) [63] if producing 40,000 MiSeq reads per sample and processing 380 samples per MiSeq run).
Another potential route for quantifying somatic mosaicism that reduces some of the limitations of bulk-PCR is to use single-molecule DNA barcoding in combination with PCR. Through this approach, one can trace the sequence reads back to a single input molecule which allows the identification of PCR and sequencing errors. In the context of a repeated sequence, such an approach can be used to correct for PCR slippage and identify the repeat size in the original molecule (Fig. 7B) [64]. Besides, this approach should also, at least partially, correct for the PCR amplification efficiency problem that generates relatively fewer yields per input molecule for larger alleles. Several methods have been developed to achieve single-molecule barcoding, including molecular inversion probe (MIP) capture using probes with degenerate tags and one- to three-cycle PCR using barcoded primers at low concentrations [65, 66]. Such methods, combined with high-throughput sequencing, allow multiplexing across loci in large cohorts while providing single-molecule level sequence data. Single-molecule barcoding has been mostly explored in human tumour sequencing analysis and was shown to perform very well in detecting single-base somatic variants at an allele frequency of <0.5% [65, 66]. With a primary focus on single nucleotide variants, variation in microsatellite regions has been somewhat less well explored to date, but with some evidence showing that, for example, MIP capture is less efficient for repeat regions when compared to single base variation in multi-loci capture assays [67]. However, single-molecule barcoding by MIP capture was recently shown to be a sensitive method in detecting repeat length variants, including repeat contractions, across multiple microsatellite loci in A. thaliana. This suggests that this approach should be applicable to human microsatellites. The main disadvantage of such barcoding methods, when compared to amplification-free sequencing library preparation, is that DNA molecules are copied by polymerase during the barcoding step; thus, any insertion and deletion errors that occur during this stage are indistinguishable from true somatic variants. However, preliminary data suggest that such errors, at least in MIP capture, form background noise that does not disrupt genotype calling [64]. With relatively low amounts of the input DNA required and high-order multiplexing potential, amplicon sequencing of barcoded single molecules offers a potentially cost-effective solution for quantifying somatic mosaicism for moderate CAG expansions in HTT and could be adapted to long alleles by using long-read sequencing platforms such as PacBio (Table 2).
Fig. 7
Method summary for somatic mosaicism quantification at the level of a single molecule in HD. A) Generalised schematics for CRISPR/Casp9-mediated targeted enrichment of HTT locus for single-molecule long-read sequencing (i.e., no-amp targeted sequencing). Following DNA fragmentation and DNA molecule protection by adapter ligation or de-phosphorylation, CRISPR/Cas9 and locus-specific guide RNAs are used to selectively cut across the region of interest. While undigested DNA fragment ends are still protected, sequencing adapters are ligated to the Cas9 digestion product. Sequencing is then done on the appropriate single-molecule long-read sequencing platform such as PacBio SMRT or Oxford Nanopore Technologies (ONT). No-amp targeted sequencing studies of repeat expansions have used one or two Cas9 cuts with PacBio sequencing [31, 49, 57, 59] or ONT sequencing [58] respectively. Single-molecule sequencing read output can then be used to build the somatic mosaicism profile. B) The general method for amplicon sequencing of barcoded single molecules. Several methods for single-molecule barcoding exist, including one-cycle PCR using hairpin-protected primers with degenerate tags or region capture by barcoded molecular inversion probes. Following barcoding, sequencing adapters are incorporated into the uniquely tagged molecules through PCR with overhang primers. The resulting amplicon library is then sequenced on the platform of interest, including Illumina MiSeq or PacBio, depending on the amplicon length and the desired throughput. Resulting reads are grouped by barcode family, and the repeat length of the original molecule for each family is determined to build the real somatic mosaicism profile per sample.
![Method summary for somatic mosaicism quantification at the level of a single molecule in HD. A) Generalised schematics for CRISPR/Casp9-mediated targeted enrichment of HTT locus for single-molecule long-read sequencing (i.e., no-amp targeted sequencing). Following DNA fragmentation and DNA molecule protection by adapter ligation or de-phosphorylation, CRISPR/Cas9 and locus-specific guide RNAs are used to selectively cut across the region of interest. While undigested DNA fragment ends are still protected, sequencing adapters are ligated to the Cas9 digestion product. Sequencing is then done on the appropriate single-molecule long-read sequencing platform such as PacBio SMRT or Oxford Nanopore Technologies (ONT). No-amp targeted sequencing studies of repeat expansions have used one or two Cas9 cuts with PacBio sequencing [31, 49, 57, 59] or ONT sequencing [58] respectively. Single-molecule sequencing read output can then be used to build the somatic mosaicism profile. B) The general method for amplicon sequencing of barcoded single molecules. Several methods for single-molecule barcoding exist, including one-cycle PCR using hairpin-protected primers with degenerate tags or region capture by barcoded molecular inversion probes. Following barcoding, sequencing adapters are incorporated into the uniquely tagged molecules through PCR with overhang primers. The resulting amplicon library is then sequenced on the platform of interest, including Illumina MiSeq or PacBio, depending on the amplicon length and the desired throughput. Resulting reads are grouped by barcode family, and the repeat length of the original molecule for each family is determined to build the real somatic mosaicism profile per sample.](https://content.iospress.com:443/media/jhd/2021/10-1/jhd-10-1-jhd200433/jhd-10-jhd200433-g007.jpg)
CONFLICT OF INTEREST
V.C.W. is a scientific advisory board member of Triplet Therapeutics, a company developing new therapeutic approaches to address triplet repeat disorders such as HD and myotonic dystrophy and of LoQus23 Therapeutics, and has provided paid consulting services to Alnylam. Her financial interests in Triplet Therapeutics were reviewed and are managed by Massachusetts General Hospital and Partners HealthCare in accordance with their conflict of interest policies. S.K. is employed by CHDI Management, Inc., as an advisor to the CHDI Foundation. D.G.M. has been a scientific consultant and/or received honoraria or stock options from Biogen Idec, AMO Pharma, Charles River, Vertex Pharmaceuticals, Triplet Therapeutics, LoQus23, and Small Molecule RNA and has had research contracts with AMO Pharma and Vertex Pharmaceuticals.
ACKNOWLEDGMENTS
The authors wish to thank the D.G.M. group for helpful advice with this work and David Meltzer, David McGuinness and Julie Galbraith, from Glasgow Polyomics, for administrating the Galaxy instance of the University of Glasgow (D.M. & D.McG.) and for their help and insight with the MiSeq sequencing (J.G. and D.McG.). This work was supported by the CHDI Foundation (awards to D.G.M. and A.J.M.) and the National Institutes of Health USA (Grants Nos. R01NS049206 to V.C.W.).
SUPPLEMENTARY MATERIAL
[1] The supplementary material is available in the electronic version of this article: https://dx.doi.org/10.3233/JHD200433.
REFERENCES
[1] | Aziz NA , van der Burg JMM , Tabrizi SJ , Landwehrmeyer GB . Overlap between age-at-onset and disease-progres-ion determinants in Huntington disease. Neurology. (2018) ;90: (24):e2099–e106. doi: 10.1212/wnl.0000000000005690 |
[2] | Donaldson J , Powell S , Rickards N , Holmans P , Jones L . What is the pathogenic CAG expansion length in Huntington’s disease? J Huntingtons Dis. 2020;doi: 10.3233/JHD-200445 |
[3] | Hong EP , MacDonald ME , Wheeler VC , Jones L , Holmans P , Orthe M , et al. Huntington’s disease pathogenesis: Two sequential components. J Huntingtons Dis. 2020;doi: 10.3233/JHD-200427 |
[4] | Duyao M , Ambrose C , Myers R , Novelletto A , Persichetti F , Frontali M , et al. Trinucleotide repeat length instability and age of onset in Huntington’s disease. Nat Genet. (1993) ;4: (4):387–92. doi: 10.1038/ng0893-387 |
[5] | Monckton DG . Somatic expansion of the CAG repeat in Huntington disease: An historical perspective. J Huntingtons Dis. 2020;doi: 10.3233/JHD-200429 |
[6] | Shelbourne PF , Keller-McGandy C , Bi WL , Yoon SR , Dubeau L , Veitch NJ , et al. Triplet repeat mutation length gains correlate with cell-type specific vulnerability in Huntington disease brain. Hum Mol Genet.. (2007) ;16: (10):1133–42. doi: 10.1093/hmg/ddm054 |
[7] | Ciosi M , Maxwell A , Cumming SA , Hensman Moss DJ , Alshammari AM , Flower MD , et al. A genetic association study of glutamine-encoding DNA sequence structures, somatic CAG expansion, and DNA repair gene variants, with Huntington disease clinical outcomes. EBioMedicine. (2019) ;48: :568–80. doi: 10.1016/j.ebiom.2019.09.020 |
[8] | Veitch NJ , Ennis M , McAbney JP , Shelbourne PF , Monckton DG . Inherited CAG·CTG allele length is a major modifier of somatic mutation length variability in Huntington disease. DNA repair. (2007) ;6: (6):789–96. doi: 10.1016/j.dnarep.2007.01.002 |
[9] | Kennedy L , Evans E , Chen CM , Craven L , Detloff PJ , Ennis M , et al. Dramatic tissue-specific mutation length increases are an early molecular event in Huntington disease pathogenesis. Hum Mol Genet. (2003) ;12: (24):3359–67. doi: 10.1093/hmg/ddg352 |
[10] | Mouro Pinto R , Arning L , Giordano JV , Razghandi P , Andrew MA , Gillis T , et al. Patterns of CAG repeat instability in the central nervous system and periphery in Huntington’s disease and in spinocerebellar ataxia type 1. Hum Mol Genet. (2020) ;29: (15):2551–67. doi: 10.1093/hmg/ddaa139 |
[11] | Telenius H , Kremer B , Goldberg YP , Theilmann J , Andrew SE , Zeisler J , et al. Somatic and gonadal mosaicism of the Huntington disease gene CAG repeat in brain and sperm. Nat Genet. (1994) ;6: (4):409–14. doi: 10.1038/ng0494-409 |
[12] | Wheeler V , Dion V . Modifiers of CAG repeat instability: Insights from model systems. J Huntingtons Dis. 2020;doi: 10.3233/JHD-200426 |
[13] | Reiner A , Dragatsis I , Dietrich P . Genetics and neuropathology of Huntington’s disease. Int Rev Neurobiol. (2011) ;98: :325–72. doi: 10.1016/B978-0-12-381328-2.00014-6 |
[14] | Swami M , Hendricks AE , Gillis T , Massood T , Mysore J , Myers RH , et al. Somatic expansion of the Huntington’s disease CAG repeat in the brain is associated with an earlier age of disease onset. Hum Mol Genet. (2009) ;18: (16):3039–47. doi: 10.1093/hmg/ddp242 |
[15] | Flower M , Lomeikaite V , Ciosi M , Cumming S , Morales F , Lo K , et al. MSH3 modifies somatic instability and disease severity in Huntington’s and myotonic dystrophy type 1. Brain. (2019) ;142: (7):1876–86. doi: 10.1093/brain/awz115 |
[16] | Genetic Modifiers of Huntington’s Disease (GeM-HD) Consortium. CAG repeat not polyglutamine length determines timing of Huntington’s disease onset. Cell. (2019) ;178: (4):887–900.e14. doi: 10.1016/j.cell.2019.06.036 |
[17] | Hensman Moss DJ , Pardiñas AF , Langbehn D , Lo K , Leavitt BR , Roos R , et al. Identification of genetic variants associated with Huntington’s disease progression: A genome-wide association study. Lancet Neurol. (2017) ;16: (9):701–11. doi: 10.1016/S1474-4422(17)30161-8 |
[18] | Iyer R , Pluciennik A . DNA mismatch repair and its role in Huntington’s disease. J Huntingtons Dis. 2020;doi: 10.3233/JHD-200438 |
[19] | Maiuri T , Hung CLK , Suart CE , Begeja N , Barba-Bazan C , Peng Y , et al. DNA repair in neurodegeneration: Somatic expansion and alternative hypotheses. J Huntingtons Dis. 2020;doi: 10.3233/JHD-200414 |
[20] | Manley K , Shirley TL , Flaherty L , Messer A . Msh2 deficiency prevents in vivo somatic instability of the CAG repeat in Huntington disease transgenic mice. Nat Genet. (1999) ;23: (4):471–3. doi: 10.1038/70598 |
[21] | Tomé S , Manley K , Simard JP , Clark GW , Slean MM , Swami M , et al. MSH3 polymorphisms and protein levels affect CAG repeat instability in Huntington’s disease mice. PLoS Genet. (2013) ;9: (2):e1003280. doi: 10.1371/journal.pgen.1003280 |
[22] | Pinto RM , Dragileva E , Kirby A , Lloret A , Lopez E , St Claire J , et al. Mismatch repair genes Mlh1 and Mlh3 modify CAG instability in Huntington’s disease mice: Genome-wide and candidate approaches. PLoS Genet. (2013) ;9: (10):e1003930. doi: 10.1371/journal.pgen.1003930 |
[23] | Kovalenko M , Dragileva E , St Claire J , Gillis T , Guide JR , New J , et al. Msh2 acts in medium-spiny striatal neurons as an enhancer of CAG instability and mutant huntingtin phenotypes in Huntington’s disease knock-in mice. PloS one. (2012) ;7: (9):e44273. doi: 10.1371/journal.pone.0044273 |
[24] | Zhao X , Kumari D , Miller C , Kim G , Hayward B , Vitalo AG , et al. Modifiers of somatic repeat instability in mouse models of Friedreich ataxia and the Fragile X-related disorders: Implications for the mechanism of somatic expansion in Huntington disease. J Huntingtons Dis. 2020;doi: 10.3233/JHD-200414 |
[25] | Deshmukh A , Porro A , Mohiuddin M , Lanni S , Panigrahi G , Caron M , et al. FAN1, a DNA repair nuclease, as a modifier of repeat expansion disorders. J Huntingtons Dis. 2020;doi: 10.3233/JHD-200448 |
[26] | Massey T , McAllister B , Jones L . Methods for assessing DNA repair and repeat expansion in Huntington’s disease. Methods Mol Biol. (2018) ;1780: :483–95. doi: 10.1007/978-1-4939-7825-0_22 |
[27] | Wright GEB , Collins JA , Kay C , McDonald C , Dolzhenko E , Xia Q , et al. Length of uninterrupted CAG, independent of polyglutamine size, results in increased somatic instability, hastening onset of Huntington disease. Am J Hum Genet. (2019) ;104: (6):1116–26. doi: 10.1016/j.ajhg.2019.04.007 |
[28] | Salipante SJ , Scroggins SM , Hampel HL , Turner EH , Pritchard CC . Microsatellite instability detection by next generation sequencing. Clin Chem. (2014) ;60: (9):1192–9. doi: 10.1373/clinchem.2014.223677 |
[29] | Gan C , Love C , Beshay V , Macrae F , Fox S , Waring P , et al. Applicability of next generation sequencing technology in microsatellite instability testing. Genes. (2015) ;6: (1):46–59. doi: 10.3390/genes6010046 |
[30] | Cumming SA , Hamilton MJ , Robb Y , Gregory H , McWilliam C , Cooper A , et al. De novo repeat interruptions are associated with reduced somatic instability and mild or absent clinical features in myotonic dystrophy type 1. Eur J Hum Genet. (2018) ;26: (11):1635–47. doi: 10.1038/s41431-018-0156-9 |
[31] | Hafford-Tear NJ , Tsai YC , Sadan AN , Sanchez-Pintado B , Zarouchlioti C , Maher GJ , et al. CRISPR/Cas9-targeted enrichment and long-read sequencing of the Fuchs endothelial corneal dystrophy-associated TCF4 triplet repeat. Genet Med. (2019) ;21: (9):2092–102. doi: 10.1038/s41436-019-0453-x |
[32] | Bettencourt C , Hensman-Moss D , Flower M , Wiethoff S , Brice A , Goizet C , et al. DNA repair pathways underlie a common genetic mechanism modulating onset in polyglutamine diseases. Ann Neurol. (2016) ;79: (6):983–90. doi: 10.1002/ana.24656 |
[33] | Larson E , Fyfe I , Morton AJ , Monckton DG . Age-, tissue- and length-dependent bidirectional somatic CAG•CTG repeat instability in an allelic series of R6/2 Huntington disease mice. Neurobiol Dis. (2015) ;76: :98–111. doi: 10.1016/j.nbd.2015.01.004 |
[34] | Mangiarini L , Sathasivam K , Seller M , Cozens B , Harper A , Hetherington C , et al. Exon 1 of the HD gene with an ex-panded CAG repeat is sufficient to cause a progressive neu-rological phenotype in transgenic mice. Cell. (1996) ;87: (3):493–506. doi: 10.1016/s0092-8674(00)81369-0 |
[35] | Morton AJ , Glynn D , Leavens W , Zheng Z , Faull RL , Skepper JN , et al. Paradoxical delay in the onset of disease caused by super-long CAG repeat expansions in R6/2 mice. Neurobiol Dis. (2009) ;33: (3):331–41. doi: 10.1016/j.nbd.2008.11.015 |
[36] | Kielar C , Morton AJ . Early neurodegeneration in R6/2 mice carrying the Huntington’s disease mutation with a super-expanded CAG repeat, despite normal lifespan. J Huntingtons Dis. (2018) ;7: (1):61–76. doi: 10.3233/jhd-170265 |
[37] | Morton AJ , Skillings EA , Wood NI , Zheng Z . Antagonistic pleiotropy in mice carrying a CAG repeat expansion in the range causing Huntington’s disease. Sci Rep. (2019) ;9: (1):37. doi: 10.1038/s41598-018-37102-8 |
[38] | Ciosi M , Cumming SA , Mubarak A , Symeonidi E , Herzyk P , McGuinness D , et al. Library preparation and MiSeq sequencing for the genotyping-by-sequencing of the Huntington disease HTT exon one trinucleotide repeat and the quantification of somatic mosaicism. Protocol Exch. 2018:doi: 10.1038/protex.2018.089 |
[39] | PacBio. Barcoding withSMRTAnalysis 2.3 2014.Available from: https://github.com/PacificBiosciences/Bioinformatics-Training/wiki/Barcoding-with-SMRT-Analysis-2.3. |
[40] | PacBio. Pacific Biosciences Glossary of Terms 2019. Available from: https://www.pacb.com/wp-content/uploads/2015/09/Pacific-Biosciences-Glossary-of-Terms.pdf. |
[41] | Johnson M , Zaretskaya I , Raytselis Y , Merezhuk Y , McGinnis S , Madden TL . NCBI BLAST: A better web interface. Nucleic Acids Res. (2008) ;36: (Web Server issue):W5–9. doi: 10.1093/nar/gkn201 |
[42] | Sayers EW , Beck J , Brister JR , Bolton EE , Canese K , Comeau DC , et al. Database resources of the National Center for Biotechnology Information. Nucleic Acids Res. (2020) ;48: (D1):D9–d16. doi: 10.1093/nar/gkz899 |
[43] | Giardine B , Riemer C , Hardison RC , Burhans R , Elnitski L , Shah P , et al. Galaxy: A platform for interactive large-scale genome analysis. Genome Res. (2005) ;15: (10):1451–5. doi: 10.1101/gr.4086505 |
[44] | Heng L . Aligning sequence reads, clone sequences and assembly contigs withBWA-MEM.arXiv. 2013:1303.3997. |
[45] | Tang H , Kirkness EF , Lippert C , Biggs WH , Fabani M , Guzman E , et al. Profiling of short-tandem-repeat disease alleles in 12,632 human whole genomes. Am J Hum Genet. (2017) ;101: (5):700–15. doi: 10.1016/j.ajhg.2017.09.013 |
[46] | Milne I , Stephen G , Bayer M , Cock PJ , Pritchard L , Cardle L , et al. Using Tablet for visual exploration of second-generation sequencing data. Brief Bioinform. (2013) ;14: (2):193–202. doi: 10.1093/bib/bbs012 |
[47] | Mangiarini L , Sathasivam K , Mahal A , Mott R , Seller M , Bates GP . Instability of highly expanded CAG repeats in mice transgenic for the Huntington’s disease mutation. Nat Genet. (1997) ;15: (2):197–200. doi: 10.1038/ng0297-197 |
[48] | Gomes-Pereira M , Bidichandani SI , Monckton DG . Analysis of unstable triplet repeats using small-pool polymerase chain reaction. Methods Mol Biol. (2004) ;277: :61–76. doi: 10.1385/1-59259-804-8:061 |
[49] | Höijer I , Tsai YC , Clark TA , Kotturi P , Dahl N , Stattin EL , et al. Detailed analysis of HTT repeat elements in human blood using targeted amplification-free long-read sequencing. Hum Mutat. (2018) ;39: (9):1262–72. doi: 10.1002/humu.23580 |
[50] | Illumina. PhiX Control v3 2020. Available from: https://emea.illumina.com/products/by-type/sequencing-kits/cluster-gen-sequencing-reagents/phix-control-v3.html. |
[51] | Ardui S . Determination of the variability and associated epigenetic signature of tandem repeats by single molecule sequencing: KU Leuven; 2018. Available from: https://lirias.kuleuven.be/2338861?limo=0. |
[52] | PacBio. The Award-Winning Sequel II System 2020. Available from: https://www.pacb.com/products-and-services/sequel-system/latest-system-release/. |
[53] | Wenger AM , Peluso P , Rowell WJ , Chang PC , Hall RJ , Concepcion GT , et al. Accurate circular consensus long-read sequencing improves variant detection and assembly of a human genome. Nat Biotechnol. (2019) ;37: (10):1155–62. doi: 10.1038/s41587-019-0217-9 |
[54] | Higham CF , Morales F , Cobbold CA , Haydon DT , Monckton DG . High levels of somatic DNA diversity at the myotonic dystrophy type 1 locus are driven by ultra-frequent expansion and contraction mutations. Hum Mol Genet. (2012) ;21: (11):2450–63. doi: 10.1093/hmg/dds059 |
[55] | Benn CL , Gibson KR , Reynolds DS . Drugging DNA damage repair pathways for trinucleotide repeat expansion diseases. J Huntingtons Dis. 2020;doi: 10.3233/jhd-200421 |
[56] | Daunay A , Duval A , Baudrin LG , Buhard O , Renault V , Deleuze JF , et al. Low temperature isothermal amplification of microsatellites drastically reduces stutter artifact formation and improves microsatellite instability detection in cancer. Nucleic Acids Res. (2019) ;47: (21):e141. doi: 10.1093/nar/gkz811 |
[57] | Tsai Y-C , Greenberg D , Powell J , Höijer I , Ameur A , Strahl M , et al. Amplification-free, CRISPR-Cas9 targeted enrichment and SMRT sequencing of repeat-expansion disease causative genomic regions. bioRxiv. 2017:203919. doi: 10.1101/203919 |
[58] | Giesselmann P , Brändl B , Raimondeau E , Bowen R , Rohrandt C , Tandon R , et al. Analysis of short tandem repeat expansions and their methylation state with nanopore sequencing. Nat Biotechnol. (2019) ;37: (12):1478–81. doi: 10.1038/s41587-019-0293-x |
[59] | Wieben ED , Aleff RA , Basu S , Sarangi V , Bowman B , McLaughlin IJ , et al. Amplification-free long-read sequencing of TCF4 expanded trinucleotide repeats in Fuchs endothelial corneal dystrophy. PloS One. (2019) ;14: (7):e0219446. doi: 10.1371/journal.pone.0219446 |
[60] | Liu Q , Zhang P , Wang D , Gu W , Wang K . Interrogating the “unsequenceable” genomic trinucleotide repeat disorders by long-read sequencing. Genome Med. (2017) ;9: (1):65. doi: 10.1186/s13073-017-0456-7 |
[61] | Volden R , Palmer T , Byrne A , Cole C , Schmitz RJ , Green RE , et al. Improving nanopore read accuracy with the R2C2 method enables the sequencing of highly multiplexed full-length single-cell cDNA. Proc Natl Acad Sci U S A. (2018) ;115: (39):9726–31. doi: 10.1073/pnas.1806447115 |
[62] | Li C , Chng KR , Boey EJ , Ng AH , Wilm A , Nagarajan N . INC-Seq: Accurate single molecule reads using nanopore sequencing. GigaScience. (2016) ;5: (1):34. doi: 10.1186/s13742-016-0140-7 |
[63] | Georgia Genomics and Bioinformatics Core. PacBio Sequel II Sequencing 2020. Available from: https://dna.uga.edu/pacbio-sequel-sequencing-2/. |
[64] | Carlson KD , Sudmant PH , Press MO , Eichler EE , Shendure J , Queitsch C . MIPSTR: A method for multiplex genotyping of germline and somatic STR variation across many individuals. Genome Res. (2015) ;25: (5):750–61. doi: 10.1101/gr.182212.114 |
[65] | Hiatt JB , Pritchard CC , Salipante SJ , O’Roak BJ , Shendure J . Single molecule molecular inversion probes for targeted, high-accuracy detection of low-frequency variation. Genome Res. (2013) ;23: (5):843–54. doi: 10.1101/gr.147686.112 |
[66] | Ståhlberg A , Krzyzanowski PM , Jackson JB , Egyud M , Stein L , Godfrey TE . Simple, multiplexed, PCR-based barcoding of DNA enables sensitive mutation detection in liquid biopsies using sequencing. Nucleic Acids Res. (2016) ;44: (11):e105. doi: 10.1093/nar/gkw224 |
[67] | O’Roak BJ , Vives L , Fu W , Egertson JD , Stanaway IB , Phelps IG , et al. Multiplex targeted sequencing identifies recurrently mutated genes in autism spectrum disorders. Science. (2012) ;338: (6114):1619–22. doi: 10.1126/science.1227764 |


