
Huntington’s Disease Pathogenesis: Two Sequential Components
Abstract
Historically, Huntington’s disease (HD; OMIM #143100) has played an important role in the enormous advances in human genetics seen over the past four decades. This familial neurodegenerative disorder involves variable onset followed by consistent worsening of characteristic abnormal movements along with cognitive decline and psychiatric disturbances. HD was the first autosomal disease for which the genetic defect was assigned to a position on the human chromosomes using only genetic linkage analysis with common DNA polymorphisms. This discovery set off a multitude of similar studies in other diseases, while the HD gene, later renamed HTT, and its vicinity in chromosome 4p16.3 then acted as a proving ground for development of technologies to clone and sequence genes based upon their genomic location, with the growing momentum of such advances fueling the Human Genome Project. The identification of the HD gene has not yet led to an effective treatment, but continued human genetic analysis of genotype-phenotype relationships in large HD subject populations, first at the HTT locus and subsequently genome-wide, has provided insights into pathogenesis that divide the course of the disease into two sequential, mechanistically distinct components.
HUNTINGTON’S DISEASE: A SINGLE CAUSE WITH EXTENSIVE VARIATION
Huntington’s disease (HD) shows dominant inheritance with high penetrance, so for HD families the search for the genetic defect initially enabled molecular testing based upon linked markers (when appropriate family members were available) to predict the probability of inheritance of the disease [1, 2]. When the genetic mutation was ultimately identified [3], HD was recognized as an early member of a new group of diseases caused by expanded trinucleotide repeats that at the time included spinal and bulbar muscular atrophy (OMIM #313200) [4], Fragile X syndrome (OMIM #300624) [5] and myotonic dystrophy (OMIM #160900) [6] with spinocerebellar ataxia 1 (OMIM #164400) joining the group shortly thereafter [7]. The repeat in HTT involved consecutive CAG codons in the coding sequence of a large protein dubbed huntingtin [3]. Sizing of the HTT CAG repeat by PCR amplification and comparing the resulting fragment size with sequenced standards introduced the capacity to perform predictive molecular testing in any individual, without the need to involve relatives [3, 8].
Application of the PCR fragment-based genotyping of CAG repeat size revealed that the repeat length is remarkably variable from chromosome to chromosome and broadly assigned HTT CAG repeat alleles to a continuum of classes (<27 CAGs), high normal (>26 but <36 CAGs), reduced penetrance of HD (>35 but <40 CAGs) and full penetrance of HD (>39 CAGs) with potential overlap at the boundaries based upon data from large surveys of HD subjects and families and predictive testing [9–11]. It quickly became apparent that, at the HD population level, there is a strong inverse correlation (Fig. 1A) between the length of the CAG repeat in the disease producing copy of HTT and the age at diagnostic motor onset [12–14]. As illustrated using only individuals with 43 CAGs (Fig. 1B), HD age-at-onset varies over a range of several decades for any given CAG repeat length, but the average onset age decreases with increasing CAG length. Therefore, when CAG sizing (regardless of the assay method) is used for presymptomatic testing, it can establish whether an individual will eventually develop HD but cannot accurately predict the age at which the disease will appear although predictive models that attempt to guide such information are being continually improved [15–18].
Fig.1
Relationship of age at motor onset with CAG repeat. A. Age at onset of motor signs estimated by raters (Y-axis) is compared to the size of uninterrupted CAG repeat (X-axis) for subjects with inherited CAG sizes of 40–55 repeats. Each circle represents a HD subject participating our recent onset modifier GWA study [37]. B. Age at onset of motor signs for the subset of HD subjects who inherited 43 CAGs (∼15.5% of the total data set) is plotted to show the wide variability in clinical manifestation due to factors other than CAG repeat length.
![Relationship of age at motor onset with CAG repeat. A. Age at onset of motor signs estimated by raters (Y-axis) is compared to the size of uninterrupted CAG repeat (X-axis) for subjects with inherited CAG sizes of 40–55 repeats. Each circle represents a HD subject participating our recent onset modifier GWA study [37]. B. Age at onset of motor signs for the subset of HD subjects who inherited 43 CAGs (∼15.5% of the total data set) is plotted to show the wide variability in clinical manifestation due to factors other than CAG repeat length.](https://content.iospress.com:443/media/jhd/2021/10-1/jhd-10-1-jhd200427/jhd-10-jhd200427-g001.jpg)
Just as there is wide variation in onset age across the HD population, there is also considerable variation even within HD families, where individuals inherit the same disease chromosome from a common ancestor. A major cause of this variation is the fact that, unlike most other DNA variations, the CAG repeat in the disease-producing size ranges is not stably inherited from generation to generation but instead changes in size frequently through meiotic transmission, typically by 1 to a few CAG units [3, 13, 19]. Overall, differences in inherited CAG length, as measured in DNA from blood, account for most (∼60%), but not all, of the wide range of variation in age-at-onset in the disease [20]. The remaining variation not explained by the CAG repeat length shows evidence of some heritability within families, indicating that genetic factors act to shift the onset of HD from that expected based upon the size of the individual’s inherited CAG repeat [21, 22].
THE SEARCH FOR GENETIC MODIFIERS OF HUNTINGTON’S DISEASE
For many years after discovery of the HD defect, investigators attempted to identify HD modifiers through genetic analysis of candidate genes selected based upon their function [23]. Like similar studies involving genetic susceptibility to a variety of common diseases, these candidate studies typically involved too few HD subjects for sufficient statistical power and so were prone to false positives and failure to replicate. The potential for unbiased genetic studies emerged early in this century as a result of two major advances that introduced the approach of genome-wide association analysis (GWA): 1) the concerted effort by the human genetics community to catalogue common genetic variants, in the form of single nucleotide polymorphisms (SNPs), across almost all genomic regions and 2) the capacity to genotype hundreds of thousands to millions of these SNPs simultaneously using oligonucleotide array technology. For genome-wide application of these tools to HD with sufficient power to identify modifier genes, there were three additional requirements: 1) availability of genomic DNA for genotyping from a large number of HD subjects; 2) definition of a robust phenotype that accounted for the effects of the CAG repeat size, allowing the search for genetic factors other than the CAG repeat that influence the HD phenotype; and 3) testing of the possibility that such modifiers represent genetic polymorphisms in or near HTT that act in cis to modify the effect of the mutation, as any frequent HTT-linked modifier factors would also need to be accounted for in a genome-wide search.
The first of the requirements for a highly powered HD modifier study was met due to the highly collaborative nature of the HD clinical and research communities. Initially, a large collection of HD subjects from the long-standing National Institutes of Health-supported Massachusetts HD “Center without Walls” originally ascertained for linkage analysis and positional cloning of the HD defect and its analysis in post-mortem brain was studied. This resource was then augmented from the collaborative HD-MAPS (Modifiers of Age-at-onset in Pairs of Sibs) study ascertained to search for modifiers by linkage analysis [24], and from two Huntington Study Group natural history studies: PREDICT-HD which enrolled HD subjects prior to disease onset [25] and COHORT (Cooperative Huntington’s Observational Research Trial) which enrolled HD subjects at all stages of disease [26]. The sample size was subsequently further increased with subjects from the European Huntington’s Disease Network’s Registry study [27] and more recently, with a still-growing resource of HD subjects from the ENROLL-HD platform, which continues to increase the power of HD genetic studies [28].
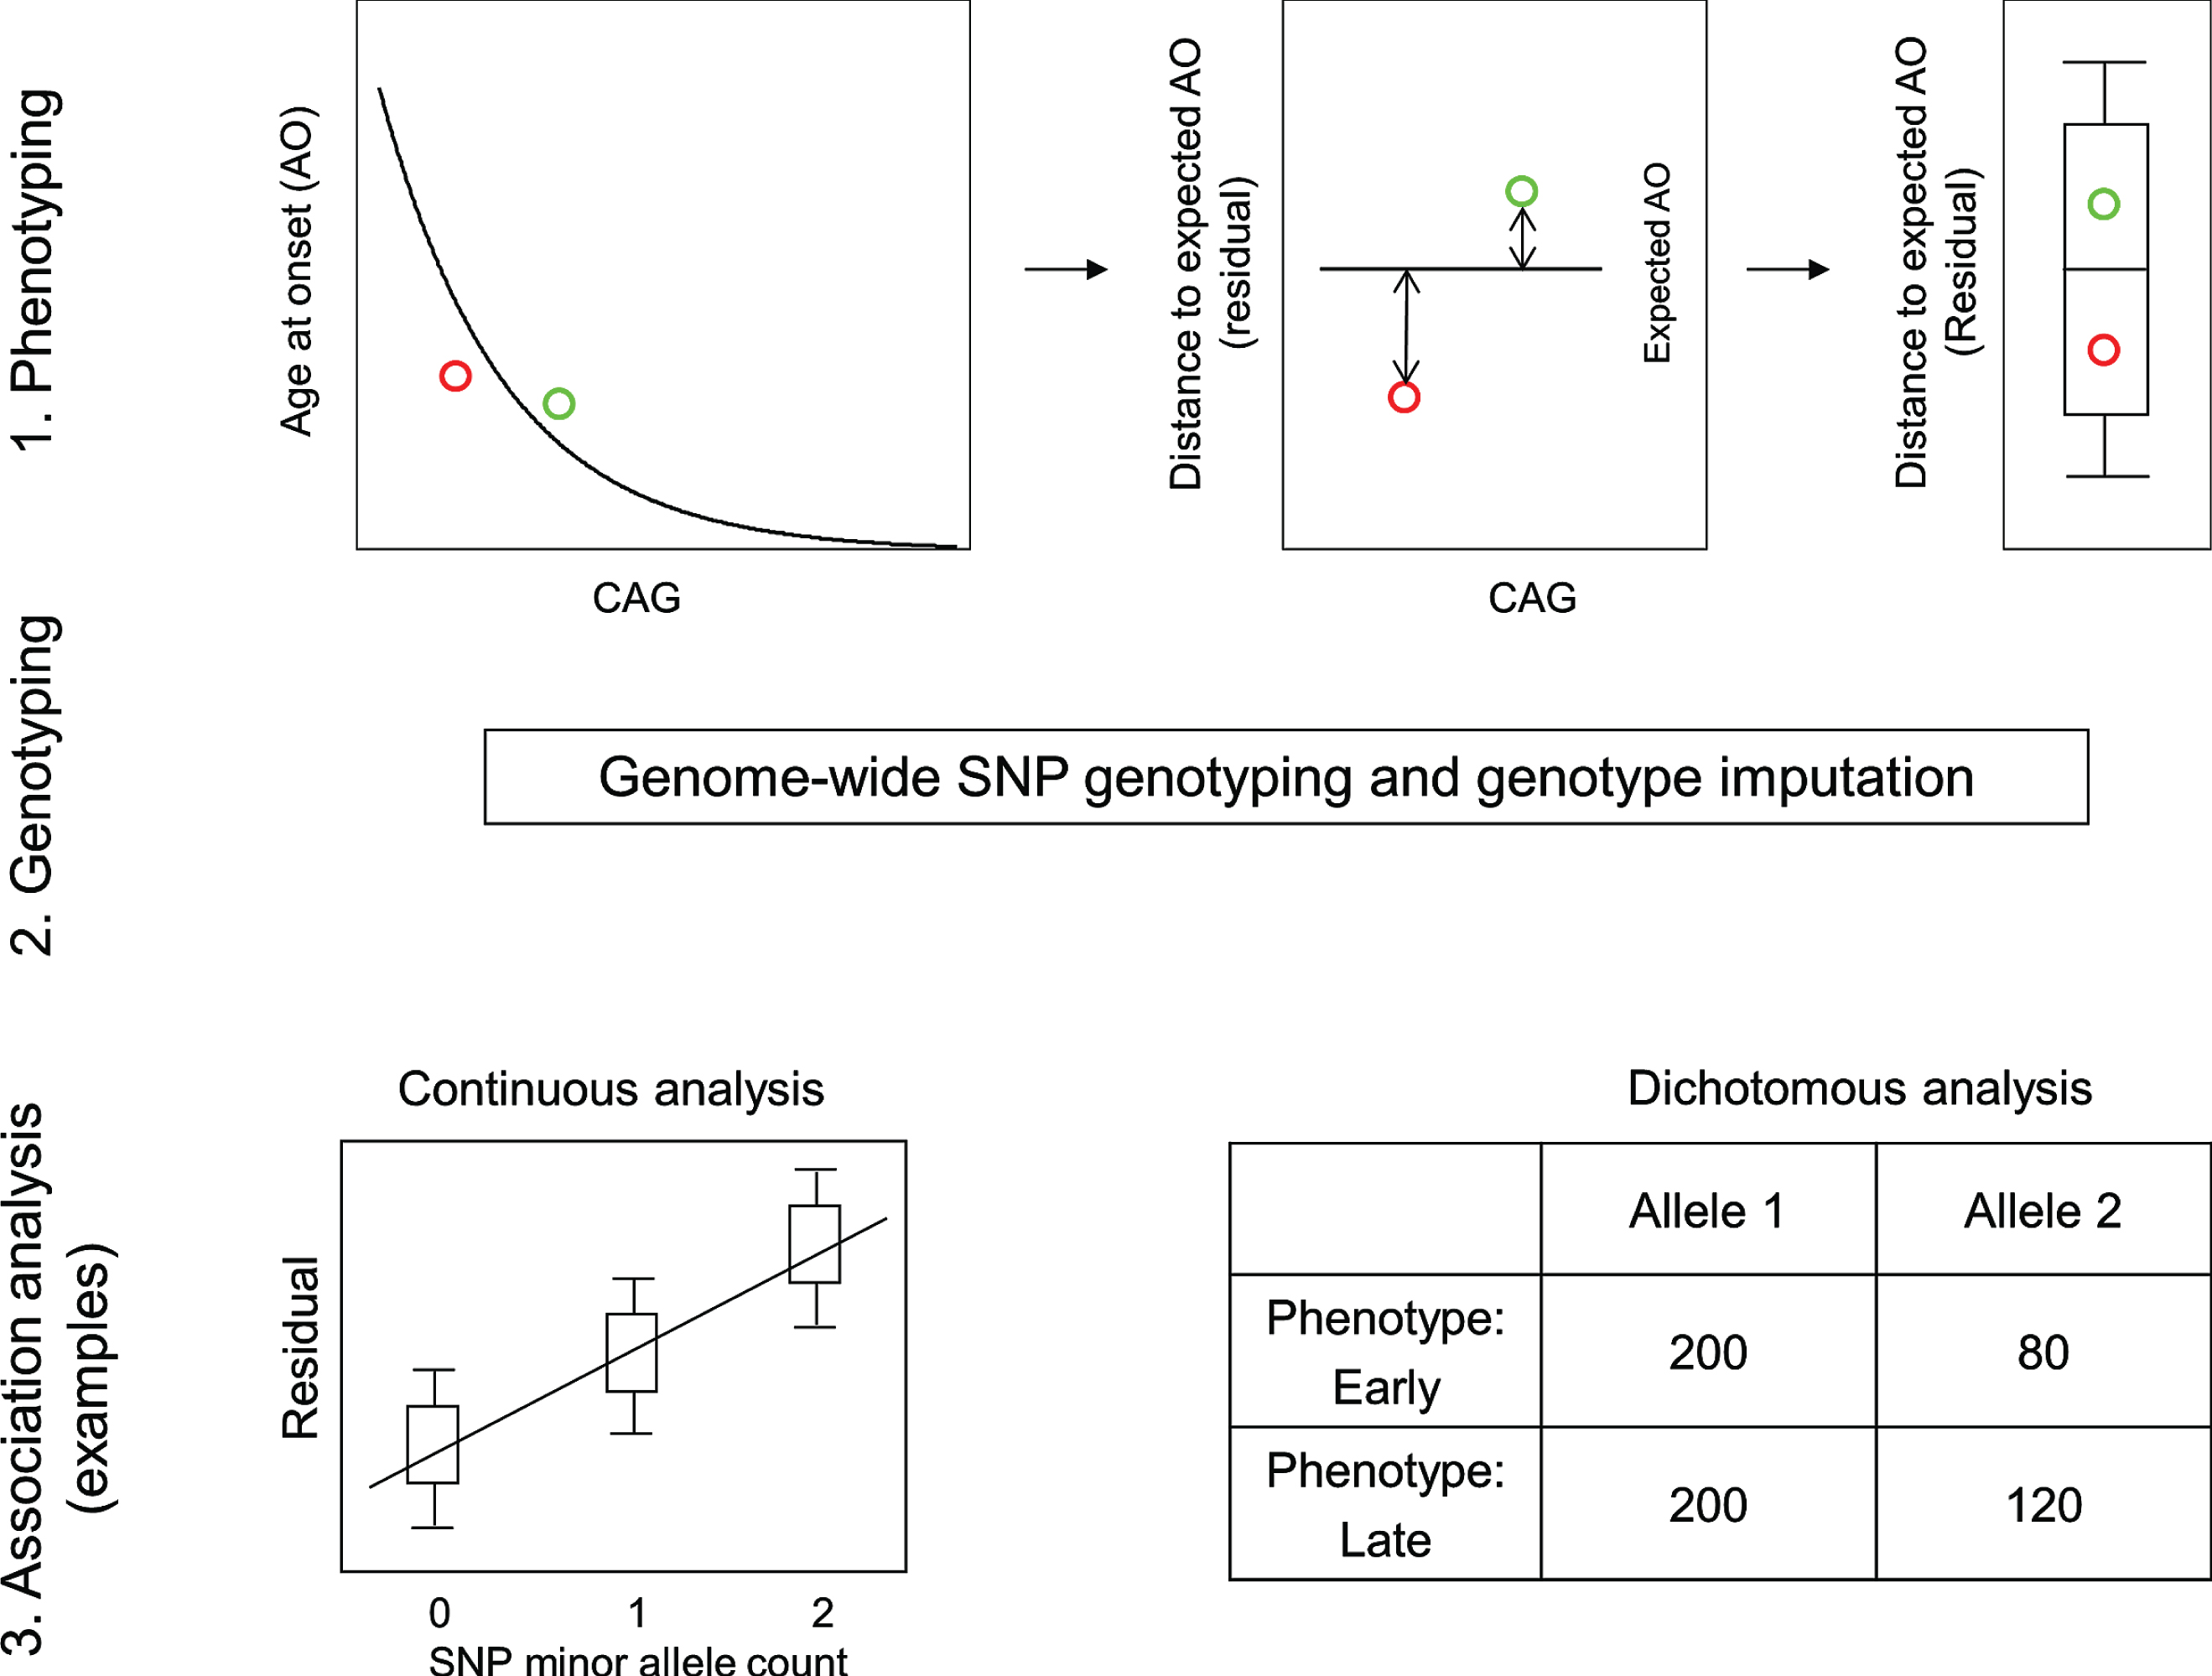
The requirement for a robust HD phenotype that accounts for the effect of the CAG repeat was fulfilled by a rigorous statistical assessment of the relationship between inherited CAG repeat length and age at motor onset. This revealed the danger of including disproportionately influential outliers and resulted in restricting the analysis to CAG repeat lengths typically associated with adult-onset (40 to 53–55) and representation of a sufficient number of subjects for reliable analysis [20]. These criteria were met by >90% of HD subjects, allowing the generation of a standard curve relating CAG repeat size to mean age-at-onset and thereby providing the expected age-at-onset for any individual based upon their inherited CAG repeat length. A comparison of this expected age-at-onset with the age-at-onset observed for the individual provided the required phenotype for analysis of the genetic effects on onset after excluding the effects of the CAG repeat size (Fig. 2) [29]. Essentially, the expected age-at-onset was subtracted from the observed age-at-onset to yield the test phenotype, dubbed ‘residual age-at-onset’, which was either a positive or negative number of years depending on whether the subject’s onset was later or earlier than expected.
Fig.2
Continuous and dichotomous phenotypes used in GWA analysis. Three steps were taken to identify genetic modifiers in HD: 1) Phenotyping: For each HD subject, age at onset corrected for inherited CAG repeat length (i.e., residual age at onset) was calculated by subtracting the age at onset predicted for that individual (based on their CAG length in comparison with a large population of HD subjects) from the age at onset observed for that individual. 2) Genotyping: Genomic DNA samples were analyzed to determine genetic variations genome-wide, and subsequently used for genotype imputation using a large reference population in order to increase the number of SNPs available for analysis. 3) Association analysis: A statistical model was built to explain residual age at onset (continuous phenotype variable) as a function of a test SNP to judge significance in association between phenotype and genotype (continuous analysis). As a complementary approach, HD subjects with onset extremely earlier or later than their expected age at onset were identified based on residual age at onset, and for each test SNP, the allele frequencies were compared between the early and late groups (dichotomous analysis).
With residual age-at-onset defined as a relevant HD phenotype and the availability of several thousand unrelated HD subjects, it was possible to test the hypothesis that genetic variations at the HTT locus other than the CAG repeat size have an influence on age-at-onset. This was explored by cataloguing common single nucleotide polymorphisms (SNPs) across the gene to define haplotypes (i.e., the linear array of alleles at multiple SNPs along the chromosome, transmitted together to progeny as a physically linked set—essentially a digital fingerprint for the HTT region). It was established that expanded CAG alleles that cause HD exist on multiple different haplotypes, suggesting the historical occurrence of multiple independent ancestral HD CAG expansion mutations contributing to the current population of HD subjects [30–32]. However, there was no association of any of the most common haplotypes, accounting for more than 83% of HD subjects, with differences in age-at-onset, arguing that the genetic modifying factors generally act in trans, through genes distant from HTT [30]. Thus, while HD has been viewed as a prototypical autosomal dominant genetic disease with respect to whether an individual transmits the expanded CAG repeat (or not) to progeny, the timing of disease onset is actually polygenic, determined by the combined effects of the CAG repeat and of genetic factors at other loci.
An initial series of GWA studies sought these other genetic loci by testing for association of individual SNPs across the genome with residual age-at-onset in two different ways (Fig. 2) [29]. First the residual age-at-onset was treated as a quantitative trait and, for each individual was compared at each SNP across the genome to the number of minor alleles of that SNP (count = 0 for major allele homozygotes, 1 for heterozygotes and 2 for minor allele homozygotes) on the assumption that the effect of each minor allele on residual age-at-onset is additive. Second, the frequency of the minor allele was compared between groups representing the extremes of age-at-onset (i.e., the 20% of subjects with the most positive and the 20% with the most negative residual age-at-onset). Because of the very large multiple testing burden entailed in assessing so many SNPs (estimated at 1 million independent tests across the genome), statistical significance required achieving a p-value <5×10⁻⁸. These first GWA studies revealed genome-wide significant loci on chromosomes 8 and 15 that influence HD age-at-onset and a suggestive locus on chromosome 3 that became genome-wide significant in a follow-up study [29, 33].
A REVEALING TECHNICAL ARTEFACT
The success of the GWA strategy established the proof-of-principle that age-at-onset of HD can be altered and presented itself as a potential route to identifying processes validated directly in humans as potential targets for disease-modifying treatments. Since the power to identify significant loci grows dramatically with increased sample size, additional GWA studies were initiated using additional subjects from Registry and Enroll-HD. However, analysis of this larger sample revealed a technical artefact that would prove very informative concerning HD pathogenesis (see below: HD pathogenesis involves two sequential components).
After the identification of the HTT CAG repeat in the early 1990s, sequencing of the disease allele revealed that for most HD chromosomes the expanded CAG repeat is followed by CAACAG. Since both CAA and CAG are glutamine codons, the number of consecutive glutamines in the huntingtin protein exceeds the number of consecutive CAG codons in HTT by two units. This huntingtin polyglutamine segment has for more than two decades been investigated as the cause of the neuronal dysfunction and death that precipitates the manifestations of HD. However, the early sequencing studies of HD chromosomes also revealed rare variants that had a different sequence, most notably chromosomes that had only consecutive CAGs with no CAA [34, 35] and chromosomes in which the consecutive CAGs were followed by CAACAGCAACAG [36]. As the GWA sample size was increased, the number of such atypical HD chromosomes in the dataset grew and presented a problem for accurate analysis of residual age-at-onset. The inherited CAG size has typically been assigned by comparison of the size of a PCR amplified product from the subject to the size generated from previously sequenced standards in which the CAG repeat is known to be followed by CAACAG. DNA sequencing has shown this method to be highly accurate for ∼97% of all HD chromosomes. However, for the ∼3% of atypical alleles in which either the CAA is not present or the CAACAG is duplicated, this process results in assignment of an incorrect CAG repeat length and consequently, an incorrect residual age-at-onset. Therefore, for the most recent GWA studies [37], atypical HD chromosomes, identified based upon the distinct haplotypes on which they are found and the artefactual association signal that they produced, were sequenced in order to assign the correct CAG size for these subjects and then calculate their correct residual age-at-onset.
As noted when these rare polymorphisms were first reported [34–36], this technical consideration also has implications important for predictive testing in HD, since genotyping by PCR fragment-sizing will deliver an incorrect CAG repeat size for a small minority of individuals. Indeed, in addition to the two atypical variants described above, there are other rarer variations that can interrupt the CAG repeat or alter the sequence immediately downstream [37, 38]. Consequently, when fragment sizing predicts an allele length near the diagnostic boundaries, there is a need to perform extra assays to determine the precise uninterrupted CAG repeat length [39].
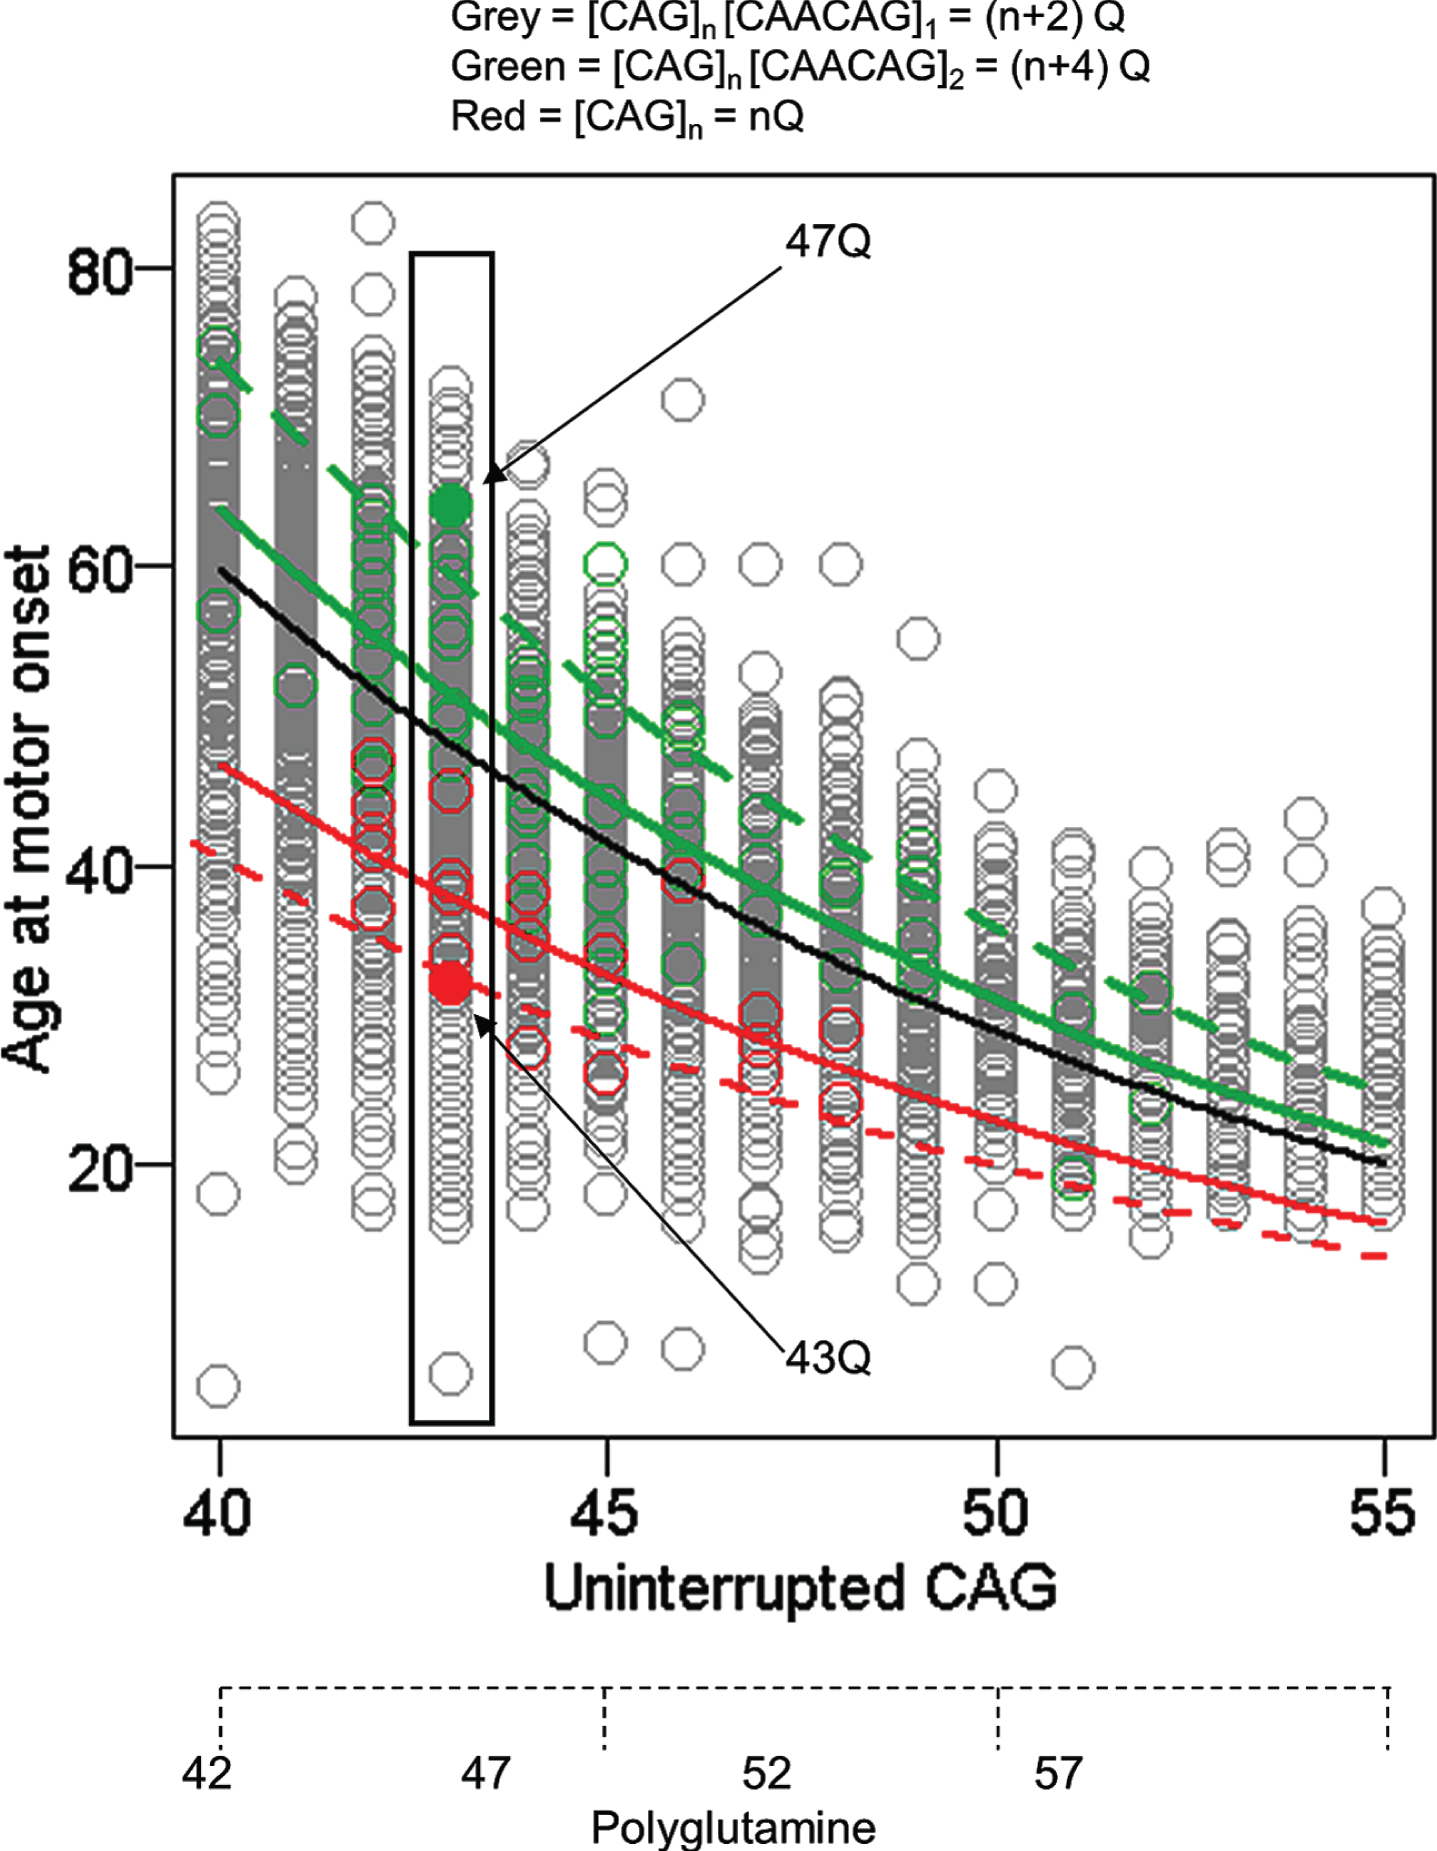
While this technical artefact of fragment size-based genotyping was overcome for GWA analysis, the alleles that caused it provided a valuable opportunity to assess whether the timing of HD onset is due to the size of the CAG repeat or to the size of the polyglutamine tract in huntingtin. Whereas huntingtin produced from most HD chromosomes has 2 more glutamines than consecutive CAGs in HTT, alleles without the CAA codon produce the same number of consecutive glutamines as they have consecutive CAGs and those where the CAG repeat is followed by CAACAGCAACAG specify 4 more glutamines than their uninterrupted CAG tract. Comparison of uninterrupted CAG length and polyglutamine length with age-at-onset showed a much better fit with the former indicating that the timing of HD onset is determined by the length of uninterrupted CAGs, not by the length of polyglutamine encoded by the disease producing allele (Fig. 3). The argument against a polyglutamine effect is reinforced by examining any individual uninterrupted CAG repeat length (exemplified by individuals with 43 CAGs in Fig. 3) where the alleles with CAACAGCAACAG encode 4 more glutamines than the alleles with no CAA and yet show considerably later onset, even though earlier onset would be expected if length-dependent polyglutamine toxicity were involved. Although age-at-onset for subjects with these atypical alleles is well within the range seen for subjects with typical CAACAG-containing HD chromosomes, remaining deviation from the standard curve in each case may represent a cis-acting influence of the respective haplotype that merits more investigation. The conclusion that the timing of HD onset is determined primarily by uninterrupted CAG repeat length and not by the polyglutamine segment [37] has also been supported by studies of individuals and families with CAA loss alleles [38, 40].
Fig.3
Age at motor onset correlates best with uninterrupted CAG repeat length. The data from Figure 1 are replotted noting those individuals whose CAG size measure from PCR fragment-size genotyping was corrected after sequencing to account for the loss of the CAA interruption or duplication of the CAACAG segment in a small minority of subjects (red and green circles, respectively). The black line represents the age at onset to CAG length relationship predicted from all subjects. The dotted red and green lines respectively represent the age at onset to CAG length relationship for the rare CAA interruption or CAACAG duplication subjects based on the inaccurate CAG size from genotyping while the solid red and green lines show the result after correction of these CAG sizes by sequencing. The differences between these solid red and green lines and the black line might reflect subtler differences in the properties of uninterrupted CAG repeats depending on their surrounding sequence context or the presence of a linked modifier locus on these chromosome 4s. Those subjects with an uninterrupted CAG length of 43 are highlighted to permit comparison of polyQ length, showing by example of filled circles that CAA loss (red) and CAACAG duplication (green) subjects differ by 4 Qs, with those possessing the longer 47Q segment having later onset than those possessing the shorter 43Q segment. Subjects represented by grey circles at this CAG size all possess 45Qs.
CURRENT GWA FINDINGS
The most recent cumulative age-at-onset GWA findings derive from ∼9,000 HD subjects classified by genome-wide SNP analysis as having European ancestry, with non-Europeans being excluded to avoid the problem of false association signals due to differences in the frequencies of some variants in different populations (Fig. 4) [37].
Fig.4
Continuous and dichotomous GWA analysis of European-ancestry HD subjects. The levels of significance for each test SNP (circles) across the genome are mirrored for both continuous phenotype (top portion) and dichotomous phenotype (bottom portion) for ease of comparison. Numbers in the middle of the plot represent chromosomes, and horizontal lines indicate genome-wide significant p-values. The loci harboring genes involved in DNA maintenance/repair process are labeled only in the upper panel while those loci harboring genes not known to be central to these processes are labeled only in the lower panel.
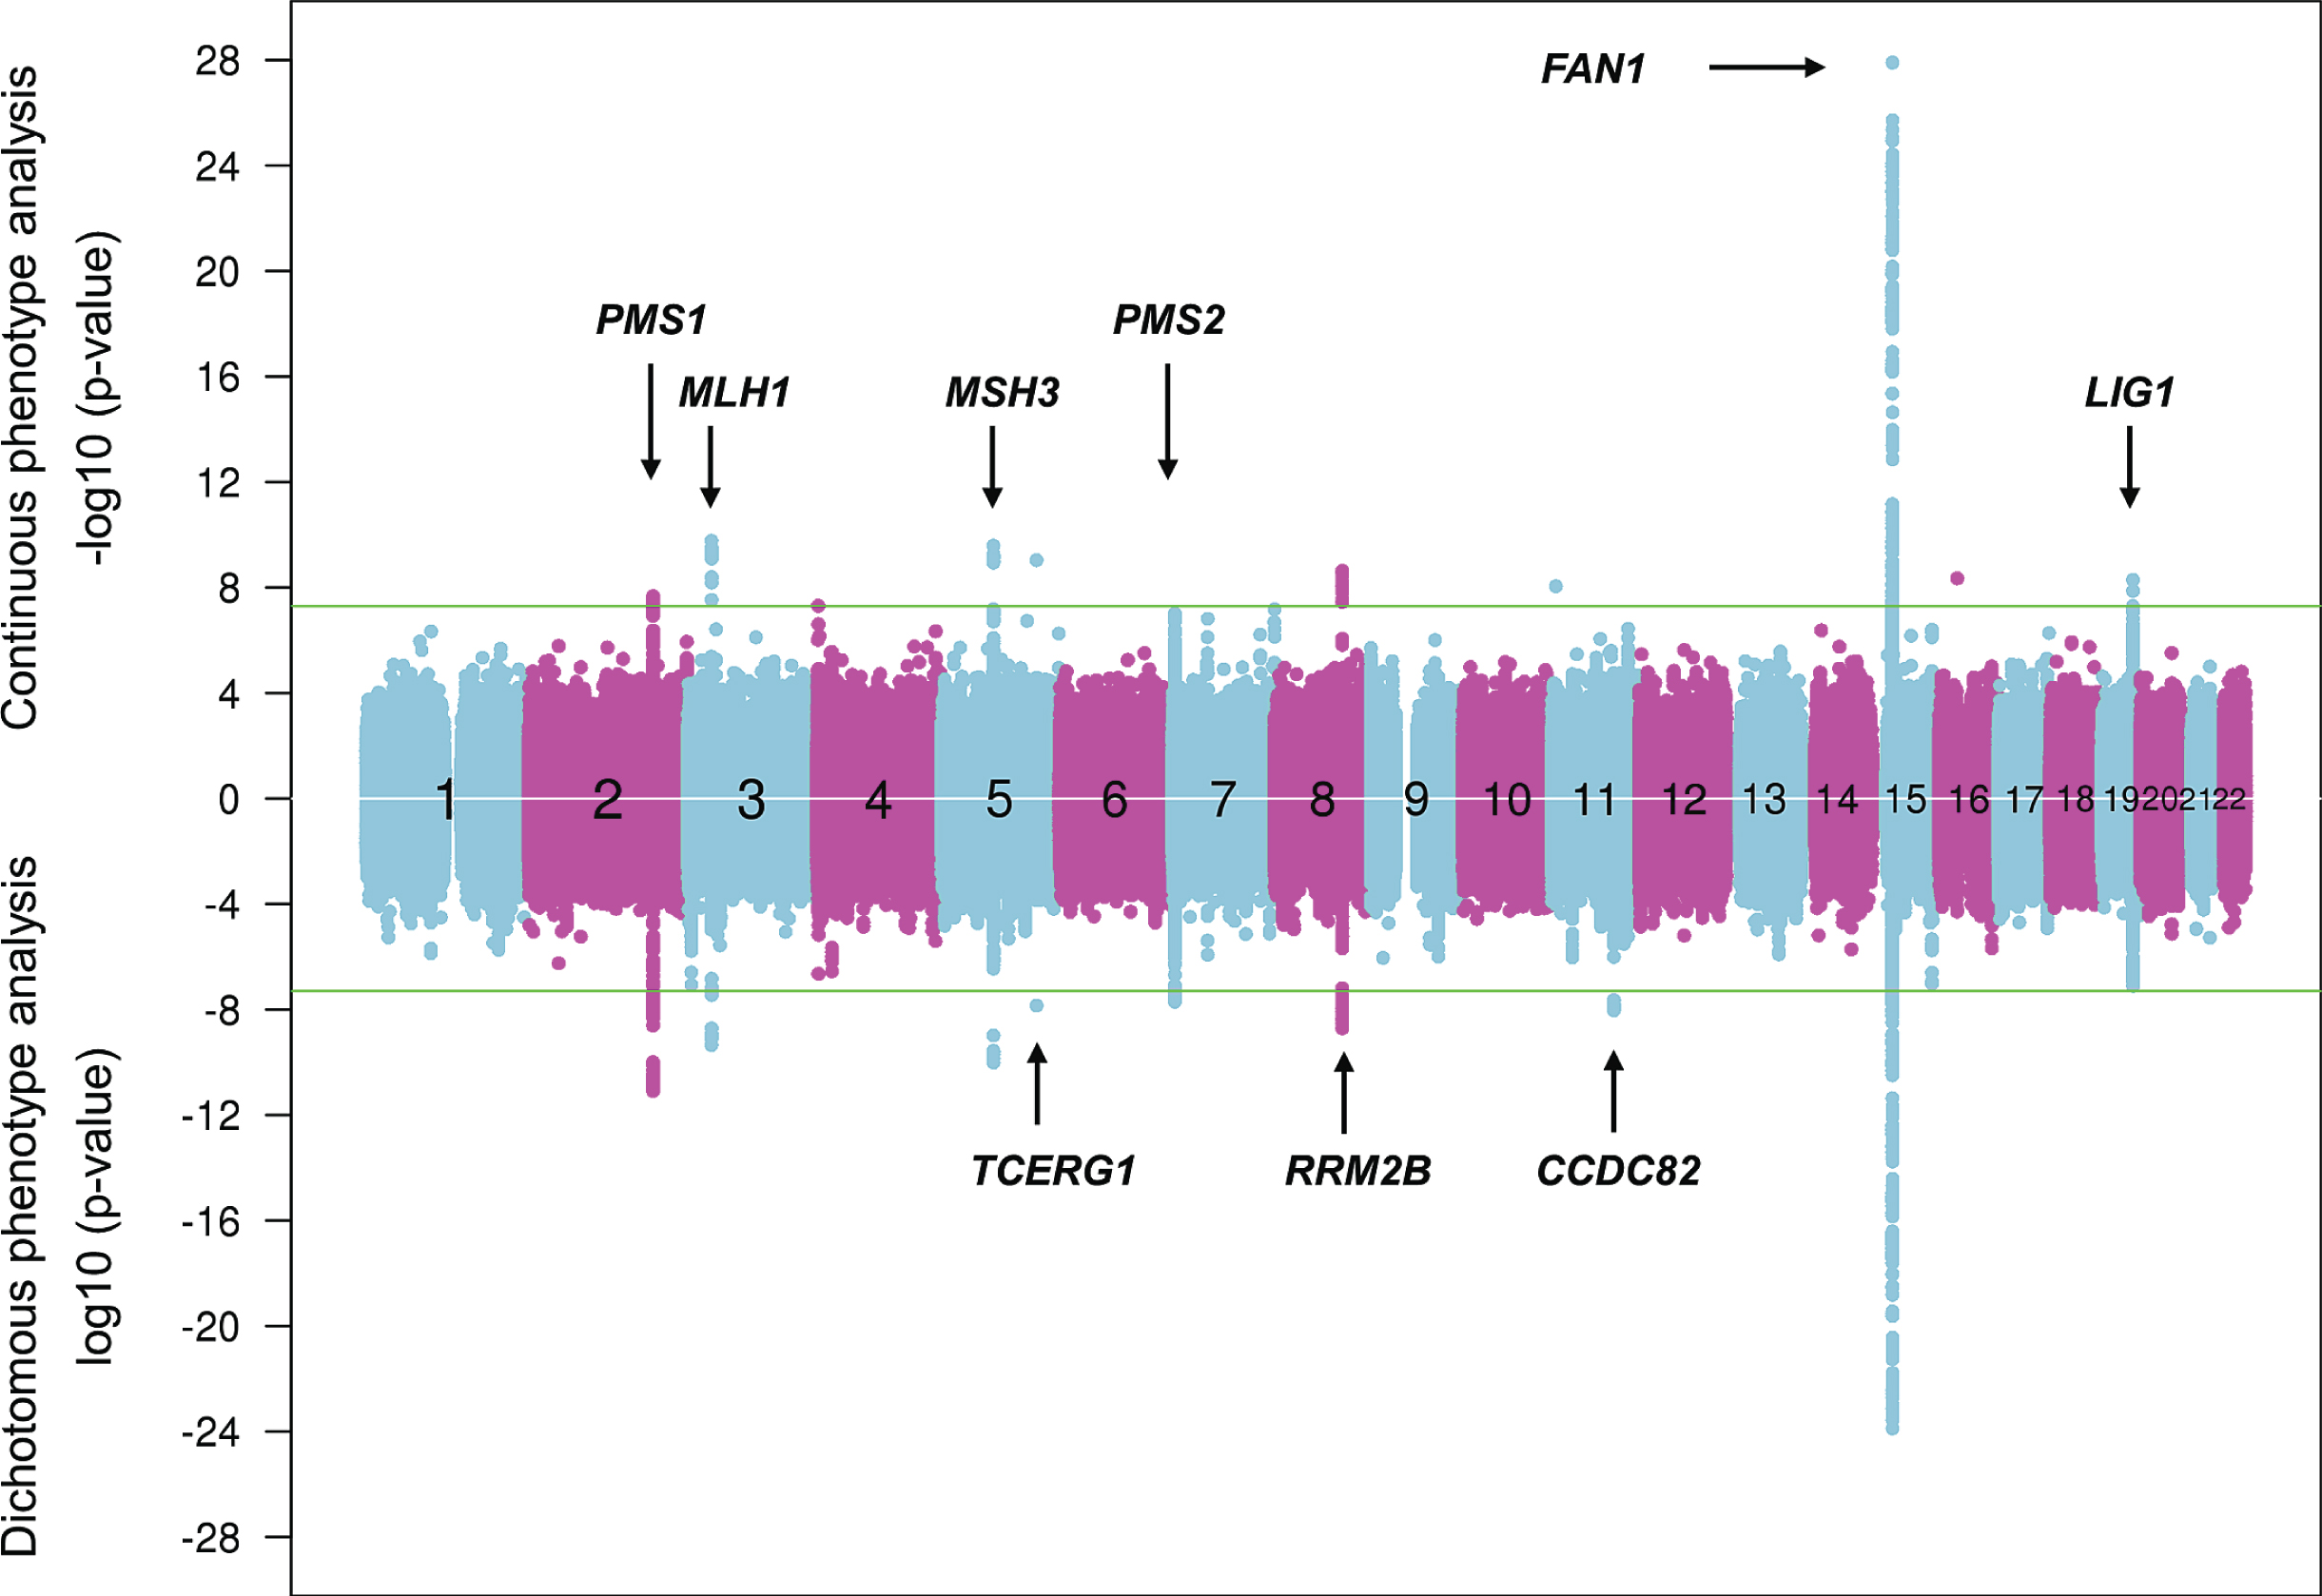
They have revealed 9 genome-wide significant loci, with 3 of these showing evidence of multiple different genetic effects, hastening or delaying HD onset depending on the haplotype at the modifier locus. For example, with the power of increased sample size, the locus on chromosome 15q, which revealed a common onset-delaying modifier effect (haplotype 15AM2) and a rarer onset-hastening modifier effect (haplotype 15AM1) in the first set of GWA studies [29] revealed two additional haplotypes (haplotypes 15AM3 and 15AM4) in the recent GWA report [37]. 15AM3 is associated with hastened onset and, like the 15AM1 effect, is due to a missense change in FAN1 (FANCD2 and FANCI associated nuclease 1) [41]. The 15AM2 effect appears to be mediated by increased expression of FAN1. As reported recently [41], the 15AM4 haplotype does not capture a single modifier effect, but rather a combination of the others, so is not independent. However, a fourth independent modifier effect, also onset hastening, has recently been associated with haplotype 15AM5. New significant loci on chromosomes 5 and 19 both show 3 independent modifier effects while the remaining loci currently appear each to involve a single modifier effect [37].
Strikingly, at 6 of the 9 loci, the significant SNPs are in the vicinity of a gene involved in DNA maintenance processes, including FAN1 (FANCD2 and FANCI associated nuclease 1) encoding a nuclease involved in interstrand DNA cross-link repair and in homologous recombination, MLH1 (mutL homolog 1), MSH3 (mutS homolog 3), PMS1 (PMS1 homolog 1), and PMS2 (PMS1 homolog 2) whose products are known for DNA mismatch repair (MMR) and LIG1 (DNA ligase 1) specifying an ATP-dependent ligase that repairs DNA nicks resulting from damage, replication, or recombination. Analysis of pathways revealed MMR to be significant based largely upon the four MMR genes noted above, while other integral MMR loci, such as MSH2, did not show significant signal, suggesting either that these loci do not have the requisite genetically determined variation in expression or function to emerge in an HD population-based GWA study or that the precise mechanism(s) involved in trinucleotide repeat instability may differ from canonical DNA repair pathways and requires more detailed investigation. Notably, the MSH3 locus has also been implicated as a modifier of phenotype-worsening in the TRACK-HD study, suggesting that continued somatic expansion of the CAG repeat after onset may hasten aspects of symptomatic progression [42].
Follow-up of the genetic studies of the significant modifier genes has provided evidence for both coding sequence alterations and genetic regulation of expression levels in some of these genes as being responsible for modifier effects [37, 38, 41, 43, 44]. However, amidst the wide variation in age-at-onset seen in HD, even among individuals with the same repeat length, the effect of the modifiers which is highly significant across the entire population is not sufficiently strong to allow prediction of age-at-onset in any given individual as illustrated by the plot of residual age-at-onset for individuals with 0, 1 and 2 tag alleles for the onset-hastening 5AM1 modifier effect and the onset-delaying 5AM3 and 15AM2 modifier effects (Fig. 5). Similarly, while HTT CAG instability occurs in the germline resulting in changes in CAG length through intergenerational transmission from generation to generation, it is not yet clear whether the same mechanism is involved as in somatic CAG repeat instability and is modified by the same genetic factors.
Fig.5
Modifier alleles are not predictive of age at onset in any given HD individual. For each of three modifier haplotypes (5AM1 and 5AM3 at MSH3 and 15AM2 at FAN1), a plot is shown relating the residual age at onset of HD subjects who inherited an uninterrupted CAG repeat length of 43 units, grouped by their genotype at the modifier locus, i.e., the number of copies of the SNP minor allele (0 = homozygous major allele; 1 = heterozygous; 2 = homozygous minor allele) that tags that particular haplotype (rs701383, rs1650742, and rs8034856, respectively) [37, 41]. Each HD subject is denoted by a blue circle with the population size (‘N’) for each genotype shown beside the distribution of residual age at onset values for that genotype. The dashed line is the trend line that reveals the influence of the modifier haplotype on age at onset, colored red for an onset-hastening effect (5AM1) and green for an onset-delaying effect (5AM3 and 15AM2), detectable and highly significant at the population level but not predictive of onset age in any given HD individual.
![Modifier alleles are not predictive of age at onset in any given HD individual. For each of three modifier haplotypes (5AM1 and 5AM3 at MSH3 and 15AM2 at FAN1), a plot is shown relating the residual age at onset of HD subjects who inherited an uninterrupted CAG repeat length of 43 units, grouped by their genotype at the modifier locus, i.e., the number of copies of the SNP minor allele (0 = homozygous major allele; 1 = heterozygous; 2 = homozygous minor allele) that tags that particular haplotype (rs701383, rs1650742, and rs8034856, respectively) [37, 41]. Each HD subject is denoted by a blue circle with the population size (‘N’) for each genotype shown beside the distribution of residual age at onset values for that genotype. The dashed line is the trend line that reveals the influence of the modifier haplotype on age at onset, colored red for an onset-hastening effect (5AM1) and green for an onset-delaying effect (5AM3 and 15AM2), detectable and highly significant at the population level but not predictive of onset age in any given HD individual.](https://content.iospress.com:443/media/jhd/2021/10-1/jhd-10-1-jhd200427/jhd-10-jhd200427-g005.jpg)
HD PATHOGENESIS INVOLVES TWO SEQUENTIAL COMPONENTS
The demonstration that the timing of HD onset is primarily determined by the length of the inherited CAG repeat but is also influenced by multiple modifier genes involved in DNA maintenance processes argues that the modifiers act upon the CAG repeat itself and supports HD pathogenesis involving two sequential components.
It has long been known that although HD CAG repeat lengths associated with adult onset can be reliably measured in blood DNA via the bulk of the PCR product in the fragment-based genotyping assay, they do display a low degree of length mosaicism which increases with CAG repeat size. However, in other tissues, particularly in brain, this mosaicism can be more extreme, indicative of somatic instability of the expanded CAG repeat that favors further expansion [45–47]. Indeed, a higher degree of somatic HTT CAG expansion in post-mortem human HD brain has been associated with earlier onset of disease [48]. Genetic manipulation of many of the mouse orthologues of the HD modifier genes has been demonstrated to influence the degree of somatic instability of trinucleotides in the mouse [49–52] and recent analysis in humans has revealed that the low degree of somatic mosaicism of the HTT CAG repeat in blood DNA of HD subjects is also modified by genotype at some of these loci [37, 38, 43]. Therefore, the combination of HD age-at-onset being driven by a length-dependent property of the expanded CAG repeat and being modified by genes that influence somatic instability of that CAG repeat argues that the timing of HD onset is determined by somatic expansion of the CAG repeat beyond its inherited length.
While the mechanism by which the expanded CAG repeat causes neuronal dysfunction and ultimate death remains not certain, it is tempting to imagine that progressively increasing CAG length would simultaneously result in progressively more severe dysfunction. However, the genetic data argue against a model of cumulative damage that is further aggravated by somatic CAG expansion. First, the demonstration that at any given CAG length, longer polyglutamine lengths are not contributing to earlier onset indicates that, at least prior to the emergence of diagnostic motor signs, polyglutamine damage is not a rate driver [37, 38, 40]. Second, HD is unusual among human genetic disorders in demonstrating complete phenotypic dominance with respect to disease onset [20]. The investigation of many individuals where both HTT CAG repeat alleles are in the expanded range and there is no normal allele has revealed that the effect of the expanded alleles is not additive; rather, such HD subjects display an age-at-onset comparable to that expected based upon their longer CAG repeat, not earlier as would be expected if both repeats were contributing to ongoing damage.
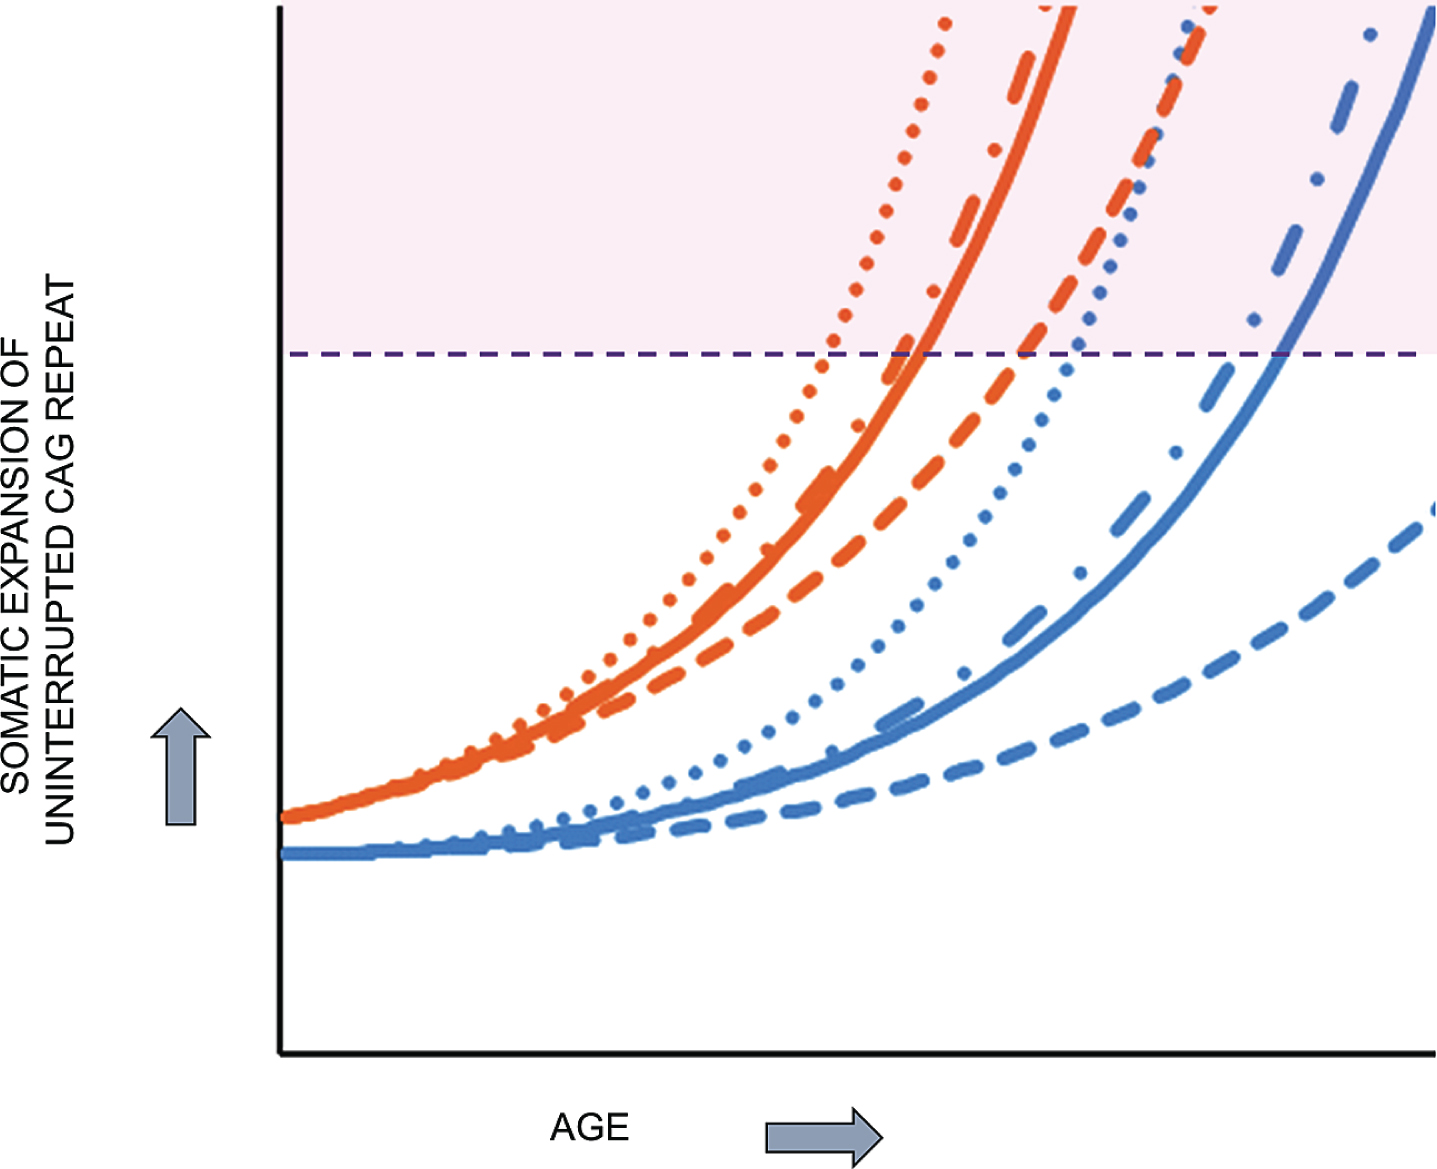
Together, the above considerations are most compatible with HD pathogenesis resulting from two sequential components (Fig. 6): 1) the inherited expanded HTT CAG repeat undergoes further expansion somatically toward a critical threshold length in vulnerable cell types and 2) when the threshold length is reached, a mechanism is triggered that causes damage, dysfunction and ultimately cell death. Based purely on computational analysis, Kaplan et al. proposed more than a decade ago that somatic expansion may explain the rate at which onset occurs in trinucleotide repeat diseases [53]. Their analysis of onset data from HD and other trinucleotide repeat disorders led to a computational model that does not involve continuous damage but postulates the expanded CAG repeat undergoing somatic expansion with a rapidly increasing propensity for further expansion as its length increases toward a critical threshold. This model is compatible with the lack of an effect of a second expanded HTT CAG allele in individuals with no normal allele, since it favors the longer of the two expanded CAG repeats reaching the critical threshold first and unleashing a damage mechanism that is not significantly aggravated by the second sub-threshold allele.
Fig.6
HD pathogenesis consists of two sequential components: somatic CAG expansion that results in cellular damage after a threshold length is reached. To illustrate the concept of a two component model of HD pathogenesis, which likely also applies to at least some other repeat disorders, hypothetical plots are shown for somatic expansion in the average target cell for two different starting alleles, uninterrupted CAG repeats of 45 units (orange), in the fully penetrant size range, and 38 units (blue), in the partially penetrant size range. Depicted are plots in the absence of a modifier (solid line) and in the presence of a strong onset-delaying modifier (dashed line), a weak onset-hastening modifier (dash-dotted line) or a strong onset-hastening modifier (dotted line). Somatic expansion the CAG repeat causes it to cross a threshold length (denoted by the dashed purple line) and trigger damaging consequences once in the range shaded as light purple. The CAG repeat inherited as 45 units crosses the threshold line at an early age that can be shifted earlier or later by modifiers of somatic CAG expansion while somatic expansion of the 38 CAG repeat crosses the threshold only late in life, except that in the presence of the strong onset-delaying modifier, the somatic CAG length in the average cell never exceeds the critical threshold to trigger damage during the lifetime of the subject.
In this two-component view of HD pathogenesis, the nature of the damage mechanism that results in toxicity and the threshold CAG length that precipitates it remain uncertain. Compound heterozygosity for deleterious HTT mutations leads to a severe neurodevelopmental disorder [54, 55], but simple heterozygosity for such variants and even for an HTT gene bisected by a balanced translocation [56] shows no evidence of haploinsufficiency, indicating that loss of 50% of huntingtin levels is compatible with development to adulthood without evident abnormal phenotype. On the other hand, HTT is constrained with respect to heterozygous loss-of-function mutations, since these are less frequent than expected in the general population indicating that they are subject at some point to negative selection although there is no evidence that this purifying selection involves neurological or neurodegenerative manifestations [57].
Consequently, rather than simple loss-of-function, the HD damage mechanism must involve a dominant gain-of-function. However, that gain-of-function might act at any level, DNA, RNA or protein. The last has been subject to the greatest scrutiny, without mutant huntingtin being identified definitively as either a driver, a participant, or a bystander with respect to the toxicity that occurs in human HD subjects [58]. Other potential damage mechanisms have been proposed at the RNA and even the DNA level that also merit further exploration [59–64]. Since HD involves effects on multiple different cell types in different brain regions, it is also conceivable both that different threshold CAG repeat lengths must be reached to trigger a damage mechanism in different cells and that the mechanisms triggered differ by cell type and region/developmental stage.
OTHER REPEAT DISORDERS
The general concept of two sequential components—the somatic expansion rate driver and a subsequent damage/toxicity driver—likely also applies to pathogenesis in other trinucleotide repeat disorders where age-at-onset is inversely correlated with the length of expanded repeats in other genes. Indeed, age-at-onset in the spinocerebellar ataxias is also influenced by DNA maintenance modifiers that act in HD, supporting somatic expansion as a rate driver in these disorders [65]. Further, in spinocerebellar ataxia 1 (SCA1; OMIM # 164400) internal CAT (histidine) interruptions in the ATXN1 CAG region on most normal chromosomes are expected to limit the repeat’s somatic instability, while disease alleles show either loss of these interruptions to form a longer uninterrupted CAG repeat or, more rarely, a segment flanking the interruptions that provides a sufficiently long uninterrupted CAG stretch [66]. In some of these other disorders, such as SCA1 and spinocerebellar ataxia 2 (SCA2; OMIM # 183090), individuals with two expanded CAG alleles do not show earlier age-at-onset than individuals with one expanded allele [67], supporting the view that somatic expansion to a critical threshold rather than cumulative damage determines the timing of onset. Those disorders where subjects with two expanded alleles do show moderately earlier onset, such as spinocerebellar ataxia 3 (SCA3; OMIM # 109150) and dentatorubropallidoluysian atrophy (DRPLA; OMIM # 125370) [67], involve larger inherited CAG repeats whose propensity for somatic instability may already be close to the maximum achievable within their sequence context or whose size may be close to the critical threshold in that disorder, making it more likely, given the stochastic nature of somatic expansion, that the threshold is reached somewhat sooner in an individual with two expanded alleles than with only one.
Each of these inherited neurodegenerative disorders shows a distinct clinical presentation, presumably with the identity of the vulnerable cells depending on the nature of the mechanism that causes damage/toxicity and a timing determined by the rate of somatic expansion of the disease repeat in the particular target cells and the specific threshold CAG length needed to trigger the damage/toxicity mechanism in those cells. Experiments in the mouse, complemented by human post-mortem tissue studies, have indicated that each tissue varies in its inherent capacity to support somatic expansion, with striatum being the brain region most prone to increases in CAG repeat length and cerebellum the least [45–48, 68]. Therefore, the clinical differences between such trinucleotide repeat disorders are most likely to lie in the threshold repeat length required to trigger damage in vulnerable cells, which may be quite different from tissue to tissue, and in the particular mechanisms that cause damage, which again are likely to be distinct and may vary between tissues, even within the same disease. For example, CAG repeats in HTT and ATXN1 show similar profiles of expansion in post-mortem human disease brains [69], yet the first is associated with Huntington’s disease and the latter with SCA1, presumably because the mechanism of toxicity and the threshold CAG length required to trigger it in vulnerable cells differ between the two loci. Indeed, there is strong evidence in the mouse that cerebellar degeneration in a SCA1 model results from a gain-of-function at the protein level that requires interaction of ATXN1 with capicua, but the same mechanism does not explain the cell loss in brain stem. Similarly, spinocerebellar ataxia 12 (SCA12; OMIM #604326) is caused by a CAG repeat in the 5’untranslated region of the PPP2R2B gene that does not act through polyglutamine but may act at the RNA level [70]. However, while each repeat disorder may present different and multiple mechanisms of cellular damage leading to the characteristic clinical presentation, the DNA maintenance processes that influence somatic instability in HD are likely to provide targets for development of therapies that could be applied broadly across many other repeat disorders to prevent or delay their clinical onset.
THE GEM EURO 9K WEBSITE
In the GWA studies of age-at-onset, three of the genome-wide significant loci point to genes not directly involved in DNA maintenance: RRM2B (ribonucleotide reductase regulatory TP53 inducible subunit M2B), TCERG1 (transcription elongation regulator 1) and CCDC82 (coiled-coil domain containing 82) [37]. These modifiers may act indirectly on the DNA maintenance processes that influence somatic expansion, or it is possible that they act on the damage mechanism or its downstream consequences. While the GeM-HD Consortium intends to further expand its GWA sample size and investigate additional HD phenotypes in order to dig deeper into the modifiers that affect CAG instability, a major hope is that the delineation of modifiers that affect other processes will be revealing concerning the nature of the damage mechanism(s) that leads to deterioration and ultimately to death. Moreover, to foster modifier studies more broadly, we have constructed the GeM Euro 9K website to make the GWA data (with CAG sizes determined by sequencing in individuals with tag SNPs for the CAA loss or CAACAG duplication variants) available to the HD research community with functionality that acts as a tool for generating hypotheses and the opportunity to download the existing GWA data to test them.
This resource, which can be accessed through the HDinHD website (https://www.hdinhd.org/), provides four main capabilities (Fig. 7): 1) generation of a regional SNP association regional plot, 2) viewing of HD modifier GWA data in the UCSC Genome Browser (using a custom track), 3) download of summary data, and 4) gene set enrichment analysis. Functions for the SNP association region plot, USCS custom track, and summary data download are based on SNP association analysis from the most recent GWA analysis using uninterrupted CAG repeat sizes determined by sequencing atypical alleles identified by tag SNPs for the CAA and CAACAGCAACAG polymorphisms. The gene set enrichment analysis module uses gene association data converted from SNP association data.
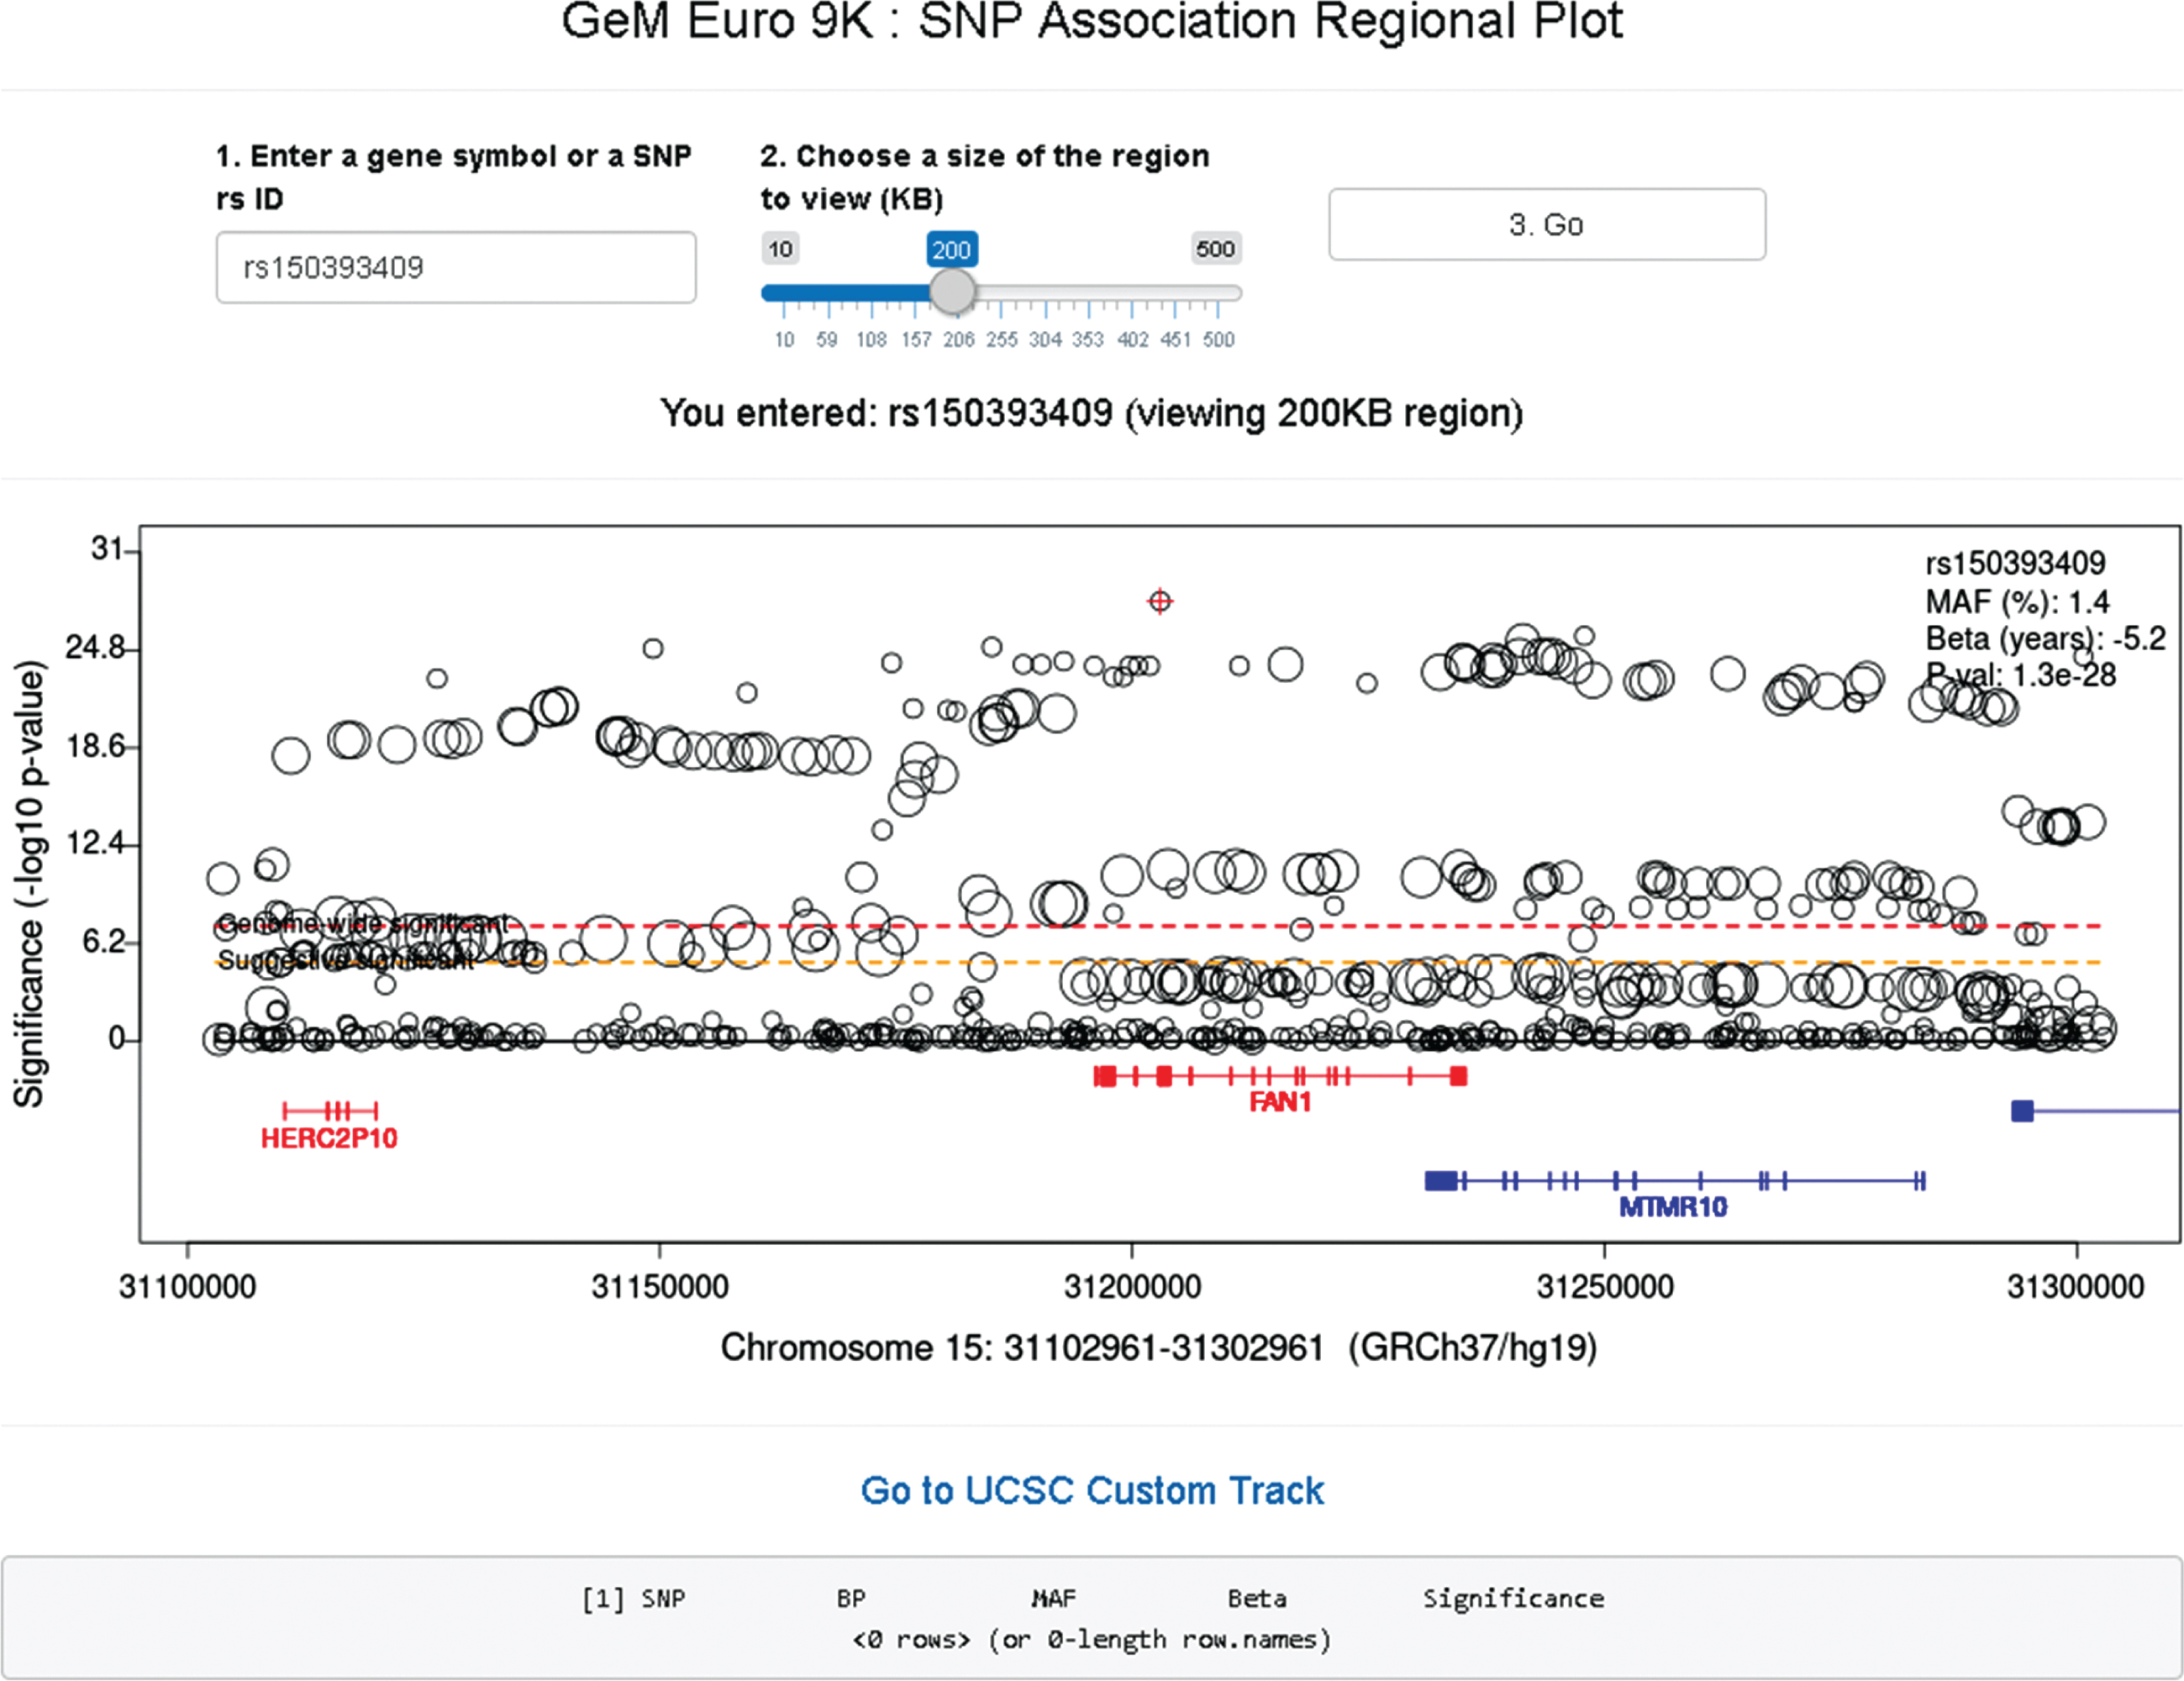
In the SNP association regional plot function (Fig. 8), users can obtain a graphical summary of SNP association results. Users are required to 1) enter either an official gene symbol (case sensitive) or a SNP rs ID (dbSNP 151), 2) select a size of region to view (10–500 KB), and 3) click the “Go” button. If the user’s input is found within our GWA data, a plot is generated. Typically, the regional plot shows significance levels on the Y-axis (i.e., –log10 (p-value)) and genomic coordinates on the X-axis; each test SNP in the region is represented by a circle whose size is proportional to its minor allele frequency. At the bottom of the plot, RefSeq transcripts in the region are displayed, with genes on the plus and minus strand in red and blue, respectively. If for a given gene multiple transcripts exist in the RefSeq database, we combine all exons for the plot (similar to the “dense” option in the UCSC genome browser). If the subject of the search is an individual SNP, information concerning that SNP is displayed at the top right corner of the regional plot. The regional plot supports interaction with users; if a SNP is selected by mouse clicking, information concerning the selected SNP is in a table below. The basic association regional plot function utilizes the original SNP association analysis results and can be used without any bioinformatics expertise. However, the regional SNP association plot should be interpreted carefully since most associated SNPs represent an indirect association, marking regions harboring modifier effects. The patterns and range of linkage disequilibrium vary depending on the region, posing a challenge in pinpointing the source of the modifier effect from SNP association analysis results. Therefore, it is strongly advised that users understand the inherent limitations in interpreting the SNP association regional plots.
Fig.7
GeM-HD Euro 9K website. The opening page of the GeM-HD Euro 9K website, which can be accessed through HDinHD (https://www.hdinhd.org/), provides links to regional association plots by gene or SNP, to the University of California at Santa Cruz Genome Browser with a custom track for the GWA data, to a summary data download and to a utility that performs Gene Set Enrichment Analysis for user-specified custom gene sets.
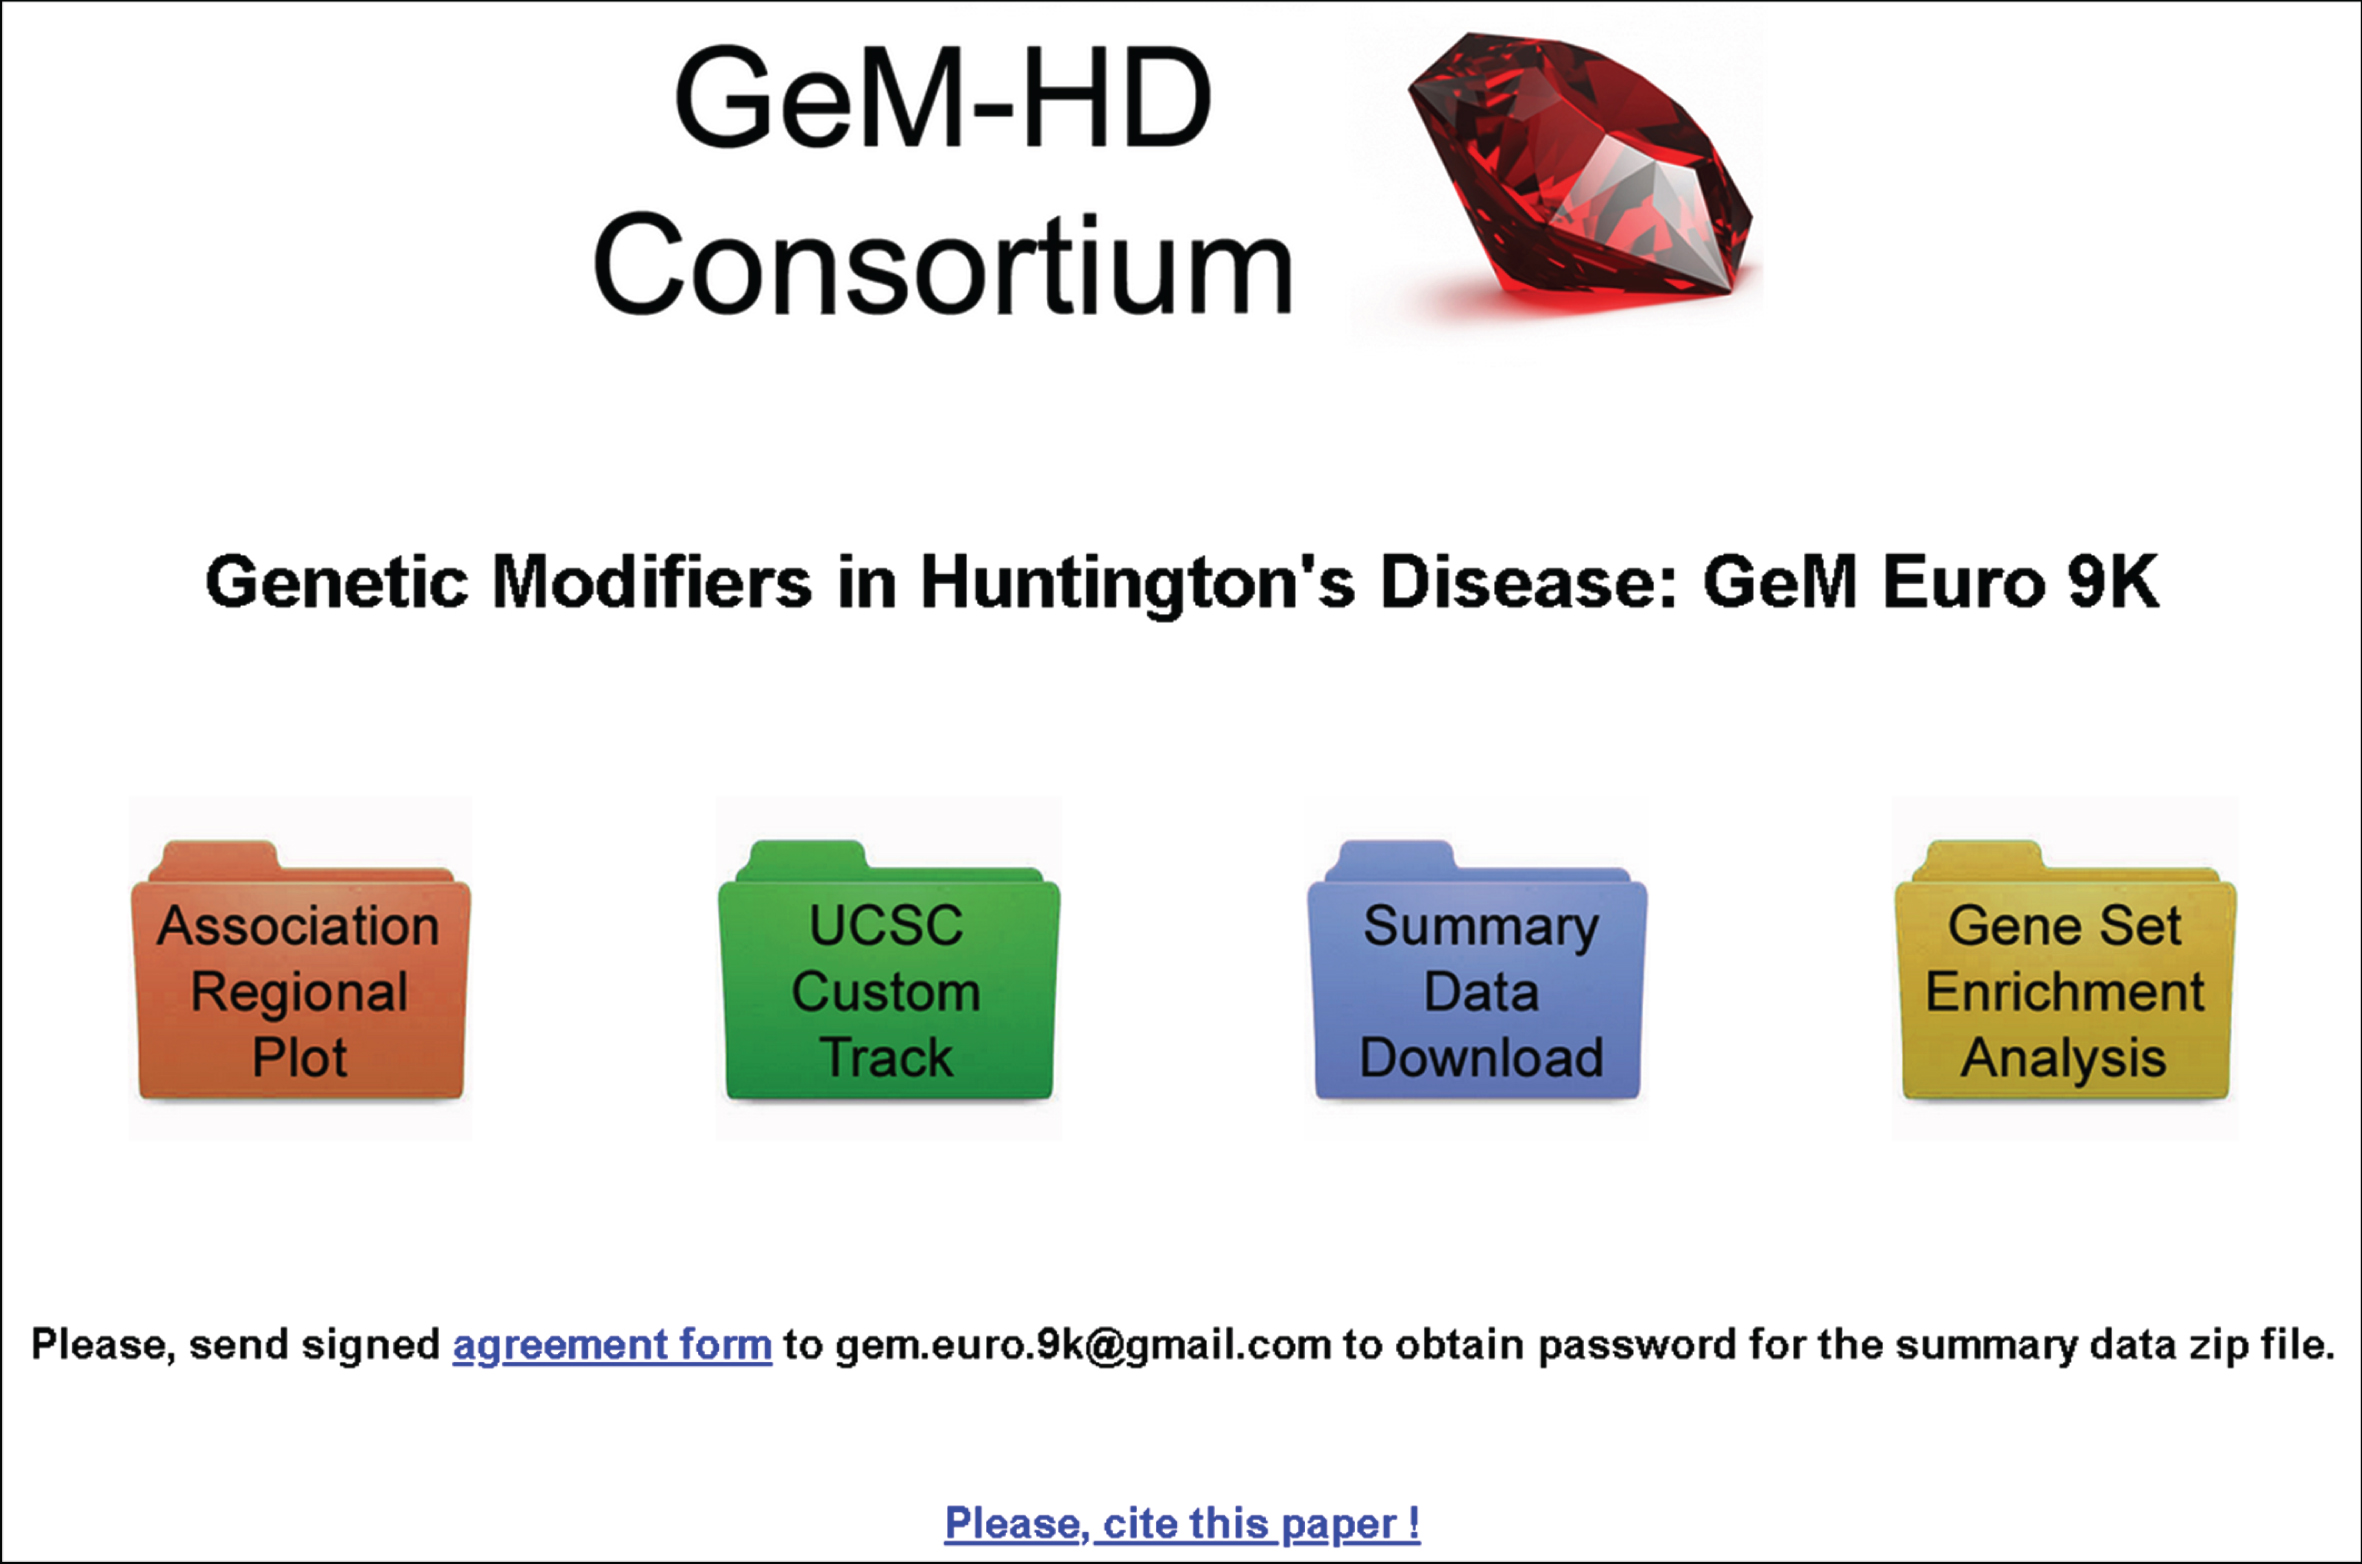
Fig.8
GeM-HD Euro 9K provides regional association plots by gene or SNP. Regional association plots can be generated by entering a gene symbol (case-sensitive) or SNP rs ID as explained in the text.
The SNP regional plot function per se also does not provide any other annotations of SNPs or genes. However, the SNP regional plot function generates a link to the UCSC genome browser for the selected viewing region, so users can utilize all annotations available in the genome browser. Alternatively, our GWA data can be viewed with other annotations provided by the UCSC Genome Browser by clicking the second icon in the main website page, which opens the UCSC genome browser with a custom track showing significance values (i.e., –log10 (p-value)) of SNPs in our GWA. Users must select the “full” option in the Custom Tracks to view the HD modification GWA data and can then avail themselves of all functionalities of the UCSC Genome Browser.
For users who want to perform analyses that are not supported by our web site, the third icon in the main page will lead to a data download page. The entire SNP summary data that are the basis of SNP regional plot function and USCS custom track can be downloaded. To protect the integrity and ensure responsible use of the data, registration and agreement to the use terms are required to download the data. Send an inquiry email to the website administrator at E-mail: .
Lastly, we developed an analysis module where users can test enrichment of a custom gene set in our modifier GWA data (Fig. 9). For this, we converted SNP association p-values to gene association p-values; we took the best SNP p-value among variants that reside within a given gene. Since we observed significant statistical inflation in gene association p-values, we adjusted gene association p-values using a modified Sidak method [71]. In the gene set enrichment analysis module, users can obtain enrichment statistics and a summary table by 1) putting official gene symbols in the input panel (5–500 genes, one gene per line), 2) selecting a number of permutations (1,000–10,000), and 3) clicking the “3. Start permutations” button. Our analysis module searches the user’s input in our gene association data and provides overall mapping statistics on the top panel. Gene symbols not found in our data will be indicated. For 5 to 500 genes, a true enrichment score for the user’s gene set is calculated and compared to a null distribution of random gene sets produced by permutation. Also, returned is a summary table showing 1) number of genes in the user’s input, 2) number of genes mapped to our GWA data, 3) number of permutations, 4) true gene set score of the user’s gene set, and 5) empirical p-value. Figure 9 shows as an example analysis of a select set of mismatch repair genes with 1000 permutations.
Fig.9
GeM-HD Euro 9K performs Gene Set Enrichment Analysis (GSEA) for user-provided gene sets. GSEA analysis of the GWA association data can be performed for any custom gene set by entering the genes in the top left box and selecting a number of permutations using the slider below it. The null distribution will be returned with an indication of the significance of enrichment of the user-defined gene set noted by a red triangle.
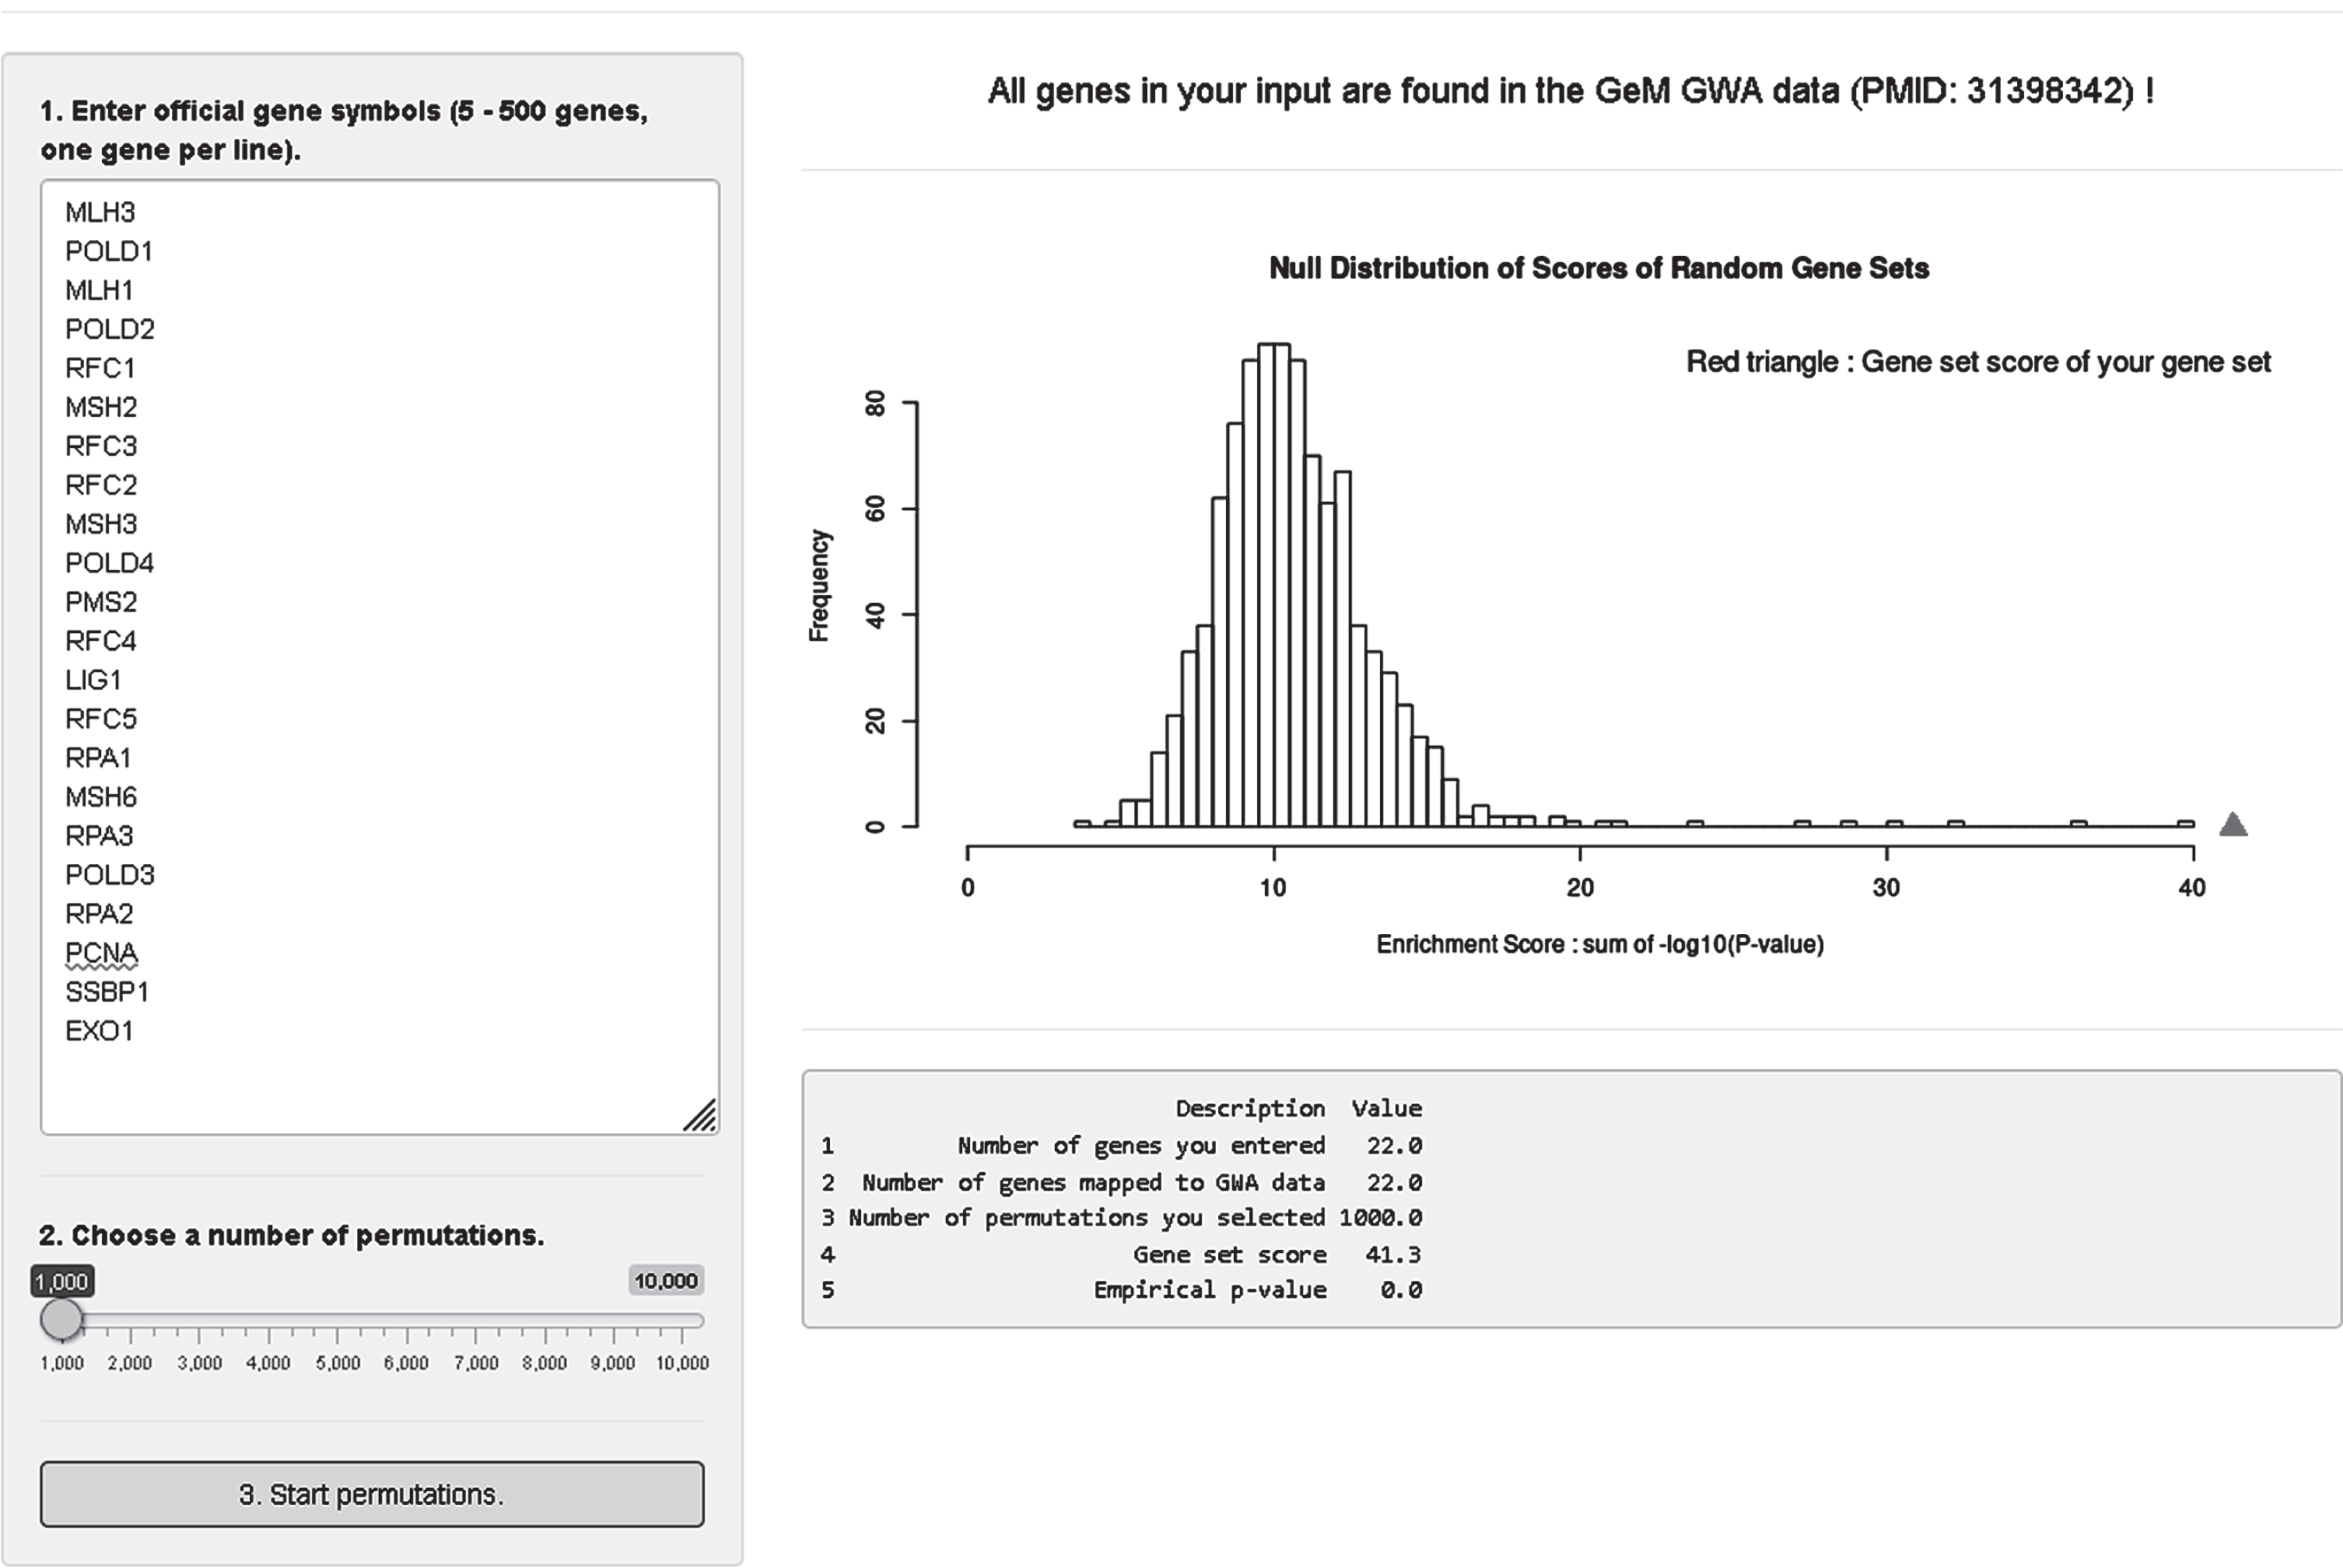
Although we provided results of pathway analysis as part of the recent HD modifier GWA publication [37], we believe that this analysis module can be quite useful for many investigators who want to test custom gene sets that are not part of the publicly available pathway collections. Users can obtain permutation-based enrichment statistics by simply entering gene symbols into the website. Our host website infrastructure does not support highly CPU-intensive calculations, so we limit the maximum number of permutations to 10,000. We recommend using a small number of permutations, and then increasing if necessary. Note also that our gene set enrichment analysis uses gene p-values based on the single best SNP on the combined transcripts for a given gene. If strong association signals span multiple genes, all of those genes will be represented by significant p-values. If multiple modifier haplotypes exist, only the haplotype generating the best SNP p-value will be used when converting to gene p-value. When the best SNP in the region is in an intergenic region, the gene p-value may be underestimated. Despite these limitations, we reason that our gene set enrichment analysis module provides a useful first step for judging the levels of overall enrichment of custom gene sets, after which users can perform more detailed analysis (e.g., performing different SNP to gene mapping and enrichment analysis algorithm) by downloading the entire summary data set.
CONCLUSION
In the investigation of any human disease, the human subject is the gold standard against which experimental findings concerning pathogenesis must be judged. In genetic disease, the human subjects themselves can inform understanding of both the mechanism that generates the disorder and point to potential routes for therapy. For HD, human genetic analysis has pointed to the uninterrupted HTT CAG repeat as both the genesis of the disorder and the driver of its rate of onset, discounting ongoing toxicity until somatic expansion of the CAG repeat reaches a threshold length that triggers one or more damage mechanisms that drive neuronal dysfunction and pathology. Genetic and experimental findings point to different cells predisposing to different rates of somatic expansion and the potential for different thresholds, different drivers of damage and ultimate toxicity and different phenotypic consequences, both within HD and across other repeat disorders. The polygenic contribution influencing the rate of HD onset identifies DNA maintenance processes as targets for development of therapeutic interventions to delay or prevent onset not only of HD but also of other repeat disorders. While these genetic modifiers are informative concerning disease mechanism and may have some value for stratification in group analyses, such as in clinical trials, they are of limited predictive value for individuals. It is likely that there is also a polygenic contribution to the mechanisms that drive damage and toxicity, the first clues to which may potentially lie in the significant age-at-onset modifiers not known to be involved in DNA maintenance processes. Web-based access to the age-at-onset GWA data with tools to facilitate visualization and initial gene-set testing may help to generate additional hypotheses concerning both the rate driver and damage driver(s) and potential therapeutic approaches.
CONFLICT OF INTEREST
E.P.H., M.E.M, P.H., M.O., S.K. and J.M.L. have no disclosures.
V.C.W. is a scientific advisory board member of Triplet Therapeutics, a company developing new therapeutic approaches to address triplet repeat disorders such Huntington’s disease and Myotonic Dystrophy. Her financial interests in Triplet Therapeutics were reviewed and are managed by Massachusetts General Hospital and Partners HealthCare in accordance with their conflict of interest policies. She is a scientific advisory board member of LoQus23 Therapeutics and has provided paid consulting services to Alnylam.
L.J. is a member of the scientific advisory boards of Triplet Therapeutics and LoQus23 Therapeutics.
D.G.M. has been a scientific consultant and/or received honoraria or stock options from Biogen Idec, AMO Pharma, Charles River, Vertex Pharmaceuticals, Triplet Therapeutics, LoQus23, and Small Molecule RNA and has had research contracts with AMO Pharma and Vertex Pharmaceuticals.
J.D.L. is a paid Advisory Board member for F. Hoffmann-La Roche Ltd and uniQure biopharma B.V., and he is a paid consultant for Vaccinex Inc, Wave Life Sciences USA Inc, Genentech Inc, and Triplet Therapeutics Inc.
J.F.G. is a Scientific Advisory Board member and has a financial interest in Triplet Therapeutics, Inc. His NIH-funded project is using genetic and genomic approaches to uncover other genes that significantly influence when diagnosable symptoms emerge and how rapidly they worsen in Huntington Disease. The company is developing new therapeutic approaches to address triplet repeat disorders such Huntington’s Disease, Myotonic Dystrophy and spinocerebellar ataxias. His interests were reviewed and are managed by Massachusetts General Hospital and Partners HealthCare in accordance with their conflict of interest policies.
ACKNOWLEDGMENTS
The genetic work of the GeM-HD Consortium would not be possible without the vital contribution of the research participants and their families and the many clinical investigators who have contributed over the years to obtaining biological samples and phenotypic measures for these research participants. Supported by the CHDI Foundation, National Institutes of Health USA (NS016367, NS049206, NS082079, NS091161, and NS105709), the Medical Research Council (UK; MR/L010305/1) and by an Anonymous Donor.
REFERENCES
[1] | Gusella JF , Wexler NS , Conneally PM , Naylor SL , Anderson MA , Tanzi RE , et al. A polymorphic DNA marker genetically linked to Huntington’s disease. Nature. (1983) ;306: (5940):234–8. |
[2] | Meissen GJ , Myers RH , Mastromauro CA , Koroshetz WJ , Klinger KW , Farrer LA , et al. Predictive testing for Huntington’s disease with use of a linked DNA marker. N Engl J Med. (1988) ;318: (9):535–42. |
[3] | Huntington’s Disease Collaborative Research Group. A novel gene containing a trinucleotide repeat that is expanded and unstable on Huntington’s disease chromosomes. The Huntington’s Disease Collaborative Research Group. Cell. (1993) ;72: (6):971–83. |
[4] | La Spada AR , Wilson EM , Lubahn DB , Harding AE , Fischbeck KH . Androgen receptor gene mutations in X-linked spinal and bulbar muscular atrophy. Nature. (1991) ;352: (6330):77–9. |
[5] | Kremer EJ , Pritchard M , Lynch M , Yu S , Holman K , Baker E , et al. Mapping of DNA instability at the fragile X to a trinucleotide repeat sequence p(CCG)n. Science. (1991) ;252: (5013):1711–4. |
[6] | Brook JD , McCurrach ME , Harley HG , Buckler AJ , Church D , Aburatani H , et al. Molecular basis of myotonic dystrophy: Expansion of a trinucleotide (CTG) repeat at the 3’ end of a transcript encoding a protein kinase family member. Cell. (1992) ;68: (4):799–808. |
[7] | Orr HT , Chung MY , Banfi S , Kwiatkowski TJ Jr , ServadioA, BeaudetAL, et al. Expansion of an unstable trinucleotide CAG repeat in spinocerebellar ataxia type 1. Nat Genet. (1993) ;4: (3):221–6. |
[8] | Benjamin CM , Adam S , Wiggins S , Theilmann JL , Copley TT , Bloch M , et al. Proceed with care: Direct predictive testing for Huntington disease. Am J Hum Genet. (1994) ;55: (4):606–17. |
[9] | McNeil SM , Novelletto A , Srinidhi J , Barnes G , Kornbluth I , Altherr MR , et al. Reduced penetrance of the Huntington’s disease mutation. Hum Mol Genet. (1997) ;6: (5):775–9. |
[10] | Rubinsztein DC , Leggo J , Coles R , Almqvist E , Biancalana V , Cassiman JJ , et al. Phenotypic characterization of individuals with 30-40 CAG repeats in the Huntington disease (HD) gene reveals HD cases with 36 repeats and apparently normal elderly individuals with 36-39 repeats. Am J Hum Genet. (1996) ;59: (1):16–22. |
[11] | Semaka A , Creighton S , Warby S , Hayden MR . Predictive testing for Huntington disease: Interpretation and significance of intermediate alleles. Clin Genet. (2006) ;70: (4):283–94. |
[12] | Andrew SE , Goldberg YP , Kremer B , Telenius H , Theilmann J , Adam S , et al. The relationship between trinucleotide (CAG) repeat length and clinical features of Huntington’s disease. Nat Genet. (1993) ;4: (4):398–403. |
[13] | Duyao M , Ambrose C , Myers R , Novelletto A , Persichetti F , Frontali M , et al. Trinucleotide repeat length instability and age of onset in Huntington’s disease. Nat Genet. (1993) ;4: (4):387–92. |
[14] | Snell RG , MacMillan JC , Cheadle JP , Fenton I , Lazarou LP , Davies P , et al. Relationship between trinucleotide repeat expansion and phenotypic variation in Huntington’s disease. Nat Genet. (1993) ;4: (4):393–7. |
[15] | Langbehn DR , Brinkman RR , Falush D , Paulsen JS , Hayden MR , International Huntington’s Disease Collaborative G. A new model for prediction of the age of onset and penetrance for Huntington’s disease based on CAG length. Clin Genet. (2004) ;65: (4):267–77. |
[16] | Langbehn DR , Hayden MR , Paulsen JS , and the Predict-HD Investigators of the Huntington Study Group. CAG-repeat length and the age of onset in Huntington disease (HD): A review and validation study of statistical approaches. Am J Med Genet B Neuropsychiatr Genet. (2010) ;153B: (2):397–408. |
[17] | Long JD , Mills JA . Joint modeling of multivariate longitudinal data and survival data in several observational studies of Huntington’s disease. BMC Med Res Methodol. (2018) ;18: (1):138. |
[18] | Long JD , Langbehn DR , Tabrizi SJ , Landwehrmeyer BG , Paulsen JS , Warner J , et al. Validation of a prognostic index for Huntington’s disease. Mov Disord. (2017) ;32: (2):256–63. |
[19] | Wheeler VC , Persichetti F , McNeil SM , Mysore JS , Mysore SS , MacDonald ME , et al. Factors associated with HD CAG repeat instability in Huntington disease. J Med Genet. (2007) ;44: (11):695–701. |
[20] | Lee JM , Ramos EM , Lee JH , Gillis T , Mysore JS , Hayden MR , et al. CAG repeat expansion in Huntington disease determines age at onset in a fully dominant fashion. Neurology. (2012) ;78: (10):690–5. |
[21] | Djousse L , Knowlton B , Hayden M , Almqvist EW , Brinkman R , Ross C , et al. Interaction of normal and expanded CAG repeat sizes influences age at onset of Huntington disease. Am J Med Genet A. (2003) ;119A: (3):279–82. |
[22] | Wexler NS , Lorimer J , Porter J , Gomez F , Moskowitz C , Shackell E , et al. Venezuelan kindreds reveal that genetic and environmental factors modulate Huntington’s disease age of onset. Proc Natl Acad Sci U S A. (2004) ;101: (10):3498–503. |
[23] | Gusella JF , MacDonald ME , Lee JM . Genetic modifiers of Huntington’s disease. Mov Disord. (2014) ;29: (11):1359–65. |
[24] | Li JL , Hayden MR , Almqvist EW , Brinkman RR , Durr A , Dode C , et al. A genome scan for modifiers of age at onset in Huntington disease: The HD MAPS study. Am J Hum Genet. (2003) ;73: (3):682–7. |
[25] | Paulsen JS , Hayden M , Stout JC , Langbehn DR , Aylward E , Ross CA , et al. Preparing for preventive clinical trials: The Predict-HD study. Arch Neurol. (2006) ;63: (6):883–90. |
[26] | Huntington Study Group CI, Dorsey E . Characterization of a large group of individuals with Huntington disease and their relatives enrolled in the COHORT study. PLoS One. (2012) ;7: (2):e29522. |
[27] | Orth M , Handley OJ , Schwenke C , Dunnett SB , Craufurd D , Ho AK , et al. Observing Huntington’s disease: The European Huntington’s Disease Network’s REGISTRY. PLoS Curr. (2010) ;2: :RRN1184. |
[28] | Landwehrmeyer GB , Fitzer-Attas CJ , Giuliano JD , Goncalves N , Anderson KE , Cardoso F , et al. Data analytics from Enroll-HD, a global clinical research platform for Huntington’s disease. Mov Disord Clin Pract. (2017) ;4: (2):212–24. |
[29] | Genetic Modifiers of Huntington’s Disease (GeM-HD) Consortium. Identification of genetic factors that modify clinical onset of Huntington’s disease. Cell. (2015) ;162: (3):516–26. |
[30] | Lee JM , Gillis T , Mysore JS , Ramos EM , Myers RH , Hayden MR , et al. Common SNP-based haplotype analysis of the 4p16.3 Huntington disease gene region. Am J Hum Genet. (2012) ;90: (3):434–44. |
[31] | Warby SC , Montpetit A , Hayden AR , Carroll JB , Butland SL , Visscher H , et al. CAG expansion in the Huntington disease gene is associated with a specific and targetable predisposing haplogroup. Am J Hum Genet. (2009) ;84: (3):351–66. |
[32] | Chao MJ , Gillis T , Atwal RS , Mysore JS , Arjomand J , Harold D , et al. Haplotype-based stratification of Huntington’s disease. Eur J Hum Genet. (2017) ;25: (11):1202–9. |
[33] | Lee JM , Chao MJ , Harold D , Abu Elneel K , Gillis T , Holmans P , et al. A modifier of Huntington’s disease onset at the MLH1 locus. Hum Mol Genet. (2017) ;26: (19):3859–67. |
[34] | Gellera C , Meoni C , Castellotti B , Zappacosta B , Girotti F , Taroni F , et al. Errors in Huntington disease diagnostic test caused by trinucleotide deletion in the IT15 gene. Am J Hum Genet. (1996) ;59: (2):475–7. |
[35] | Goldberg YP , McMurray CT , Zeisler J , Almqvist E , Sillence D , Richards F , et al. Increased instability of intermediate alleles in families with sporadic Huntington disease compared to similar sized intermediate alleles in the general population. Hum Mol Genet. (1995) ;4: (10):1911–8. |
[36] | Pecheux C , Mouret JF , Durr A , Agid Y , Feingold J , Brice A , et al. Sequence analysis of the CCG polymorphic region adjacent to the CAG triplet repeat of the HD gene in normal and HD chromosomes. J Med Genet. (1995) ;32: (5):399–400. |
[37] | Genetic Modifiers of Huntington’s Disease (GeM-HD) Consortium. CAG repeat not polyglutamine length determines timing of Huntington’s disease onset. Cell. (2019) ;178: :887–900.e14. |
[38] | Ciosi M , Maxwell A , Cumming SA , Hensman Moss DJ , Alshammari AM , Flower MD , et al. A genetic association study of glutamine-encoding DNA sequence structures, somatic CAG expansion, and DNA repair gene variants, with Huntington disease clinical outcomes. EBioMedicine. (2019) ;48: :568–80. |
[39] | ACMG/ASHG statement. Laboratory guidelines for Huntington disease genetic testing. The American College of Medical Genetics/American Society of Human Genetics Huntington Disease Genetic Testing Working Group. Am J Hum Genet. (1998) ;62: (5):1243–7. |
[40] | Wright GEB , Collins JA , Kay C , McDonald C , Dolzhenko E , Xia Q , et al. Length of uninterrupted CAG, independent of polyglutamine size, results in increased somatic instability, hastening onset of Huntington disease. Am J Hum Genet. (2019) ;104: (6):1116–26. |
[41] | Kim KH , Hong EP , Shin JW , Chao MJ , Loupe J , Gillis T , et al. Genetic and functional analyses point to FAN1 as the source of multiple HD modifier effects. Am J Hum Genet. (2020) ;107: (1):96–110. |
[42] | Moss DJH , Pardinas AF , Langbehn D , Lo K , Leavitt BR , Roos R , et al. Identification of genetic variants associated with Huntington’s disease progression: A genome-wide association study. Lancet Neurol. (2017) ;16: (9):701–11. |
[43] | Flower M , Lomeikaite V , Ciosi M , Cumming S , Morales F , Lo K , et al. MSH3 modifies somatic instability and disease severity in Huntington’s and myotonic dystrophy type 1. Brain. (2019) ;142: (7):1876–86. |
[44] | Goold R , Flower M , Moss DH , Medway C , Wood-Kaczmar A , Andre R , et al. FAN1 modifies Huntington’s disease progression by stabilizing the expanded HTT CAG repeat. Hum Mol Genet. (2019) ;28: (4):650–61. |
[45] | Telenius H , Kremer B , Goldberg YP , Theilmann J , Andrew SE , Zeisler J , et al. Somatic and gonadal mosaicism of the Huntington disease gene CAG repeat in brain and sperm. Nat Genet. (1994) ;6: (4):409–14. |
[46] | Kennedy L , Evans E , Chen CM , Craven L , Detloff PJ , Ennis M , et al. Dramatic tissue-specific mutation length increases are an early molecular event in Huntington disease pathogenesis. Hum Mol Genet. (2003) ;12: (24):3359–67. |
[47] | Gonitel R , Moffitt H , Sathasivam K , Woodman B , Detloff PJ , Faull RL , et al. DNA instability in postmitotic neurons. Proc Natl Acad Sci U S A. (2008) ;105: (9):3467–72. |
[48] | Swami M , Hendricks AE , Gillis T , Massood T , Mysore J , Myers RH , et al. Somatic expansion of the Huntington’s disease CAG repeat in the brain is associated with an earlier age of disease onset. Hum Mol Genet. (2009) ;18: (16):3039–47. |
[49] | Dragileva E , Hendricks A , Teed A , Gillis T , Lopez ET , Friedberg EC , et al. Intergenerational and striatal CAG repeat instability in Huntington’s disease knock-in mice involve different DNA repair genes. Neurobiol Dis. (2009) ;33: (1):37–47. |
[50] | Tome S , Manley K , Simard JP , Clark GW , Slean MM , Swami M , et al. MSH3 polymorphisms and protein levels affect CAG repeat instability in Huntington’s disease mice. PLoS Genet. (2013) ;9: (2):e1003280. |
[51] | Pinto RM , Dragileva E , Kirby A , Lloret A , Lopez E , St Claire J , et al. Mismatch repair genes Mlh1 and Mlh3 modify CAG instability in Huntington’s disease mice: Genome-wide and candidate approaches. PLoS Genet. (2013) ;9: (10):e1003930. |
[52] | Gomes-Pereira M , Fortune MT , Ingram L , McAbney JP , Monckton DG . Pms2 is a genetic enhancer of trinucleotide CAG. CTG repeat somatic mosaicism: Implications for the mechanism of triplet repeat expansion. Hum Mol Genet. (2004) ;13: (16):1815–25. |
[53] | Kaplan S , Itzkovitz S , Shapiro E . A universal mechanism ties genotype to phenotype in trinucleotide diseases. PLoS Comput Biol. (2007) ;3: (11):e235. |
[54] | Rodan LH , Cohen J , Fatemi A , Gillis T , Lucente D , Gusella J , et al. A novel neurodevelopmental disorder associated with compound heterozygous variants in the huntingtin gene. Eur J Hum Genet. (2016) ;24: (12):1826–7. |
[55] | Lopes F , Barbosa M , Ameur A , Soares G , de Sa J , Dias AI , et al. Identification of novel genetic causes of Rett syndrome-like phenotypes. J Med Genet. (2016) ;53: (3):190–9. |
[56] | Ambrose CM , Duyao MP , Barnes G , Bates GP , Lin CS , Srinidhi J , et al. Structure and expression of the Huntington’s disease gene: Evidence against simple inactivation due to an expanded CAG repeat. Somat Cell Mol Genet. (1994) ;20: (1):27–38. |
[57] | Karczewski KJ , Francioli LC , Tiao G , Cummings BB , Alfoldi J , Wang Q , et al. The mutational constraint spectrum quantified from variation in 141,456 humans. Nature. (2020) ;581: (7809):434–43. |
[58] | Bates GP , Dorsey R , Gusella JF , Hayden MR , Kay C , Leavitt BR , et al. Huntington disease. Nat Rev Dis Primers. (2015) ;1: :15005. |
[59] | Marti E . RNA toxicity induced by expanded CAG repeats in Huntington’s disease. Brain Pathol. (2016) ;26: (6):779–86. |
[60] | Sathasivam K , Neueder A , Gipson TA , Landles C , Benjamin AC , Bondulich MK , et al. Aberrant splicing of HTT generates the pathogenic exon 1 protein in Huntington disease. Proc Natl Acad Sci U S A. (2013) ;110: (6):2366–70. |
[61] | Gao FB , Richter JD , Cleveland DW . Rethinking unconventional translation in neurodegeneration. Cell. (2017) ;171: (5):994–1000. |
[62] | Bruneau BG , Nora EP . Chromatin domains go on repeat in disease. Cell. (2018) ;175: (1):38–40. |
[63] | Schilling J , Broemer M , Atanassov I , Duernberger Y , Vorberg I , Dieterich C , et al. Deregulated splicing is a major mechanism of RNA-induced toxicity in Huntington’s disease. J Mol Biol. (2019) ;431: (9):1869–77. |
[64] | Banez-Coronel M , Ayhan F , Tarabochia AD , Zu T , Perez BA , Tusi SK , et al. RAN translation in Huntington disease. Neuron. (2015) ;88: (4):667–77. |
[65] | Bettencourt C , Hensman-Moss D , Flower M , Wiethoff S , Brice A , Goizet C , et al. DNA repair pathways underlie a common genetic mechanism modulating onset in polyglutamine diseases. Ann Neurol. (2016) ;79: (6):983–90. |
[66] | Menon RP , Nethisinghe S , Faggiano S , Vannocci T , Rezaei H , Pemble S , et al. The role of interruptions in polyQ in the pathology of SCA1. PLoS Genet. (2013) ;9: (7):e1003648. |
[67] | Gusella JF , MacDonald ME . Molecular genetics: Unmasking polyglutamine triggers in neurodegenerative disease. Nat Rev Neurosci. (2000) ;1: (2):109–15. |
[68] | Lee JM , Zhang J , Su AI , Walker JR , Wiltshire T , Kang K , et al. A novel approach to investigate tissue-specific trinucleotide repeat instability. BMC Syst Biol. (2010) ;4: :29. |
[69] | Mouro Pinto R , Arning L , Giordano JV , Razghandi P , Andrew MA , Gillis T , et al. Patterns of CAG repeat instability in the central nervous system and periphery in Huntington’s disease and in spinocerebellar ataxia type 1. Hum Mol Genet. (2020) . doi: 10.1093/hmg/ddaa139. |
[70] | Cohen RL , Margolis RL . Spinocerebellar ataxia type Clues to pathogenesis. Curr Opin Neurol. (2016) ;29: (6):735–42. |
[71] | Segre AV , Consortium D , investigators M , Groop L , Mootha VK , Daly MJ , et al. Common inherited variation in mitochondrial genes is not enriched for associations with type 2 diabetes or related glycemic traits. PLoS Genet. (2010) ;6: (8):e1001058. |


