
Developmental Trajectory of Height, Weight, and BMI in Children and Adolescents at Risk for Huntington’s Disease: Effect of mHTT on Growth
Abstract
Background:
The gene (Huntingtin or HTT) causing Huntington’s disease (HD) is vital for development and is expressed throughout the brain and body lifelong. The mutant form (mHTT) may influence growth and development.
Objective:
To determine the impact of mHTT on human measures of growth, including height, weight, and body mass index (BMI), between child and adolescent carriers of mHTT and control peers.
Methods:
Children ages 6–18 years of age (n = 186) at risk for HD were enrolled in the KidsHD study. For research purposes only, genetic testing was performed to classify participants as Gene-Expanded (GE = 78) or as Gene Non-Expanded (GNE = 108). Outcome measures included height, weight, and body mass index (BMI). Mixed models were used to determine if non-linear age trends differed between groups for BMI, height, and weight.
Results:
Differences were seen in the trajectory of BMI in which the GE group reached a plateau in late adolescence with no further increase, compared with a nearly linear increase in the GNE group. There was a significant sex interaction pattern where GE males were taller than GNE males in adolescence, in the presence of similar weight. In contrast, GE females weighed significantly less than their GNE counterparts in adolescence, in the presence of similar height.
Conclusion:
Measures of growth are abnormal in child and adolescent carriers of mHTT, decades before HD onset. Although further studies are needed for replication, the current findings suggest that developmental aberrations may be systemic and a vital part of disease pathology.
INTRODUCTION
Huntington’s disease (HD) is caused by a repeat expansion in the gene Huntingtin (HTT) and is classically considered a neurodegenerative disease of the striatum. However, various lines of evidence support the notion that abnormal development is an important aspect of disease pathology. The KidsHD study is a unique program evaluating children ages 6–18 years of age who are at risk for developing HD, meaning they have a parent or grandparent with HD. When expanded, HTT is referred to as mutant HTT or mHTT and is ubiquitously expressed in the body and brain. Recently, we published findings regarding how mHTT affected brain development in children from this study [1]. However, given that mHTT is expressed ubiquitously, there may be more global effects beyond brain development. In a previous paper of a small pilot sample from the KidsHD study, we showed that children who were Gene Expanded (GE) exhibited lower weight and BMI compared with children who were Gene-Non-Expanded (GNE) [2]. Low BMI has been reported in adults in the pre-manifest phase of the illness and results from our pilot study in children at risk for HD suggest that these differences originate in childhood [3, 4]. To test this hypothesis, developmental trajectories of anthropometric growth need to be evaluated.
The current report expands on the previous pilot study showing lower BMI in GE children with a larger sample of children and adolescents who are at high risk for HD, enabling evaluation of differential anthropometric trajectories as a function of carrier status and sex.
METHODS
Participants and measurements
Details of our program can be found in the recent publication regarding brain development in the Kids-HD sample [1]. The sample used for the current analysis was composed of children and adolescents between the ages of 6 and 18 years old, who are at risk for HD. Participants were recruited through their parents/guardians and were potentially eligible if their biological parents or grandparents had confirmed HD, either through genetic testing or a clinical diagnosis. Families were recruited from across the United States. Individuals were excluded if they had a history of a major neurologic illness, brain surgery, or significant head trauma that required hospitalization. Parents were asked about manifest motor symptoms in their children at the time of screening, and individuals who reported manifest symptoms were excluded.
Participants provided blood or saliva for DNA analysis. Genetic testing was performed for research purposes only and families, research and clinical staff remained blind to the carrier status of the participant. The sample was divided into those who were Gene Expanded (GE, CAG repeat >36) and Gene Non-Expanded (GNE, CAG repeat <36). All participants and their guardians signed informed consent prior to enrolling in the protocol, which was approved by the University of Iowa Institutional Review Board (IRB).
We refined the sample post-participation to ensure none of the participants exhibited early signs of HD. We estimated years from diagnosis for GE participants by calculating the CAP score (CAG-age product). CAP is computed by multiplying age at study entry (Age0) by a scaling of the CAG repeat length (CAP = Age0 * (CAG - 33.66)/432.3326). A low CAP score of <0.67 represents individuals who are far from onset (roughly 12 years) while participants in the medium group of >0.67 and <0.85 are estimated to be approximately 7.5 years from onset. Individuals with a CAP score >0.85 are estimated to be less than 5 years to onset [5]. The goal of the current study was to capture measures of general growth and development, rather than potential manifestations of the disease. Therefore, to insure that our participants were as far from onset as possible, we excluded 6 participants with a CAP score of >0.68 who were between 12 and 17 years old at time of assessment.
Sample
Table 1 summarizes key demographics, including age, CAG repeats, and parental SES. Also see Supplementary Tables 1 and 2 for additional details of TMS and CAG repeats broken down by age categories. We employed an accelerated longitudinal design (ALD) to estimate growth trajectories which utilizes both cross-sectional and longitudinal observations with variable length of follow-up. In an ALD design, a sub-set of the sample returns for follow-up visits.
Table 1
Demographics of Sample
| GNE | GE | |
| (n = 108) | (n = 78) | |
| Sex | ||
| Males | 51 (47%) | 30 (48%) |
| Females | 57 (53%) | 48 (62%) |
| Return visits | ||
| Baseline Visit | 108 (59%) | 78 (59%) |
| Returned once | 49 (27%) | 41 (31%) |
| Returned twice | 21 (11%) | 11 (8%) |
| Returned 3 times | 5 (3%) | 1 (1%) |
| Returned 4 times | 0 | 1 (1%) |
| Total Observations | 183 | 132 |
| Age (years) | ||
| Mean (SD) | 13.06 (3.59) | 13.20 (3.63) |
| Min max | 6.00–18.9 | 6.00–18.9 |
| CAG repeat | ||
| median | 19 | 43 |
| range | 15–34 | 36–58 |
| Ethnicity | 90% Caucasian | 82% Caucasian |
| 5% Hispanic / Latino | 5% Hispanic / Latino | |
| 5% Multiracial | 10% Multiracial | |
| 0% African American | 3% African American | |
| Parental Socioeconomic status* | ||
| 1 | 0 (0%) | 1 (1%) |
| 2 | 89 (49%) | 61 (46%) |
| 3 | 79 (43%) | 58 (44%) |
| 4 | 13 (7%) | 11 (8%) |
| 5 | 2 (1%) | 1 (1%) |
*As measured by a modified Hollingshead Scale where were higher numbers indicate lower socioeconomic status.
The sample included 108 GNE participants (51 males [47%]) and 78 GNE participants (30 males; [38%]). Of these 186 participants, 90 of them returned for one return visit and therefore had 2 observations (41 GE, 49 GNE), 32 returned twice and therefore had 3 observations (11 GE, 21 GNE), 6 returned three times and had 4 observations (1 GE, 5 GNE) and one GE returned 4 times resulting in 5 observations. Note that the previous sample of 14 GE and 20 GNE were included in the current sample [2]. The mean interval between return visits was 24.9 months (SD = 9.94).
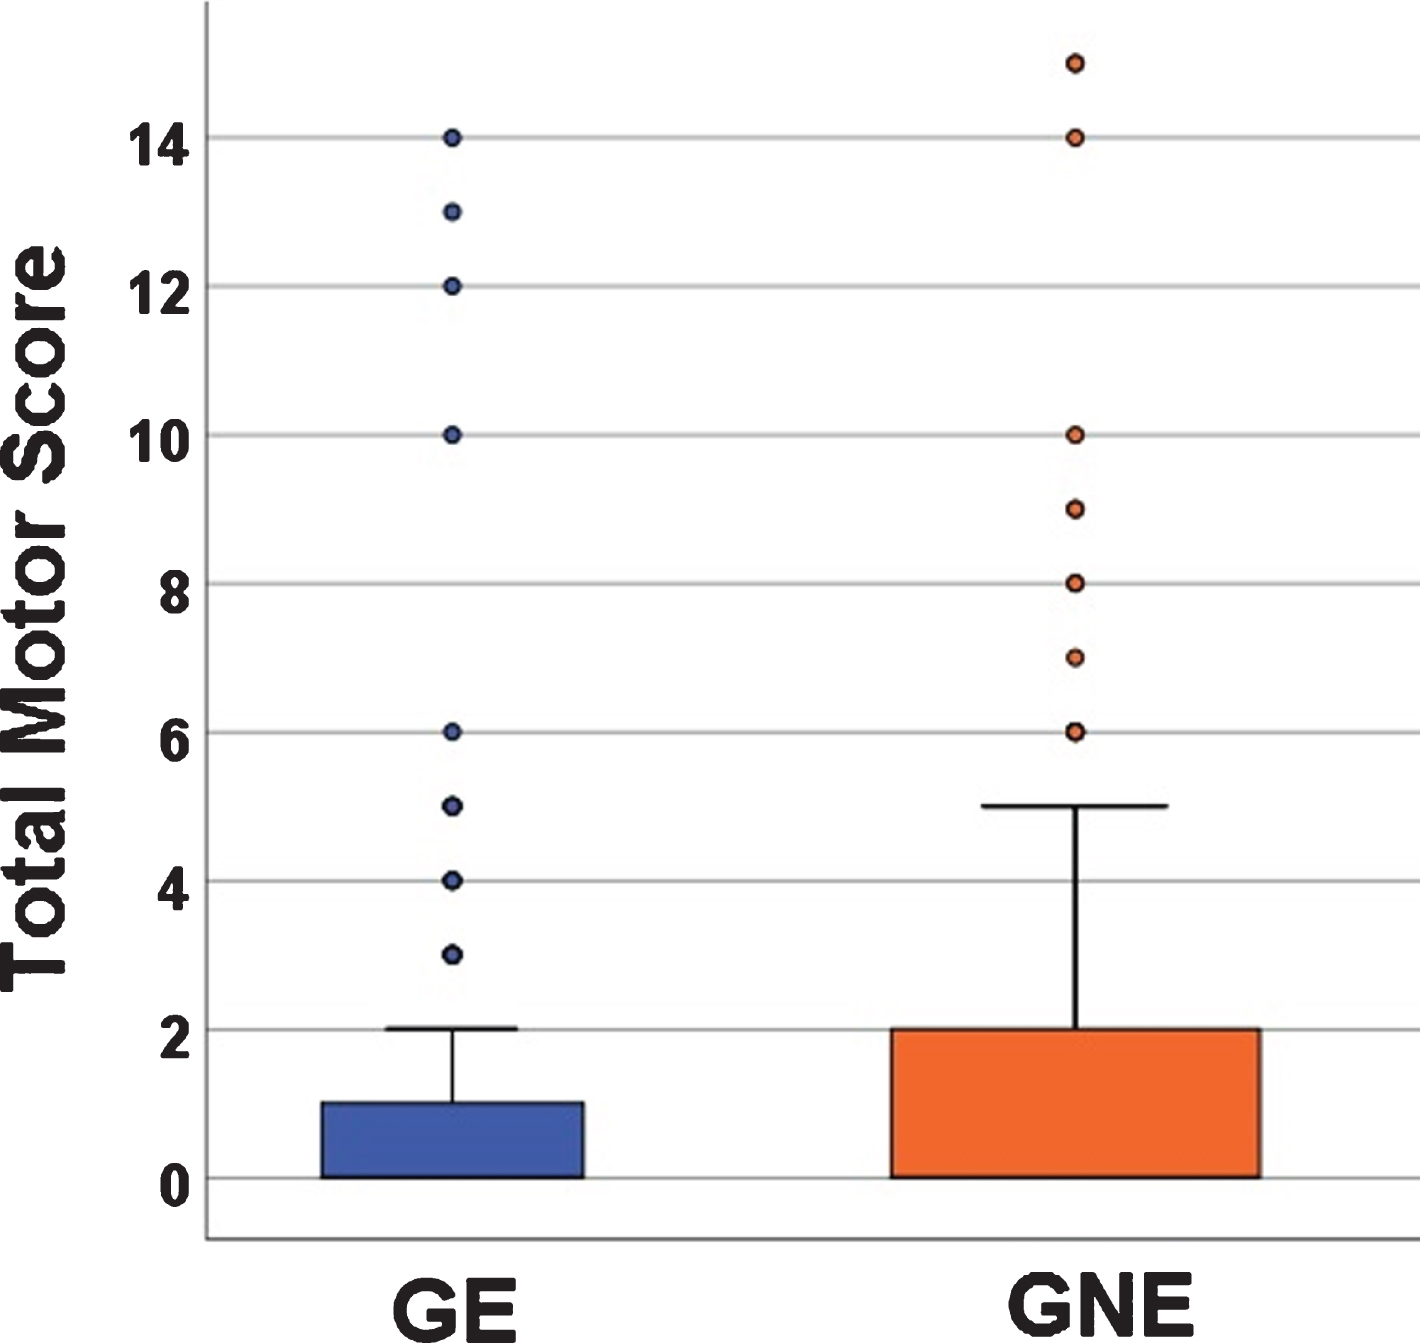
Total Motor Score (TMS) from the Unified Huntington’s Disease Rating Scale (UHDRS) was performed by trained personnel [6]. In this age range, the UHDRS is sensitive to normal motor development. This means that younger children are less developed in motor skills (have less coordination) and they score higher TMS scores than children that are older (Spearman’s correlation –0.25, p < 0.0001; also see Supplementary Table 2). Therefore, in a pediatric sample such as this, higher TMS scores do not reflect pathology, but instead normal motor development. Figure 1 shows the mean TMS from both groups with GE mean of 1.13 (SD 2.47, range 0–14) and a GNE mean of 1.31 (SD 2.72, range 0–15). In general, the scores that, for an adult population, might represent motor pathology (10 and above), in this pediatric sample represent the motor incoordination of youth.
Fig. 1
Mean Total Motor Scores (TMS) between the GE (blue) and GNE (orange). Mean TMS for GE was 1.13 (SD 2.47) range 0–1); Mean TMS for GNE was 1.31 (SD 2.72), range 0–15.
Outcome measures
Basic anthropometric measures of height (cm) and weight (kg) were obtained by trained research nurses in the University of Iowa’s Institute for Clinical and Translational Sciences. All participants were measured on the same equipment using the same measurement protocols. BMI was calculated as follows:
We also administered the modified Hollingshead Scale to estimate parental socioeconomic status (SES). Based on income brackets, SES is classified in 5 categories, where lower numbers represent higher socioeconomic status [7].
Statistical analysis
We employed an accelerated longitudinal design (ALD) to estimate growth trajectories. In ALD, age-related change was estimated from a combination of cross-sectional and longitudinal observations with variable length of follow-up.
Outcome measures included BMI, height (cm), and weight (kg). Mixed linear regression models were used to estimate growth in an ALD setting. Non-independence of longitudinal measures and similarity between siblings were accounted for by fitting mixed-effects regression models, which included random effects per participant and per family. Non-linear age-related change in BMI was well-described by a model that was quadratic in age effect. Models of age-related change in height or weight were more complex and were fit using restricted cubic splines. The degree of nonlinearity was chosen using a limited forward selection procedure, beginning with a linear relationship, and successively adding up to 5 spline knots if they significantly improved the fit of the model (p≤0.05). Models also included sex and group (GNE vs GE) as predictor variables. Age by sex, age by group, and sex by group interaction effects were tested as follows: first, we evaluated the linear interactions with age; second, we tested collectively for the interactions with the non-linear spline component of age. Only significant interactions were retained in the models. A 2-tailed alpha level of 0.05 was used for significance tests. Analyses were performed in R version 3.5.3.
RESULTS
BMI
The interaction between group and the quadratic term for age significantly predicted BMI (Fig. 2A; See Table 2 for model estimates). As shown in Fig. 2, BMI continued to increase in a nearly linear fashion in the GNE group. In contrast, BMI appears to plateau starting around age 14 in the GE group. There were no significant Sex * Age, or Group * Sex interactions.
Fig. 2
Trajectories of anthropometric growth as a function of gene status and sex. Panel A shows predicted curves for BMI trajectories for GNE (orange) and GE (blue). Note that the mean male and female trajectories are shown, as there was no significant interaction between groups and sex. Panel B illustrates predicted height trajectories across groups and sex, where females are represented by solid lines and males are represented by dashed lines. GE males were significantly taller than their GNE counterparts, while females exhibited similar height across groups. Panel C shows growth curves for weight. GE females weighed less than their GNE counterparts. Weight in males was similar across groups.
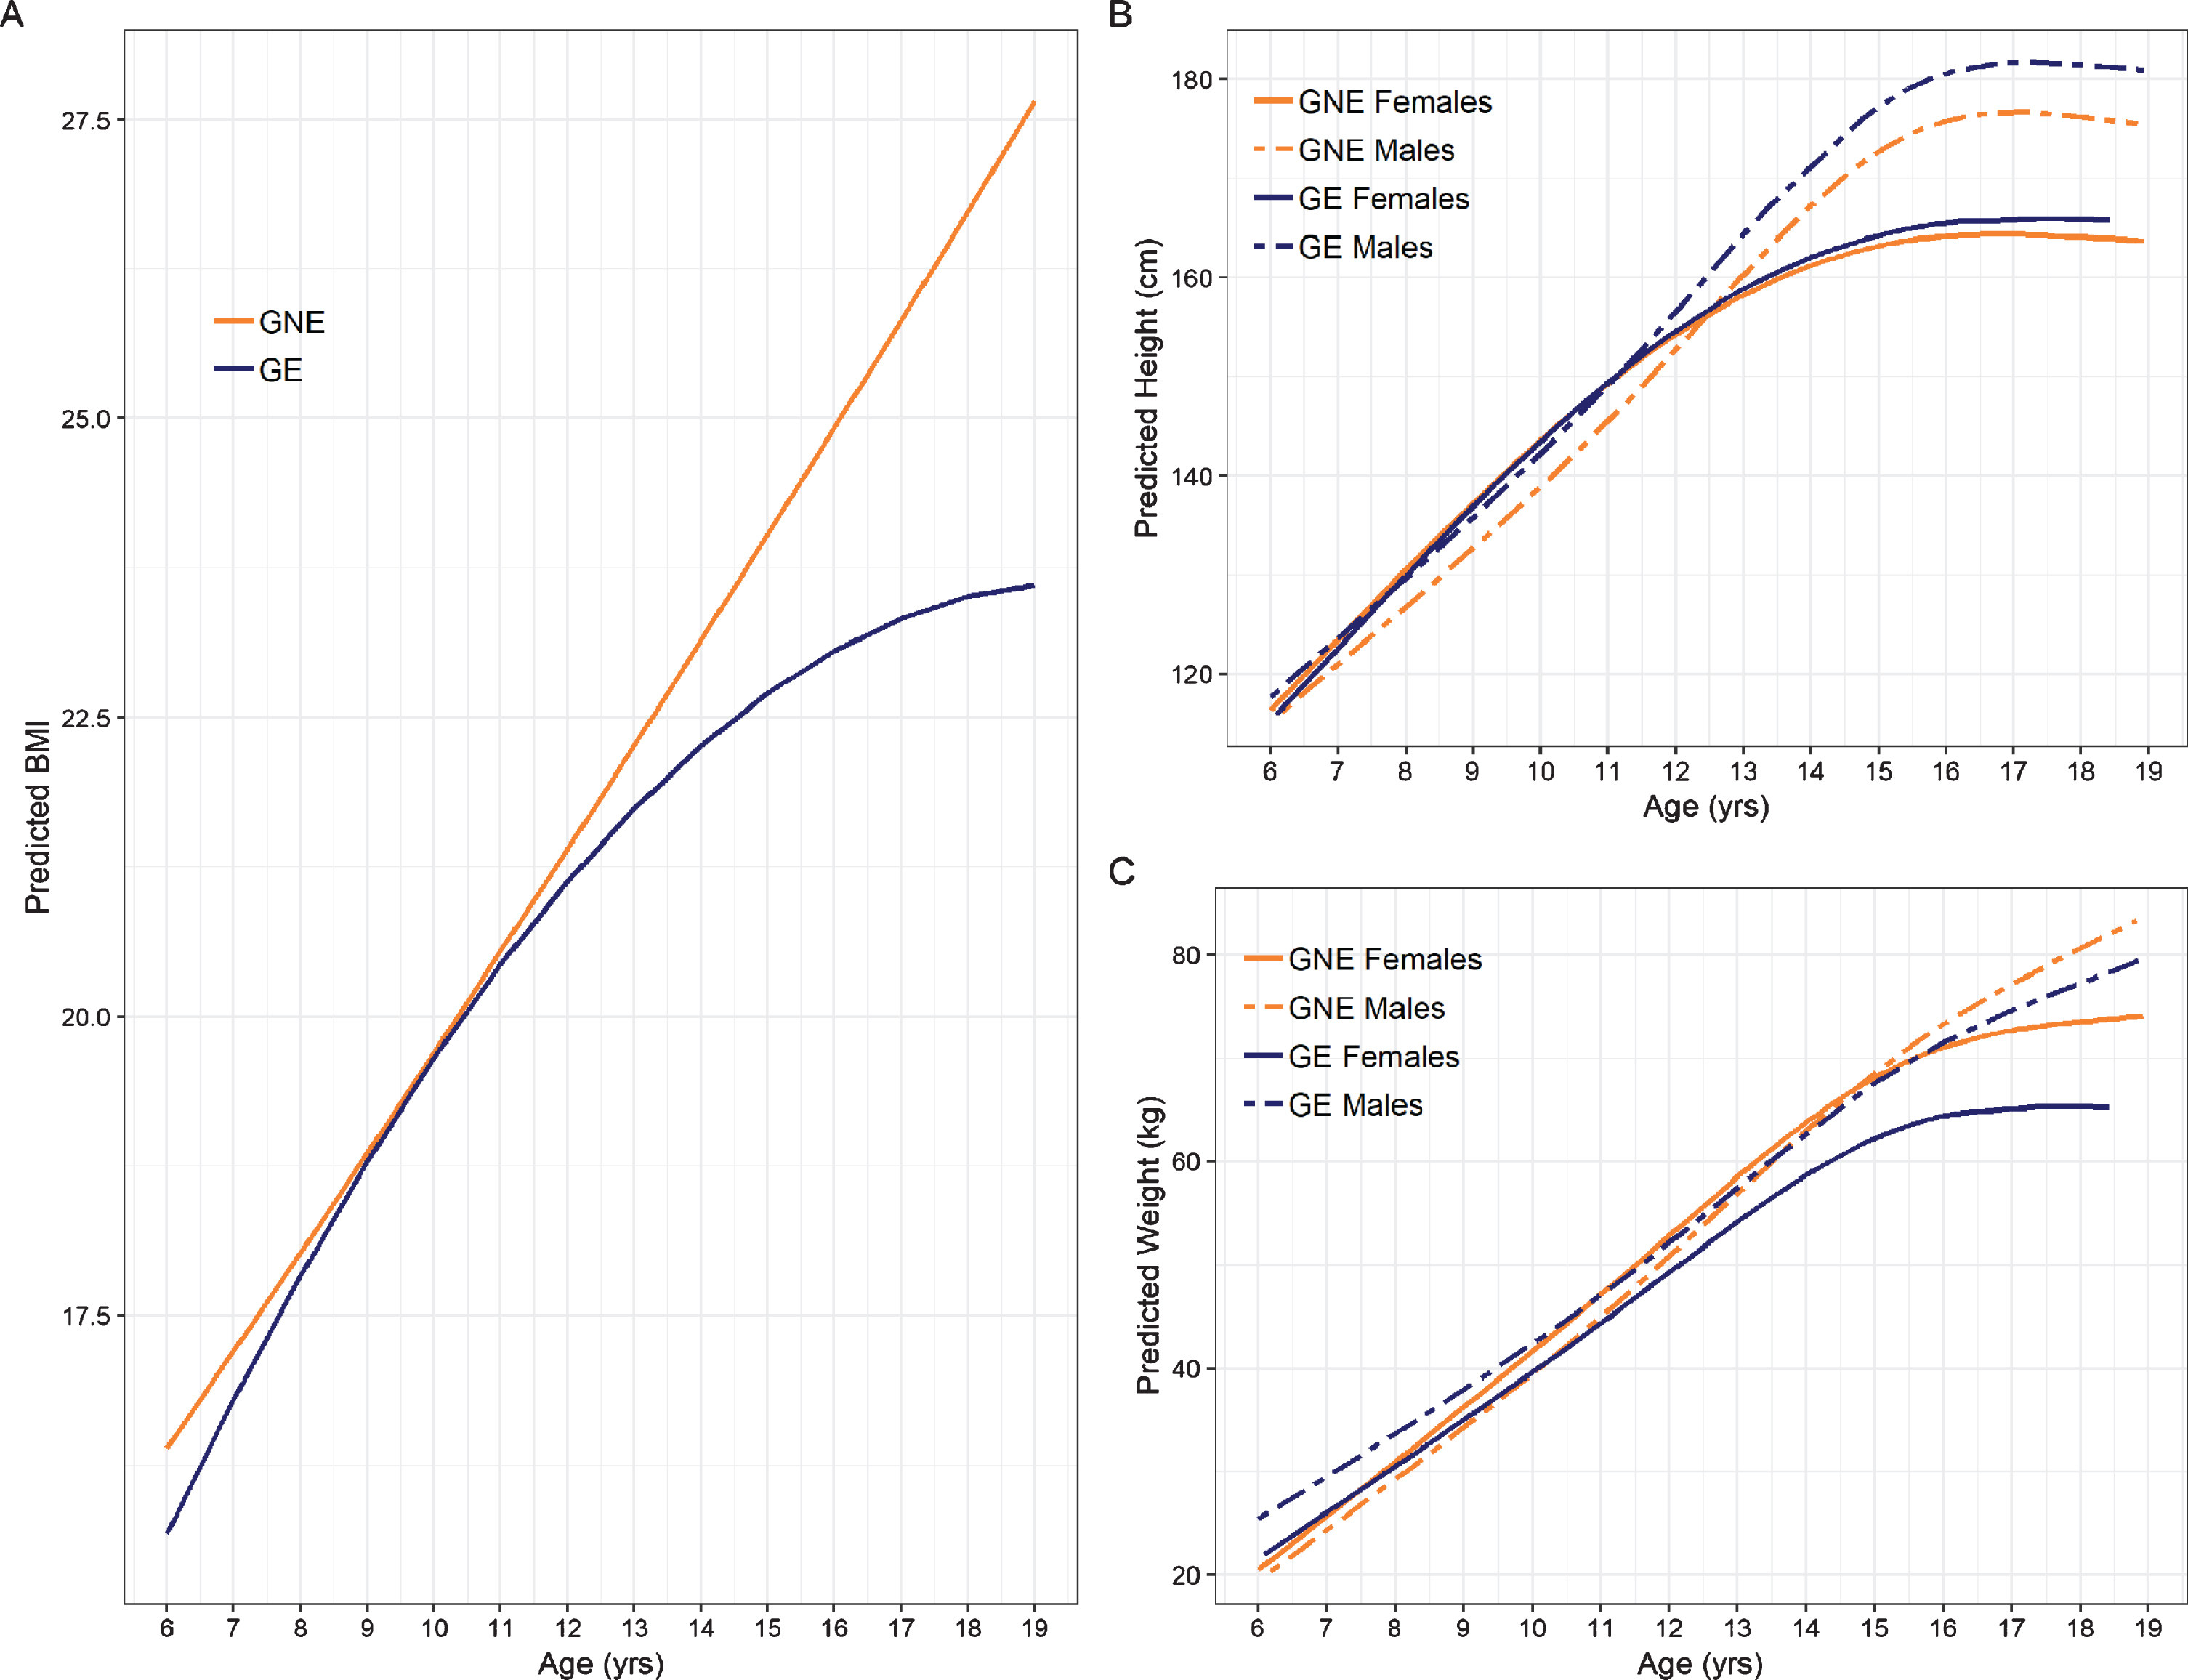
Table 2
Model estimates for BMI
| BMI | |||
| Predictors | Estimates | CI | p |
| Intercept | 9.332 | 1.881–16.782 | 0.015 |
| Group | 3.846 | –3.724–11.417 | 0.321 |
| Sex | –4.333 | –12.018–3.351 | 0.270 |
| Age | 1.418 | 0.258–2.578 | 0.018 |
| Age2 | –0.036 | –0.080–0.008 | 0.110 |
| Sex * Group | 1.380 | –1.214–3.974 | 0.299 |
| Age * Group | –0.920 | –2.104–0.265 | 0.130 |
| Age * Sex | 0.515 | –0.672–1.701 | 0.396 |
| Age2 * Group | 0.047 | 0.002–0.093 | 0.044 |
| Age2 * Sex | –0.013 | –0.059–0.032 | 0.561 |
| Observations | 315 | ||
Height
Regression estimates for the height models are summarized in Table 3. Significant interaction effects were observed for Sex * Group, Age * Group, Sex * Group and the non-linear Age * Sex term. As shown in Fig. 2B, GE males were significantly taller than GNE males in adolescence. Post-hoc comparison of height differences across age and group are shown in Supplementary Table 1. In contrast, the female groups did not show a significant difference in height across age (Supplementary Table 3).
Table 3
Model estimates for height
| Height (cm) | |||
| Predictors | Estimates | CI | p |
| Intercept | 81.778 | 73.694–89.862 | <0.001 |
| Group | –1.023 | –6.121–4.075 | 0.694 |
| Sex | –10.344 | –20.233 ––0.455 | 0.041 |
| Age | 5.979 | 5.141–6.816 | <0.001 |
| Age_2 | 2.899 | 1.193–4.606 | 0.001 |
| Age_3 | –23.849 | –30.678 ––17.020 | <0.001 |
| Sex * Group | 3.475 | 0.046 –6.903 | 0.049 |
| Age * Group | –0.234 | –0.572–0.104 | 0.175 |
| Age * Sex | 1.332 | 0.280–2.385 | 0.014 |
| Age_2 * Sex | –7.220 | –9.438 ––5.002 | <0.001 |
| Age_3* Sex | 27.837 | 18.940–36.734 | <0.001 |
| Observations | 315 | ||
Age_2 and age_3 refer to the second and third degree of freedom spline terms for age. Spline knots were set at percentiles 5, 27.5, 50.0, 72.5, and 95 of age (6.81, 11.74, 15.43, 18.33). The chi-square test (3 df) for the overall effect of group and its interactions with sex age was 10.422 (p = 0.015).
Weight
Table 4 summarizes the regression estimates for the weight model. Figure 2C shows the weight trajectories across age for males and females in the GNE and GE group. GE females started to divert from the other groups around age 12, exhibiting significantly reduced weight. Post-hoc comparisons of weight across age and group are shown for males in Supplementary Table 3 and for females in Supplementary Table 4.
Table 4
Model estimates for weight
| Weight (kg) | |||
| Predictors | Estimates | CI | p |
| Intercept | 0.711 | –15.233–16.655 | 0.930 |
| Group | –10.642 | –21.211 ––0.073 | 0.049 |
| Sex | –5.808 | –24.978–13.362 | 0.553 |
| Age | 4.126 | 2.518–5.734 | <0.001 |
| Age_2 | 1.868 | –1.333–5.068 | 0.254 |
| Age_3 | –10.577 | –23.313–2.159 | 0.105 |
| Sex * Group | 4.871 | –2.894–12.636 | 0.221 |
| Age * Group | 0.777 | 0.101–1.453 | 0.025 |
| Age * Sex | 0.330 | –1.661–2.321 | 0.746 |
| Age_2 * Sex | –0.976 | –5.106–3.155 | 0.644 |
| Age_3 * Sex | –1.497 | –18.008–15.013 | 0.859 |
| Observations | 315 | ||
Age_2 and age_3 refer to the second and third degree of freedom spline terms for age. Spline knots were set at percentiles 5, 27.5, 50.0, 72.5, and 95 of age (6.81, 11.74, 15.43, 18.33). The chi-square test (3 df) for the overall effect of group and its interactions with sex age was 7.640 (p = 0.054).
DISCUSSION
Child and adolescent carriers of mHTT exhibited abnormal trajectories of anthropometric growth compared with peers who have not inherited the mutation. These findings support the growing body of literature to suggest that at least a portion of the disease pathophysiology has a foundation in abnormal development. As mHTT is widely expressed throughout the body, pathological changes have been shown to extend beyond the brain [8]. These systemic changes may impair overall growth and development. These children were decades from onset of disease, making degeneration an unlikely factor in their growth abnormalities. More likely, the effects of mHTT are present and manifest both life-long and systemically.
The current findings support our previous cross-sectional findings of lower BMI in GE children, however given the growth trajectories, a group difference is likely to be present only in children after puberty since the trajectories are similar prior to the age of 15 or so. The findings also extend the results shown in preHD adults where lower BMI is detected prior to motor onset.
The sex by group interactions were unexpected. Although both males and females in the GE had lower BMI after age 15 compared to those in the GNE group, they come to this result in different ways. That is, GE males were taller than GNE males, but not heavier, leading to lower BMI whereas GE females were similar in height, but weighed less than their GNE counterparts. In our pilot sample of 8 males and 12 females, the GE group was significantly shorter than the GNE group [2]. Given the much larger sample size and the ability to evaluate sex-specific findings, we feel confident that the current analysis is a more valid result. We are not aware of any published literature regarding sex differences in HD using measures such as height. In addition, although there are several studies documenting sex differences in mouse models of HD [9–11], these are typically in the context of things such as behavioral manifestations rather than sex differences in growth parameters. Further work needs to be done to investigate this issue.
Defects in energy metabolism that may be related to mitochondrial function, have long been a focal center of studies of the pathogenesis of HD [12–17] and also the target of therapeutic approaches in human and animal models [18–20]. Importantly, BMI has recently been reported as being a robust predictor of clinical progression in HD [21], making the issue of exploration of systemic metabolism as a therapeutic target quite appealing. Mitochondrial dysfunction influenced by mHTT is present in both the brain [22–24] and non-neuronal tissue [25]. Evidence of low ATP production in cell lines from HD patients [26] and energetic deficits seen in HD adult skeletal muscle [27] point to a systemic peripheral energy deficit in HD. In growth and development, tissues with high energy demand include brain and skeletal muscle. Although there was no direct measure of metabolism in the sample, findings from the current study suggest that abnormalities in energy metabolism may manifest early as abnormalities in growth.
A more direct mechanism on muscle development in the current sample may be the influence of mHTT on muscle differentiation. Ciammola et al showed that in primary muscle cell cultures, myoblasts from presymptomatic and symptomatic HD participants showed a variety of defects including mitochondrial depolarization and abnormal cell differentiation [28].
All of the participants come from homes in which a parent has been genetically tested for HD or who has already been diagnosed with manifest HD. Especially for those children whose parents are affected, there may well be significant disruption in the family dealing with such a disabling disease. Given the multifactorial nature of childhood development, one might posit a contribution of environmental factors to growth in the gene-expanded children. However, such environments were experienced in common by all of our participants. Thus, the differences reported here point to a genetic influence.
It is important to highlight that the abnormalities in growth measures are statistically significant, yet clinically subtle. While the findings do not support clinically relevant abnormalities, the results may be essential to understand both the roots, as well as the scope of Huntington disease.
CONFLICT OF INTEREST
The authors have no conflict of interest to report.
ACKNOWLEDGMENTS
This work was supported by 1) a grant from the National Institutes for Neurologic Disorders and Stroke (NINDS), 5R01NS055903, 2) the CHDI Foundation, 3) a grant from the Huntington Disease Society of America, the University of Iowa Huntington Disease Center of Excellence; and 4) The University of Iowa Clinical and Translational Science Award (UL1 TR002537). This work was conducted on an MRI instrument funded by 1S10OD025025-01.
SUPPLEMENTARY MATERIAL
[1] The supplementary material is available in the electronic version of this article: https://dx.doi.org/10.3233/JHD-200407.
REFERENCES
[1] | van der Plas E , Langbehn DR , Conrad AL , Koscik TR , Tereshchenko A , Epping EA , et al. Abnormal brain development in child and adolescent carriers of mutant huntingtin. Neurology. (2019) ;93: (10):e1021–e30. |
[2] | Lee JK , Mathews K , Schlaggar B , Perlmutter J , Paulsen JS , Epping E , et al. Measures of growth in children at risk for Huntington disease. Neurology. (2012) ;79: (7):668–74. |
[3] | Marder K , Zhao H , Eberly S , Tanner CM , Oakes D , Shoulson I . Dietary intake in adults at risk for Huntington disease: analysis of PHAROS research participants. Neurology. (2009) ;73: (5):385–92. |
[4] | Aziz NA , van der Burg JM , Landwehrmeyer GB , Brundin P , Stijnen T , Group ES , et al. Weight loss in Huntington disease increases with higher CAG repeat number. Neurology. (2008) ;71: (19):1506–13. |
[5] | Zhang Y , Long JD , Mills JA , Warner JH , Lu W , Paulsen JS , et al. Indexing disease progression at study entry with individuals at-risk for Huntington disease. Am J Med Genet B Neuropsychiatr Genet. (2011) ;156B: (7):751–63. |
[6] | Unified Huntington’s Disease Rating Scale: reliability and consistency. Huntington Study Group. Mov Disord. (1996) ;11: (2):136–42. |
[7] | Hollingshead AB , Redlich FC . Social Class and Mental Illness. New York: John Wiley & Sons; (1958) . |
[8] | Carroll JB , Bates GP , Steffan J , Saft C , Tabrizi SJ . Treating the whole body in Huntington’s disease. Lancet Neurol. (2015) ;14: (11):1135–42. |
[9] | Dorner JL , Miller BR , Barton SJ , Brock TJ , Rebec GV . Sex differences in behavior and striatal ascorbate release in the 140 CAG knock-in mouse model of Huntington’s disease. Behav Brain Res. (2007) ;178: (1):90–7. |
[10] | Orvoen S , Pla P , Gardier AM , Saudou F , David DJ . Huntington’s disease knock-in male mice show specific anxiety-like behaviour and altered neuronal maturation. Neurosci Lett. (2012) ;507: (2):127–32. |
[11] | Fielding SA , Brooks SP , Klein A , Bayram-Weston Z , Jones L , Dunnett SB . Profiles of motor and cognitive impairment in the transgenic rat model of Huntington’s disease. Brain Res Bull. (2012) ;88: (2-3):223–36. |
[12] | Damiano M , Diguet E , Malgorn C , D’Aurelio M , Galvan L , Petit F , et al. A role of mitochondrial complex II defects in genetic models of Huntington’s disease expressing N-terminal fragments of mutant huntingtin. Hum Mol Genet. (2013) ;22: (19):3869–82. |
[13] | Damiano M , Galvan L , Deglon N , Brouillet E . Mitochondria in Huntington’s disease. Biochim Biophys Acta. (2010) ;1802: (1):52–61. |
[14] | Ferreira IL , Cunha-Oliveira T , Nascimento MV , Ribeiro M , Proenca MT , Januario C , et al. Bioenergetic dysfunction in Huntington’s disease human cybrids. Exp Neurol. (2011) ;231: (1):127–34. |
[15] | Guedes-Dias P , Pinho BR , Soares TR , de Proenca J , Duchen MR , Oliveira JM . Mitochondrial dynamics and quality control in Huntington’s disease. Neurobiol Dis. (2016) ;90: :51–7. |
[16] | Oliveira JM . Mitochondrial bioenergetics and dynamics in Huntington’s disease: tripartite synapses and selective striatal degeneration. J Bioenerg Biomembr. (2010) ;42: (3):227–34. |
[17] | Orth M , Schapira AH . Mitochondria and degenerative disorders. Am J Med Genet. (2001) ;106: (1):27–36. |
[18] | Mochel F , Haller RG . Energy deficit in Huntington disease: why it matters. J Clin Invest. (2011) ;121: (2):493–9. |
[19] | Brett AC , Rosenstock TR , Rego AC . Current therapeutic advances in patients and experimental models of Huntington’s disease. Curr Drug Targets. (2014) ;15: (3):313–34. |
[20] | Rosenstock TR , Duarte AI , Rego AC . Mitochondrial-associated metabolic changes and neurodegeneration in Huntington’s disease - from clinical features to the bench. Curr Drug Targets. (2010) ;11: (10):1218–36. |
[21] | van der Burg JMM , Gardiner SL , Ludolph AC , Landwehrmeyer GB , Roos RAC , Aziz NA . Body weight is a robust predictor of clinical progression in Huntington disease. Ann Neurol. (2017) ;82: (3):479–83. |
[22] | Orr AL , Li S , Wang CE , Li H , Wang J , Rong J , et al. N-terminal mutant huntingtin associates with mitochondria and impairs mitochondrial trafficking. J Neurosci. (2008) ;28: (11):2783–92. |
[23] | Li XJ , Orr AL , Li S . Impaired mitochondrial trafficking in Huntington’s disease. Biochim Biophys Acta. (2010) ;1802: (1):62–5. |
[24] | Chang DT , Rintoul GL , Pandipati S , Reynolds IJ . Mutant huntingtin aggregates impair mitochondrial movement and trafficking in cortical neurons. Neurobiol Dis. (2006) ;22: (2):388–400. |
[25] | Goodman AO , Murgatroyd PR , Medina-Gomez G , Wood NI , Finer N , Vidal-Puig AJ , et al. The metabolic profile of early Huntington’s disease–a combined human and transgenic mouse study. Exp Neurol. (2008) ;210: (2):691–8. |
[26] | Seong IS , Ivanova E , Lee JM , Choo YS , Fossale E , Anderson M , et al. HD CAG repeat implicates a dominant property of huntingtin in mitochondrial energy metabolism. Hum Mol Genet. (2005) ;14: (19):2871–80. |
[27] | Ciammola A , Sassone J , Sciacco M , Mencacci NE , Ripolone M , Bizzi C , et al. Low anaerobic threshold and increased skeletal muscle lactate production in subjects with Huntington’s disease. Mov Disord. (2011) ;26: (1):130–7. |
[28] | Ciammola A , Sassone J , Alberti L , Meola G , Mancinelli E , Russo MA , et al. Increased apoptosis, Huntingtin inclusions and altered differentiation in muscle cell cultures from Huntington’s disease subjects. Cell Death Differ. (2006) ;13: (12):2068–78. |


