
HttQ111/+ Huntington’s Disease Knock-in Mice Exhibit Brain Region-Specific Morphological Changes and Synaptic Dysfunction
Abstract
Background:
Successful disease-modifying therapy for Huntington’s disease (HD) will require therapeutic intervention early in the pathogenic process. Achieving this goal requires identifying phenotypes that are proximal to the HTT CAG repeat expansion.
Objective:
To use Htt CAG knock-in mice, precise genetic replicas of the HTT mutation in patients, as models to study proximal disease events.
Methods:
Using cohorts of B6J.HttQ111/+ mice from 2 to 18 months of age, we analyzed pathological markers, including immunohistochemistry, brain regional volumes and cortical thickness, CAG instability, electron microscopy of striatal synapses, and acute slice electrophysiology to record glutamatergic transmission at striatal synapses. We also incorporated a diet perturbation paradigm for some of these analyses.
Results:
B6J.HttQ111/+ mice did not exhibit significant neurodegeneration or gliosis but revealed decreased striatal DARPP-32 as well as subtle but regional-specific changes in brain volumes and cortical thickness that parallel those in HD patients. Ultrastructural analyses of the striatum showed reduced synapse density, increased postsynaptic density thickness and increased synaptic cleft width. Acute slice electrophysiology showed alterations in spontaneous AMPA receptor-mediated postsynaptic currents, evoked NMDA receptor-mediated excitatory postsynaptic currents, and elevated extrasynaptic NMDA currents. Diet influenced cortical thickness, but did not impact somatic CAG expansion, nor did it show any significant interaction with genotype on immunohistochemical, brain volume or cortical thickness measures.
Conclusions:
These data show that a single HttQ111 allele is sufficient to elicit brain region-specific morphological changes and early neuronal dysfunction, highlighting an insidious disease process already apparent in the first few months of life.
INTRODUCTION
Huntington’s disease (HD) is an autosomal dominant neurodegenerative disease characterized by motor, cognitive and psychiatric symptoms [1]. The underlying cause is the expansion >35 repeats of a polymorphic CAG tract within the HTT gene encoding huntingtin [2]. Human genetic data demonstrate that clinical onset is driven by a mechanism(s) that is CAG length-dependent, acts in a fully dominant manner, and is modified by other genes [3, 4]. While there is increasing evidence for disease manifestation across many brain regions as well as peripheral tissues, the caudate-putamen (striatum) and deep cortical layers show particular vulnerability to the effects of the HD mutation [5, 6].
Many mouse and other animal models of HD have been developed to investigate the pathogenesis of HD, producing a wealth of knowledge on cellular pathways that are impacted by the HD mutation [7]. However, identifying targets for disease-modifying therapies will require an understanding of which pathway(s) are directly relevant to disease pathogenesis in patients. As HD is caused by mutation in a single gene, our approach to disease modeling in the mouse aims to represent accurately the HD mutation, with the focus on delineating the consequences of this mutation without the a priori expectation that phenotypes will necessarily resemble those in patients. This led to the creation of Htt (formerly Hdh) CAG “knock-in” mice, harboring expanded CAG-containing mouse Htt alleles [8]. Recent studies in knock-in mice harboring different repeat lengths and genetic backgrounds have highlighted early molecular and behavioral phenotypes, delineating early impacts of this mutation [9–11].
We and others have focused on studying the HttQ111 (formerly HdhQ111) knock-in model of HD, with an emphasis on understanding phenotypes that occur in heterozygous mice carrying one mutant allele, as do the majority of HD patients. HttQ111 mice exhibit a number of molecular, cellular and behavioral phenotypes that provide evidence for an ongoing pathogenic process with specificity for the striatum and cortex [11–19]. Earlier studies of the HttQ111 mice on a CD1 outbred genetic background did not provide strong evidence for neurodegenerative phenotypes [13]. Here, we wished to test this further using a congenic B6J.HttQ111 line that exhibits evidence for an accelerated disease process relative to CD1.HttQ111 [11, 12, 14]. We thus investigated histopathological markers in the striatum, brain regional volumes and cortical thickness, and analyzed synapse number and structure by electron microscopy (EM) in aged (18-month) cohort(s) of mice. It was recently shown that diet influences the effect of Htt genotype on metabolic profiles in B6J.HttQ111/+ mice [20] fed either a high-fat (60% kcal fat) or a medium-fat (45% kcal fat) diet. We reasoned that other phenotypes may also be affected by an interaction of genotype and diet and that this might provide some insight into underlying mechanism(s) of pathogenesis. We therefore subjected a cohort of mice to this same diet perturbation paradigm and analyzed the mice at an earlier age (10 months) for effects on histopathological markers, brain regional volumes and cortical thickness, as measured in an aged cohort. We also analyzed somatic CAG instability in liver and striatum of the diet-treated mice. These two tissues exhibit particularly high levels of time-dependent somatic expansion [21], which we hypothesized might be altered in response to metabolic stress induced by a high-fat diet. Finally, to probe very early synaptic alterations that precede other phenotypes as seen in other HD mouse models [22], we performed acute slice electrophysiology at 2 and 4.5 months of age to measure glutamatergic transmission at striatal synapses, including spontaneous AMPA receptor-mediated excitatory postsynaptic currents (sEPSCs) and evoked NMDA receptor (NMDAR)-mediated excitatory postsynaptic currents (eEPSCs). We also measured NMDAR eEPSCs in the presence of TBOA, which specifically blocks glutamate uptake, resulting in “spillover” and activation of the extrasynaptic NMDA receptors, thought to favor activation of cell death signaling pathways [22]. Together, the results of these studies highlight early brain region-specific morphological changes and neuronal dysfunction elicited by a single HttQ111 allele.
MATERIALS AND METHODS
Mouse cohorts
Mouse work was carried out in accordance with the National Institutes of Health Guide for the Care and Use of Laboratory Animals. This study was reviewed and approved by the Massachusetts General Hospital (MGH) Subcommittee of Research Animal Care (SRAC), which serves as the Institutional Animal Care and Use Committee (IACUC) for MGH. The study was also reviewed and approved by the UBC Committee on Animal Care (Protocol A11-0012), and followed guidelines of the Canadian Committee on Animal Care (CCAC). Mice used in this study were the HttQ111 line of HD homologue knock-in mice (formerly HdhQ111) [23] backcrossed onto a C57BL/6J genetic background [24]. Mouse genotyping and CAG repeat length determinations were performed as described previously [25]. The mice used in this study were heterozygous HttQ111/+ mice and their wild-type Htt+/+ littermates generated by crossing HttQ111/+ C57BL/6J and female wild-type C57BL/6J mice (Jackson labs). CAG lengths of the HttQ111 progeny varied from 125–133 repeats.
At weaning, a cohort of mice was assigned randomly to either a high fat (20/20/60% kcal from protein/carbohydrate/fat) or a medium fat (20/35/45% kcal from protein/carbohydrate/fat) diet (Research Diets, New Brunswick, NJ) and maintained on this diet until sacrifice at 10 months of age (high fat diet HttQ111/+ 2 males, 2 females; high fat diet Htt+/+ 3 males, 3 females; medium fat diet HttQ111/+ 3 males, 3 females; medium fat diet Htt+/+ 3 males, 3 females). These mice, together with a cohort (regular chow-fed 22% protein, 5% fat) of mice aged to 18 months (HttQ111/+ 2 males, 4 females; Htt+/+ 3 males, 2 females) were used for histopathological analyses, including quantitative assessment of brain regional volumes and cortical thickness. The medium and high fat diet-fed mice were also used for analyses of somatic instability. Separate cohorts of mice were used for brain slice electrophysiology at ∼2 months (3 male, 1 female HttQ111/+: mean = 56 days, range = 50–62 days; 3 male, 1 female Htt+/+: mean = 56 days, range = 51–61 days) and ∼4.5 months (3 male, 6 female HttQ111/+: mean = 141 days, range = 99–176 days; 4 male, 6 female Htt+/+: mean = 138 days; range = 96–206 days). An additional cohort of mice (3 HttQ111/+ and 3 Htt+/+, all females) was sacrificed at 18 months and used for electron microscopy.
Analysis of CAG repeat instability
The Htt CAG repeat was amplified using a human-specific PCR assay that amplifies the repeat from the knock-in allele but does not amplify the mouse sequence [25]. The forward primer was fluorescently labeled with 6-FAM (Applied Biosystems) and products were resolved using the ABI 3730xl DNA analyzer (Applied Biosystems) with GeneScan 500 LIZ as internal size standard (Applied Biosystems). GeneMapper v3.7 (Applied Biosystems) was used to generate CAG repeat size distribution traces. Expansion and contraction indices were quantified from the GeneMapper CAG repeat distributions as previously described [21]. Briefly, the highest peak in each trace was used to determine a relative threshold of 10% and peaks falling below this threshold were excluded from analysis. Peak heights normalized to the sum of all peak heights were multiplied by the change in CAG length of each peak relative to the highest peak and summed to generate an instability index representing the mean repeat length change.
Histology
For histopathological analyses, the 10- and 18-month cohorts of mice were transcardially perfused with cold perfusion wash buffer (0.8% NaCl, 0.4% dextrose, 0.8% sucrose, 0.023% CaCl2, 0.034% sodium cacodylate), followed by perfusion fix buffer (freshly prepared 4% paraformaldehyde, 4% sucrose, 1.4% sodium cacodylate). Skulls with intact brains were post-fixed for 24 h in perfusion fix buffer at 4°C, transferred into perfusion wash buffer, and right hemispheres were embedded, cryosectioned (60 μm) and stained at NeuroScience Associates (NSA; Knoxville, TN) with antibodies to GFAP with thionine Nissl counterstain, NeuN, ferritin and DARPP-32 using DAB detection. Image analyses were performed using Cell Profiler 2.2.0 image analysis software [26, 27]. GFAP and NeuN immunostaining were quantified as the percentage of total image area occupied by positively stained objects in four 20x striatal images per mouse, then averaged for each mouse. Ferritin immunostaining was quantified as the number of ferritin-positive objects from four 20x striatal images per mouse, averaged per mouse. For DARPP-32 immunostained sections the area of the striatum and total intensity of striatal DARPP-32 staining were quantified in 2x images of whole hemispheres (striatum was delineated manually, guided by morphology). Total staining intensity was normalized by the area of the striatum in each image, and resulting values were averaged over three sections per mouse.
Determination of brain regional volume and cortical thickness
Brain regional volume and cortical thickness analyses were performed on the GFAP/thionine Nissl-stained slides generated above, using the Nissl counterstain for regional definition. Imaging and data collection were performed with a modified light microscope (Olympus BX51WI; Olympus, Tokyo, Japan), Olympus PlanN 2× objective, motorized specimen stage (Ludl Electronics; Hawthorne, NY, USA), CCD color video camera (2000R; QImaging, Surrey, BC, Canada) and stereology software (Stereo Investigator, v10.50; MBF Bioscience, Williston, VT, USA). Photomicrographs were produced by digital photography. On average, 4 images were captured for each brain section and combined into one montage using the 2D Virtual Tissue module of the Stereo Investigator software. No modifications to the images were performed after acquisition.
For the brain regional volumes, anatomical boundaries of the specified regions of interest - cerebrum, cortex, cingulate cortex, striatum, caudate-putamen, ventral striatum, hippocampus proper and dentate gyrus - were delineated following established criteria [28, 29] (Fig. S1). Essentially, the cerebrum was defined to include the whole brain, excluding the olfactory bulb, medulla, optic nerve and cerebellum. The cerebral cortex was delineated when all 6 layers were present and included the piriform cortex and neocortex, beginning approximately 1.6 mm from Bregma. The cingulate cortex was defined to include the dorsal and ventral anterior cingulate cortex, which extends from approximately 1.10 to –1.10 mm from Bregma. The striatum was defined as the caudate, putamen and ventral striatum. The hippocampus was delineated [29] such that the dentate gyrus comprised the granule cell layer, polymorphic layer and the molecular layer while the hippocampus proper contained the fimbria, pyramidal cell layers, and the projection fields: stratum radiatum, lucidum, lacunosum moleculare and oriens. The subiculum was excluded from the hippocampus proper. Stereologic estimation of brain regional volume was performed using the Cavalieri principle. The cerebrum and cerebral cortex were identified on an average of 19 and 16 stained sections, respectively, across all animals, while the striatum was identified on an average of 11 sections across all animals. The cingulate cortex spanned an average of 7 sections. The hippocampus and dentate gyrus were identified on an average of 8 and 7 sections, respectively.
Cortical thickness was measured where the six cortical layers were clearly demarcated (beginning approximately 1.6 mm from Bregma) perpendicularly to the pial surface, at distances of 3000 μm, 6000 μm and 9000 μm from the longitudinal fissure (Fig. S1). Measurements were matched according to the best fit Bregma location [28] and could be obtained up to –3.8 mm from Bregma. Not all animals could be measured at each location, and statistical comparisons were only performed when each group had a minimum of three measurements.
Electron microscopy
Mice were transcardially perfused with cold PBS followed by fix (2% paraformaldehyde, 2% glutaraldehyde in PBS). Brains were taken out of the skulls and stored at 4°C overnight in the fix. One hemisphere was sectioned coronally at 40 μm on a vibratome, sections post-fixed in 1% osmium tetroxide/PBS, dehydrated in graded ethanol (50% and 70%), and stained with 1% uranyl acetate in 70% ethanol for 1 h. Sections were further dehydrated in graded ethanol (90% and 100%) and mounted in Epon resin on glass slides. The slides were cured overnight at 60°C. Areas from mid-striatum (two per mouse) were microdissected and mounted on Epon resin blocks. From these, ultra-thin sections (70 nm) were cut and viewed with a Jeol JEM 1011 transmission electron microscope. Measurements of synapse length and synapse density (number of synapses per μm2) were performed in four 10,000x images per mouse, each image covering an area of 250 μm2. Synaptic cleft width and postsynaptic density (PSD) width were measured in 30 to 33 100,000x images per mouse. Only asymmetric (excitatory) synapses were included in the analysis. All measurements were carried out using ImageJ software (https://imagej.nih.gov/ij/).
Electrophysiology
Standard whole-cell patch-clamp recordings were obtained in striatal projection neurons (SPNs) / medium spiny neurons (MSNs) from the central area of the striatum in 400 μm coronal slices, and analyses conducted as previously described [30, 31]. Pipette resistance (Rp) was 3 to 6 MOhms when filled with:130 mM Cs methanesulfonate, 5 mM CsCl, 4 mM NaCl, 1 mM MgCl2, 5 mM EGTA, 10 mM HEPES, 5 mM QX-314, 0.5 mM GTP, 10 mM Na2-phosphocreatine, and 5 mM MgATP, pH 7.3, 290 to 295 mOsM. Tolerance for series resistance (Rs) was <20 MOhms and uncompensated; delta Rs tolerance was <20%. Briefly, cells were held at Vh -70 mV and glutamatergic spontaneous excitatory postsynaptic currents (sEPSCs; AMPA-type glutamate receptor mediated) collected in the presence of 100 μM picrotoxin (to block GABAergic inhibition). sEPSCs were analyzed using Clampfit10 (threshold 5pA). Evoked EPSCs (eEPSCs) were generated by 40 μs stimulation pulses delivered through a glass micropipette placed dorsally within 200 to 400 μm of the recording site. Cells were held at –70 mV for AMPA-EPSCs and at +40 mV to assay NMDA-type glutamate receptor currents. To further assay NMDAR current generated through extrasynaptic NMDARs, the glial glutamate transport inhibitor TBOA was bath applied during acquisition of NMDAR-mediated eEPSCs. The excessive glutamate results in activation of extrasynaptic NMDARs. Evoked currents were averages of three (0.066 Hz) and NMDAR kinetics expressed as Tau weighted (tW) following Stocca and Vicini [32]. All data are expressed as mean±SEM, and the statistical analyses were as detailed in the Methods.
Statistical analyses
Histological, brain volume and cortical thickness phenotypes in the 10-month cohort of mice treated with a high or medium fat diet were analyzed by 2-way ANOVA, with genotype, diet and genotype x diet interaction as covariates. CAG repeat expansion, measured only in 10-month HttQ111/+ mice, was compared in high and medium fat diets using a 2-tailed unpaired Student’s t-test. Phenotypes in the 18-month cohorts (histological, brain volume, cortical thickness, and EM measures) were compared in mutant and WT mice using 2-tailed unpaired Student’s t-tests. While histological, brain volume and cortical thickness phenotypes were measured at both 10 and 18 months, we analyzed each age separately, rather than incorporating age into an ANOVA as the 18 month mice were fed a different diet (regular chow) to those at 10 months (high and medium fat), thus potentially confounding interpretation of any apparent age-related effect. Analyses of electrophysiological phenotypes at 2 and 4.5 months were carried out using unpaired t-tests for each age group, with Welch’s correction for unequal variance as appropriate. Statistical analyses were performed using GraphPad Prism.
RESULTS
A single HttQ111 mutation does not induce overt neurodegenerative phenotypes in aging mice or in a diet perturbation paradigm
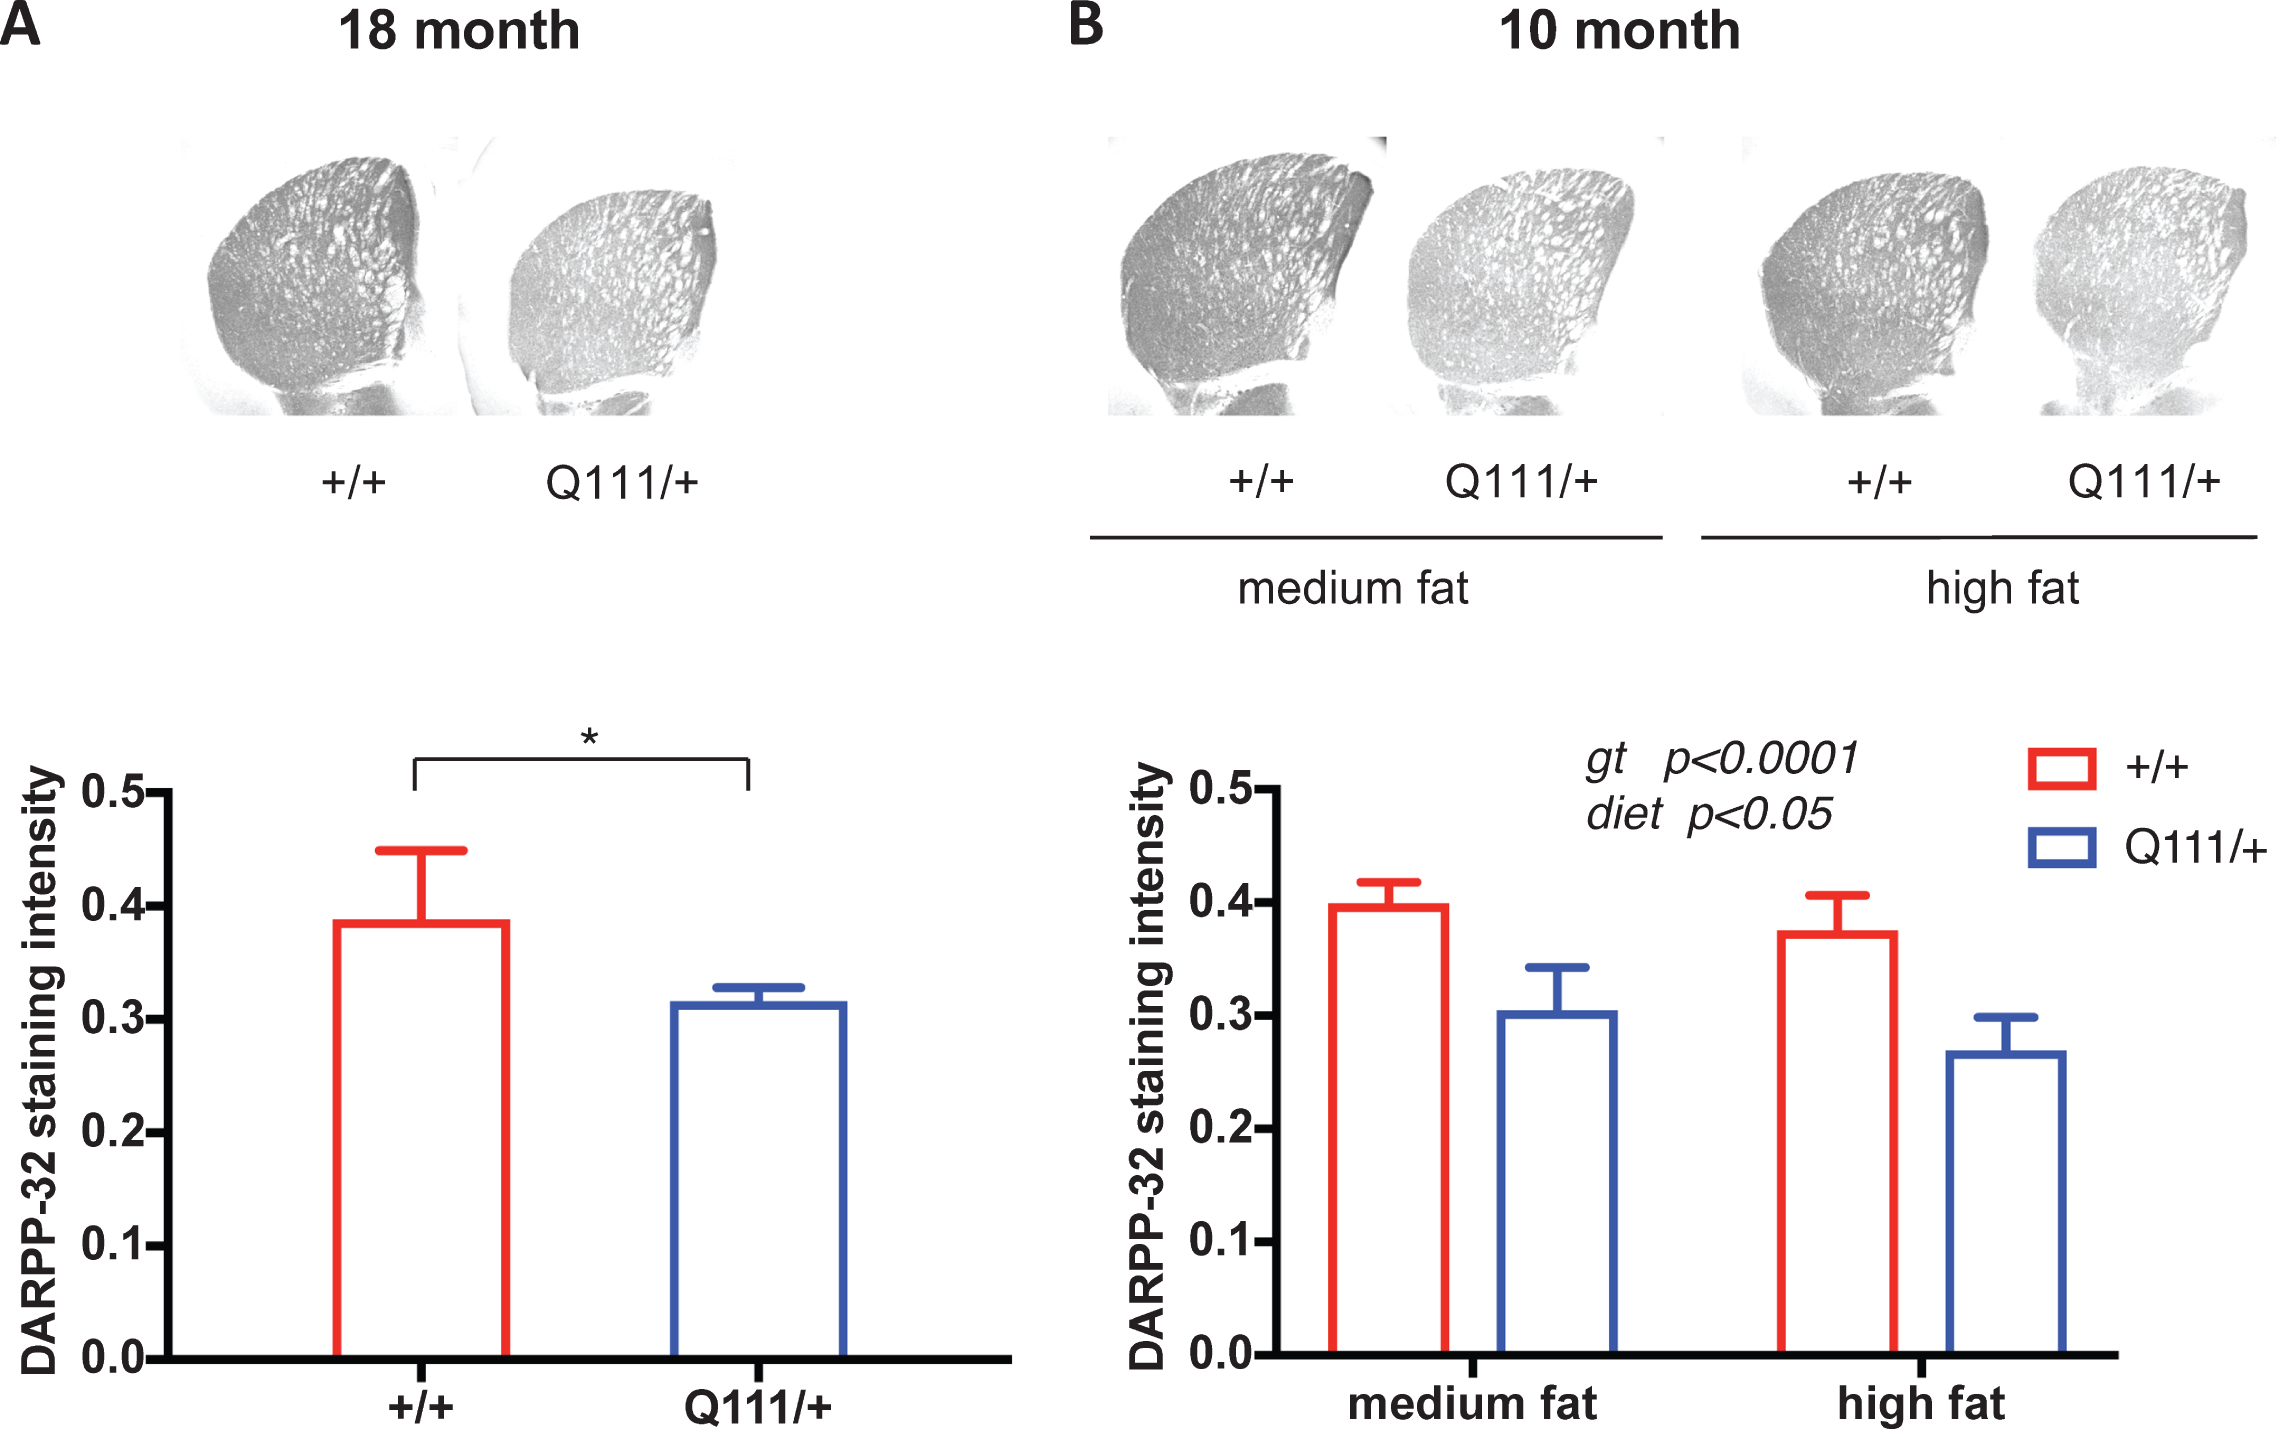
As phenotypes exhibited by HttQ111/+ mice are consistent with an increased vulnerability of the striatum (caudate-putamen) to the HD mutation [12] we focused initially on this brain region. We performed immunohistochemistry using antibodies to: neuronal-specific marker NeuN; DARPP-32, a protein specific to striatal medium-spiny neurons; glial fibrillary acidic protein (GFAP), an astrocyte marker induced under conditions of astroglial activation; and ferritin, a marker of abnormal microglia found to precede increases in Iba1 [33]. In relatively old (18-month) mice we did not observe any effect of the HttQ111 allele on NeuN, GFAP or ferritin immunostaining (Fig. S2). In contrast, DARPP-32 immunostaining intensity was markedly decreased in 18-month HdhQ111/+ striata (2-tailed unpaired t-test p = 0.018) (Fig. 1A).
We also tested the impact of the HttQ111 mutation on these pathological markers in 10-month mice in a paradigm of diet-mediated perturbation [20] in which mice were fed either a high-fat diet (60% kcal fat) or a medium-fat diet (45% kcal fat). Neither genotype nor diet influenced NeuN or ferritin immunostaining (Fig. S2), with a small effect of HttQ111 genotype on reducing GFAP in high fat-fed mice (Fig. S2). As in the 18-month cohort, DARPP-32 immunostaining intensity was significantly reduced in HttQ111 striata (2-way ANOVA: genotype F (1, 18)=59.34, p < 0.0001). There was a small effect of diet, but no interaction with genotype (2-way ANOVA; diet F (1, 18)=5.121, p = 0.036; genotype x diet interaction F (1, 18)=0.2119 p = 0.65) (Fig. 1B).
Fig.1
The influence of HttQ111 genotype and diet on DARPP-32 immunostaining intensity. A. DARPP-32 immunostaining in striata from a cohort of 18-month HttQ111/+ (N = 6: 3 males, 3 females) and Htt+/+ (N = 5: 3 males, 2 females). B. DARPP-32 immunostaining in striata from a cohort of 10-month mice fed either a medium fat diet (HttQ111/+ N = 6: 3 males, 3 females; Htt+/+ N = 6: 3 males, 3 females) or a high fat diet (HttQ111/+ N = 4: 2 males, 2 females; Htt+/+ N = 6: 3 males, 3 females). Representative images of striatal sections are shown for each genotype or genotype/diet at 2x magnification. Bars show mean staining intensity (x 104) per unit area for mice of a given genotype or genotype/diet. Error bars show S.D. p value for 18-month mice was determined using a 2-tailed unpaired Student’s t-test. Genotype (gt) and diet p values in the 10-month mice were determined using 2-way ANOVA.
The results of these histological analyses indicate that a single HttQ111 allele on a B6J genetic background does not result in overt neurodegeneration or obvious astroglial or microglial activation up to 18 months of age, or in a paradigm of diet-mediated perturbation at 10 months. However, differences between mutant and wild-type mice in DARPP-32 levels, observed here at two ages and previously in these mice as early as 6 months of age [19, 34], are consistent with early neuronal dysfunction that precedes overt neurodegeneration.
The HttQ111 mutation exerts subtle but region-selective reductions in brain volume and cortical thickness.
Decreases in brain regional volumes and cortical thickness have been found in premanifest HD mutation carriers [35–38]. To determine whether there might be a subtle impact of the HttQ111 mutation on these measures we performed stereological analyses in the brains of the cohort of 18-month mice and the cohort of 10-month mice fed medium and high fat diets. We determined volumes of the striatum, caudate-putamen, ventral striatum, cerebrum, cortex, cingulate cortex, hippocampus and dentate gyrus (see Fig. S1 for a definition of these regions). Cortical thickness measurements were taken perpendicularly to the pial surface at 3000 μm, 6000 μm and 9000 μm from the longitudinal fissure, at points along the rostro-caudal axis where all six cortical layers were present (Fig. S1).
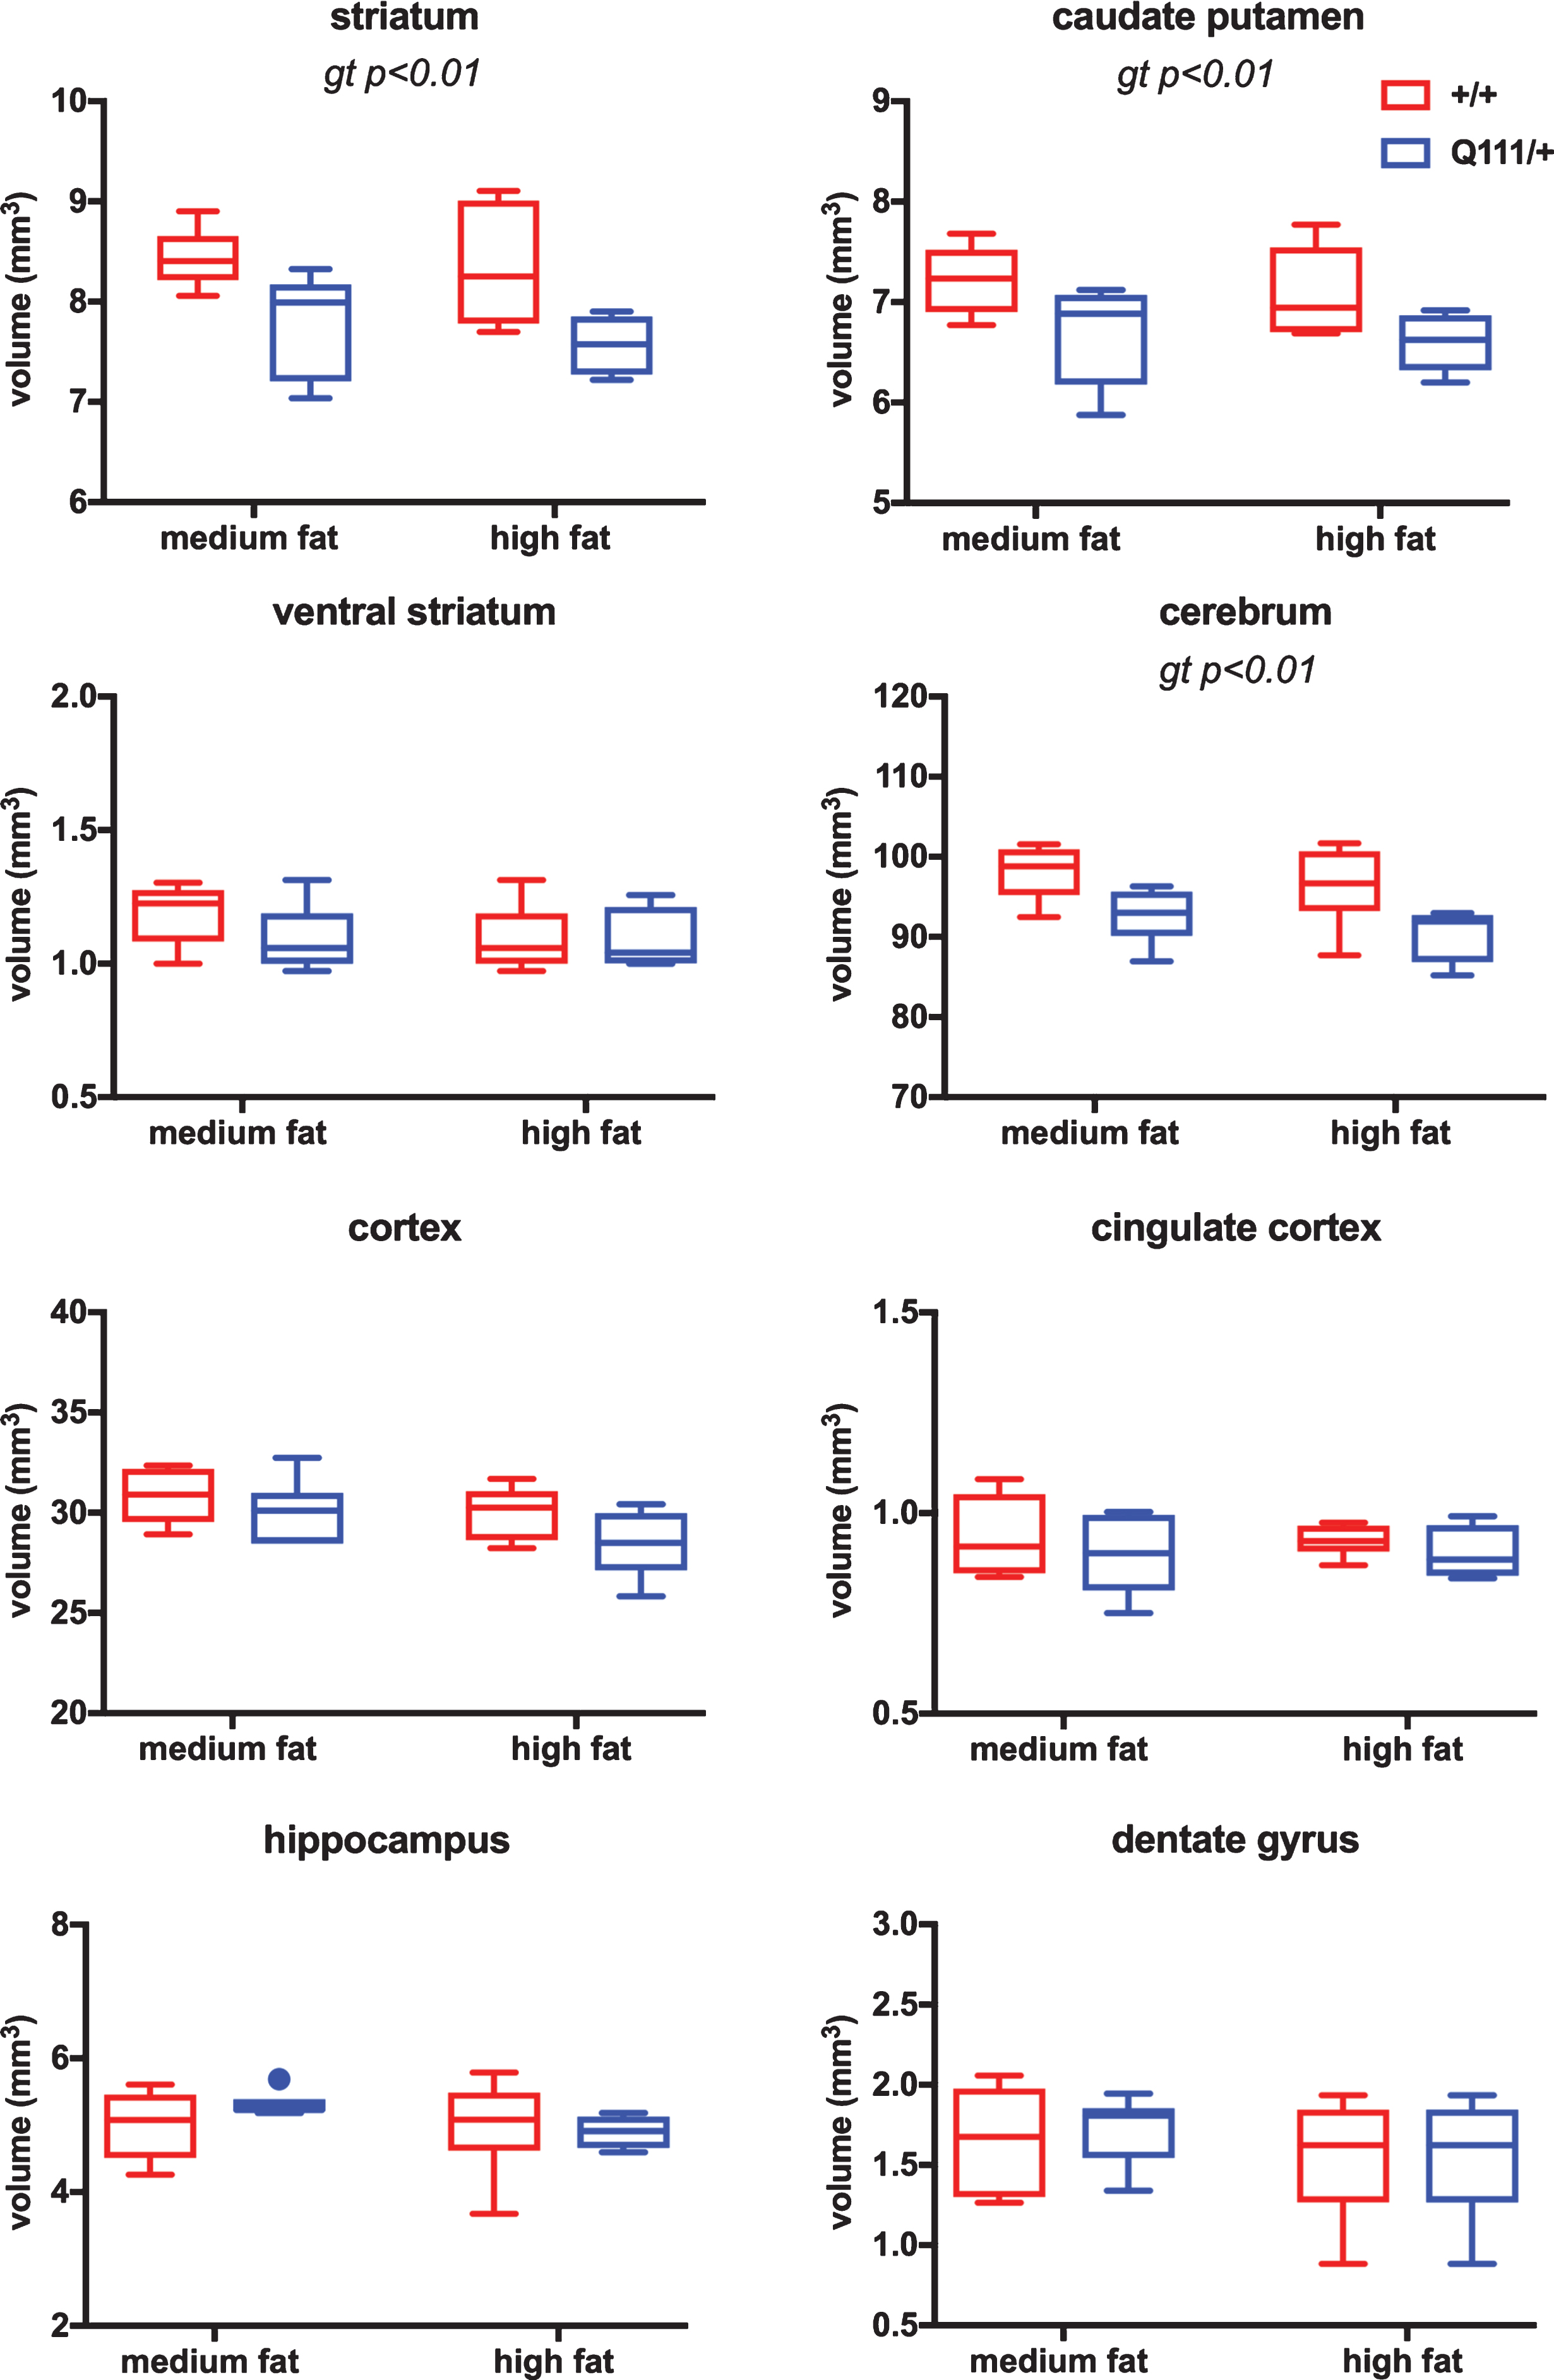
In the 18-month cohort, we did not find any statistically significant differences either in brain regional volumes (Fig. S3) or in cortical thickness (Fig. S4) between HttQ111/+ and Htt+/+ mice. Brain regional volumes for the 10-month cohort of mice, which were treated with high- or medium-fat diets, are shown in Fig. 2. Statistical analyses using 2-way ANOVA showed a significant effect of HttQ111/+ genotype in reducing the volume of the striatum (F (1, 18)=12.94 genotype p = 0.002), caudate-putamen (F (1, 20)=10.11 genotype p = 0.005) and cerebrum (F (1, 18)=10.93 genotype p = 0.004), a trend towards reduced cortical volume (F (1, 20)=3.567 genotype p = 0.07), but no significant genotype effect in ventral striatum, cingulate cortex, hippocampus or dentate gyrus. There was no significant effect of diet, nor a significant genotype x diet interaction in any of the brain regions.
Fig.2
The influence of HttQ111 genotype and diet on brain regional volumes. Tukey box-and-whisker plots showing volumes of striatum, caudate putamen, ventral striatum, cerebrum, cortex, cingulate cortex, hippocampus and dentate gyrus (see Fig. S1 for the definition of these brain regions) in 10-month mice fed either a medium fat diet (HttQ111/+ N = 6: 3 males, 3 females; Htt+/+ N = 6: 3 males, 3 females) or a high fat diet (HttQ111/+ N = 4: 2 males, 2 females; Htt+/+ N = 6: 3 males, 3 females). Significant genotype (gt) effects determined using 2-way ANOVA are indicated. Dot in hippocampus panel indicates outlier (>75th percentile plus 1.5x interquartile range (IQR) or <25th percentile minus 1.5x IQR).
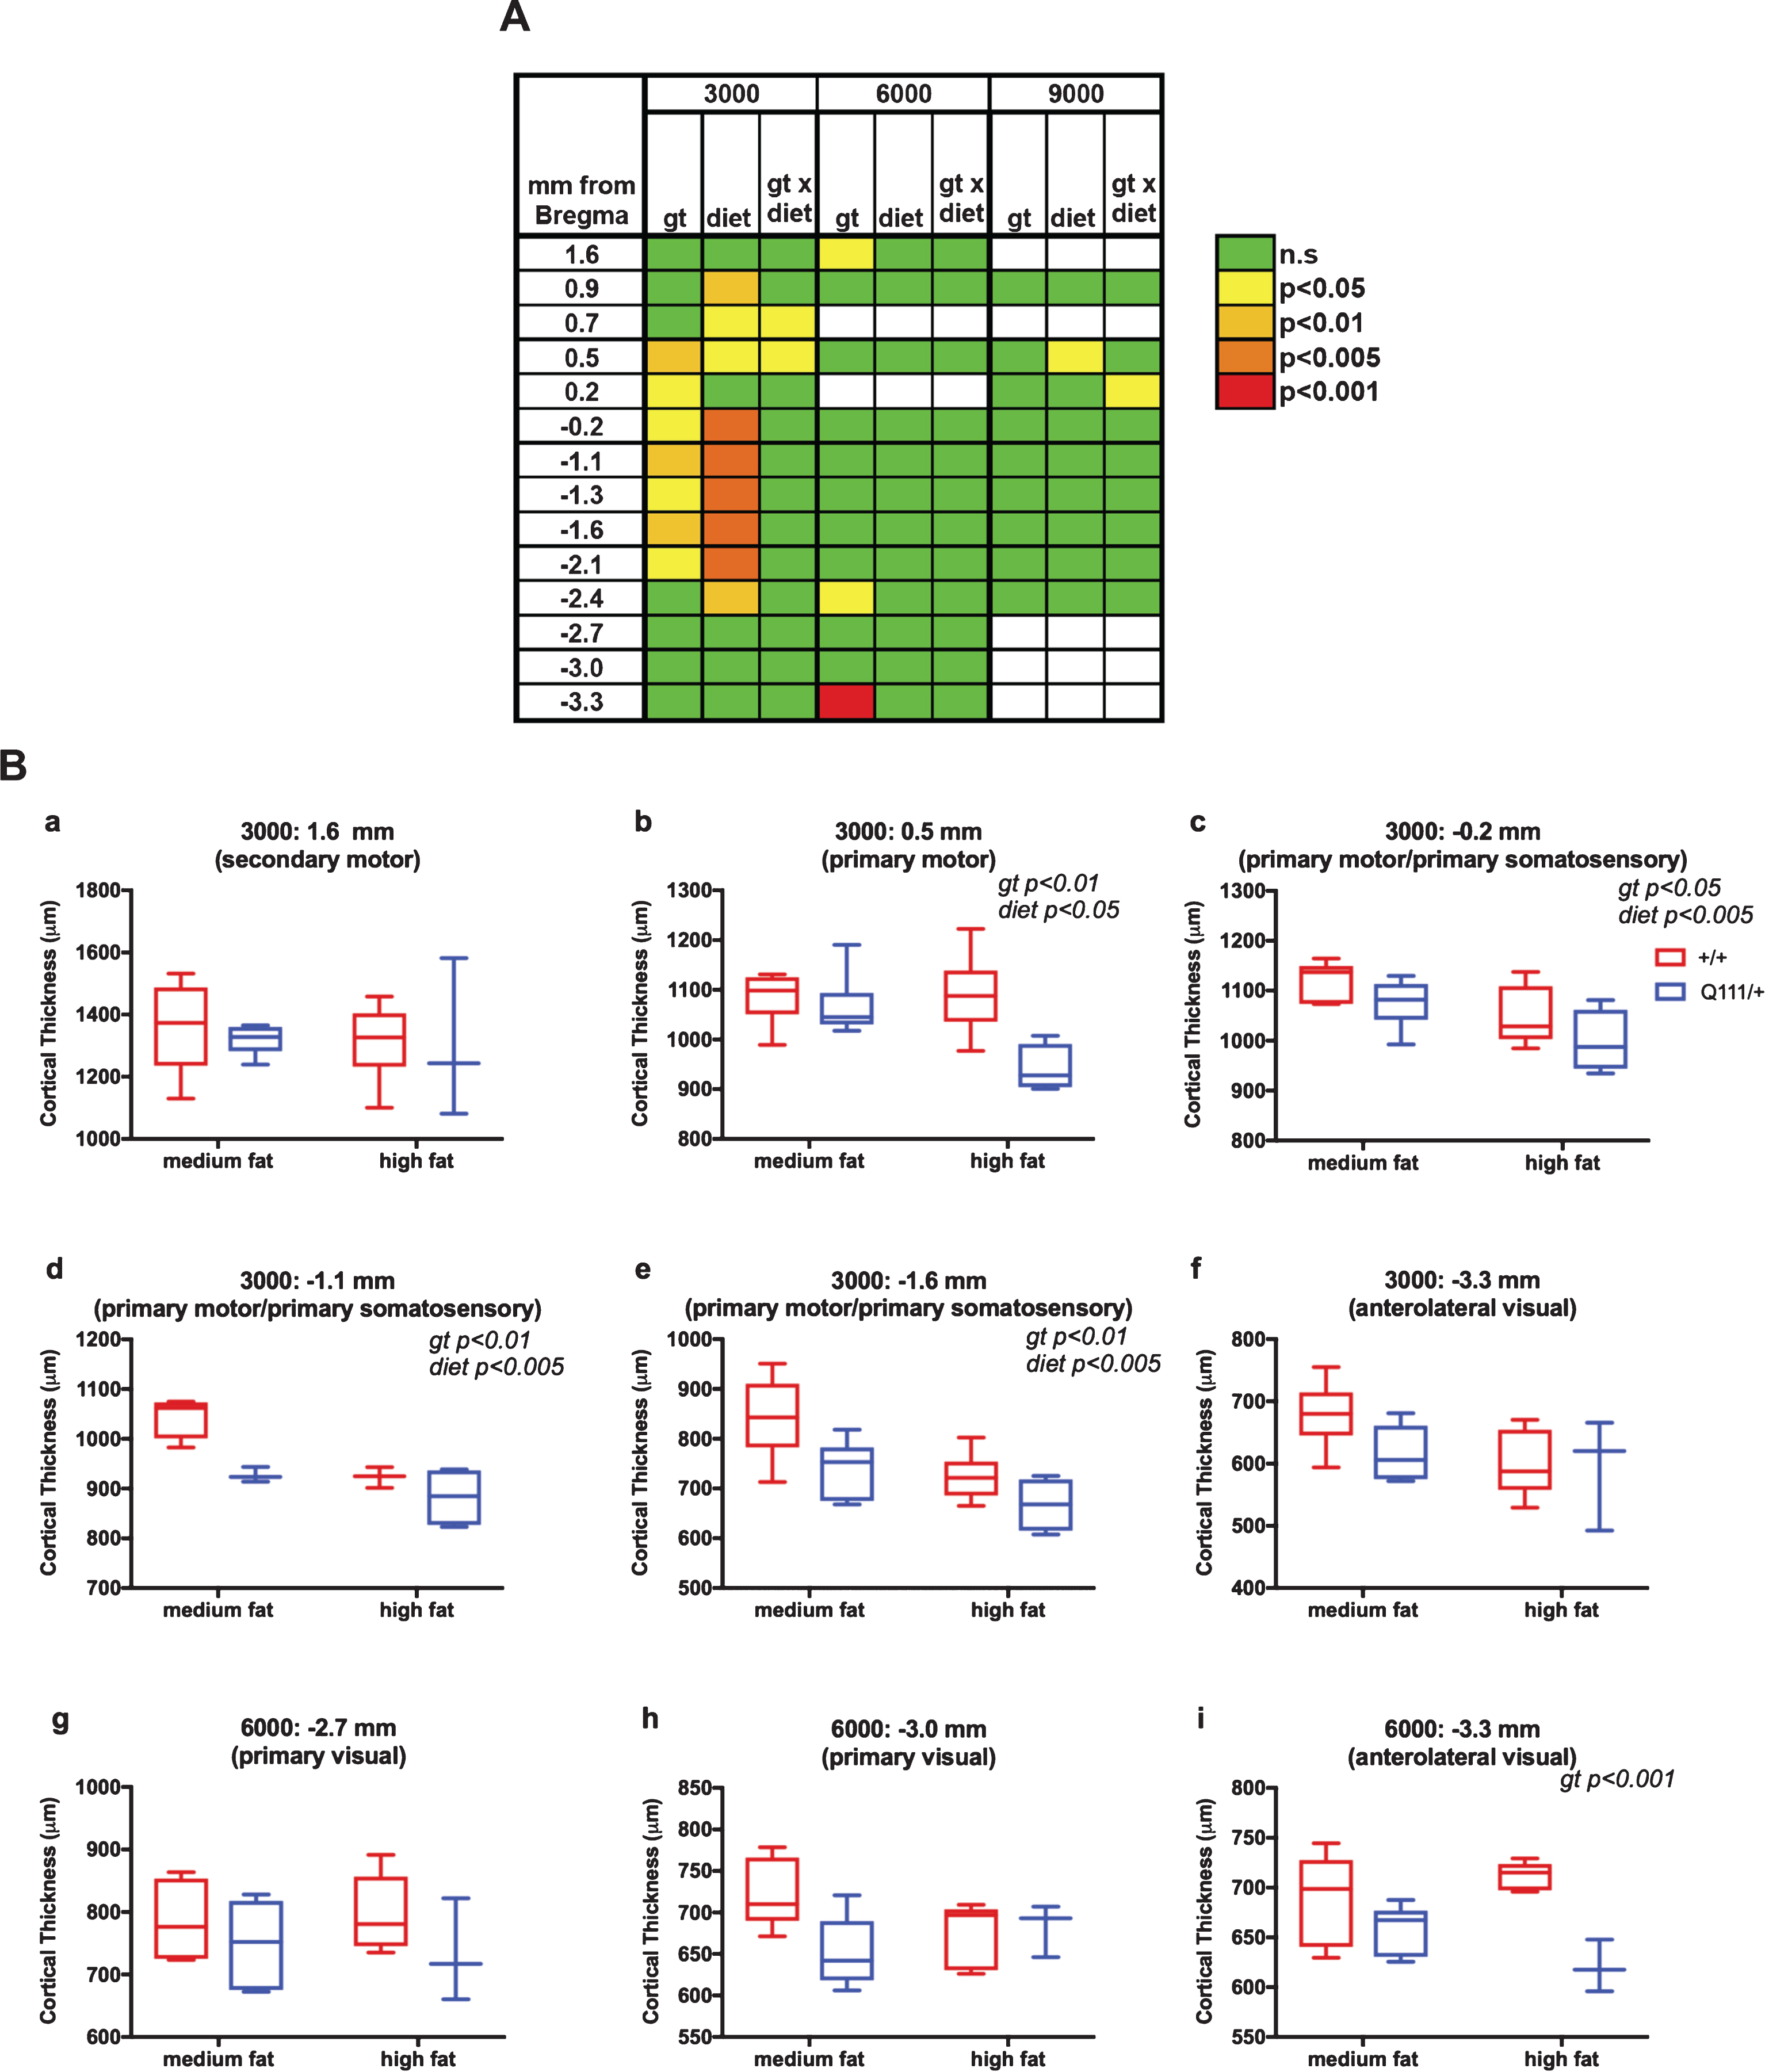
Cortical thickness measurements along the rostro-caudal axis for the 10-month cohort are shown in Fig. S5. As the distances from Bregma for each individual mouse are based on an “average” brain there is room for error in designating where precisely these map (Table S1) in each mouse. Therefore, continuous stretches of altered cortical thickness provide more confidence in the involvement of a particular region than effects limited to a single location along the rostro-caudal axis. The results of 2-way ANOVA analyses of these data are shown in Fig. 3, where panel A shows a table of significance across all locations and panel B shows selective plots of these data. As shown in Fig. 3A, we found consistent significant genotype effects at 3000 μm from the longitudinal fissure and in a region from +0.5 mm to –2.1 mm from Bregma, corresponding approximately to the primary motor and primary somatosensory cortex (Table S1). Cortical thickness in this region was also sensitive to diet, though we did not find any significant genotype x diet interaction (Fig. 3A). Data from this region are highlighted in Fig. 3B: panels b-e), contrasting with a more anterior region (Fig. 3B: panel a) where cortical thickness was not altered. We also found a highly significant effect of genotype at –3.3 mm from Bregma at 6000 μm from the longitudinal fissure, corresponding approximately to the anterolateral part of the visual cortex (Fig. 3A, B: panel i). While other measurements in the visual cortex did not result in statistically significant genotype effects (Fig. 3A, Table S1), we did observe trends towards decreased thickness in visual cortex in HttQ111/+ mice (Fig. 3B: panels f-h), suggesting some involvement of this region.
Fig.3
The influence of HttQ111 genotype and diet on cortical thickness. Cortical thickness was measured along the rostro-caudal axis (mm from Bregma) at 3000 μm, 6000 μm and 9000 μm from the longitudinal fissure in 10-month mice fed either a medium fat diet (HttQ111/+ N = 6: 3 males, 3 females; Htt+/+ N = 6: 3 males, 3 females) or a high fat diet (HttQ111/+ N = 4: 2 males, 2 females; Htt+/+ N = 6: 3 males, 3 females). A. Summarized results of 2-way ANOVA at each coordinate. Genotype (gt), diet and gt x diet interaction p-values are represented. White boxes indicate coordinates where statistical analyses were not performed due to the availability of measurements from <3 mice of any one condition. B. Tukey box-and-whisker plots showing examples of cortical thickness measurements taken at either 3000 μm (a-f) or 6000 μm (g-i). The approximate regions of the cortex to which the coordinates map are indicated. Note that in some sections, measurements could not be accurately determined, resulting in a lower “N” at some coordinates. Significant 2-way ANOVA genotype (gt) and diet effects are indicated (see also panel A).
Overall, our measurement of brain regional volumes and cortical thickness reveal small, region-specific effects, consistent with a subtle impact of the effect of the HttQ111 mutation and patterns of brain region susceptibility in patients.
High fat diet does not modify CAG instability
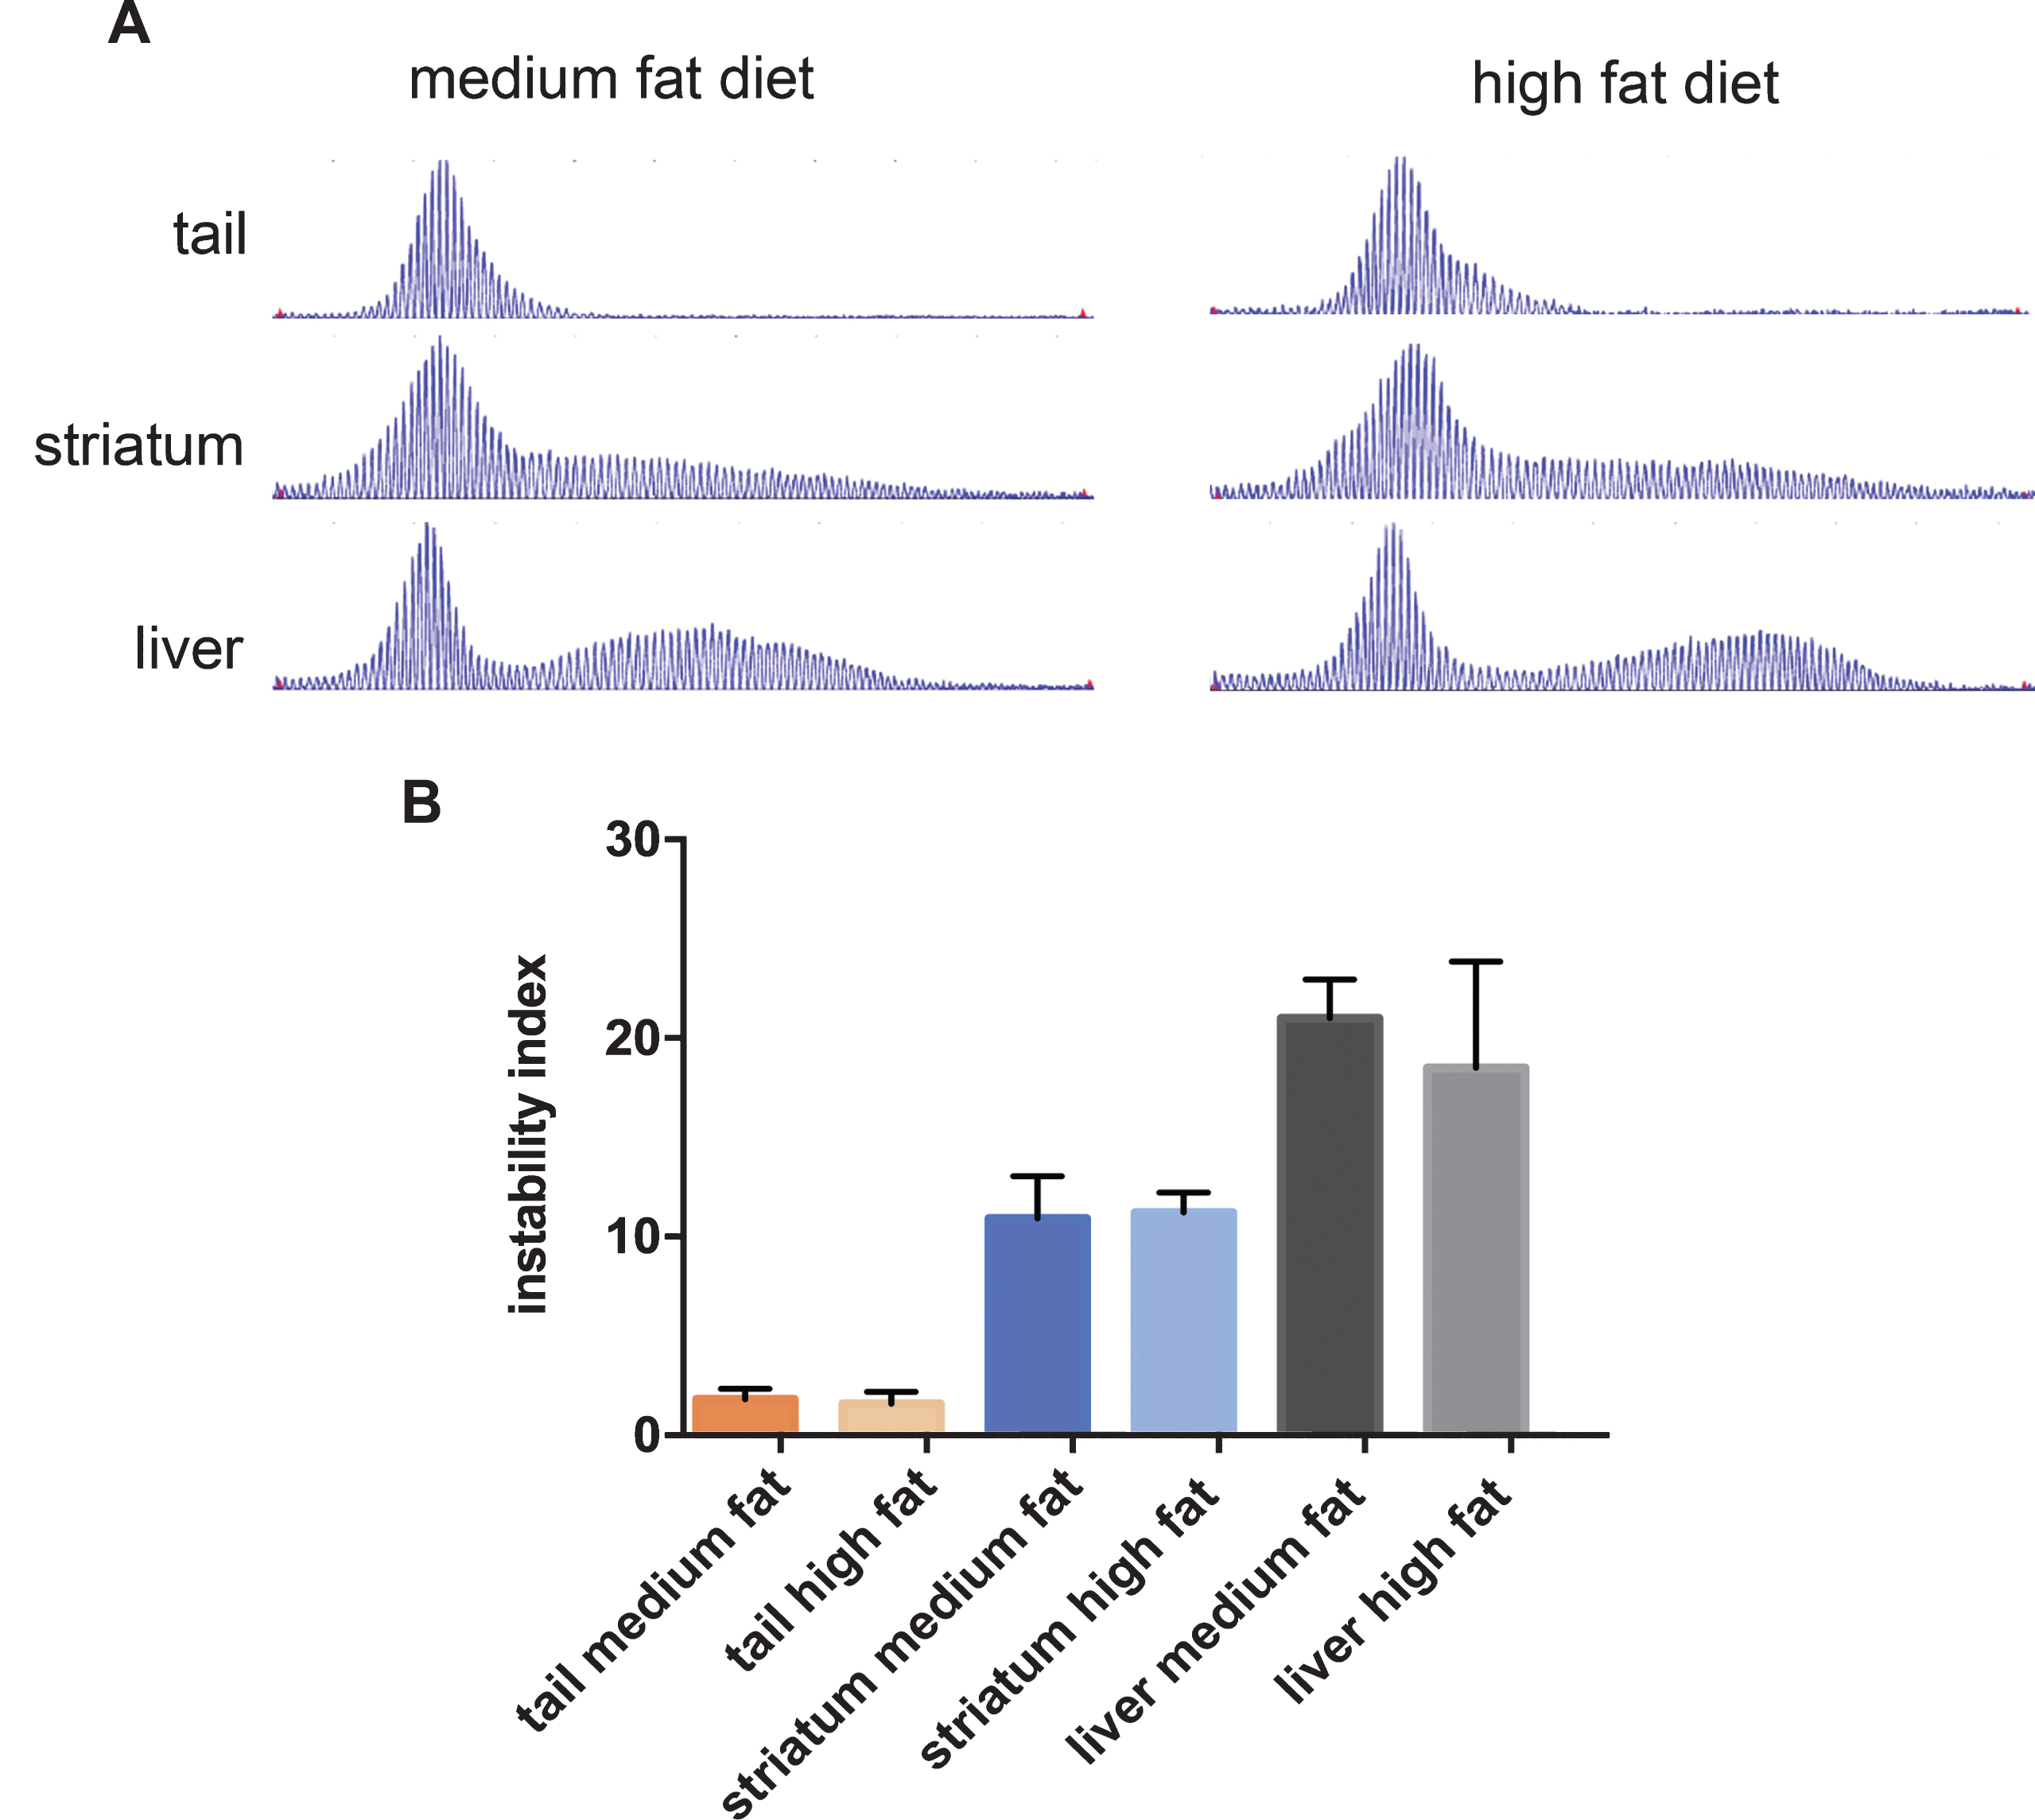
HttQ111 mice exhibit time-dependent somatic instability, with particularly high levels of expansion in the liver and striatum, correlating with cellular pathogenesis in the latter [21, 24, 39, 40]. With the goal of obtaining further insight into modifying factors we analyzed CAG instability in the liver and striata of the 10-month mice fed a high and medium fat diet, as well as in the tail that exhibits relatively high stability. Consistent with earlier studies, liver and striatal DNA showed extensive CAG expansion, with characteristic bimodal repeat length distributions (Fig. 4A). Somatic expansion was also apparent in tail DNA in these 10-month mice as shown by broadened repeat length distributions. We found that diet had no major impact on the CAG repeat length profiles in these tissues (Fig. 4A). Quantification of the instability levels from the GeneMapper traces (Fig. 4B) also revealed no significant diet-dependent differences (t-tests high fat vs. medium fat: tail p = 0.57; striatum p = 0.80; liver p = 0.31). These results indicate that cellular perturbations induced by a high fat diet [41] do not have a major impact on the underlying mechanisms that drive expansion-biased CAG instability in tissues.
Fig.4
The effect of diet on CAG instability in tissues from HttQ111 mice. A. Representative GeneMapper traces of HttQ111 CAG repeats from tail, striatum and liver of an HttQ111/+ mouse on a medium fat or high fat diet at 10 months of age. B. Instability indices were calculated from the GeneMapper traces from tissues of 5 medium fat-fed HttQ111/+ mice (CAGs: 127, 127, 129, 131, 133) and 4 high fat-fed HttQ111/+ mice (CAGs: 129, 129, 130, 132). Bars represent mean+/-SD.
HttQ111/+ mice exhibit ultrastructural abnormalities in striatal synapses
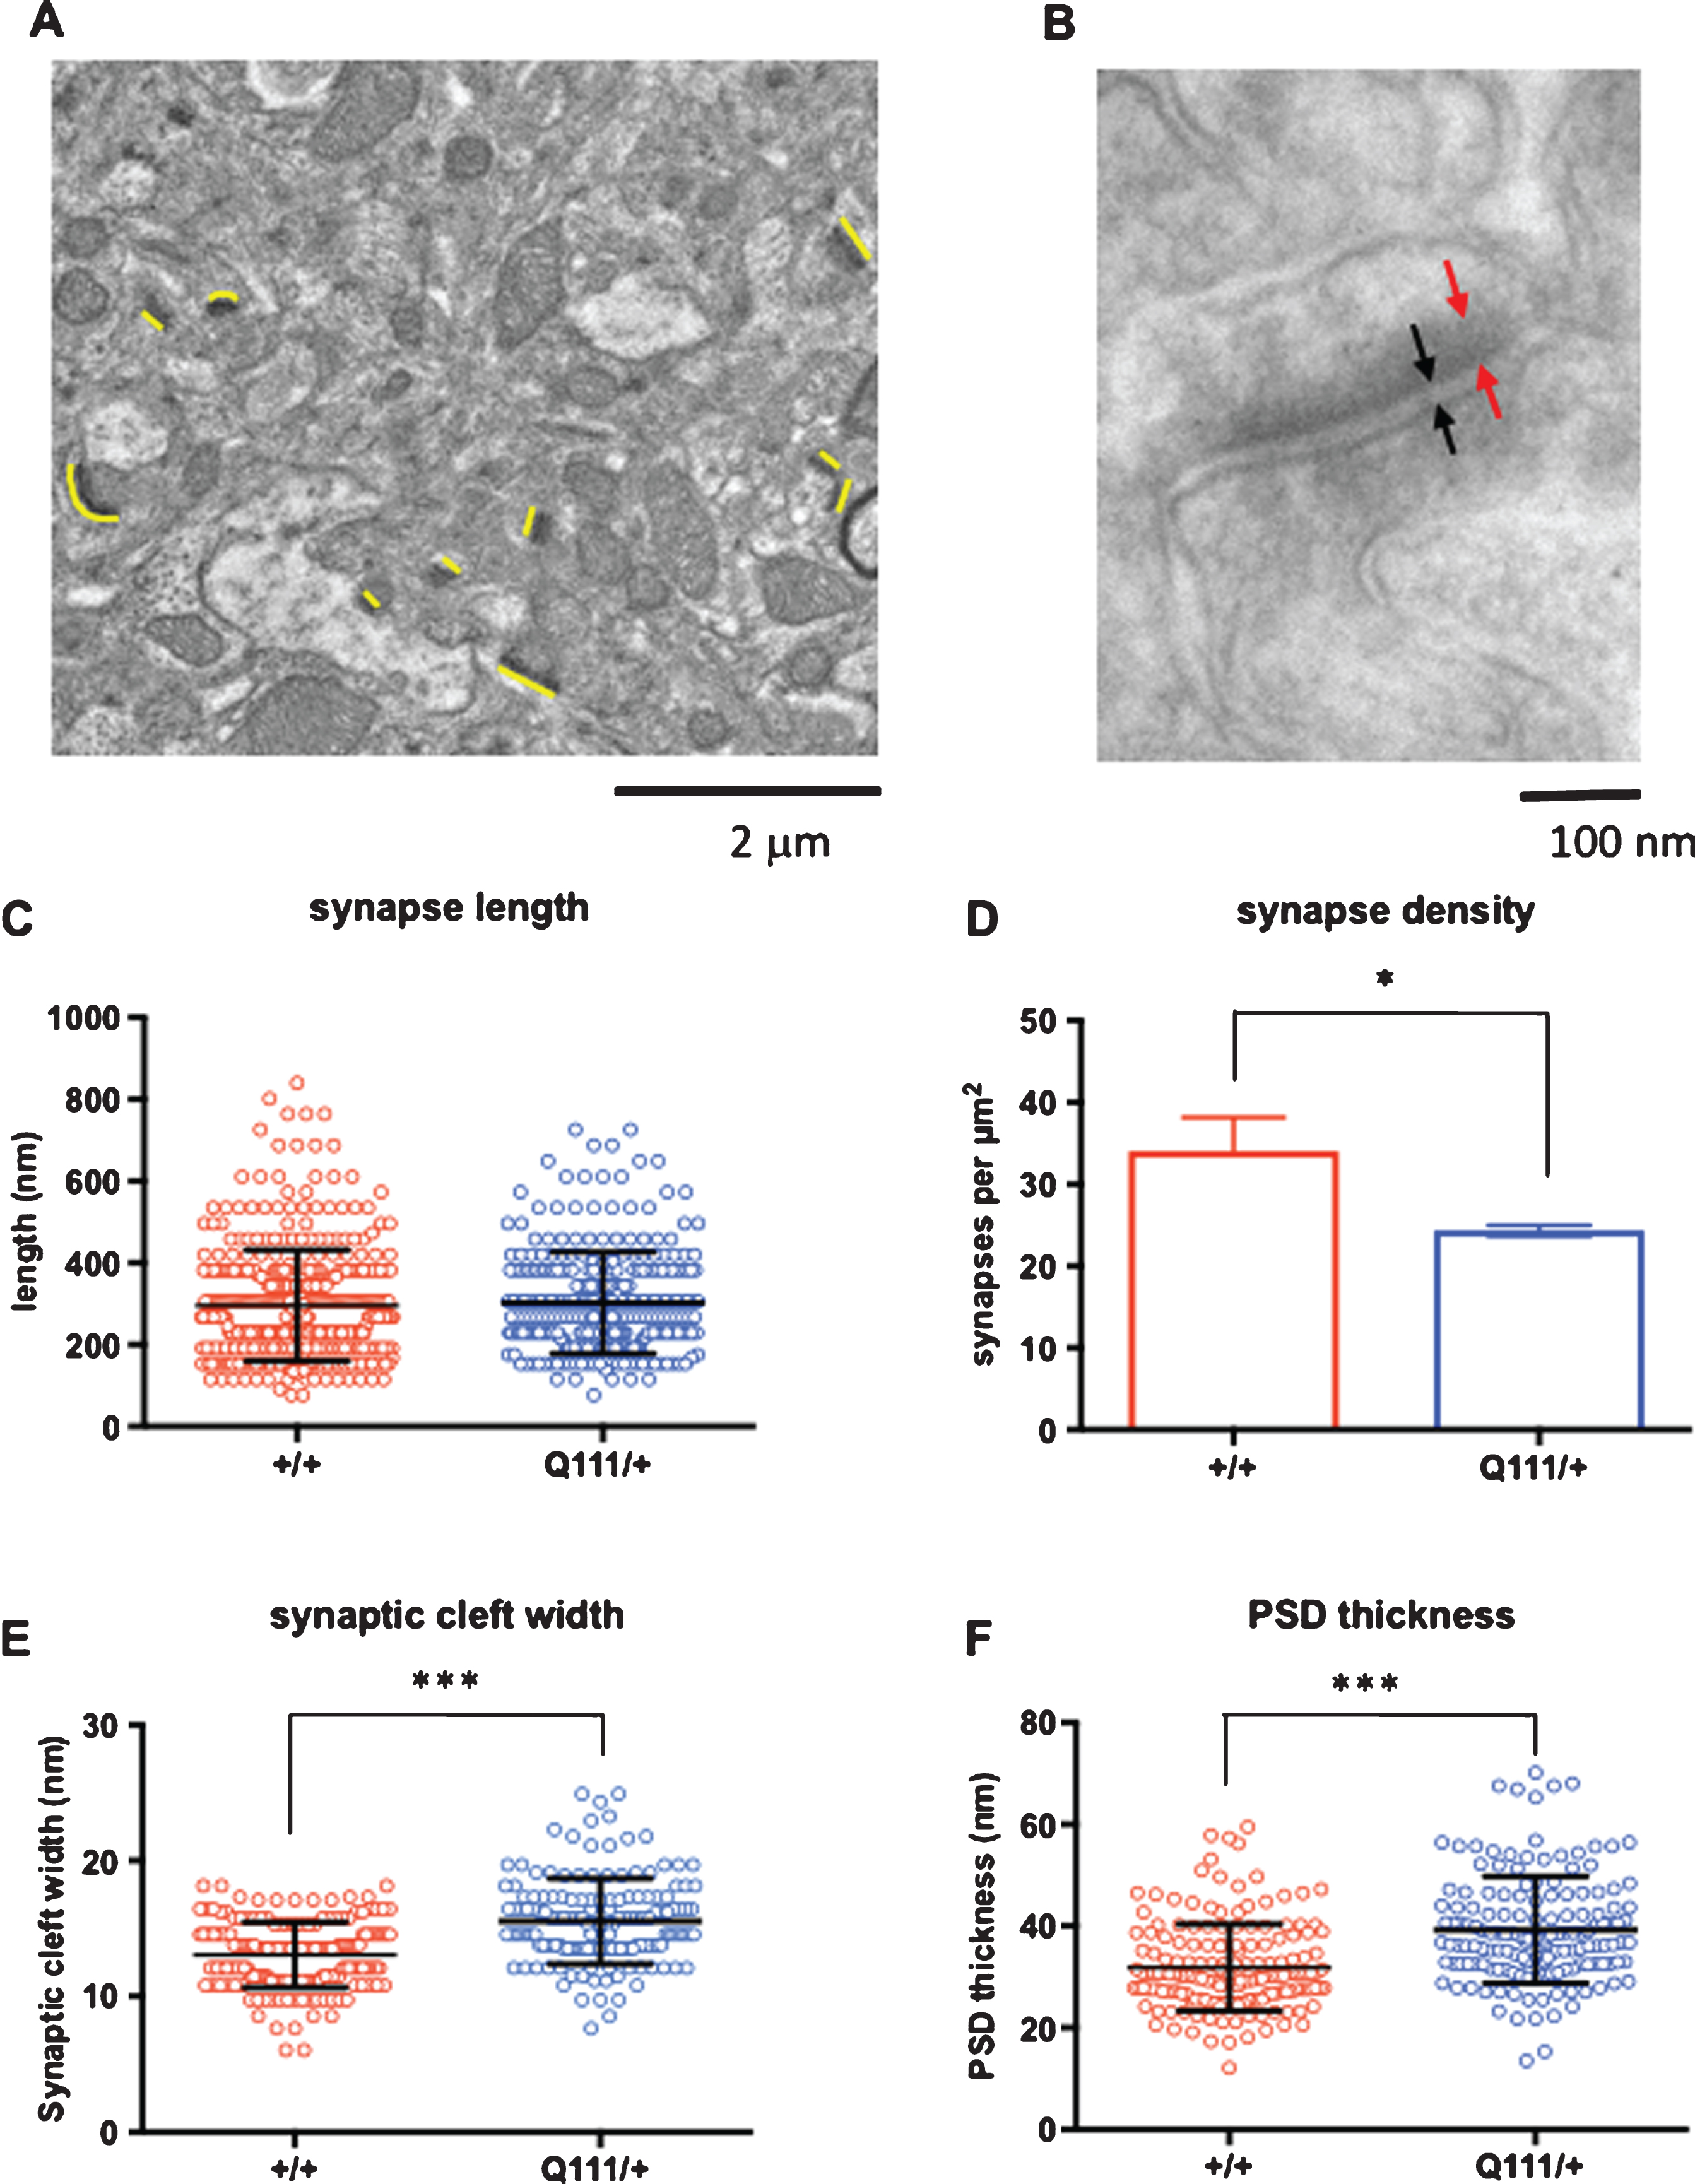
Given the subtle manifestations of a single HttQ111 allele we sought to determine whether HttQ111/+ mice exhibited any ultrastructural changes consistent with neurological dysfunction. We thus performed electron microscopy (EM) imaging of 18-month HttQ111/+ and wild-type striata from an independent cohort of mice, and performed quantitative analyses of synapses (Fig. 5). In analyses of low magnification images (Fig. 5A) we did not observe any genotype difference in synapse length (Fig. 5C), however synapse density was significantly reduced in HttQ111/+ striata compared to wild-type striata (2-tailed unpaired t-test p = 0.016) (Fig. 5D). In analyses of high magnification images (Fig. 5B) HttQ111/+ striata were found to have an increased synaptic cleft width (Fig. 5E; 2-tailed unpaired t-test p < 0.001) and increased postsynaptic density (PSD) thickness (Fig. 5F; 2-tailed unpaired t-test p < 0.001). Alterations in synaptic density and architecture suggest that HttQ111/+ mice may exhibit deficits in synaptic transmission.
Fig.5
Electron microscopic analyses of striatal synapses. Quantitative analyses of striatal asymmetric synapses were performed using electron microscopy (EM) imaging of 18-month HdhQ111/+ and wild-type striata (N = 3 mice per genotype). A. Low magnification (10,000x) images were used to quantify synaptic density and the length of the synapses. The synapses are narrow electron-dense regions indicated with thin yellow lines of approximately the same length that are positioned next to the synapses and oriented in the same direction. B. High magnification (100,000x) images were used to quantify synaptic cleft width (black arrows) and post-synaptic density (PSD) thickness (red arrows). C. Lengths of a total of 408 synapses in Htt+/+ mice and 292 synapses in HttQ111/+ mice were measured. D. Synapse density was determined by counting the number of synapses in four 15.8 μm×15.8 μm (250 μm2) images per mouse. E. Synaptic cleft width was measured in 180 Htt+/+ synapses and 143 HttQ111/+ synapses. F. PSD thickness was measured in 171 Htt+/+ synapses and 151 HttQ111/+ synapses. A single outlier PSD width measurement of 122.5 nm in a HttQ111/+ mouse is not represented in the figure and was removed from the analyses. *p < 0.05 (comparison of means of measurements averaged per genotype); ***p < 0.001 (comparison of means of all measurements). Error bars show S.D.
HttQ111/+ mice exhibit early striatal glutamatergic electrophysiological abnormalities.
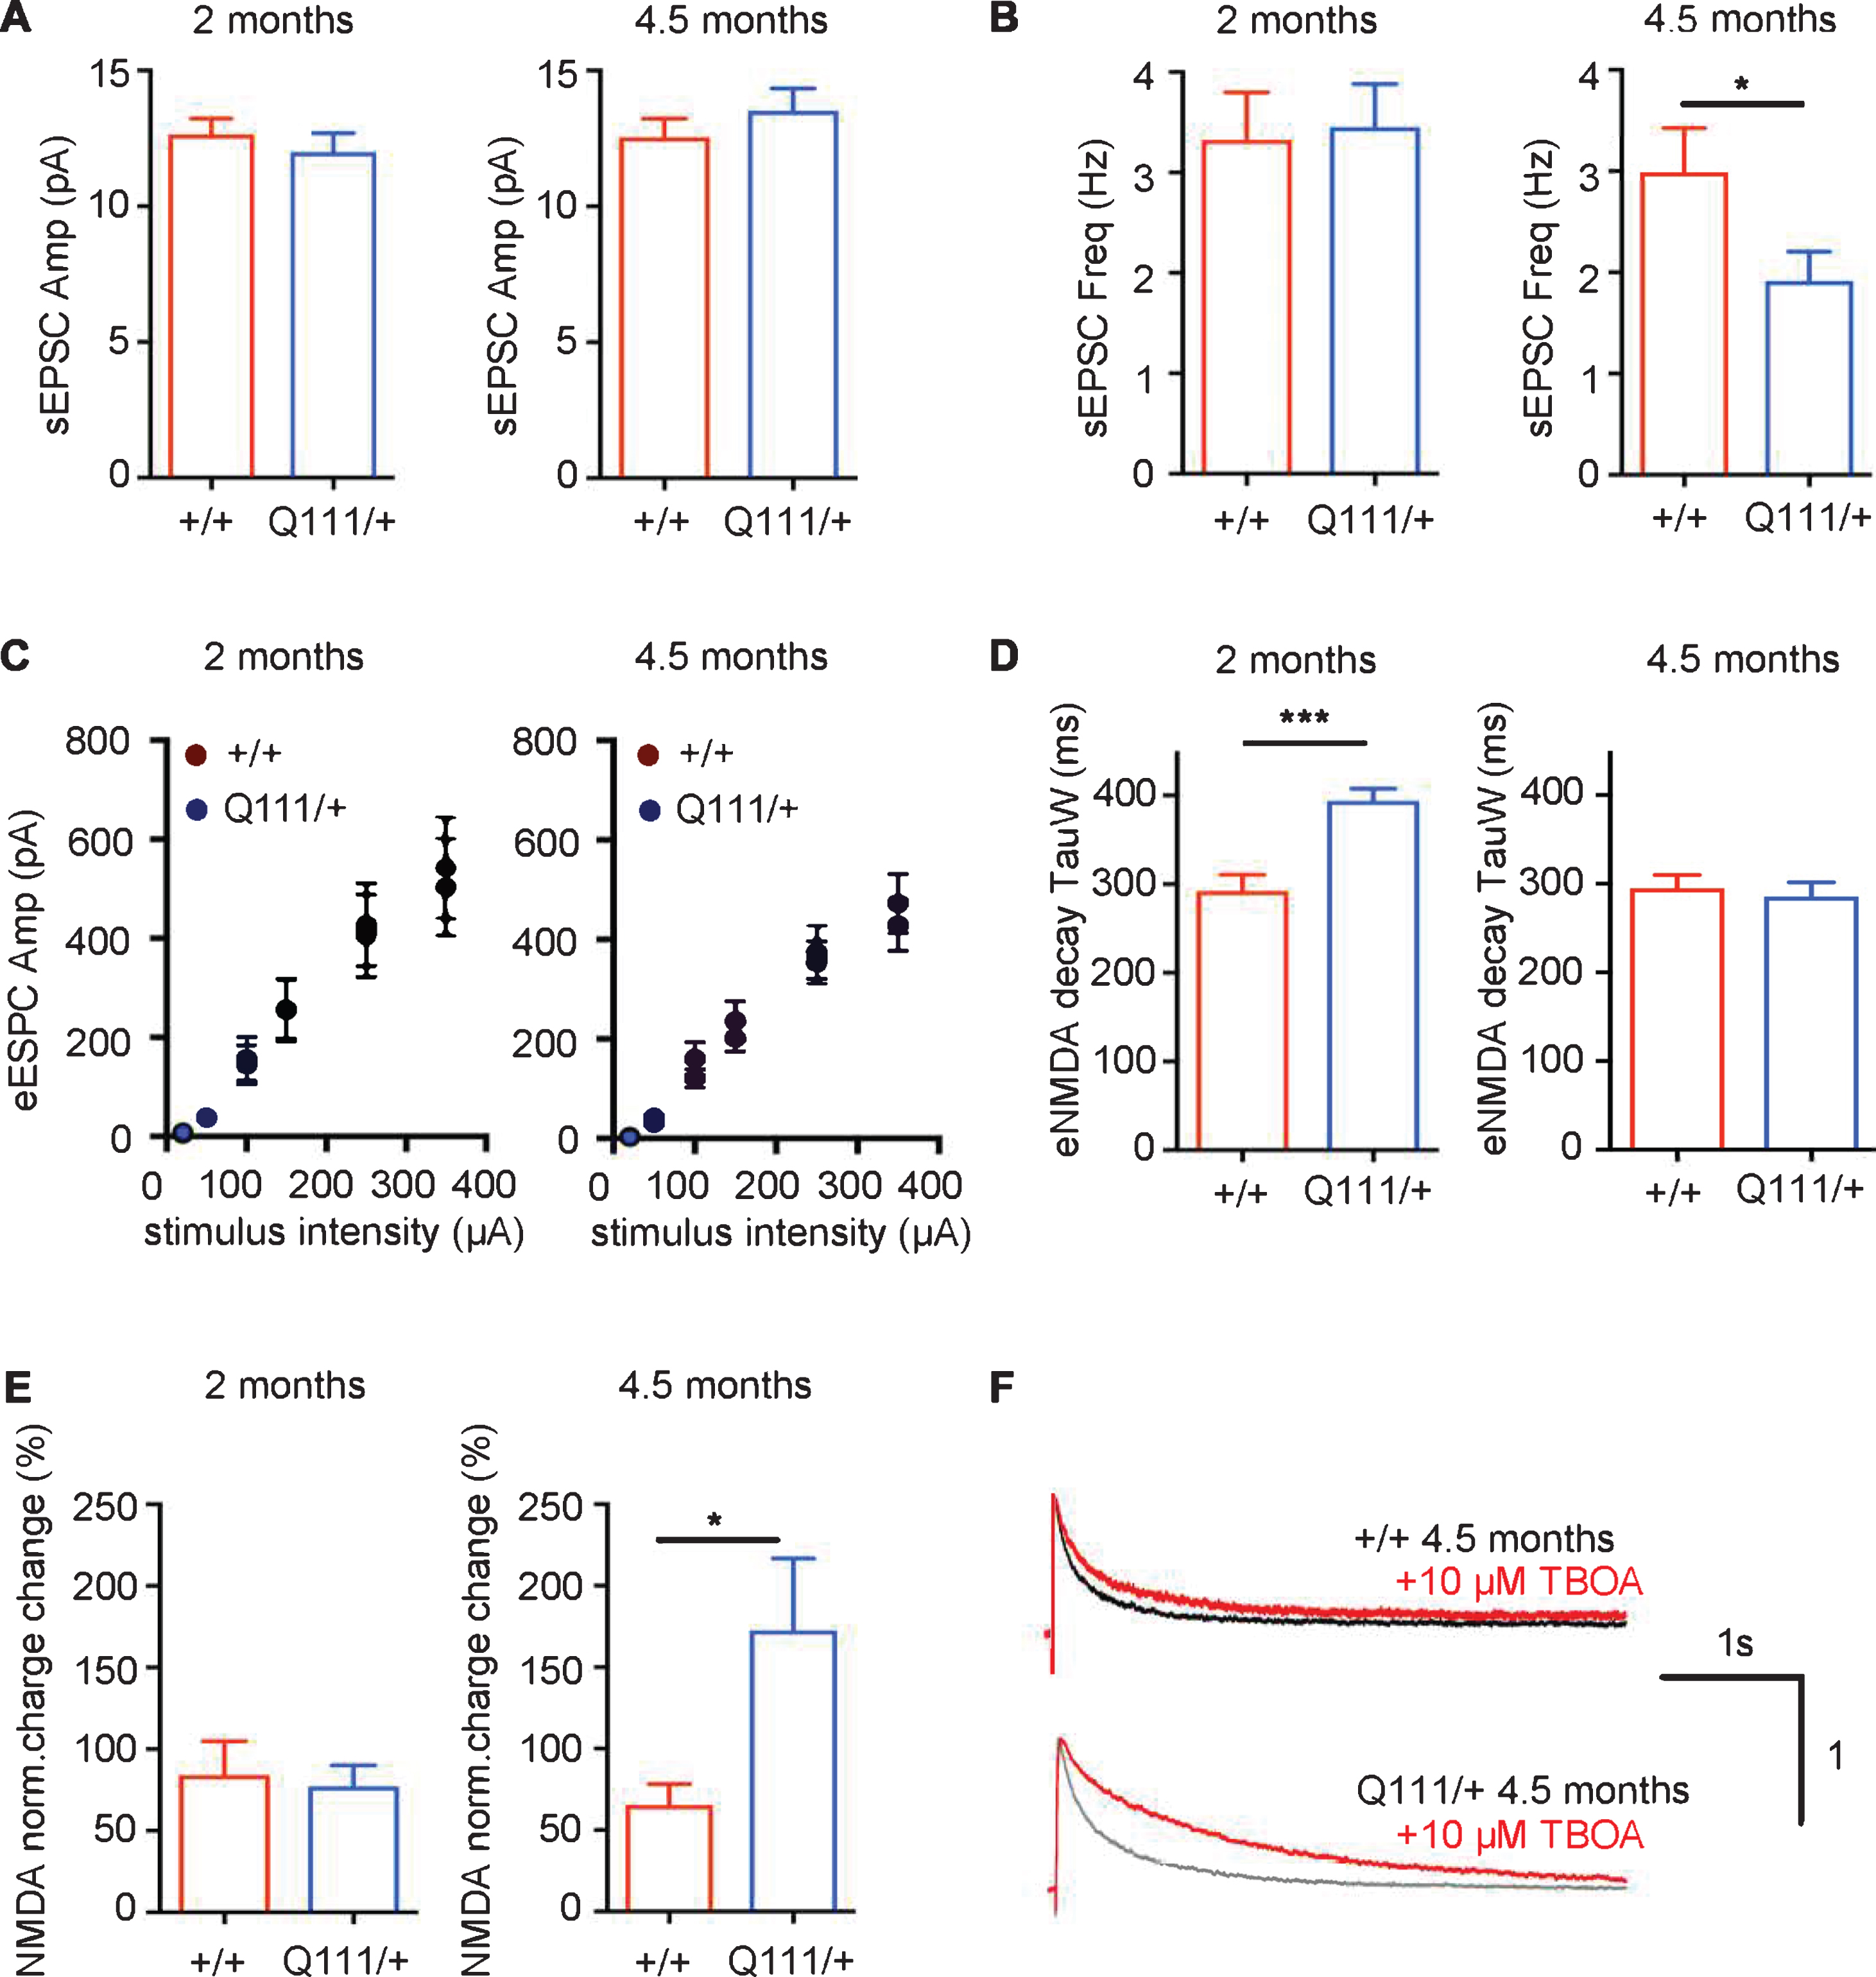
The above histological and ultrastructural observations suggest that HttQ111/+ mice would exhibit functional deficits in striatal neurons. Previous findings have shown that DARPP-32, a protein that controls many properties of medium-spiny neurons (MSNs), is already decreased at 6 months of age in HttQ111/+ mice [19, 34]. Therefore, to explore a potential functional deficit at the level of the MSN, we performed acute slice electrophysiology in HttQ111/+ and Htt+/+ littermates at 2 months and 4.5 months of age to probe for very early alterations in glutamatergic transmission from striatal input nuclei (cortex and thalamus) to the MSNs (Fig. 6). Analyses of spontaneous, AMPA receptor-mediated excitatory postsynaptic currents (sEPSCs) revealed no alterations in current amplitude at either age (Fig. 6A), indicating that the number of postsynaptic AMPA receptors and quantal charge is likely unchanged in HttQ111/+ mice. At 4.5 months of age we observed a slightly decreased sEPSC frequency in HttQ111/+ mice (Fig. 6B) (2-tailed unpaired t-test, p < 0.05), suggesting a decrease in synapse number and/or reduced release probability. Measurements of evoked, NMDA receptor-mediated excitatory postsynaptic currents (NMDAR eEPSCs) revealed no change in current amplitude (Fig. 6C), indicating normal numbers of NMDA receptors in HttQ111/+ mice. However, eEPSC decay was increased in 2 month HttQ111/+ mice (Fig. 6D) (2-tailed unpaired t-test, p < 0.001), suggesting possible alterations in NMDA receptor subunit composition, which determines channel-open time, as reflected by slower decay kinetics [42]. Interestingly, this was not observed in 4.5-month mice, suggesting altered maturation / development in mutants, or some other dynamic change that may be further revealed by future investigations of older mice. NMDAR eEPSCs were also measured in the presence of TBOA, which specifically blocks glutamate uptake, resulting in activation of extrasynaptic NMDA receptors. The magnitude of this “TBOA effect” is expressed as the percentage of the total NMDA receptor-mediated charge in the presence of TBOA relative to that in the absence of TBOA. We observed a significantly enhanced TBOA effect in 4.5-month HttQ111/+ mice (Fig. 6E, F) (2-tailed unpaired t-test p < 0.05), suggestive of elevated extrasynaptic NMDAR current by this age. Overall, the data demonstrate a very early effect of a single HttQ111 allele on functional properties of striatal glutamatergic synapses, indicative of possible changes in development, and a latter reduction in synapse connectivity and an increase in extrasynaptic cell-death signaling NMDARs.
Fig.6
The HttQ111 mutation alters electrophysiological properties of glutamatergic striatal synapses. Whole-cell patch-clamp recordings were conducted in striatal MSNs of the dorsal striatum within acute coronal slices from Htt+/+ and HttQ111/+ mice. A, B. Spontaneous AMPA receptor-mediated excitatory post-synaptic currents (sEPSCs). sEPSC amplitude (A) was unaffected by genotype in slices from ∼2 month mice (N = 10 Htt+/+ and 10 HttQ111/+) and 4.5-month mice (N = 26 Htt+/+ and 12 HttQ111/+). In the same cells, sEPSC frequency (B), while equivalent at 2 months, was significantly reduced in slices from 4.5-month mutant mice (*p < 0.05, 2-tailed unpaired t-test with Welch’s correction, due to significantly different variances by F test, F = 4.7, p < 0.01). Note that this may be exaggerated by high variation in sEPSC frequency in the WT group. C, D. Evoked NMDA receptor-mediated excitatory post-synaptic currents (eEPSCs) recorded at +40 mV. C. There were no genotype effects on NMDAR eEPSC amplitude with increasing stimulus intensity at 2 months (N = 8 Htt+/+ and 9 HttQ111/+) or 4.5 months (N = 23 Htt+/+ and 17 HttQ111/+). D. Weighted decay time constants (TauW) were slower in mutant NMDAR eEPSCs than wild-type controls at 2 months (8 Htt+/+ and 9 HttQ111/+; 2-tailed unpaired t-test ***p < 0.001) but were similar at 4.5 months (24 Htt+/+ and 27 HttQ111/+). E, F. Extrasynaptic NMDAR currents were quantified by assaying NMDAR eEPSCs before and during glutamate transporter blockade (10uM DL-TBOA). E. There was no difference in total charge transfer (% change in the presence of TBOA) at 2 months (N = 6 Htt+/+ and 6 HttQ111/+), but mutant extrasynaptic NMDAR currents were significantly enhanced at 4.5 months (N = 9 Htt+/+ and 15 HttQ111/+; *p = 0.03, 2-tailed unpaired t-test with Welch’s correction, due to significantly different variances by F test, F = 19.4, p < 0.001). F. Examples of NMDA receptor-mediated currents in Htt+/+ and HttQ111/+ MSNs at 4.5 months of age in the presence and absence of TBOA. Current amplitude is normalized to 1 on the y-axis. The total charge transfer is the area under the decay curve (black/grey in the absence of TBOA and red in the presence of TBOA). N refers to the number of MSNs. Error bars show SEM.
DISCUSSION
To gain detailed insight into the effects of the HTT CAG mutation in an accurate genetic mouse model of HD we have performed histological, EM and electrophysiological analyses in heterozygous B6J.HttQ111/+ knock-in mice. Table 1 shows a summary of the major findings. Our results demonstrate that up to 18 months of age, a single expanded Htt CAG allele does not induce any major neurodegeneration or gliosis, but is sufficient to drive subtle morphological changes in the brain as well as synaptic deficits that are consistent with striatal and cortical brain regional susceptibility in HD patients. These data, which confirm our recently published histopathological analyses in this line [19], strongly support the prevailing notion that neuronal dysfunction long precedes frank neurodegeneration, with altered cortico-striatal synaptic transmission within 4-5 months of age indicating very early functional impacts of the HttQ111 mutation. Notably, B6J.HttQ111/+ mice exhibit extensive transcriptional dysregulation in the striatum. Altered transcriptional signatures can be identified from as early as 4–16 weeks of age [11], with massive alterations in gene expression occurring by 6 months of age [9, 19]. Importantly, the lack of any major neurodegenerative phenotypes by 18 months indicates that these transcriptional changes do not reflect an altered cellular composition of the striatum but likely reflect dysregulated processes that both drive and respond to cellular pathogenesis.
Table 1
Summary of phenotypes identified in B6J.HttQ111 mice
| Age (months) | Phenotype |
| 2.0 | Increased eEPSC decay time |
| 4.5 | Decreased sEPSC frequency |
| Increased TBOA effect | |
| 10 | Decreased DARPP-32 |
| Decreased volume of striatum, caudate-putamen and cerebrum | |
| Decreased regional cortical thickness | |
| 18 | Decreased DARPP-32 |
| Decreased synapse density | |
| Increased synaptic cleft width | |
| Increased postsynaptic density thickness |
While there is no obvious neuronal cell loss in B6J.HttQ111/+ mice (this study and [19]) we did observe subtle reductions in the volume of the striatum, caudate-putamen and cerebrum, consistent with regional brain volume decreases in premanifest HTT mutation carriers [36–38]. We did not observe an increase in the volume of the cingulate cortex, as previously found in premanifest HD individuals [35, 43]. While the HttQ111 mutation did not impact cortical volume as a whole, HttQ111/+ mice were found to exhibit region-specific cortical thinning, with primary motor, somatosensory and visual cortex most affected. This aligns well with patterns of cortical thinning in patients, particularly in premanifest individuals where posterior and superior cerebral regions appear mostly affected [35, 43–45]. It has been proposed that cellular dysmorphology as well as dendritic and axonal loss contribute to cortical thinning in premanifest HTT mutation carriers [44]; indeed, dendritic alterations have been observed both in human brain and in HD mouse models [46–48]. Thus, in the absence of frank neurodegeneration, structural changes, supported by reduced synaptic density that we observe in the striatum (Fig. 5), are likely to underlie the subtle regional atrophy and cortical thinning we observe in HttQ111/+ mice.
While we found significant effects of the HttQ111 allele on brain regional volumes and cortical thinning in our 10-month cohort of mice, effects were much less apparent in our 18-month cohort. Notably, the 10-month mice were fed either a medium (45%) or a high (60%) fat diet, in contrast to the 18-month mice that were fed regular chow with a much lower fat content (5%). Therefore, the more pronounced phenotypic changes at 10 months may be due to sensitizing effects of the higher fat diets. In support of this, cortical regions most sensitive to genotype in the 10-month cohort tended also to be sensitive to a medium versus a high fat diet (Fig. 3A). Alternatively, the lower number of mice in the 18-month cohort relative to the 10-month cohort may not have provided sufficient power to detect significant effects of genotype. It is also plausible that the brain structural alterations seen at 10 months are not progressive, but instead reflect developmental alterations, which have been proposed in HD [49, 50], with the impact of the mutation not exceeding that of the normal ageing process in older mice. Further studies would be needed to tease out the relative contributions of age and diet to the deficits in brain structure.
We incorporated the high fat/medium fat diet paradigm as an extension of an earlier study in which we found that this difference in % dietary fat influences the effect of the HttQ111 allele on cellular metabolism, with 11 out of 219 metabolites showing a diet x genotype interaction in the striatum [20]. It has also been found that a high fat diet can induce damage to the brain, with proposed mechanisms related to oxidative stress, insulin resistance, inflammation and changes to vascularization [41] and can accelerate pathogenesis in mouse models of Alzheimer’s disease and Parkinson’s disease [51, 52]. In the current study we did not find strong evidence for a genotype x diet interaction effect on DARPP-32, NeuN, GFAP and ferritin immunostaining phenotypes, on brain regional volume or cortical thickness or on CAG instability. We did observe a small decrease in the fraction of GFAP-positive area in striatal sections in HttQ111/+ mice compared to WT mice on a high fat diet (Fig. S2). The significance of this finding is unclear, but suggests that the neuroprotective capacity of HttQ111 striatum in response to a high fat diet may be compromised. Interestingly, astrocytes have a physiological role in response to high fat feeding [53], raising the suggestion that this may be altered in HttQ111 mice. These data suggest that processes associated with a high fat diet in the brain are not major drivers of pathogenesis in HttQ111 mice. However, given the relatively high levels of fat in both the medium and high fat diets, this may be worth further exploration in a paradigm that contrasts more extreme fat contents or other diets. Of interest in this context is the observation that a high fat diet in mice induced changes in the expression of Mlh1, a genetic modifier of both CAG instability and the HD pathogenic process [40, 55]. Further, a ketogenic diet (16/0/84% kcal from protein/carbohydrate/fat) ameliorated some phenotypes in R6/2 HD transgenic mice [56]. Overall, the results of our histopathological and brain structural analyses performed in both the high fat diet-treated mice and in aged mice highlight a subtle and slowly progressing pathogenic process driven by a single HttQ111 allele that is neither strongly manifest by 18 months of age, nor strongly modified by a diet as a metabolic stressor.
Our electrophysiological analyses demonstrate dysregulated cortico-/thalamo-striatal transmission in HttQ111/+ mice. We observe excitatory synaptic deficits between 2 and 4.5 months of age, supporting a previous finding that cortico-striatal long-term potentiation (LTP) was reduced at 2-3 months of age in the same (B6J.HttQ111/+) mouse model [48]. These findings add to a wealth of data across many mouse models of HD showing abnormal cortico-striatal electrophysiology, with some changes in synaptic function preceding overt behavioral deficits (summarized in [57–59]). In HttQ111/+ mice the earliest electrophysiological changes also precede a number of robust behavioral phenotypes [15–19]. Notably, however, a phenotypic signature obtained from sensitive high-throughput behavioral phenotyping across an allelic series of Htt CAG knock-in mice provided evidence for a behavioral deficit in HttQ111/+ mice as early as 2 months of age, approximately co-incident with neurophysiological deficits [10]. The behavioral deficit is not revealed as a single phenotypic endpoint but as a combination of multiple behavioral features. Together, data demonstrate that a single HttQ111 allele is sufficient to induce both very early neurophysiological and behavioral deficits, and that further studies employing sensitive techniques are needed to tease out their relative timing.
HttQ111/+ mice exhibited decreased sEPSC frequency at 4.5 months of age, consistent with reduced glutamatergic striatal synaptic activity observed in many other HD mouse models including R6/2, YAC128, BACHD and Q175 [58, 60, 61]. We did not find any alteration in sEPSC frequency at 2 months of age, indicating the absence of an obvious biphasic change in glutamatergic transmission in HttQ111/+ mice, in which early increases in spontaneous excitatory striatal synaptic currents have been found to precede a later reduction in synaptic activity in some HD mouse models [58, 62–64]. It is plausible, however, that increased synaptic activity might be observed at an even earlier age in HttQ111/+ mice.
Decreased sEPSC frequency at 4.5 months of age, in the absence of any changes in current amplitude indicates either reduced synapse number or reduced release probability without alterations to AMPA receptor subunits. While our EM data show reduced synaptic density in 18-month mice, EM analyses of striatal synapses in young mice would need to be performed to correlate the electrophysiogical deficits with potential striatal synaptic structural deficits. However, we note that HttQ111 striata do not exhibit an obvious decrease in synapse number from 3–12 months of age, as determined by synaptophysin immunohistochemistry [19]. Although more sensitive EM analyses in younger mice could reveal subtle synapse loss, presynaptic alterations that decrease the probability of glutamate release may more likely underlie the reduced sEPSC frequency in HttQ111/+ mice. Notably, huntingtin binds to presynaptic proteins [65], and levels of presynaptic proteins involved in synaptic vesicle mobilization and release were altered in HttQ140/Q140 mice [66]. Thus, altered levels or binding of presynaptic proteins to mutant huntingtin seem likely to contribute to this synaptic signaling deficit in HttQ111/+ mice.
The slowed decay of NMDA receptor-mediated synaptic currents and the increased extrasynaptic NMDA receptor activity in HttQ111/+ mice are both consistent with an alteration in development and mature composition/distribution of NMDA receptor subunits in medium-spiny neurons. NMDA receptor decay kinetics are dependent on the subtype both of GluN1 and GluN2 subunits [42], suggesting that NMDA receptor subunit composition is altered by the HttQ111 allele. Extrasynaptic NMDA receptors are enriched for the GluN2B subunit [22], and it has been shown that extrasynaptic NMDA receptor-mediated currents in YAC128 mice are GluN2B-dependent and associated with mislocalization of GluN2B from a PSD fraction to a non-PSD fraction [31], where their interaction with PSD-95, a protein responsible for anchoring NMDA receptors to the membrane, is altered [31, 67]. Postsynaptic changes in HttQ111/+ striata are also indicated by changes in PSD thickness and synaptic cleft width, suggesting that remodeling of the postsynaptic membrane, potentially as a result of altered postsynaptic membrane proteins [66, 68], may contribute to synaptic dysfunction. While biochemical studies will facilitate dissection of the molecular underpinnings of the electrophysiological deficits in HttQ111/+ mice, it is notable that early transcriptional alterations in HttQ111/+ mice are enriched for biological processes associated with synaptic transmission [9, 11, 19].
Overall, our findings add to and support the growing body of evidence demonstrating widespread phenotypic alterations, at the behavioral, functional, structural and molecular levels, driven by a single mutant allele in the HttQ111 knock-in mouse, detected as early as the first few months of life. This highlights a subtle and insidious disease process and the need to understand the molecular mechanisms most proximal to the HTT CAG repeat expansion in order to meaningfully impact the disease course.
CONFLICT OF INTEREST
The authors have no conflict of interest to report.
ACKNOWLEDGMENTS
This work was supported by NIH grant NS049206 (VCW), a contract from the CHDI foundation (VCW, MEM, JML), a Canadian Institutes of Health Research grant MOP-12699 (LAR) and a CIHR fellowship (AJM). The Philly Dake Electron Microscope Facility is supported by funds provided to MD by the Dake Family Foundation and NIH/NINDS P30NS045776.
SUPPLEMENTARY MATERIAL
[1] The supplementary information is available in the electronic version of this article: http://dx.doi.org/10.3233/JHD-170282.
REFERENCES
[1] | Harper PS . Huntington’s disease: A clinical, genetic and molecular model for polyglutamine repeat disorders. Philos Trans R Soc Lond B Biol Sci. (1999) ;354: (1386):957–61. |
[2] | Huntington’s disease collaborative research group. A novel gene containing a trinucleotide repeat that is expanded and unstable on Huntington’s disease chromosomes. Cell. (1993) ;72: (6):971–83. |
[3] | Lee JM , Ramos EM , Lee JH , Gillis T , Mysore JS , Hayden MR , et al. CAG repeat expansion in Huntington disease determines age at onset in a fully dominant fashion. Neurology. (2012) ;78: (10):690–5. |
[4] | Genetic modifiers of huntington’s disease consortium. Identification of genetic factors that modify clinical onset of huntington’s disease. Cell. (2015) ;162: (3):516–26. |
[5] | Vonsattel JP , Myers RH , Stevens TJ , Ferrante RJ , Bird ED , Richardson EP . Neuropathological classification of Huntington’s disease. J Neuropathol Exp Neurol. (1985) ;44: (6):559–77. |
[6] | van der Burg JM , Bjorkqvist M , Brundin P . Beyond the brain: Widespread pathology in Huntington’s disease. Lancet Neurol. (2009) ;8: (8):765–74. |
[7] | Chang R , Liu X , Li S , Li XJ . Transgenic animal models for study of the pathogenesis of Huntington’s disease and therapy. Drug Des Devel Ther. (2015) ;9: :2179–88. |
[8] | Menalled LB . Knock-in mouse models of Huntington’s disease. NeuroRx. (2005) ;2: (3):465–70. |
[9] | Langfelder P , Cantle JP , Chatzopoulou D , Wang N , Gao F , Al-Ramahi I , et al. Integrated genomics and proteomics define huntingtin CAG length-dependent networks in mice. Nat Neurosci. (2016) ;19: (4):623–33. |
[10] | Alexandrov V , Brunner D , Menalled LB , Kudwa A , Watson-Johnson J , Mazzella M , et al. Large-scale phenome analysis defines a behavioral signature for Huntington’s disease genotype in mice. Nat Biotechnol. (2016) ;34: (8):838–44. |
[11] | Ament SA , Pearl JR , Grindeland A , St Claire J , Earls JC , Kovalenko M , et al. High resolution time-course mapping of early transcriptomic, molecular and cellular phenotypes in Huntington’s disease CAG knock-in mice across multiple genetic backgrounds. Hum Mol Genet. (2017) ;26: (5):913–22. |
[12] | Wheeler VC , White JK , Gutekunst CA , Vrbanac V , Weaver M , Li XJ , et al. Long glutamine tracts cause nuclear localization of a novel form of huntingtin in medium spiny striatal neurons in HdhQ92 and HdhQ111 knock-in mice. Human Molecular Genetics. (2000) ;9: (4):503–13. |
[13] | Wheeler VC , Gutekunst CA , Vrbanac V , Lebel LA , Schilling G , Hersch S , et al. Early phenotypes that presage late-onset neurodegenerative disease allow testing of modifiers in Hdh CAG knock-in mice. Hum Mol Genet. (2002) ;11: (6):633–40. |
[14] | Lloret A , Dragileva E , Teed A , Espinola J , Fossale E , Gillis T , et al. Genetic background modifies nuclear mutant huntingtin accumulation and HD CAG repeat instability in Huntington’s disease knock-in mice. Hum Mol Genet. (2006) ;15: (12):2015–24. |
[15] | Giralt A , Puigdellivol M , Carreton O , Paoletti P , Valero J , Parra-Damas A , et al. Long-term memory deficits in Huntington’s disease are associated with reduced CBP histone acetylase activity. Hum Mol Genet. (2012) ;21: (6):1203–16. |
[16] | Holter SM , Stromberg M , Kovalenko M , Garrett L , Glasl L , Lopez E , et al. A broad phenotypic screen identifies novel phenotypes driven by a single mutant allele in Huntington’s disease CAG knock-in mice. PLoS One. (2013) ;8: (11):e80923. |
[17] | Yhnell E , Dunnett SB , Brooks SP . A longitudinal motor characterisation of the HdhQ111 mouse model of huntington’s disease. J Huntingtons Dis. (2016) ;5: (2):149–61. |
[18] | Yhnell E , Dunnett SB , Brooks SP . A longitudinal operant assessment of cognitive and behavioural changes in the HdhQ111 mouse model of huntington’s disease. PLoS One. (2016) ;11: (10):e0164072. |
[19] | Bragg RM , Coffey SR , Weston RM , Ament SA , Cantle JP , Minnig S , et al. Motivational, proteostatic and transcriptional deficits precede synapse loss, gliosis and neurodegeneration in the B6.Htt(Q111/+) model of Huntington’s disease. Sci Rep. (2017) ;7: :41570. |
[20] | Carroll JB , Deik A , Fossale E , Weston RM , Guide JR , Arjomand J , et al. HdhQ111 mice exhibit tissue specific metabolite profiles that include striatal lipid accumulation. PLoS One. (2015) ;10: (8):e0134465. |
[21] | Lee JM , Zhang J , Su AI , Walker JR , Wiltshire T , Kang K , et al. A novel approach to investigate tissue-specific trinucleotide repeat instability. BMC Syst Biol. (2010) ;4: :29. |
[22] | Hardingham GE , Bading H . Synaptic versus extrasynaptic NMDA receptor signalling: Implications for neurodegenerative disorders. Nat Rev Neurosci. (2010) ;11: (10):682–96. |
[23] | Wheeler VC , Auerbach W , White JK , Srinidhi J , Auerbach A , Ryan A , et al. Length-dependent gametic CAG repeat instability in the Huntington’s disease knock-in mouse. Hum Mol Genet. (1999) ;8: (1):115–22. |
[24] | Lee JM , Pinto RM , Gillis T , St Claire JC , Wheeler VC . Quantification of age-dependent somatic CAG repeat instability in Hdh CAG knock-in mice reveals different expansion dynamics in striatum and liver. PLoS One. (2011) ;6: (8):e23647. |
[25] | Dragileva E , Hendricks A , Teed A , Gillis T , Lopez ET , Friedberg EC , et al. Intergenerational and striatal CAG repeat instability in Huntington’s disease knock-in mice involve different DNA repair genes. Neurobiol Dis. (2009) ;33: (1):37–47. |
[26] | Carpenter AE , Jones TR , Lamprecht MR , Clarke C , Kang IH , Friman O , et al. CellProfiler: Image analysis software for identifying and quantifying cell phenotypes. Genome Biol. (2006) ;7: (10):R100. |
[27] | Lamprecht MR , Sabatini DM , Carpenter AE . CellProfiler: Free, versatile software for automated biological image analysis. Biotechniques. (2007) ;42: (1):71–5. |
[28] | Hoff PR , Young W , Bloom F , Belichenko PV , Celio MR . Comparative Cytoarchitectonic Atlas of the C57/B6 and 129/Sv Mouse Brains. Amsterdam: Elsevier Science; (2005) . |
[29] | Peirce JL , Chesler EJ , Williams RW , Lu L . Genetic architecture of the mouse hippocampus: Identification of gene loci with selective regional effects. Genes Brain Behav. (2003) ;2: (4):238–52. |
[30] | Milnerwood AJ , Raymond LA . Corticostriatal synaptic function in mouse models of Huntington’s disease: Early effects of huntingtin repeat length and protein load. J Physiol. (2007) ;585: (Pt 3):817–31. |
[31] | Milnerwood AJ , Gladding CM , Pouladi MA , Kaufman AM , Hines RM , Boyd JD , et al. Early increase in extrasynaptic NMDA receptor signaling and expression contributes to phenotype onset in Huntington’s disease mice. Neuron. (2010) ;65: (2):178–90. |
[32] | Stocca G , Vicini S . Increased contribution of NR2A subunit to synaptic NMDA receptors in developing rat cortical neurons. J Physiol. (1998) ;507: (Pt 1):13–24. |
[33] | Simmons DA , Casale M , Alcon B , Pham N , Narayan N , Lynch G . Ferritin accumulation in dystrophic microglia is an early event in the development of Huntington’s disease. Glia. (2007) ;55: (10):1074–84. |
[34] | Ramos EM , Kovalenko M , Guide JR , St Claire J , Gillis T , Mysore JS , et al. Chromosome substitution strain assessment of a Huntington’s disease modifier locus. Mamm Genome. (2015) ;26: (3-4):119–30. |
[35] | Rosas HD , Hevelone ND , Zaleta AK , Greve DN , Salat DH , Fischl B . Regional cortical thinning in preclinical Huntington disease and its relationship to cognition. Neurology. (2005) ;65: (5):745–7. |
[36] | Aylward EH , Nopoulos PC , Ross CA , Langbehn DR , Pierson RK , Mills JA , et al. Longitudinal change in regional brain volumes in prodromal Huntington disease. J Neurol Neurosurg Psychiatry. (2011) ;82: (4):405–10. |
[37] | Tabrizi SJ , Langbehn DR , Leavitt BR , Roos RA , Durr A , Craufurd D , et al. Biological and clinical manifestations of Huntington’s disease in the longitudinal TRACK-HD study: Cross-sectional analysis of baseline data. Lancet Neurol. (2009) ;8: (9):791–801. |
[38] | Tabrizi SJ , Scahill RI , Durr A , Roos RA , Leavitt BR , Jones R , et al. Biological and clinical changes in premanifest and early stage Huntington’s disease in the TRACK-HD study: The 12-month longitudinal analysis. Lancet Neurol. (2011) ;10: (1):31–42. |
[39] | Kovalenko M , Dragileva E , St Claire J , Gillis T , Guide JR , New J , et al. Msh2 acts in medium-spiny striatal neurons as an enhancer of CAG instability and mutant huntingtin phenotypes in Huntington’s disease knock-in mice. PLoS One. (2012) ;7: (9):e44273. |
[40] | Pinto RM , Dragileva E , Kirby A , Lloret A , Lopez E , St Claire J , et al. Mismatch repair genes Mlh1 and Mlh3 modify CAG instability in Huntington’s disease mice: Genome-wide and candidate approaches. PLoS Genet. (2013) ;9: (10):e1003930. |
[41] | Freeman LR , Haley-Zitlin V , Rosenberger DS , Granholm AC . Damaging effects of a high-fat diet to the brain and cognition: A review of proposed mechanisms. Nutr Neurosci. (2014) ;17: (6):241–51. |
[42] | Paoletti P , Bellone C , Zhou Q . NMDA receptor subunit diversity: Impact on receptor properties, synaptic plasticity and disease. Nat Rev Neurosci. (2013) ;14: (6):383–400. |
[43] | Nopoulos PC , Aylward EH , Ross CA , Johnson HJ , Magnotta VA , Juhl AR , et al. Cerebral cortex structure in prodromal Huntington disease. Neurobiol Dis. (2010) ;40: (3):544–54. |
[44] | Rosas HD , Liu AK , Hersch S , Glessner M , Ferrante RJ , Salat DH , et al. Regional and progressive thinning of the cortical ribbon in Huntington’s disease. Neurology. (2002) ;58: (5):695–701. |
[45] | Wolf RC , Sambataro F , Vasic N , Baldas EM , Ratheiser I , Bernhard Landwehrmeyer G , et al. Visual system integrity and cognition in early Huntington’s disease. Eur J Neurosci. (2014) ;40: (2):2417–26. |
[46] | Graveland GA , Williams RS , DiFiglia M . Evidence for degenerative and regenerative changes in neostriatal spiny neurons in Huntington’s disease. Science. (1985) ;227: (4688):770–3. |
[47] | Klapstein GJ , Fisher RS , Zanjani H , Cepeda C , Jokel ES , Chesselet MF , et al. Electrophysiological and morphological changes in striatal spiny neurons in R6/2 Huntington’s disease transgenic mice. J Neurophysiol. (2001) ;86: (6):2667–77. |
[48] | Puigdellivol M , Cherubini M , Brito V , Giralt A , Suelves N , Ballesteros J , et al. A role for Kalirin-7 in corticostriatal synaptic dysfunction in Huntington’s disease. Hum Mol Genet. (2015) ;24: (25):7265–85. |
[49] | Nopoulos PC , Aylward EH , Ross CA , Mills JA , Langbehn DR , Johnson HJ , et al. Smaller intracranial volume in prodromal Huntington’s disease: Evidence for abnormal neurodevelopment. Brain. (2011) ;134: (Pt 1):137–42. |
[50] | Molero AE , Arteaga-Bracho EE , Chen CH , Gulinello M , Winchester ML , Pichamoorthy N , et al. Selective expression of mutant huntingtin during development recapitulates characteristic features of Huntington’s disease. Proc Natl Acad Sci U S A. (2016) ;113: (20):5736–41. |
[51] | Morris JK , Bomhoff GL , Stanford JA , Geiger PC . Neurodegeneration in an animal model of Parkinson’s disease is exacerbated by a high-fat diet. Am J Physiol Regul Integr Comp Physiol. (2010) ;299: (4):R1082–90. |
[52] | Ettcheto M , Petrov D , Pedros I , Alva N , Carbonell T , Beas-Zarate C , et al. Evaluation of neuropathological effects of a high-fat diet in a presymptomatic Alzheimer’s disease stage in APP/PS1 mice. J Alzheimers Dis. (2016) ;54: (1):233–51. |
[53] | Buckman LB , Thompson MM , Lippert RN , Blackwell TS , Yull FE , Ellacott KL . Evidence for a novel functional role of astrocytes in the acute homeostatic response to high-fat diet intake in mice. Mol Metab. (2015) ;4: (1):58–63. |
[54] | Remely M , Ferk F , Sterneder S , Setayesh T , Kepcija T , Roth S , et al. Vitamin E modifies high-fat diet-induced increase of DNA strand breaks, and changes in expression and DNA methylation of Dnmt1 and MLH1 in C57BL/6J male mice. Nutrients. (2017) ;9: (6). |
[55] | Lee JM , Chao MJ , Harold D , Abu Elneel K , Gillis T , Holmans P , et al. A modifier of Huntington’s disease onset at the MLH1 locus. Hum Mol Genet. (2017) ;26: (19):3859–67. |
[56] | Chen JY , Tran C , Hwang L , Deng G , Jung ME , Faull KF , et al. Partial amelioration of peripheral and central symptoms of huntington’s disease via modulation of lipid metabolism. J Huntingtons Dis. (2016) ;5: (1):65–81. |
[57] | Milnerwood AJ , Raymond LA . Early synaptic pathophysiology in neurodegeneration: Insights from Huntington’s disease. Trends Neurosci. (2010) ;33: (11):513–23. |
[58] | Raymond LA , Andre VM , Cepeda C , Gladding CM , Milnerwood AJ , Levine MS . Pathophysiology of Huntington’s disease: Time-dependent alterations in synaptic and receptor function. Neuroscience. (2011) ;198: :252–73. |
[59] | Plotkin JL , Surmeier DJ . Corticostriatal synaptic adaptations in Huntington’s disease. Curr Opin Neurobiol. (2015) ;33: :53–62. |
[60] | Heikkinen T , Lehtimaki K , Vartiainen N , Puolivali J , Hendricks SJ , Glaser JR , et al. Characterization of neurophysiological and behavioral changes, MRI brain volumetry and 1H MRS in zQ175 knock-in mouse model of Huntington’s disease. PLoS One. (2012) ;7: (12):e50717. |
[61] | Indersmitten T , Tran CH , Cepeda C , Levine MS . Altered excitatory and inhibitory inputs to striatal medium-sized spiny neurons and cortical pyramidal neurons in the Q175 mouse model of Huntington’s disease. J Neurophysiol. (2015) ;113: (7):2953–66. |
[62] | Cepeda C , Hurst RS , Calvert CR , Hernandez-Echeagaray E , Nguyen OK , Jocoy E , et al. Transient and progressive electrophysiological alterations in the corticostriatal pathway in a mouse model of Huntington’s disease. J Neurosci. (2003) ;23: (3):961–9. |
[63] | Andre VM , Cepeda C , Fisher YE , Huynh M , Bardakjian N , Singh S , et al. Differential electrophysiological changes in striatal output neurons in Huntington’s disease. J Neurosci. (2011) ;31: (4):1170–82. |
[64] | Joshi PR , Wu NP , Andre VM , Cummings DM , Cepeda C , Joyce JA , et al. Age-dependent alterations of corticostriatal activity in the YAC128 mouse model of Huntington disease. J Neurosci. (2009) ;29: (8):2414–27. |
[65] | Yao J , Ong SE , Bajjalieh S . Huntingtin is associated with cytomatrix proteins at the presynaptic terminal. Mol Cell Neurosci. (2014) ;63: :96–100. |
[66] | Valencia A , Sapp E , Kimm JS , McClory H , Ansong KA , Yohrling G , et al. Striatal synaptosomes from Hdh140Q/140Q knock-in mice have altered protein levels, novel sites of methionine oxidation, and excess glutamate release after stimulation. J Huntingtons Dis. (2013) ;2: (4):459–75. |
[67] | Fan J , Gladding CM , Wang L , Zhang LY , Kaufman AM , Milnerwood AJ , et al. P38 MAPK is involved in enhanced NMDA receptor-dependent excitotoxicity in YAC transgenic mouse model of Huntington disease. Neurobiol Dis. (2012) ;45: (3):999–1009. |
[68] | Torres-Peraza JF , Giralt A , Garcia-Martinez JM , Pedrosa E , Canals JM , Alberch J . Disruption of striatal glutamatergic transmission induced by mutant huntingtin involves remodeling of both postsynaptic density and NMDA receptor signaling. Neurobiol Dis. (2008) ;29: (3):409–21. |


