Autophagy Activation by Transcription Factor EB (TFEB) in Striatum of HDQ175/Q7 Mice
Abstract
Background: Mutant huntingtin (mHTT) is encoded by the Huntington’s disease (HD) gene and its accumulation in the brain contributes to HD pathogenesis. Reducing mHTT levels through activation of the autophagosome-lysosomal pathway may have therapeutic benefit. Transcription factor EB (TFEB) regulates lysosome biogenesis and autophagy.
Objective: To examine if increasing TFEB protein levels in HD mouse striatum induces autophagy and influences mHTT levels.
Methods: We introduced cDNA encoding TFEB with an HA tag (TFEB-HA) under the control of neuron specific synapsin 1 promoter into the striatum of 3 month old HDQ175/Q7 mice using adeno-associated virus AAV2/9. The levels of exogenous TFEB were analyzed using qPCR and Western blot. Proteins involved in autophagy, levels of huntingtin, and striatal-enriched proteins were examined using biochemical and/or immunohistochemical methods.
Results: In HD mice expressing TFEB-HA, HA immunoreactivity distributed throughout the striatum in neuronal cell bodies and processes and preferentially in neuronal nuclei and overlapped with a loss of DARPP32 immunoreactivity. TFEB-HA mRNA and protein were detected in striatal lysates. There were increased levels of proteins involved with autophagosome/lysosome activity including LAMP-2A, LC3II, and cathepsin D and reduced levels of mutant HTT and the striatal enriched proteins DARPP32 and PDE10A. Compared to WT mice, HDQ175/Q7 mice had elevated levels of the ER stress protein GRP78/BiP and with TFEB-HA expression, increased levels of the astrocyte marker GFAP and pro-caspase 3.
Conclusion: These results suggest that TFEB expression in the striatum of HDQ175/Q7 mice stimulates autophagy and lysosome activity, and lowers mHTT, but may also increase a neuronal stress response.
Introduction
Huntington’s disease (HD) is caused by a mutation in the gene encoding huntingtin (HTT) and results in the formation of a mutant huntingtin (mHTT) that contains an expanded polyglutamine tract. One strategy for therapy in HD is to reduce the levels of mHTT in the brain. Two main pathways involved in mHTT degradation are the autophagy and the ubiquitin-proteasome systems. Autophagy mediates the degradation of long-lived cytoplasmic proteins by targeting them to lysosomes [1–6] and is thought to be important for the clearance of disease proteins. We showed that immunoreactive HTT in the HD patient brain but not in control brain associates with punctate structures in the cytoplasm that by electron microscopy are multivesicular bodies, organelles involved in protein degradation in the autophagy/endosome/lysosomal pathways [7]. Autophagy has been implicated by us and others in HTT clearance [6, 8–12] because proteins involved in autophagy are activated or elevated by mHTT overexpression and HTT fragments are degraded by activators of autophagy. The lysosome is the final pathway of clearance from autophagic degradation. We showed in vitro that the presence of mHTT activates autophagy and increases levels of cathepsin D, an endosomal/lysosomal enzyme, and cathepsin L, a major protease of the lysosome [12].
Three main pathways of autophagy lead to the lysosome: macroautophagy, microautophagy, and chaperone-mediated autophagy [13]. Macroautophagy is the major pathway and involves first the formation of early autophagosomes that secondarily fuse with lysosomes. Some of the key proteins involved in macroautophagy include microtubule associated light chain 3 (LC3, mammalian ATG8) and Rab7. LC3 lipidates during early autophagosome formation by conjugation to phosphatidylethanolamine (LC3 I to LC3 II). This conjugation increases its molecular mass, but accelerates its migration on SDS-PAGE [14]. Increased levels of LC3 II were observed in the brain of HD knock-in Q200 heterozygous mice as early as 9 weeks of age [15]. Rab7 is involved in later stages of macroautophagy, namely fusion of late autophagosomes and endosomes with lysosomes [16, 17]. Chaperone mediated autophagy uses a specific subset of cytosolic proteins with a motif recognized by the heat-shock cognate chaperone 70 kDa protein HSC70 [18, 19]. The chaperone-substrate complex binds to a lysosomal membrane receptor, lysosome-associated membrane protein 2A (LAMP-2A) [20] and the chaperone mediated autophagy substrate proteins translocate into the lumen of the lysosome where they are degraded by hydrolases [21].
Transcription factor EB (TFEB) is a master regulator of lysosome biogenesis and also drives autophagosome formation [22]. TFEB can influence the clearance of proteins involved in neurodegeneration. In mouse models of Alzheimer’s disease, TFEB expression activated lysosomal activity and reduced neurofibrillary tangles and improved behavior and synaptic neuronal measures [23]. TFEB expression in astrocytes reduced amyloid beta load by targeting the protein for degradation in lysosomes [24]. In a cell model of Parkinson’s disease, TFEB expression reduced the levels of alpha-synuclein aggregation through activation of autophagy [25]. TFEB expression reduced levels of mHTT protein in a cell model of Huntington’s disease [22] and Tsunemi et al. implicated TFEB as an effector of PGC-1α activation in clearing mHTT aggregates in N171-82Q HD mice [26]. We hypothesized that exogenous expression of TFEB itself could modulate levels of mHTT in brain. We tested if direct overexpression of TFEB in vivo could stimulate autophagy and reduce levels of mHTT protein in the striatum of the HDQ175/Q7 mouse. We used viral delivery with adeno-associated virus AAV2/9 to introduce HA tagged TFEB into the striatum. To study the safety of TFEB-HA expression we measured the levels of striatal enriched proteins DARPP32 [27] and PDE10A [28], examined astrocyte activation using glial fibrillary acidic protein (GFAP), apoptosis activation using caspase 3 and PARP-1 and the ER stress response using GRP78/BiP.
Materials and methods
Preparation of TFEB constructs and AAV vectors
Mouse TFEB coding sequence with C-terminal HA-tag was subcloned from pAAV2.1-CMV-TcFEB-HA plasmid [29] into the AAV backbone with neuronally restricted (human synapsin 1, hSyn1) promoter. Control vector was based on the same backbone and contained GFP under control of the hSyn1 promoter. Packaging of the plasmids into AAV2/9 was performed by the virus core facility at the University of Massachusetts Medical School.
Animals, surgery and stereotactic injections
An animal protocol A978-12 was approved by the University of Massachusetts Medical School and an animal protocol #2004N000248 was approved by MGH SRAC. Heterozygous knock-in HDQ175/Q7 mice and WT littermates were obtained from Jackson Laboratories. Mice were deeply anesthetized using Avertin (1.2% solution, 250 mg/kg). Viral injections into the striatum were unilateral or bilateral and were done by stereotaxic placement of a 10 μL NanoFil microsyringe with a 33G beveled needle under control of an UltraMicroPump (UMP3) microinjector with SYS-Micro4 Controller (all WPI Inc.). Each injection was 2 μl in volume and was delivered to the striatum over a period of 8 minutes. The concentration was 6.8E+12 genome copies/mL for pAAV-TFEB-HA and 4.2E+12 for pAAV-hSyn1-GFP. A dose response was not performed in advance of the experiments reported here using hSyn1 promoter. The volume and concentration of vector were known from a recent study of NUB1 expression driven by hSyn1 promoter to maximize viral distribution to mouse striatal neurons without toxicity [30]. The post injection survival period was four or eight weeks. We noticed that the cage behavior of TFEB-HA injected HDQ175/Q7 mice was altered beginning 6 weeks after injection. No formal behavioral testing was performed, but recordings of mouse behavior during routine handling are provided as Supplementary Video 1–3. Clasping (Supplementary Video 1), hyperactivity and some momentary freezing (Supplementary Video 2), which is characteristic of seizures, appeared in all the TFEB-HA injected HDQ175/Q7 mice. Such behaviors were not seen in the non-injected mice (Supplementary Video 3) or mice treated with AAV hSyn1 GFP at any time. One HDQ175/Q7 mouse died 3 days prior to the scheduled termination of the experiment. At the appropriate post-injection interval, mice were deeply anesthetized with 500 mg/kg Avertin and the brains were removed for qPCR and biochemical assay or a cardiac perfusion was performed with Phosphate Buffered Saline (PBS) followed by 4% paraformaldehyde for immunohistochemistry and immunofluorescence. A total of 4 WT and 26 HDQ175/Q7 mice were used for the study. Supplementary Table 1 lists the genotype of the mice, gender, viral vector, and type of injection (bilateral, unilateral).
Tissue preparation
Striatal tissue was dissected and small pieces from the injection area in dorsal striatum were used for RNA isolation. Remaining striatal tissue was processed into crude homogenate (CH) and subcellular fractions were obtained by low (P1, low speed pellet, 4000 g) and high speed centrifugation (high speed supernatant S2 and high speed pellet P2, 100 000 g) as described in our publications [8, 9, 31].
Relative quantification of TFEB mRNA expression by qPCR
Total RNA was extracted from striatal tissue usingTrizol (Ambion #15596-026) and further purified using an RNeasy kit (Qiagen #74104). One microgram of RNA was converted to cDNA using an iScript cDNA synthesis kit (Bio-Rad #170-8890) per manufacturer’s instructions (5 min. 25°C, 30 min.42°C, 5 min. 85°C, 20 μL reaction volume). cDNA equivalent to 20 ng of input RNA was used per reaction for quantitative real-time PCR (qPCR). qPCR was performed in technical triplicates in total reaction volume of 20 μL including 500 nM specific primers and 10 μL iQ SYBR Green Supermix (Bio-Rad #170-8880) using an iCycleriQ Multicolor Real-Time PCR Detection System(Bio-Rad). Primers were: TFEB forward 5’-GACTC-AGAAGCGAGAGCTAACA-3’, TFEB reverse 5’-TGTGATTGTCTTTCTTCTGCCG-3, β-actin forward 5’-AGGTATCCTGACCCTGAAG-3’, β-actin reverse 5’-GCTCATTGTAGAAGGTGTGG-3’ [32], GAPDH forward 5’-AACAGCAACTCCCAT-TCTTC-3’ and GAPDH reverse 5’-TGGTCCAGG-GTTTCTTACTC-3’ [33]. Cycling parameters were: 10 min. 95°C, 39x: 10 sec. 95°C, 1 min. 60°C (including the data collection step). Threshold cycles (Ct) were determined by Bio-Rad iCycler Software. Levels of gene expression were quantified relative to the mean expression of two housekeeping genes: β-actin and GAPDH. Technical replicates were averaged and ΔCt values for each mouse were calculated as Ct TFEB - average Ct reference (the average Ct of two housekeeping genes). Two-tailed unpaired Student’s t-tests on ΔCt values was used to calculate differences in relative TFEB expression levels between injection groups (N = 4 per group). Relative expression levels for each animal were calculated as ΔCt TFEB – average ΔCt TFEB of control group (non-injected) and plotted as 2- ΔΔCt (fold-change).
Biochemical studies
For the analysis of basal levels of HTT and levels of autophagy/lysosomal markers in striatum of HDQ175/Q7 mice by SDS-PAGE, protein samples were resolved on 12% Bis-Tris gels, 4–12% Bis-Tris gels or 3–8% Tris-Acetate gels (NuPage, Invitrogen), and transferred onto PVDF (for detecting LC3) or nitrocellulose membrane (for all other proteins). Methods for SDS-PAGE and Western blot (WB) for detecting HTT and autophagy related proteins have been reported in our previous publications [31]. Western blots were probed with antisera detecting HA epitope (Cell Signaling #2367, 1:1000), GFP (Cell Signaling #2956, 1:3000), HTT (Ab1, [34], 1:3000 and Abcam EPR5526, 1:3000), LC3 (Novus NB600-1384, 1:1000), LAMP-2A (Invitrogen #512200, 1:4000), Rab7 (Cell Signaling #9367, 1:1000), HSC70 (Enzo ADI-SPA-816, 1:1000), Cathepsin D (Millipore – Calbiochem IM16, 1:40), DARPP32 (Abcam, EP720Y, 1:3000), PDE10A (Abcam, EPR12835, 1:3000), GFAP (Millipore, Ab5804, 1:6000), Caspase-3 (Cell Signaling #9665, 1:1000), PARP-1 (Cell Signaling #9532, 1:1000), GRP78/BiP (StressGen SPA-827, 1:1000), and GAPDH (Millipore MAB374, 1:6000). All signals were detected using appropriate horseradish peroxidase conjugated secondary antibodies (Jackson ImmunoResearch) and SuperSignal West Pico Chemiluminescent Substrate. Images were obtained using a CCD imaging system, quantified by densitometry in FiJi/ImageJ distribution and the results were subjected to statistical analysis.
Immunohistochemistry
Brains from animals perfused with 4% para-formaldehyde were post-fixed in 4% paraformaldehyde for 4 hours and stored in PBS (all at 4°C) until use. Serial sections (50 μm) were obtained using a vibratome. Sections were blocked in 5% Normal Donkey Serum in PBS with 1% bovine serum albumin (BSA) and 0.2% Triton X-100 for one hour at room temperature. Primary antibodies were diluted in the blocking solution and alternate series of sections from the same brain were incubated for 48 hours at 4°C. The following primary antibodies were used: antisera detecting HA epitope (Santa Cruz SC-805, 1:100), GFP (Cell Signaling #2956, 1:400), DARPP32 (Abcam EP720Y, 1:50000), and GFAP (Millipore, Ab5804, 1:1500). After washing with 0.05% Tween-20 in PBS (PBST), sections were incubated in biotinylated anti-rabbit antibody (Vector, BA-1000, 1:500) overnight at 4°C. After washing with PBST, immunoperoxidase/diaminobenzidine (DAB) detection was performed using Vectastain ABC Kit Elite (Vector PK-6100) and a Metal Enhanced DAB Substrate Kit (ThermoFisher 34065) according to manufacturer’s protocol. Sections were placed on gelatinized slides, dried, dehydrated using ethanol and xylene and mounted using Cytoseal 60 permanent mounting medium (Richard-Allan Scientific 8310).
Immunofluorescence double labeling for HA and NeuN was performed on some sections. The staining procedure was as described for immunohistochemistry, with the following modifications: Sections were incubated in a mix of primary antibodies (HA, Santa Cruz SC-805, 1:100; NeuN Millipore, 1:100), followed by thorough washing in PBST and incubation in a mix of fluorescent secondary antibodies (anti-rabbit Cy3 1:500 and anti-mouse bodipy 1:500, both from Jackson ImmunoResearch). Nuclei were counterstained with 4’,6-diamidino-2-phenylindole (DAPI).
Images of immunoperoxidase labeled sections were acquired using a Zeiss Axioskop microscope with a Spot RT3 camera. Fluorescence stained sections were imaged using a Nikon Eclipse inverted microscope with Bio-Rad Radiance 2000 confocal laser scanning system.
Determination of staining intensity for DARPP32
Brightfield images of selected immunoperoxidase/DAB labeled sections (3-4 sections per animal) were obtained using a 2.5x lens to image the entire striatum. Images were converted to grayscale and inverted so that higher staining intensities were presented by higher numeric values. Using FiJi/ImageJ, integrated intensity was measured in a square region of interest (250×250 μm) in the striatal area where TFEB-HA or GFP was distributed and in an area of the striatum without distribution of TFEB-HA or GFP. Values were expressed as a ratio and are reported as percent reduction in DARPP32 staining intensity in areas of HA or GFP immunoreactivity.
DARPP32 positive cell counting
Analysis of total number of DARPP32 positive cells in the striatum of injected and control mice was performed using the optical dissector/fractionator probe in StereoInvestigator Software (Micro Brightfield) and a Nikon Eclipse inverted microscope. Every fourth coronal section through the region covering the entire striatum was included in the counting procedure. A coefficient of error of < 0.1 was accepted (CE Gundersen, m = 1).
Data analysis and statistics
Two-tailed unpaired Student’s t-test was performed to compare control and TFEB-HA injected groups. Kendal tau correlation coefficient was used to compare relative TFEB expression on mRNA and protein levels in individual animals. Statistical significance was accepted if p < 0.05.
Results
We selected the neuronal specific hSyn1 promoter to drive TFEB-HA expression. HDQ175/Q7 mice were injected at age 3 months with AAV hSyn1 TFEB-HA or AAV hSyn1 GFP and evaluated at two months post-injection together with age-matched non-injected mice. An HA tag was used because we found that 3 separate commercially available antibodies directed against TFEB were not useful for immunohistochemistry or Western blot. All HD mice injected with AAV hSyn1 TFEB-HA showed widespread distribution of immunoreactive HA in the dorsal striatum of the injected side (Fig. 1A). HA labeling appeared in cell bodies and processes and localized to the nucleus (Fig. 1A, image 1). Co-localization of HA with NeuN confirmed that the TFEB-HA expression was present in neurons (Supplementary Figure 1). No detectable HA labeling was observed in non-injected mice (Fig. 1B). In the hSyn1 GFP injected mice, GFP immunoreactivity in the striatum was also widespread and uniform (Fig. 1C). Analysis of adjacent sections showed that immunoreactivity for DARPP32, which is enriched in striatal neurons, was reduced in some cell bodies and in neuropil in the areas overlapping with HA labeling compared to areas without HAlabeling (Fig. 1D, compare images 1 and 2 with 7 and 8). No difference in DARPP32 immunoreactivity was observed between the striata of non-injected and hSyn1 GFP injected mice (Fig. 1E, F, compare images 9, 10 with 11, 12). Determination of DARPP32 staining intensity and neuron counts (Supplementary Table 2) showed decreased intensity in AAV hSyn1 TFEB-HA injected mice compared to non-injected and AAV hSyn1 GFP injected mice and a reduced number of neurons (566,766.81 per striatum for TFEB-HA vs 614,247.44 in GFP and 652,665.06 in non-injected mouse). These results suggest that the reduction in DARPP32 immunoreactivity is in part due to neuronal loss. In contrast to the loss of immunoreactive DARPP32, GFAP immunoreactivity was strongly increased in striatal areas that overlapped with HA distribution (Fig. 1G, compare images 1 and 2 with 13), and also in adjacent cortex and striatum (Fig. 1G, 14). GFAP immunoreactivity was low in non-injected mice (Fig. 1H) and elevated mainly near the needle track in AAV hSyn1 GFP injected mice (Fig. 1I, compare images 5, 6 with 17, 18). Some HD mice were also injected with AAV hSyn TFEB-HA (N = 2) or AAV hSyn1 GFP (N = 2) and evaluated one month post-injection. The labeling for HA, DARRP32, GFAP, or GFP in the injected striatum was similar to that of HD mice examined at two months post-injection (data not shown). As there was little difference in DARPP32 and GFAP immunoreactivity between non-injected and AAV hSyn1 GFP injected HDQ175/Q7 mice, we used non-injected mice as the control group for the biochemical experiments described below.
Quantification of TFEB-HA transcript and correlation with protein levels in striatum of HDQ175/Q7 mice
We evaluated TFEB mRNA levels in AAV hSyn1 TFEB-HA injected mice at 2 months post-injection by qPCR. Primers were specific for both endogenous TFEB and TFEB-HA sequence. The average level of TFEB mRNA was 23-fold higher in HDQ175/Q7 mice injected with AAV hSyn1 TFEB-HA compared to endogenous TFEB message in mice that were not-injected (Fig. 2A, p = 0.005). The range of TFEB mRNA signal in individual injected mice was from 60-fold to 5-fold (compared to the mean of the non-injected group). The values for mRNA signal significantly correlated with those for HA protein levels measured by Western blot in corresponding crude homogenates from the same mice (Fig. 2B, Kendall τ= 1, p = 0.042). HA expression was also confirmed in the nuclear enriched P1 fraction (Fig. 2C), indicating presence of exogenous protein in thenucleus.
Levels of proteins involved in autophagy and lysosomal activity are changed in the striatum of mice treated with AAV hSyn1 TFEB-HA
Since TFEB is known to activate autophagy pathways and lysosomal activity, we performed Western blot assays in crude homogenates (CH) and subcellular fractions (P1, S2 and P2) of striatum to assess the effects of TFEB-HA expression on levels and distribution of selected proteins including LAMP-2A, LC3II, procathepsin D, HSC70 and Rab7. The results were compared to striatum with no injection. At two months after treatment with AAV hSyn1 TFEB-HA, the striatum of HDQ175/Q7 mice had significant increases in levels of LAMP-2A (in CH, P1, and P2 fractions), LC3II (in CH), and procathepsin D 46kD (in CH and P1 fractions) compared to striatum of non-injected mice (Fig. 3A, B). By contrast, there were significant reductions in the levels of HSC70 and Rab7 in S2 fractions of the TFEB-HA treated HDQ175/Q7 striatum compared to the untreated striatum (Fig. 3B). These data suggest that TFEB-HA expression in the striatum of HDQ175/Q7 mice promotes autophagy and lysosomal activity.
Analysis of mutant HTT levels in striatum of HDQ175/Q7 mice injected with AAV hSyn1 TFEB-HA
Since mHTT may be processed through autophagy [9, 12, 35], we looked at the levels of mHTT after TFEB-HA expression. MHTT levels were examined by Western blot with N-terminal directed HTT antibodies (EPR5526 HTT 1–100 and Ab1 HTT 1–17 antibodies). In the striatum of HDQ175/Q7 mice, full length mHTT levels were reduced by 21–35%, in CH, P1 and P2 fractions when detected with antibody EPR5526 (Fig. 3C, D). Although a similar trend for reduction in mHTT levels was observed using antibody Ab1 (–21% in P1, –31% in P2), the changes were not significant by statistical analysis (results not shown). There was no reduction in levels of WT HTT in the TFEB-HA injected HDQ175/Q7compared to untreated mice when detected with antibody EPR5526 (Fig. 3C, D) or with antibody Ab1 (results not shown). These results suggest that TFEB-HA expression may lower levels of mHTT in vivo. However, the findings must be interpreted cautiously due to the small reductions in mHTT levels and the lack of confirmation with a second anti-HTT antibody.
Effects of AAV hSyn1 TFEB-HA expression on protein levels of DARPP32, PDE10A and GFAP
Since the staining for DARPP32 and GFAP was altered in striatal areas of TFEB-HA distribution, we performed Western blot analysis to determine the levels of these proteins and also the striatal enriched protein PDE10A. Compared to non-injected mice, AAV hSyn1 TFEB-HA injected mice surviving two months had lower levels of DARPP32 (–14%, p = 0.093) that were not statistically significant, a significant decline in levels of PDE10A (–55%, p = 0.002) and a significant increase in the levels of GFAP (+154%, p = 3.3E-05) (Fig. 4A, B). We also compared the levels of DARPP32, PDE10A and GFAP in AAV hSyn1 TFEB-HA injected and AAV hSyn1 GFP injected mice at one month post-injection. Compared to the striatum of HD mice injected with AAV hSyn1 GFP, the striatum of HD mice injected with AAV hSyn1 TFEB-HA had a significant reduction in DARPP32 (–39%, p = 0.0136) and PDE10A (–80%, p = 5E-04) and significant increase in GFAP (141%, p = 7E-04) (Supplementary Figure 2A, B). The reduction in DARPP32 (at one month post-injection) and the decline in PDE10A and increase in GFAP (at one and two months post-injection) suggested that TFEB-HA expression in striatum of HDQ175/Q7 mice caused some neuronal stress.
Analysis of apoptosis and ER stress
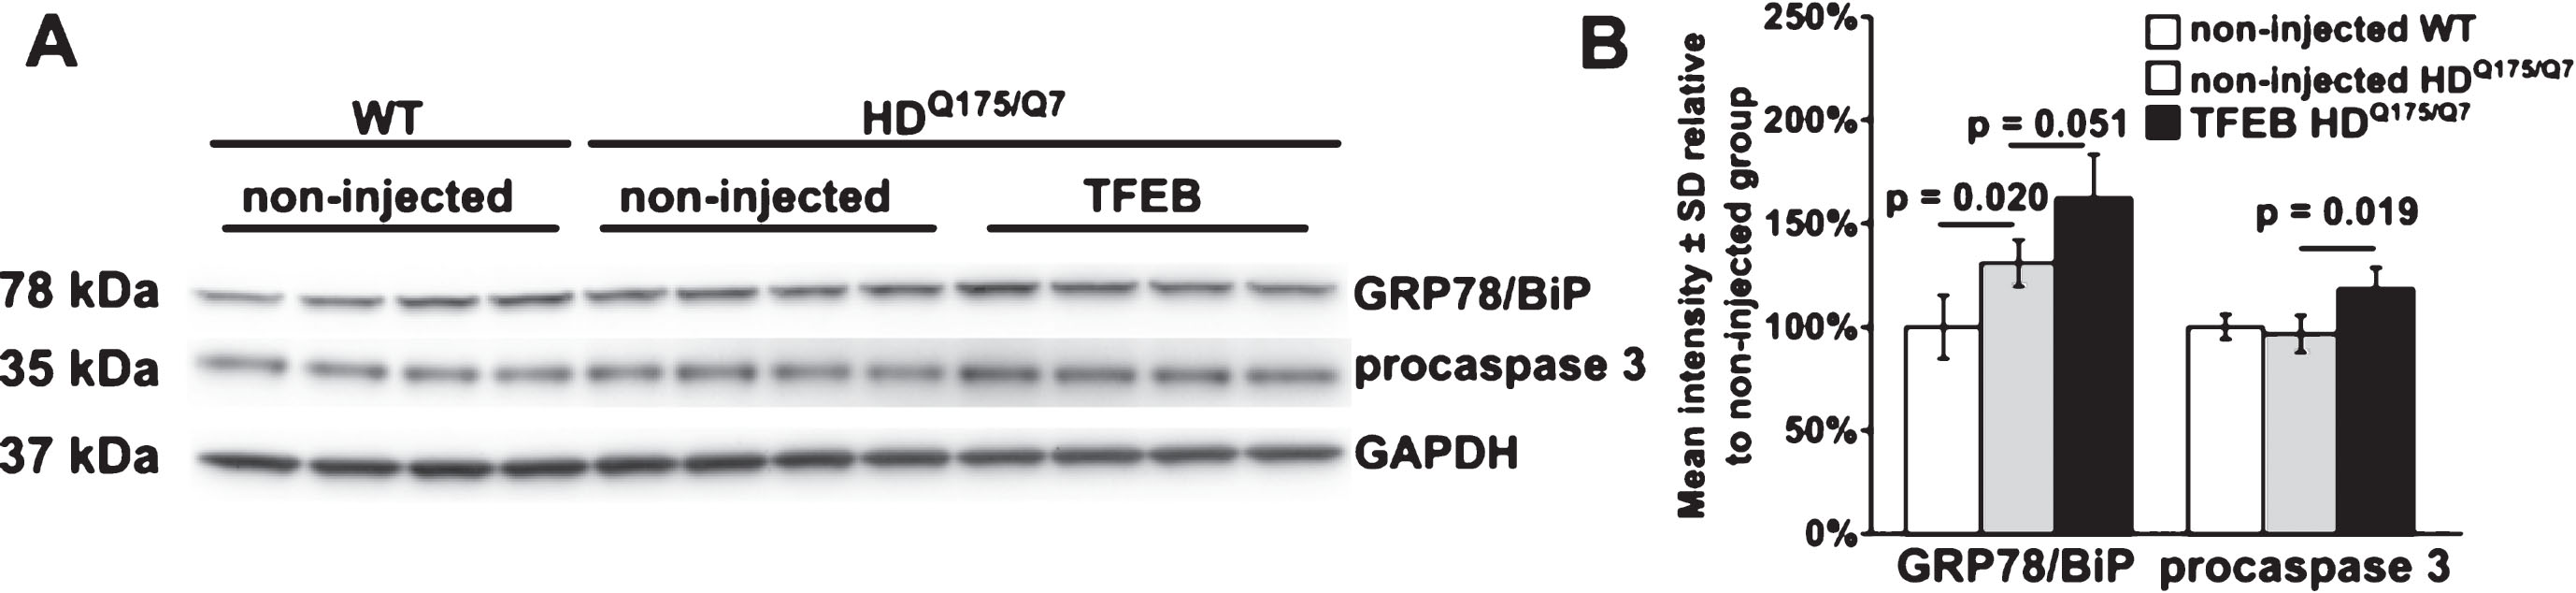
We analyzed striatal lysates from AAV hSyn1 TFEB-HA injected and non-injected mice for markers of apoptosis (caspase 3 cleavage, PARP-1 cleavage) and endoplasmic reticulum stress (GRP78/BiP). We did not detect cleavage of caspase 3 or PARP-1 (data not shown), which would indicate ongoing apoptosis. However, levels of procaspase 3 (35 kDa) were significantly increased in HDQ175/Q7 mice injected with AAV hSyn1 TFEB-HA compared to non-injected mice (Fig. 5A, B, +23%, p = 0.019). In non-injected HDQ175/Q7 mice GRP78/BiP levels were significantly increased compared to age-matched WT mice (Fig. 5A, B, +24%, p = 0.020) and elevated by further 24% (p = 0.051) in TFEB-HA injected HDQ175/Q7 mice. These results suggested that ER stress response is activated in HD mice and TFEB-HA expression in the striatum enhances this activation.
Discussion
TFEB regulates lysosomal biogenesis and autophagy [29], and in cell models of neurodegenerative disease its expression has been shown to reduce disease proteins that cause neurodegeneration [26, 36]. TFEB-HA expression in the striatum of HDQ175/Q7 mice with the hSyn1 promoter generated expression in neurons and both cytoplasmic and nuclear localization. The latter is important since function of TFEB as a transcription factor requires its nuclear localization which is partly controlled by phosphorylation state [37]. TFEB-HA expression in the striatum of HDQ175/Q7 mice increased a number of regulatory proteins involved in autophagy. The increase in levels of LAMP-2A, LC3II and procathepsin D in crude homogenates (CH) and membrane fractions (P1 or P2) is consistent with the function of these proteins at membranes and with a TFEB induced increase in the number of autophagosomes (LC3II) and lysosomes (LAMP-2A and procathepsin D). Unexpectedly, the levels of Rab7 and HSC70 in the soluble fraction were reduced rather than increased by TFEB-HA expression in HDQ175/Q7. Rab7 is important for trafficking cargo to lysosomes, and HSC70 is important for clearance by chaperone mediated autophagy. The reduced levels of these proteins arising possibly from a TFEB induced increase in autophagic flux suggest that some imbalances in the autophagy pathways may be triggered by TFEB-HA expression in brain.
It is interesting that TFEB-HA expression reduced the levels of mHTT (by 21–35% in membrane fractions), but not the levels of WT HTT. Aggregation prone proteins such as mHTT are often targeted for degradation by autophagy [35, 38, 39], and thus TFEB expression may preferentially enhance autophagy dependent degradation of mHTT compared to WT HTT. Tsunemi et al. showed that overexpression of PGC-1α in HD mouse striatum reduced the number of cells with typical mHTT inclusions through a TFEB mediated mechanism [26].
TFEB-HA expression driven by the hSyn1 promoter in HDQ175/Q7 mice caused increased levels of GFAP, a sign of reactive astrocytosis. The increase in GFAP is unlikely due to direct effects of exogenous TFEB in astrocytes since the activity of the hSyn1 promoter is restricted to neurons [40]. Reactive astrogliosis is a common response to insults that disrupt neuronal homeostasis [41]. The TFEB-HA induced changes in medium spiny neurons represented by reduced levels of DARPP32 and PDE10A may have triggered a response in astrocytes. Astrocytes in symptomatic HDQ175/Q7 mice are not reactive [42] as they are in human HD [43] but do have a potassium channel dysfunction [42].
The marked decline in the levels of PDE10A that occurred in HD striatum after TFEB-HA expression is intriguing. Phosphodiesterase PDE10A is highly expressed in striatal neurons [28] and regulates dopamine receptor D1 and D2 signaling through reduction of cAMP [44]. Recently it was shown that changes in lysosomal pH present in some neurodegenerative diseases (familial AD with presenilin1 mutation) can be partly restored by cAMP treatment [45]. One possibility is that reductions in PDE10A seen after TFEB-HA expression increase the levels of cAMP, which in turn increases lysosomal function. Treatment with PDE10A inhibitor TP-10 was reported to be protective in the R6/2 HD mouse model [46]. However, in our study the reduction in PDE10A may have also contributed to the freezing behavior we observed in the HDQ175/Q7 mice. PDE10A null mice show reduced spontaneous locomotoractivity [47].
We observed elevated levels of the ER chaperone protein GRP78/BiP in non-injected HD mice as compared to non-injected WT mice. There is evidence that GRP78/BiP is increased in the presence of the HD mutation and is part of the protective response to ER stress. Reijonen et al. showed that cells expressing N-terminal mHTT had increased GRP78/BiP and treatment with the ER stress inhibitor salubrinal prevented caspase-12 cleavage and protected cells from apoptosis, increased viability, and reduced mHTT fragment aggregation [48]. In Neuro-2 cells, GRP78/BiP overexpression prevented HTT150Q mediated Caspase-3 activation and increased cell survival, while siRNA mediated GRP78/BiP silencing increased HTT150Q induced cell death and Caspase-3 activation [49]. In our TFEB-HA injected HDQ175/Q7 mice, a trend for further increase in GRP78/BiP compared to non-injected HDQ175/Q7 occurred along with the rise in procaspase-3 levels. This GRP78/BiP elevation and absence of caspase 3 cleavage may be part of a protective response to ER stress.
In summary our findings show that in vivo expression of TFEB in the HD striatum is effective in elevating proteins that signal the activation of autophagy. Autophagic degradation is likely to have played a role in reducing levels of mHTT protein. The expression of TFEB-HA in HD striatum also caused changes in PDE10A and DARPP32 and a protective response to ER stress. Our results suggest that over-expression of TFEB may be harmful in vivo. Study of the effects of TFEB expression in HD mice beyond 2 months will be needed to determine if TFEB is useful for sustained autophagy activation and lowering of mHTT levels and in delaying motor deficits caused by the HD mutation. TFEB expression from a weaker promoter than hSyn1 may reduce adverse effects such as ER stress and reactive gliosis while still activating autophagy and reducingmHTT levels.
CONFLICT OF INTERESTS
All authors have no conflicts of interest to disclose.
ACKNOWLEDGMENTS
We thank to Dr. Andrea Ballabio and Fondazione Telethon for providing pAAV2.1-CMV-TcFEB-HA plasmid. This work was supported by the CHDI Foundation, Inc. and Dake Family Fundto MD.
Appendices
Supplementary Table 1: List of injected animals;
Supplementary Table 2: Analysis of DARPP32 staining intensity and number of DARPP32 positive neurons;
Supplementary Video 1.avi: HDQ175/Q7 mouse injected with AAV hSyn1 TFEB-HA, clasping;
Supplementary Video 2.avi: HDQ175/Q7 mouse injected with AAV hSyn1 TFEB-HA, hyperactivity and some momentary freezing;
Supplementary Video 3.avi: Non-injected HDQ175/Q7 mice;
Supplementary Figure 1: Co-localization of TFEB-HA and NeuN in AAV hSyn1 TFEB-HA injected mouse, 1 month post-injection;
Supplementary Figure 2: WB for HDQ175/Q7 mice injected with AAV hSyn1 TFEB-HA and AAV hSyn1 GFP and analyzed 1 month post-injection.
The supplementary material is available in the electronic version of this article: http://dx.doi.org/10.3233/JHD-160211.
REFERENCES
[1] | Cuervo AM . Autophagy: Many paths to the same end. Mol Cell Biochem. (2004) ;263: (1-2):55–72. doi: 10.1023/B:MCBI.0000041848.57020.57 |
[2] | Klionsky DJ . The molecular machinery of autophagy: Unanswered questions. J Cell Sci. (2005) ;118: (1):7–18. doi: 10.1242/jcs.01620 |
[3] | Klionsky DJ , Abeliovich H , Agostinis P , Agrawal DK , Aliev G , Askew DS , et al. Guidelines for the use and interpretation of assays for monitoring autophagy in higher eukaryotes. Autophagy. (2008) ;4: (2):151–75. doi: 10.4161/auto.5338 |
[4] | Klionsky DJ , Cuervo AM , Dunn W , Levine B , van der Klei I , Seglen PO . How shall I eat thee? Autophagy. (2007) ;3: (5):413. doi: 10.4161/auto.4377 |
[5] | Mizushima N . Autophagy: Process and function. Genes Dev. (2007) ;21: (22):2861–73. doi: 10.1101/gad.1599207 |
[6] | Rubinsztein DC . The roles of intracellular protein-degradation pathways in neurodegeneration. Nature. (2006) ;443: (7113):780–6. doi: 10.1038/nature05291 |
[7] | Sapp E , Schwarz C , Chase K , Bhide PG , Young AB , Penney J , et al. Huntingtin localization in brains of normal and Huntington’s disease patients. Ann Neurol. (1997) ;42: (4):604–12. doi: 10.1002/ana.410420411 |
[8] | Kegel KB , Kim M , Sapp E , McIntyre C , Castaño JG , Aronin N , et al. Huntingtin expression stimulates endosomal-lysosomal activity, endosome tubulation, and autophagy. J Neurosci. (2000) ;20: (19):7268–78. |
[9] | Kim YJ , Sapp E , Cuiffo BG , Sobin L , Yoder J , Kegel KB , et al. Lysosomal proteases are involved in generation of N-terminal huntingtin fragments. Neurobiol Dis. (2006) ;22: (2):346–56. doi: 10.1016/j.nbd.2005.11.012 |
[10] | Qi L , Zhang X-D , Wu J-C , Lin F , Wang J , DiFiglia M , et al. The role of chaperone-mediated autophagy in huntingtin degradation. PLoS One. (2012) ;7: (10):e46834. doi: 10.1371/journal.pone.0046834 |
[11] | Ravikumar B , Imarisio S , Sarkar S , O’Kane CJ , Rubinsztein DC . Rab5 modulates aggregation and toxicity of mutant huntingtin through macroautophagy in cell and fly models of Huntington disease. J Cell Sci. (2008) ;121: (10):1649–60. doi: 10.1242/jcs.025726 |
[12] | Qin Z-H , Wang Y , Kegel KB , Kazantsev A , Apostol BL , Thompson LM , et al. Autophagy regulates the processing of amino terminal huntingtin fragments. Hum Mol Genet. (2003) ;12: (24):3231–44. doi: 10.1093/hmg/ddg346 |
[13] | Glick D , Barth S , Macleod KF . Autophagy: Cellular and molecular mechanisms. J Pathol. (2010) ;221: (1):3–12. doi: 10.1002/path.2697 |
[14] | He H , Dang Y , Dai F , Guo Z , Wu J , She X , et al. Post-translational modifications of three members of the human MAP1LC3 family and detection of a novel type of modification for MAP1LC3B. J Biol Chem. (2003) ;278: (31):29278–87. doi: 10.1074/jbc.M303800200 |
[15] | Heng MY , Duong DK , Albin RL , Tallaksen-Greene SJ , Hunter JM , Lesort MJ , et al. Early autophagic response in a novel knock-in model of Huntington disease. Hum Mol Genet.-20. (2010) ;19: (19):3702–20. doi: doi:10.1093/hmg/ddq285 |
[16] | Gutierrez MG , Munafó DB , Berón W , Colombo MI . Rab7 is required for the normal progression of the autophagic pathway in mammalian cells. J Cell Sci. (2004) ;117: (13):2687–97. doi: 10.1242/jcs.01114 |
[17] | Hyttinen JMT , Niittykoski M , Salminen A , Kaarniranta K . Maturation of autophagosomes and endosomes: A key role for Rab7. Biochim Biophys Acta.503-10. (2013) ;1833: (3):503–10. doi: 10.1016/j.bbamcr.2012.11.018 |
[18] | Cuervo AM , Dice JF . Lysosomes, a meeting point of proteins, chaperones, and proteases. J Mol Med. (1998) ;76: (1):6–12. doi: 10.1007/s001090050185 |
[19] | Cuervo AM , Stefanis L , Fredenburg R , Lansbury PT , Sulzer D . Impaired degradation of mutant α-synuclein by chaperone-mediated autophagy. Science. (2004) ;305: (5688):1292–5. doi: 10.1126/science.1101738 |
[20] | Cuervo AM , Dice JF . A receptor for the selective uptake and degradation of proteins by lysosomes. Science. (1996) ;273: (5274):501–3. doi: 10.1126/science.273.5274.501 |
[21] | Cuervo AM , Dice JF , Knecht E . A population of rat liver lysosomes responsible for the selective uptake and degradation of cytosolic proteins. J Biol Chem. (1997) ;272: (9):5606–15. doi: 10.1074/jbc.272.9.5606 |
[22] | Sardiello M , Palmieri M , Ronza A di , Medina DL , Valenza M , Gennarino VA , et al. A gene network regulating lysosomal biogenesis and function. Science. (2009) ;325: (5939):473–7. doi: 10.1126/science.1174447 |
[23] | Polito VA , Li H , Martini-Stoica H , Wang B , Yang L , Xu Y , et al. Selective clearance of aberrant tau proteins and rescue of neurotoxicity by transcription factor EB. EMBO Mol Med. (2014) ;6: (9):1142–60. doi: 10.15252/emmm.201303671 |
[24] | Xiao Q , Yan P , Ma X , Liu H , Perez R , Zhu A , et al. Enhancing astrocytic lysosome biogenesis facilitatesa clearance and attenuates amyloid plaque pathogenesis. J Neurosci. (2014) ;34: (29):9607–20. doi: 10.1523/JNEUROSCI.3788-13.2014 |
[25] | Kilpatrick K , Zeng Y , Hancock T , Segatori L . Genetic and chemical activation of TFEB mediates clearance of aggregated α-synuclein. PLoS One. (2015) ;10: (3):e0120819. doi: 10.1371/journal.pone.0120819 |
[26] | Tsunemi T , Ashe TD , Morrison BE , Soriano KR , Au J , Roque RAV , et al. PGC-1α rescues Huntington’s disease proteotoxicity by preventing oxidative stress and promoting TFEB function. Sci Transl Med. (2012) ;4: (142):142ra97–142ra97. doi: 10.1126/scitranslmed.3003799 |
[27] | Ouimet CC , Langley-Gullion KC , Greengard P . Quantitative immunocytochemistry of DARPP-32-expressing neurons in the rat caudatoputamen. Brain Res. (1998) ;808: (1):8–12. doi: 10.1016/S0006-8993(98)00724-0 |
[28] | Coskran TM , Morton D , Menniti FS , Adamowicz WO , Kleiman RJ , Ryan AM , et al. Immunohistochemical localization of phosphodiesterase 10A in multiple mammalian species. J Histochem Cytochem. (2015) ;54: (11):1205–13. doi: 10.1369/jhc.6A6930.2006 |
[29] | Settembre C , Di Malta C , Polito VA , Arencibia MG , Vetrini F , Erdin S , et al. TFEB links autophagy to lysosomal biogenesis. Science. (2011) ;332: :1429–33. doi: 10.1126/science.1204592 |
[30] | Vodicka P , Chase K , Iuliano M , Valentine DT , Sapp E , Lu B , et al. Effects of exogenous NUB1 expression in the striatum of HDQ175/Q7 mice. J Huntingtons Dis. (2016) ;5: (2):163–74. doi: 10.3233/JHD-160195 |
[31] | Vodicka P , Lim J , Williams DT , Kegel KB , Chase K , Park H , et al. Assessment of chloroquine treatment for modulating autophagy flux in brain of WT and HD mice. J Huntingtons Dis. (2014) ;3: (2):159–74. doi: 10.3233/JHD-130081 |
[32] | Zhang N , Li B , Al-Ramahi I , Cong X , Held JM , Kim E , et al. Inhibition of lipid signaling enzyme diacylglycerol kinase ε attenuates mutant huntingtin toxicity. J Biol Chem. (2012) ;287: (25):21204–13. doi: 10.1074/jbc.M111.321661 |
[33] | Sadri-Vakili G , Kumaresan V , Schmidt HD , Famous KR , Chawla P , Vassoler FM , et al. Cocaine-induced chromatin remodeling increases brain-derived neurotrophic factor transcription in the rat medial prefrontal cortex, which alters the reinforcing efficacy of cocaine. J Neurosci. (2010) ;30: (35):11735–44. doi: 10.1523/JNEUROSCI.2328-10.2010 |
[34] | DiFiglia M , Sapp E , Chase K , Schwarz C , Meloni A , Young C , et al. Huntingtin is a cytoplasmic protein associated with vesicles in human and rat brain neurons. Neuron. (1995) ;14: (5):1075–81. doi: 10.1016/0896-6273(95)90346-1 |
[35] | Ravikumar B , Duden R , Rubinsztein DC . Aggregate-prone proteins with polyglutamine and polyalanine expansions are degraded by autophagy. Hum Mol Genet. (2002) ;11: (9):1107–17. doi: 10.1093/hmg/11.9.1107 |
[36] | Decressac M , Mattsson B , Weikop P , Lundblad M , Jakobsson J , Björklund A . TFEB-mediated autophagy rescues midbrain dopamine neurons from α-synuclein toxicity. Proc Natl Acad Sci. (2013) ;110: (19):E1817–26. doi: 10.1073/pnas.1305623110 |
[37] | Medina DL , Di Paola S , Peluso I , Armani A , De Stefani D , Venditti R , et al. Lysosomal calcium signalling regulates autophagy through calcineurin and TFEB. Nat Cell Biol. (2015) ;17: (3):288–99. doi: 10.1038/ncb3114 |
[38] | Iwata A , Christianson JC , Bucci M , Ellerby LM , Nukina N , Forno LS , et al. Increased susceptibility of cytoplasmic over nuclear polyglutamine aggregates to autophagic degradation. Proc Natl Acad Sci U S A. (2005) ;102: (37):13135–40. doi: 10.1073/pnas.0505801102 |
[39] | Wong ESP , Tan JMM , Soong W-E , Hussein K , Nukina N , Dawson VL , et al. Autophagy-mediated clearance of aggresomes is not a universal phenomenon. Hum Mol Genet. (2008) ;17: (16):2570–82. doi: 10.1093/hmg/ddn157 |
[40] | McLean JR , Smith GA , Rocha EM , Hayes MA , Beagan JA , Hallett PJ , et al. Widespread neuron-specific transgene expression in brain and spinal cord following synapsin promoter-driven AAV9 neonatal intracerebroventricular injection. Neurosci Lett. (2014) ;576: : 73–8. doi: 10.1016/j.neulet.2014.05.044 |
[41] | Sofroniew MV . Molecular dissection of reactive astrogliosis and glial scar formation. Trends Neurosci. (2009) ;32: (12):638–47. doi: 10.1016/j.tins.2009.08.002 |
[42] | Tong X , Ao Y , Faas GC , Nwaobi SE , Xu J , Haustein MD , et al. Astrocyte Kir4. 1 ion channel deficits contribute to neuronal dysfunction in Huntington’s disease model mice. Nat Neurosci. (2014) ;17: (5):694–703. doi: 10.1038/nn.3691 |
[43] | Vonsattel JPG , DiFiglia M . Huntington disease. J Neuropathol Exp Neurol. (1998) ;57: (5):369–84. doi: 10.1097/00005072-199805000-00001 |
[44] | Nishi A , Kuroiwa M , Miller DB , O’Callaghan JP , Bateup HS , Shuto T , et al. Distinct roles of PDE4 and PDE10A in the regulation of cAMP/PKA signaling in the striatum. J Neurosci. (2008) ;28: (42):10460–71. doi: 10.1523/JNEUROSCI.2518-08.2008 |
[45] | Coffey EE , Beckel JM , Laties AM , Mitchell CH . Lysosomal alkalization and dysfunction in human fibroblasts with the Alzheimer’s disease-linked presenilin 1 A246E mutation can be reversed with cAMP. Neuroscience. (2014) ;263: :111–24. doi: 10.1016/j.neuroscience.2014.01.001 |
[46] | Giampà C , Laurenti D , Anzilotti S , Bernardi G , Menniti FS , Fusco FR . Inhibition of the striatal specific phosphodiesterase PDE10A ameliorates striatal and cortical pathology in R6/2 mouse model of Huntington’s disease. PLoS ONE. (2010) ;5: (10):e13417. doi: 10.1371/journal.pone.0013417 |
[47] | Siuciak JA , McCarthy SA , Chapin DS , Fujiwara RA , James LC , Williams RD , et al. Genetic deletion of the striatum-enriched phosphodiesterase PDE10A: Evidence for altered striatal function. Neuropharmacology. (2006) ;51: (2):374–85. doi: 10.1016/j.neuropharm.2006.01.012 |
[48] | Reijonen S , Putkonen N , Nørremølle A , Lindholm D , Korhonen L . Inhibition of endoplasmic reticulum stress counteracts neuronal cell death and protein aggregation caused by N-terminal mutant huntingtin proteins. Exp Cell Res. (2008) ;314: (5):950–60. doi: 10.1016/j.yexcr.2007.12.025 |
[49] | Jiang Y , Lv H , Liao M , Xu X , Huang S , Tan H , et al. GRP78 counteracts cell death and protein aggregation caused by mutant huntingtin proteins. Neurosci Lett. (2012) ;516: (2):182–7. doi: 10.1016/j.neulet.2012.03.074 |
Figures and Tables
Fig.1
Immunohistochemistry for TFEB-HA, DARPP32 and GFAP in mice injected with AAV hSyn1 TFEB-HA, AAV hSyn1 GFP or non-injected and examined 2 months post-injection: Immunoperoxidase labeling for HA (TFEB-HA) (A, B) or GFP (C) within the injected or control striatum. Images from corresponding sections stained with DARPP32 (D, E, F) and GFAP (G, H, I) show extent of labeling within the striatum. Numbered boxes correspond to areas displayed in the enlargements to the right. DARPP32 staining of cell bodies and processes is diminished in the TFEB-HA affected area of striatum (D). Note increased GFAP labeling in the area of striatum affected by TFEB-HA injection (G). N = 2 mice per treatment group.
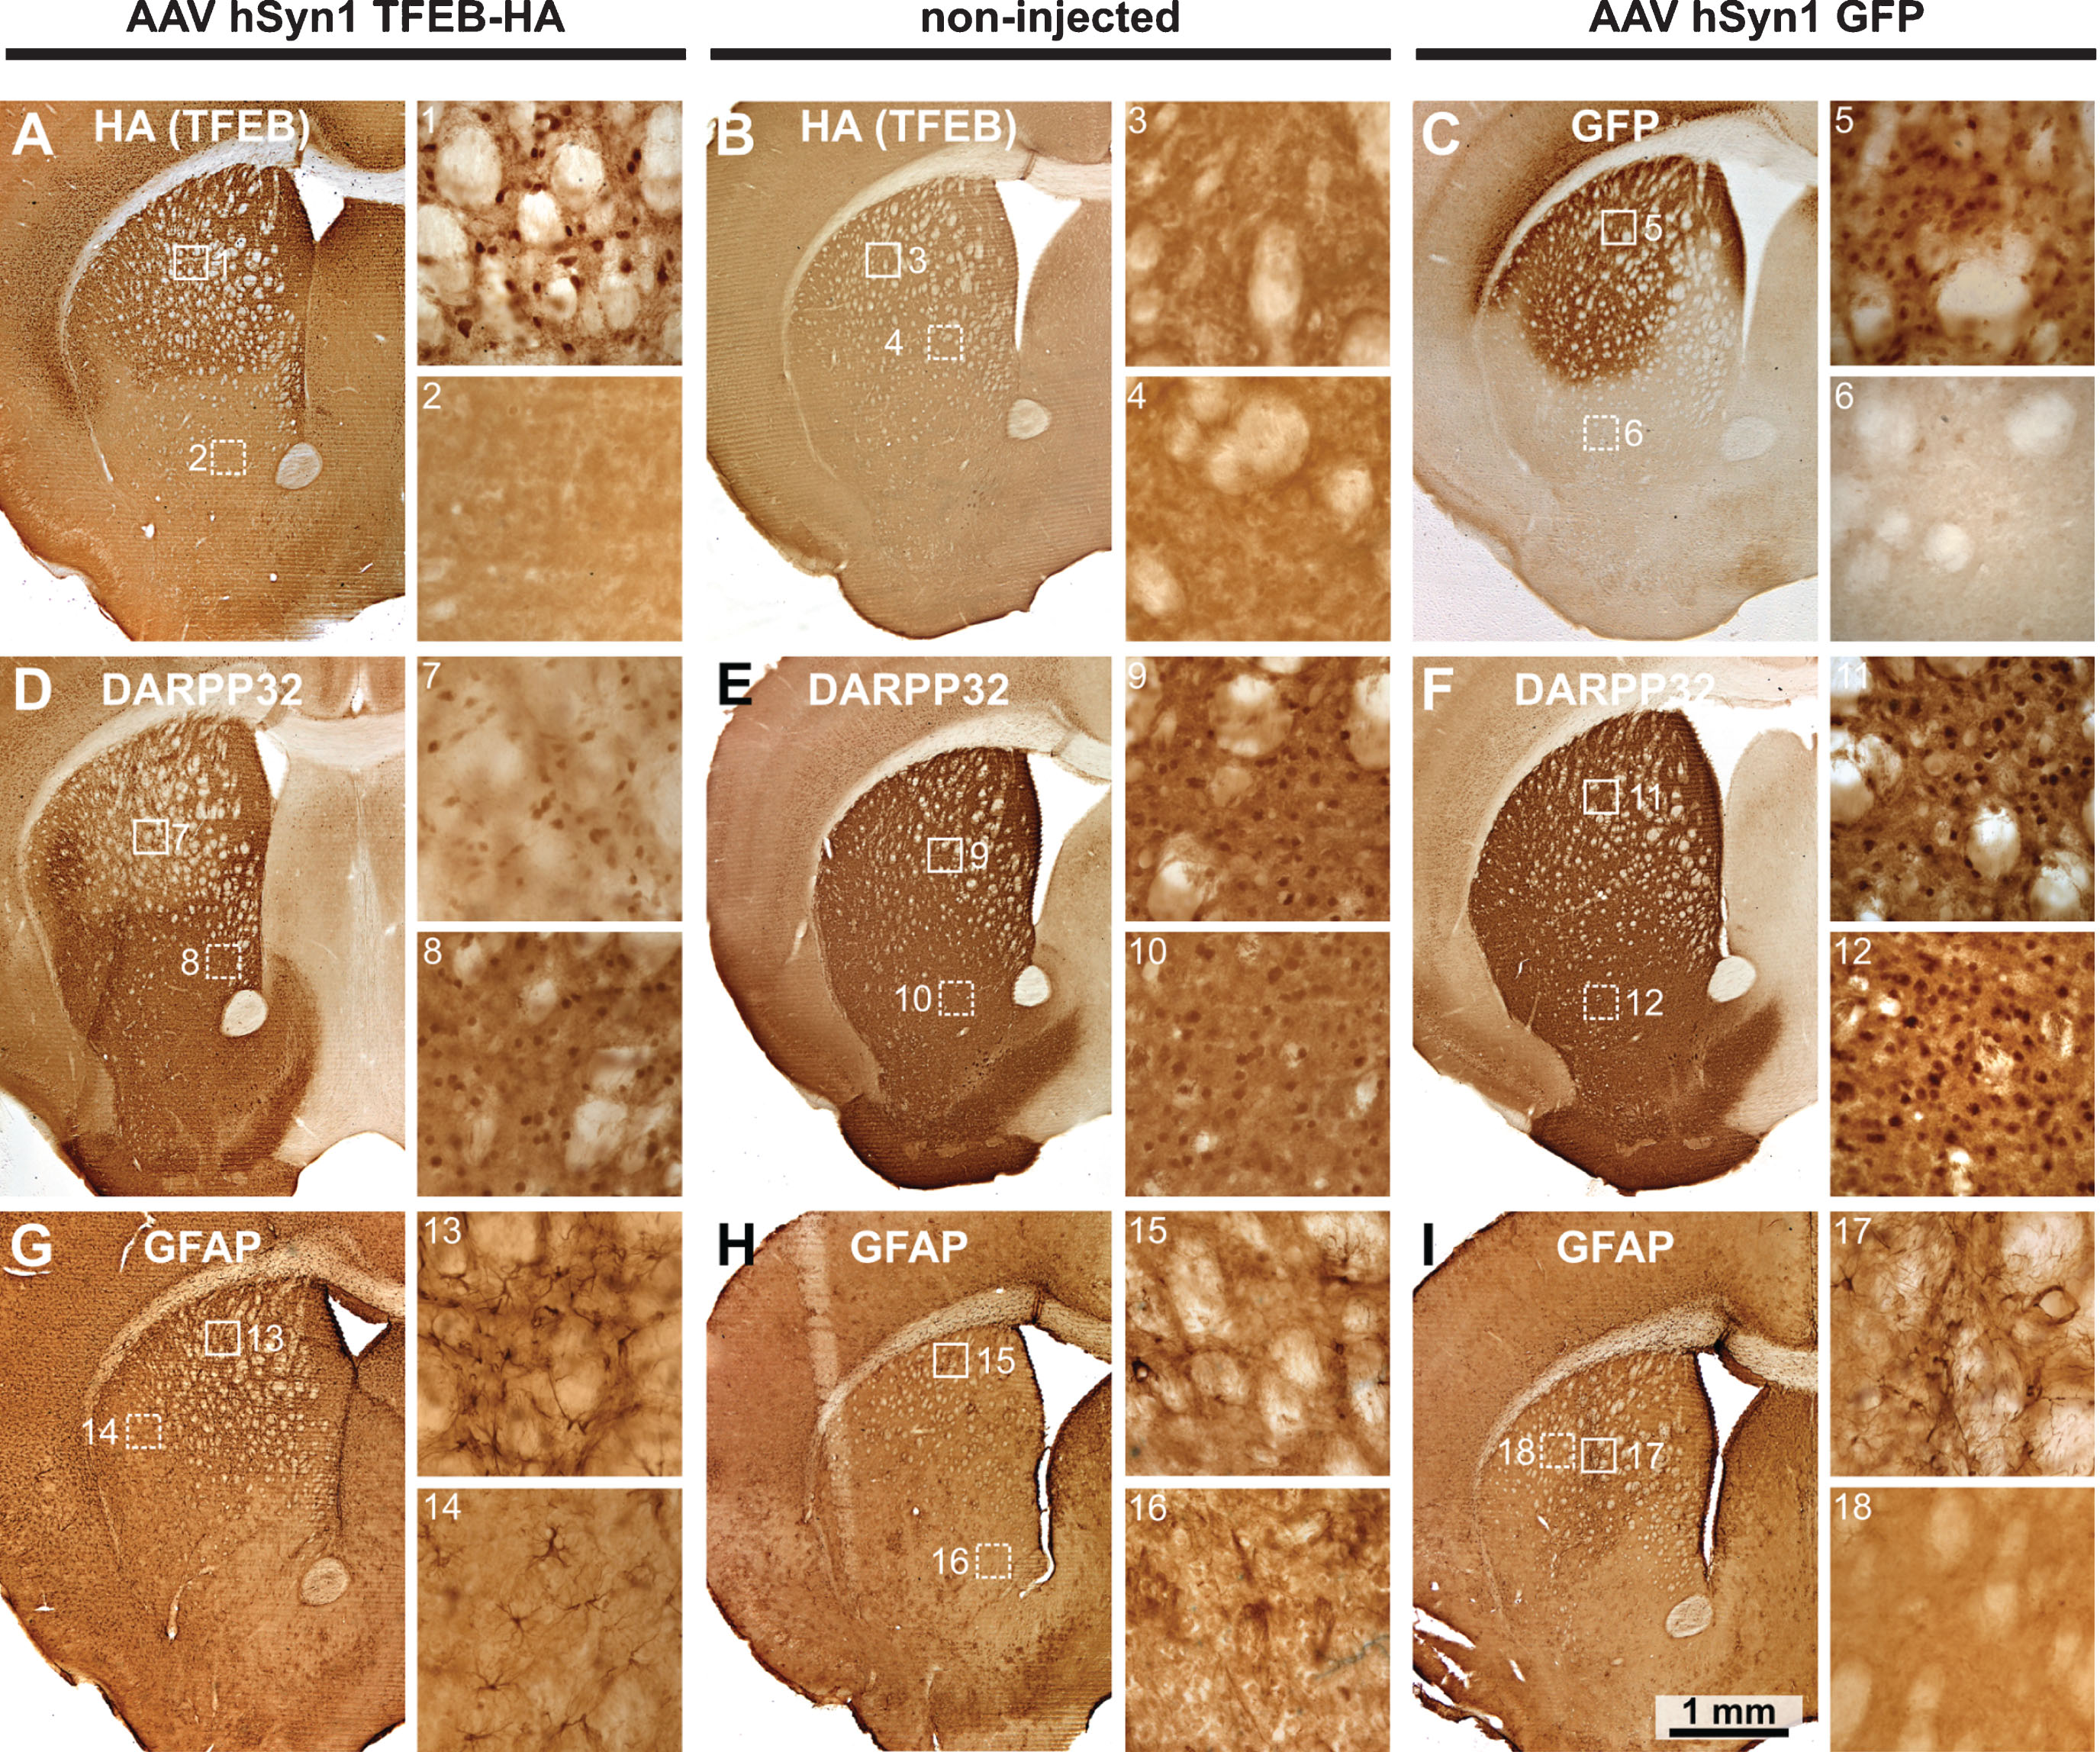
Fig.2
TFEB mRNA quantification by qPCR and comparison to TFEB-HA protein levels. A) Relative quantification of TFEB mRNA in non-injected and AAV hSyn1 TFEB-HA injected HDQ175/Q7 mice. Data are presented as a fold-change over mean of control group (non-injected). Each point represents individual mouse and boxplots show overall data distribution (N = 4 mice per group). P-value from unpaired t-test. B) Comparison of TFEB mRNA levels in individual animals to TFEB-HA protein levels detected by HA antibody. Bar graphs show relative fold-change over mean of control group for mRNA and HA densitometry signal in crude homogenate normalized to GAPDH for protein. Kendall tau correlation coefficient and corresponding p-value for mRNA/ crude homogenate protein level is provided. C) Western blot for TFEB-HA protein levels as detected by HA antibody in P1 nuclear enriched fraction.
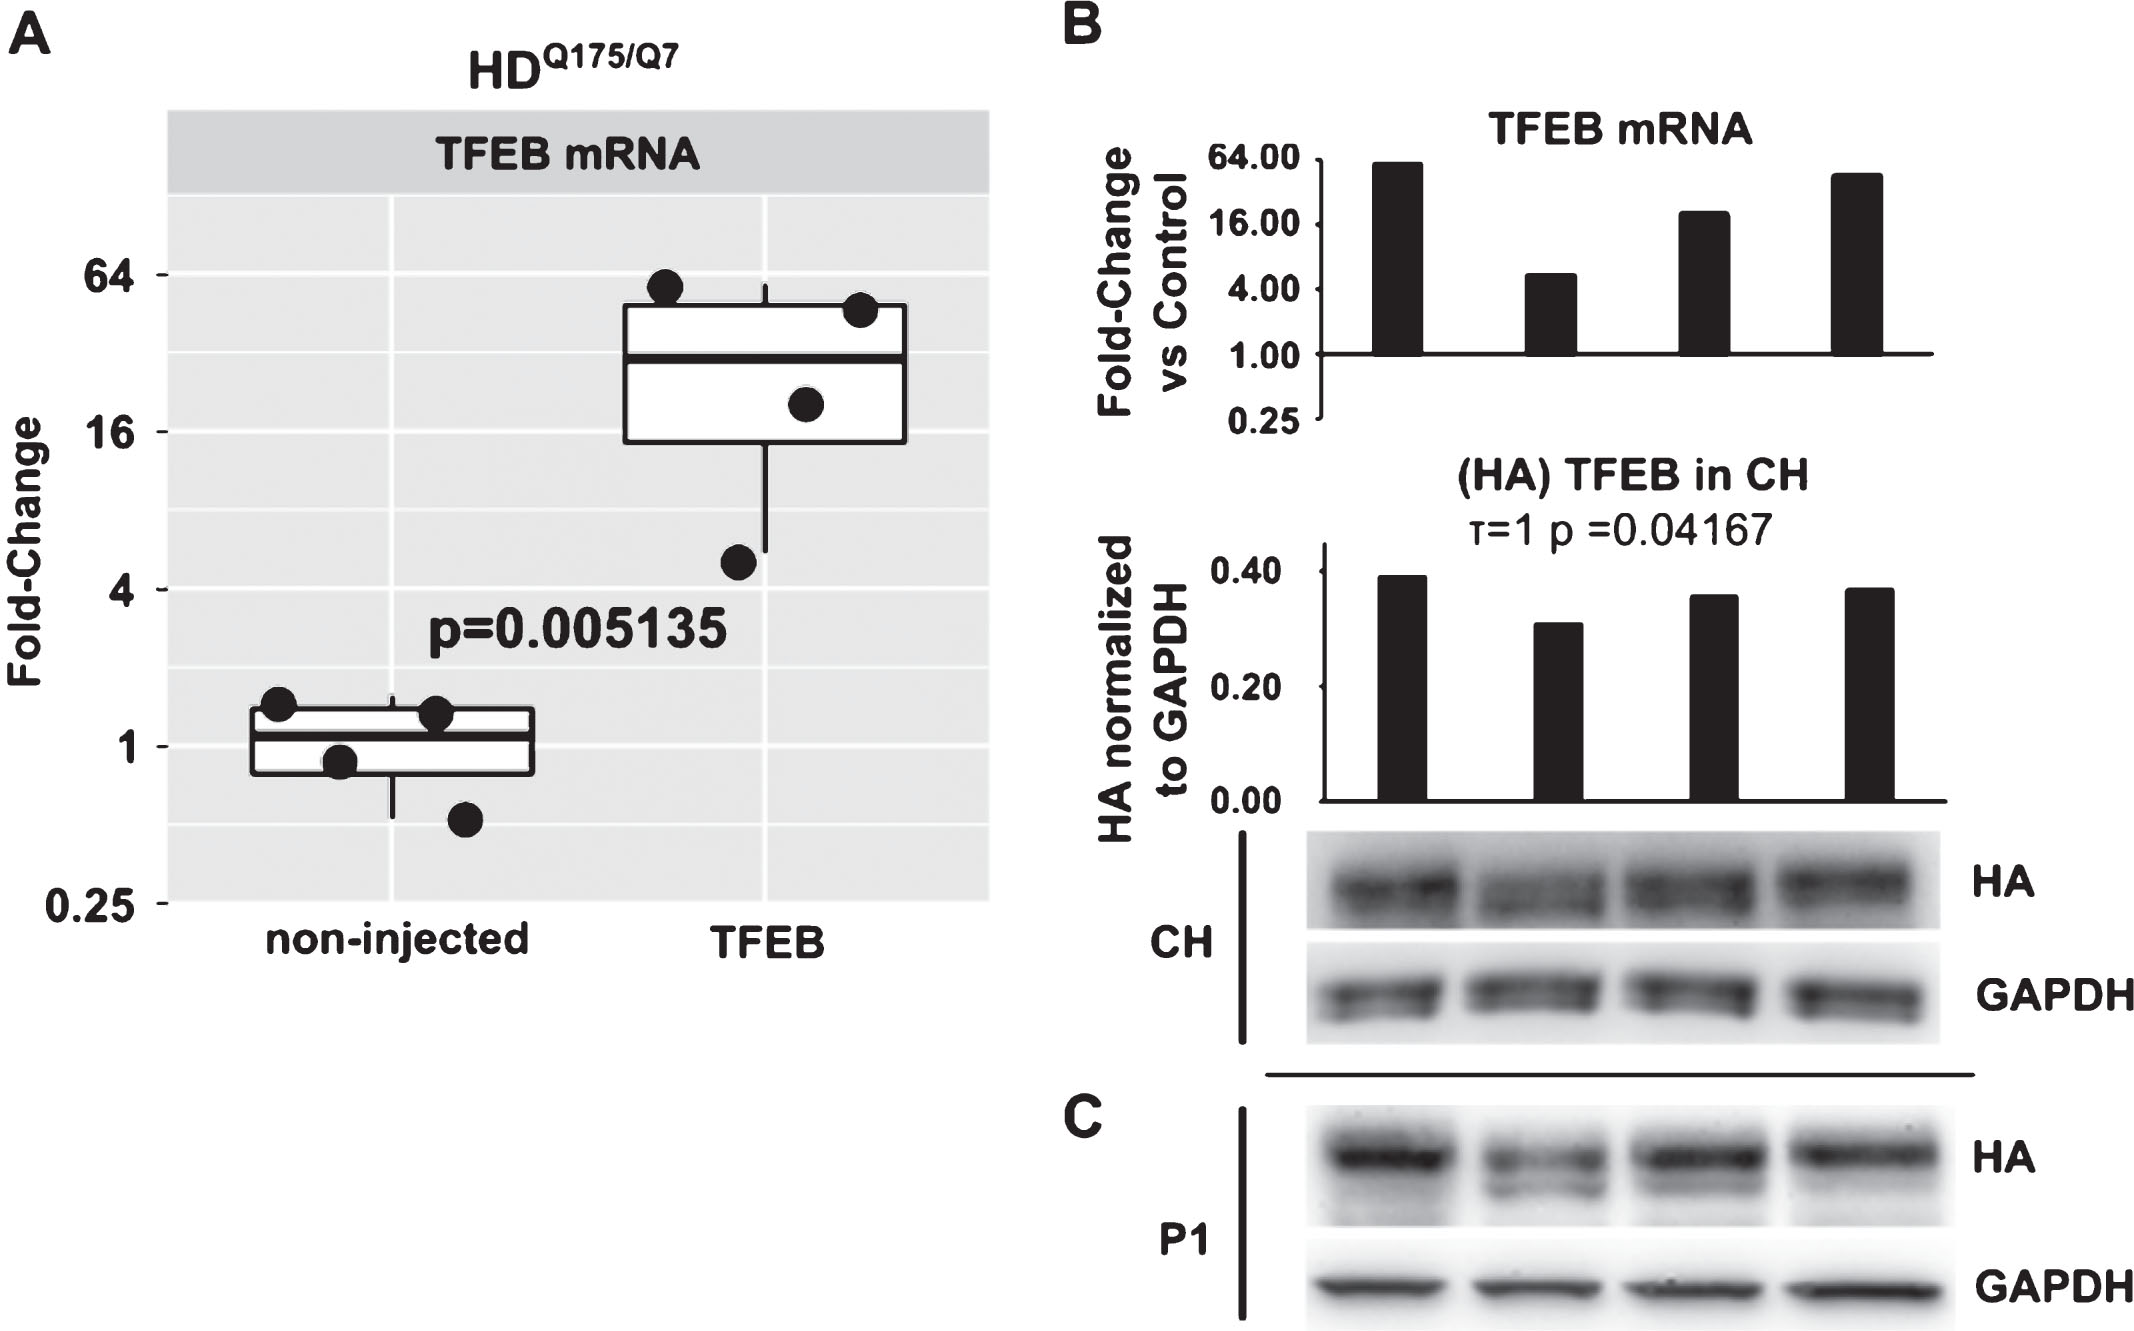
Fig.3
Activation of autophagy and reduction of mHTT in TFEB-HA treated striatum. A) Western blot analysis for LAMP-2A, LC3II, and procathepsin D (proCTSD) in crude homogenates (CH) of HDQ175/Q7 mice injected with AAV hSyn1 TFEB-HA or non-injected. B) Quantitative results of crude homogenate Western blots in A and Western blots in subcellular fractions (P1, S2 and P2). HSC70 and Rab7 in S2 fractions are included in the bar graphs along with the results for LAMP-2A. C) Western blots of HTT levels in crude homogenate (CH) and in membrane fractions P1 and P2 detected with anti-HTT aa1-100 antibody EPR5526. D) Bar-graphs represent the results of densitometry for mHTT and WT HTT on Western blots shown in C. Mutant HTT levels in the AAV hSyn1 TFEB-HA injected mice are reduced compared to the untreated mice. All mice are age matched and the injected mice were examined at 2 months post-injection. N = 4 per treatment group, p-values from unpaired t-test.
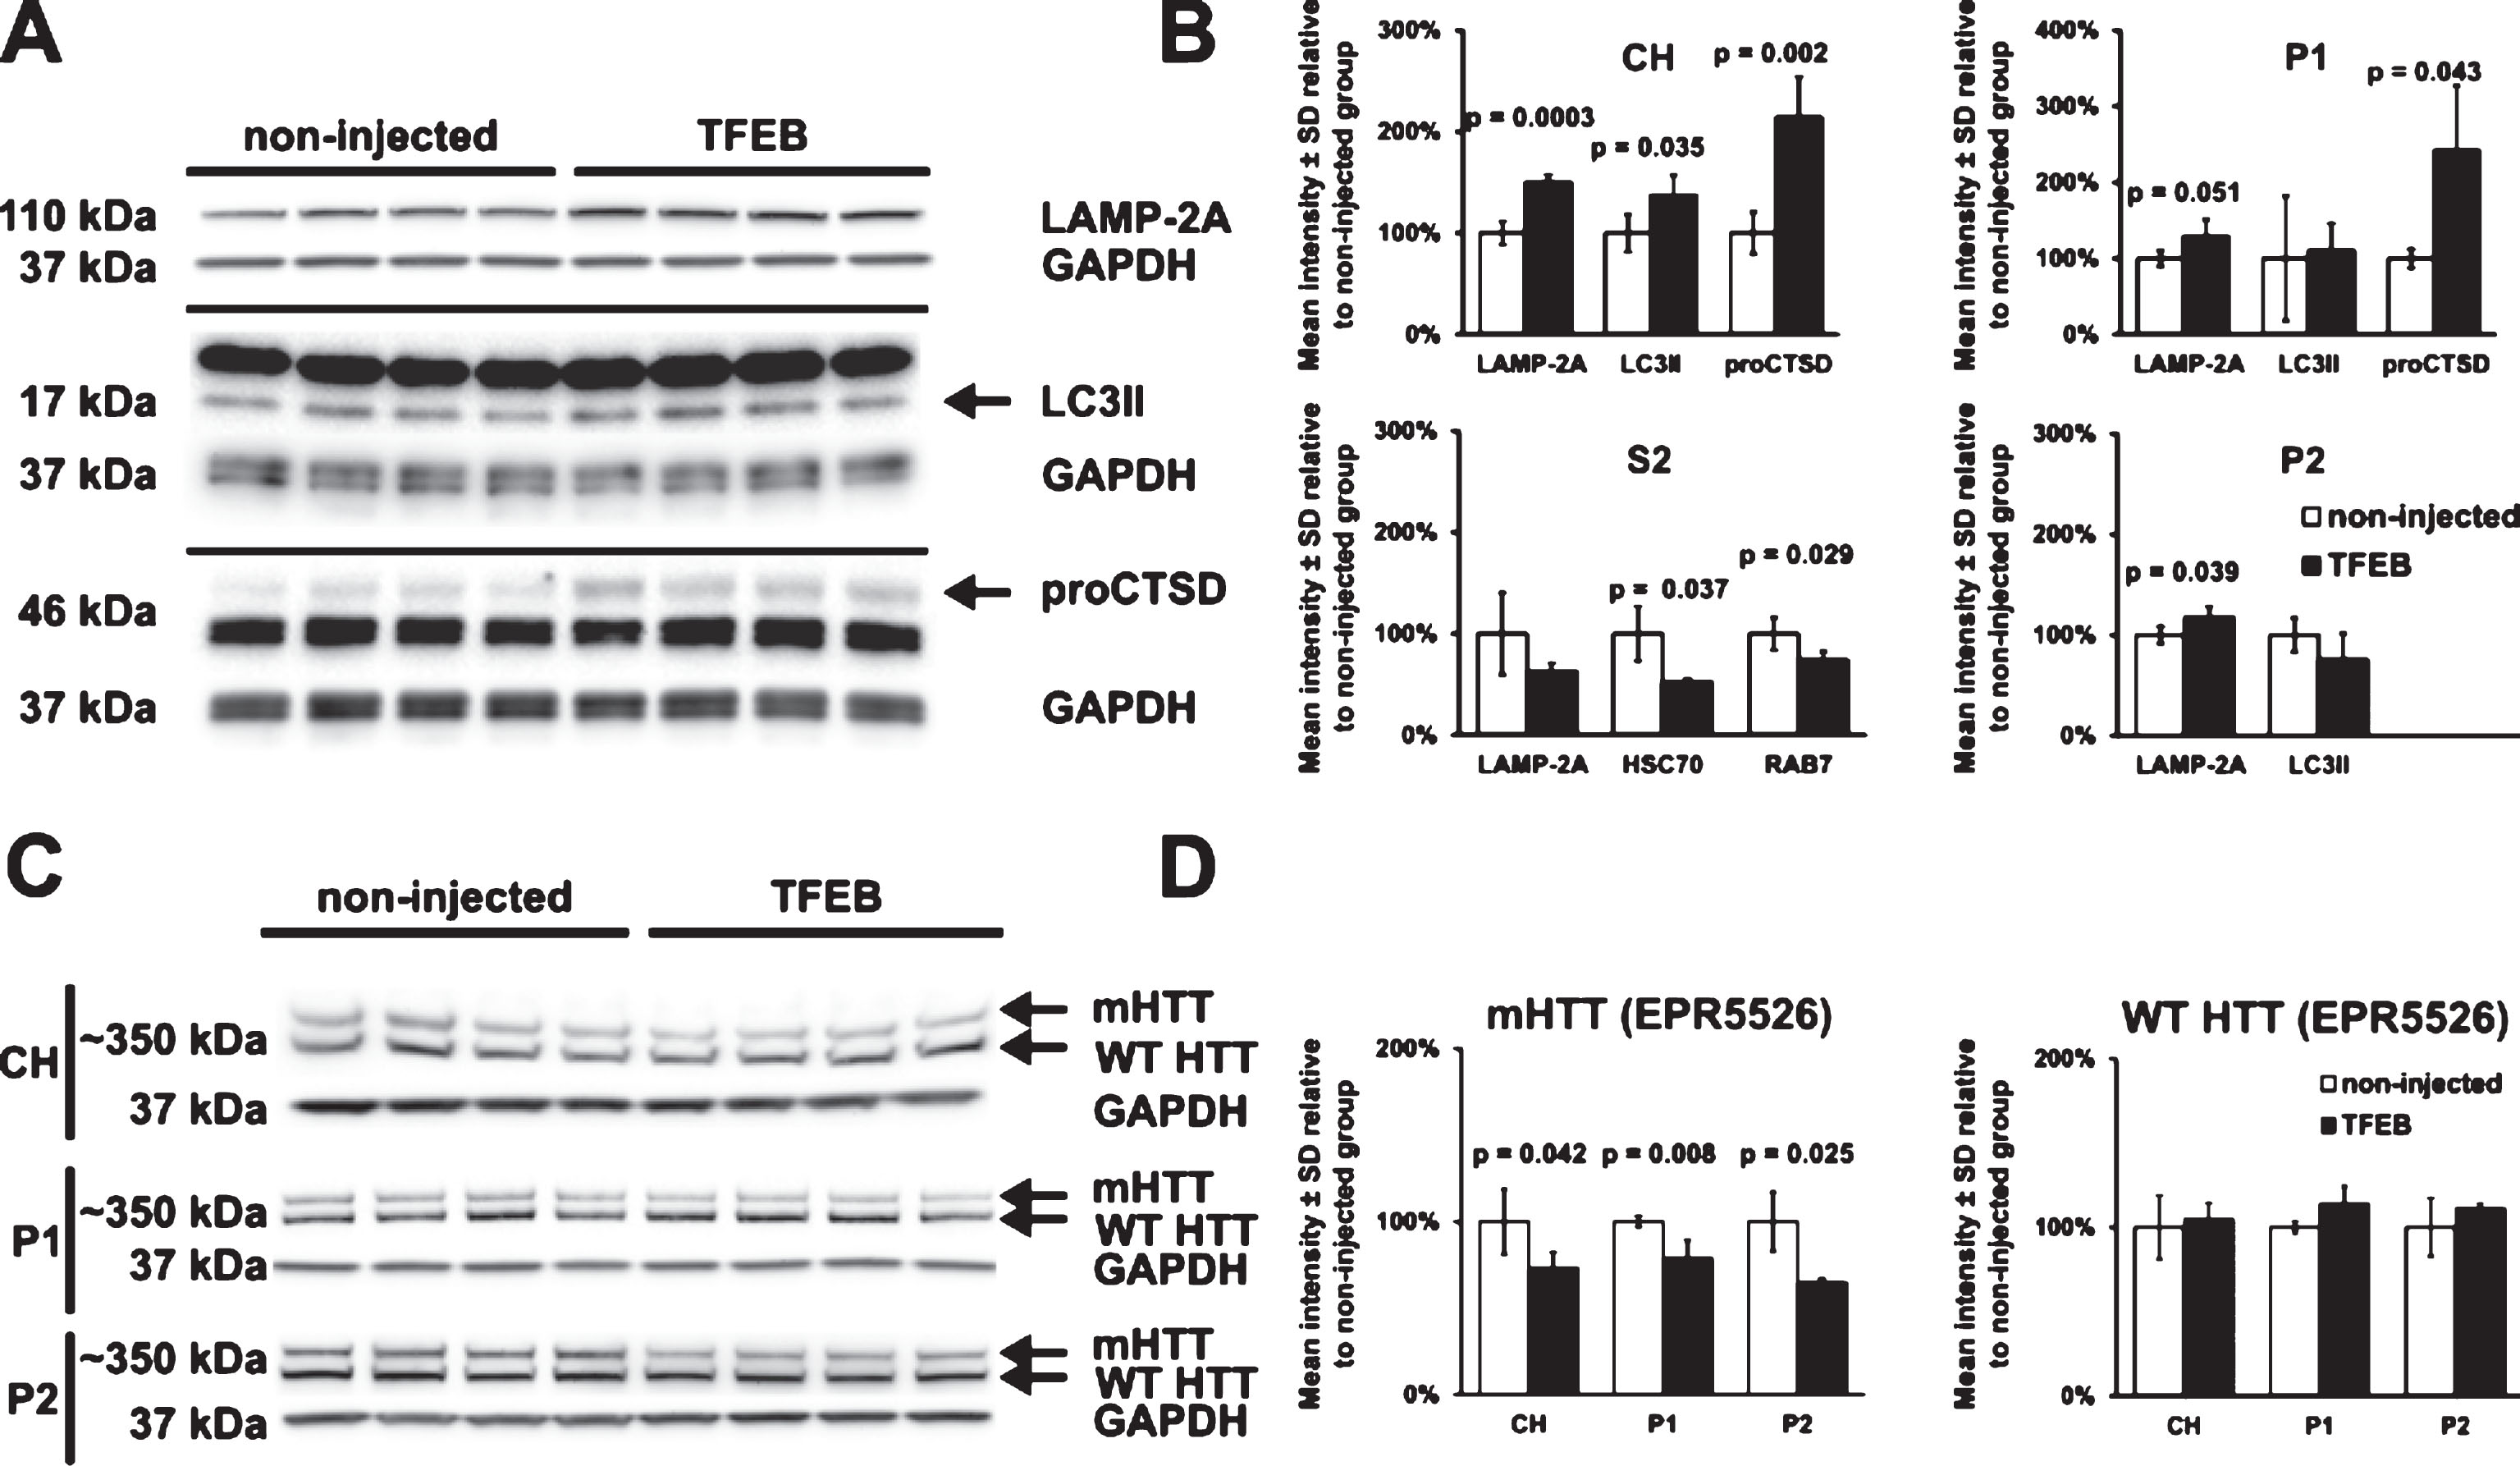
Fig.4
Western blot analysis of DARPP32, GFAP, PDE10A in striatal crude homogenates of mice injected with either AAV hSyn1 TFEB-HA or non-injected. A) Western blots for DARPP32, GFAP and PDE10A, GAPDH was used as a loading control. B) Bar graphs show results of densitometry for Western blots in A. All mice are age matched and the injected mice were examined at 2 months post-injection. Each column represents sample from a different mouse, N = 4 mice per treatment group, p-values from unpaired t-test.
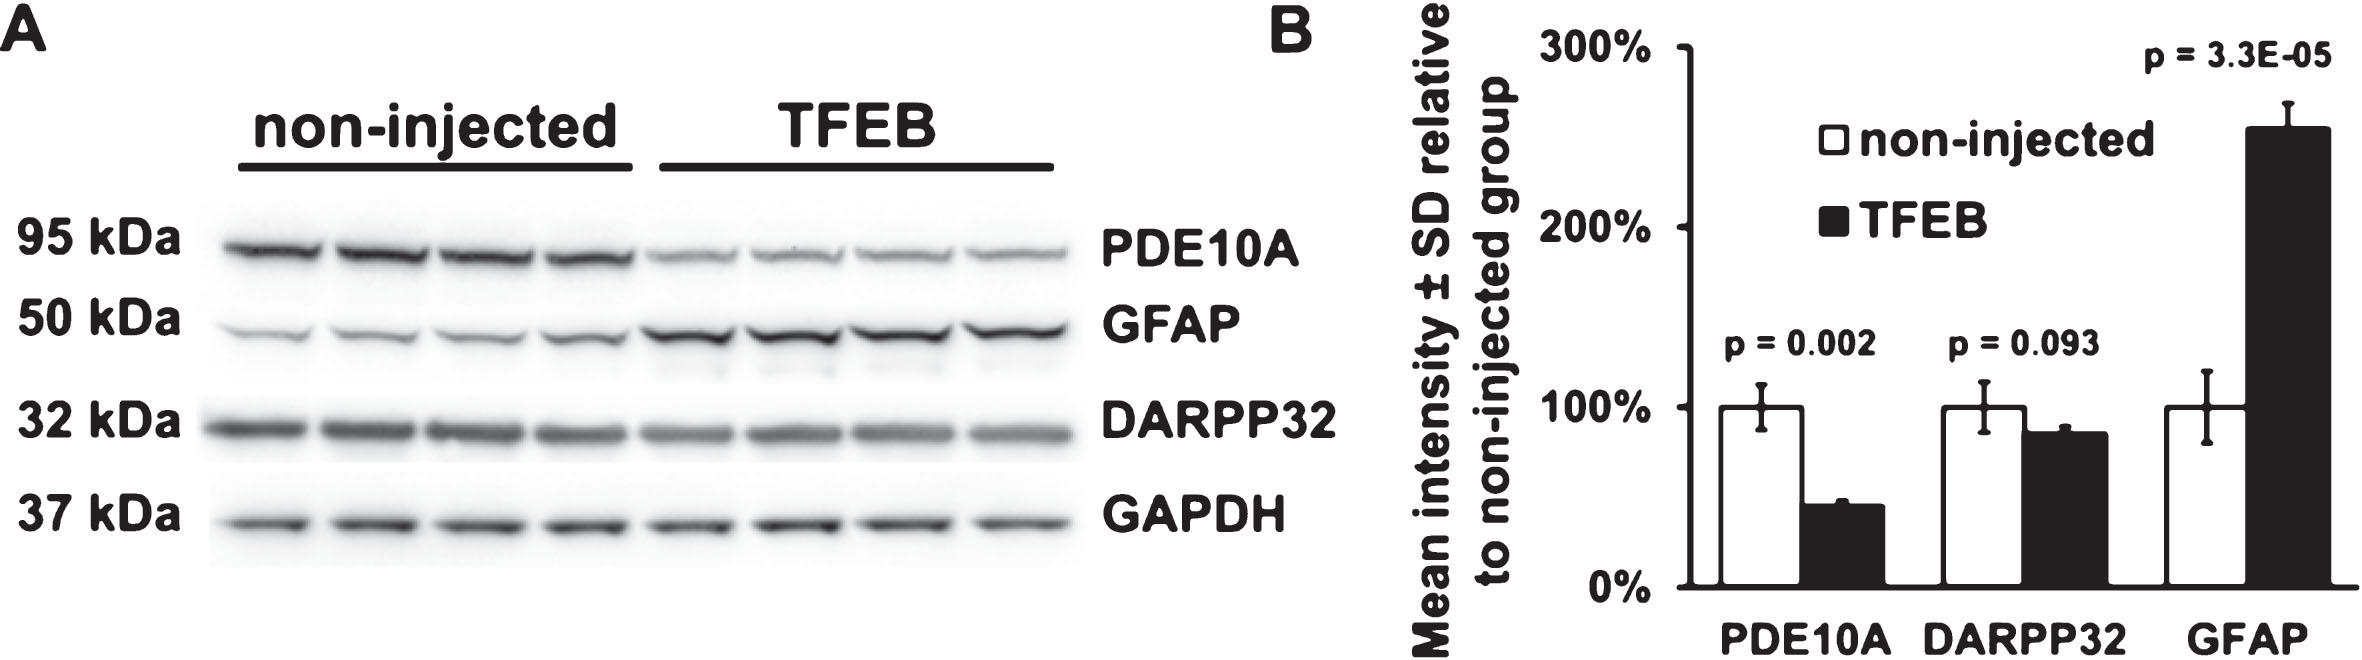
Fig.5
Western blot analysis of apoptosis and ER stress markers in striatal crude homogenates of HDQ175/Q7 mice injected with AAV hSyn1 TFEB-HA or non-injected HDQ175/Q7 and WT mice. A) Western blots for GRP78/BiP and procaspase 3 in HDQ175/Q7 mice injected with AAV hSyn1 TFEB-HA and non-injected HDQ175/Q7 and WT mice. GAPDH was used as a loading control. B) Bar graphs show results of densitometry for Western blots in A. All mice are age matched and the injected mice were examined at 2 months post injection. Each column represents sample from a different mouse, N = 4 mice per treatment group, p-values from unpaired t-test.