
Impact of COVID-19 on latent emissiveness of residents in China: Based on the X-12-ARIMA additive seasonal adjustment model
Abstract
With Census X-12 model and ARIMA model, this paper quantitatively analyzes the impact of the COVID-19 epidemic on the latent emissiveness of Chinese residents which happened at the end of 2019. The results show that: First, during this epidemic period, the overall latent emissiveness index of Chinese residents decreased by 53.51%, and showed certain spatial difference, and it is not the area with the largest number of confirmed cases, and the area with the most serious epidemic situation, the greater the loss of latent emissiveness. Second, the residents’ willingness to travel has a strong fit with the development stage of the epidemic, but there is also a certain lag. In other words, the more severe the epidemic, the lower the willingness of residents to travel; When the epidemic is under control, people’s willingness to travel will rise again, but the rise time will be delayed. Third, compared with the period of SARS in 2003, the impact of COVID-19 on China residents’ latent emissiveness is greater and more profound, three times as much as that of the SARS period. In view of the serious impact of the epidemic on Chinese residents’ willingness to travel, finally, several development suggestions are put forward on how to re-enhance people’s travel information and revitalize the tourism industry in the process of normalizing the epidemic prevention and control.
1.Introduction
At the end of 2019, an outbreak of Corona Virus Disease (COVID-19 for short) in Wuhan city of China was undoubtedly a great global emergency event, which had a fatal blow to every industry. As a modern service industry, tourism industry has been hit the hardest [1]. In order to restrain the serious impact of the spread of epidemic, the government has taken restrictive measures, such as city blockade, travel restriction, home isolation, and restriction on the operation of tourism enterprises, which leads to the rapid reduction of tourist population and tourism income. Even if the restrictions are eased, many people will choose to travel and eat out in fear of the epidemic, which indirectly makes the tourism industry bear greater losses [2]. During this, people are forced to reduce outdoor activities, scenic spots are closed, routes are reduced, and the sharp reduction of tourism activities makes many tourism enterprises on the verge of bankruptcy, making the whole tourism industry in a state of stagnation. However, with the gradual strengthening of the prevention and control of the epidemic situation in China, the number of infected people has gradually decreased, and the country has begun to release its seal slowly. At the same time, the government has launched a series of preferential policies to promote the residents to go out and tourism. Then, tourists from other places can gradually be seen in various tourist attractions, and the domestic tourism industry is gradually recovering. It thus shows that, the topic about impact of this emergency event on tourism is worthy of attention.
In the academy, about the impact of emergency events on tourism, scholars have done a lot of research in the past. For example, Khan [3], Carey and Rob [4], Goodrich [5], Anderson [6], Mao et al. [7] and other foreign scholars discussed the impact of Asian plague, Financial crisis, 9
About potential willingness to travel, Cesario [14] put forward the concept of “emissiveness”. Wu et al. [15] pointed out that emissiveness means the ability of the residents in the tourism origin area to participate in outdoor leisure and travel. And Lai and Zou [16] considered this origin tourist capacity not only reflects the residents’ tourism potential, also reflects the characteristics of tourism consumption, which is very useful to market and manage in tourism. According to the different classification criteria, it can be divided into two types, like the actual emissiveness that has occurred and the latent emissiveness that is likely to happen later [17], or can also be divided into individual emissiveness and origin emissivenes [18]. From the previous studies, most of them focus on two topics, one is the spatial characteristics of emissiveness, such as distance attenuation, mutual mobility, concentration, hierarchy and core edge relationship [19, 20]. The other is, from the age, income, occupation and other aspects, the influence factors of emissiveness are analyzed [21, 22, 23]. However, throughout these studies, it is found that the discussion of emissiveness is in the analysis of normal social and economic status, and the impact of sudden crisis on emissiveness is very few. However, as we have known before, the sudden crisis event probably has an impact on the emissiveness of residents, and it is also a tourism development problem that can not be ignored.
In the previous literature, scholars’ estimates of travel potential are usually calculated based on the general principles of consumer economics and the experience summarized in actual surveys using other existing economic statistical indicators. The frequently used economic indicators are generally divided into two categories, including income indicators and traffic indicators. Among them, income indicators mainly include per capita GDP, average wages of employees, resident consumption level, per capita disposable income, Engel coefficient, etc.; While traffic indicators are usually investigated by road density, railway density and other indicators. However, with the development of information technology and the application of big data concepts, scholars’ data collection methods have become more and more diversified. Among them, Baidu Index, has become more and more popular among scholars. Because, “Baidu Index” is an online application software based on search and analysis of Internet data launched by Baidu Chinese search engine [24]. Searched by keywords, not only it can provide massive data service based on Baidu web page and Baidu news search. But also, it can calculate the value of “user attention” and “media attention” of each keyword, and reflect the value of each keyword about the change trend of “user attention” and “media attention” in the past period of time. And through keyword, social hot information and netizens’ interests and needs can be seen clearly. Therefore, it is reliable and feasible to use the Baidu Index as a data source to study the residents’ latent emissiveness through the setting of some keywords.
So based on these above research blanks, with the help of some econometric models and monthly data, this paper firstly analyzes and evaluates quantitatively the impact of COVID-19 on latent emissiveness of Chinese residents, meanwhile extending it to 34 provincial areas in China, the regional distribution of Chinese residents’ latent emissiveness loss are revealed. Secondly, it has been investigated about the relations between the impacted degree of latent emissiveness with the number of confirmed patients in the COVID-19. Thirdly, combined with previous research results, the difference between the impact of COVID-19 and SARS on Chinese residents’ emissiveness was analyzed. Above all, it provides a new idea for knowing the impact of the great public health events on origin emissiveness and its spatial law.
2.Study design
2.1Sample and data
Before the keyword search in baidu index, by snowballing, interviews centered on the researcher were conducted with potential travel intention. The interviewees were ten people aged from 25 to 40 who had tourism experience in the past six months. Semi structured interviews were conducted around their previous Internet search habits before the start of tourism activities. Through the analysis of high frequency words in interviews, it is found that “tourism strategy”, “overseas tourism”, “domestic tourism” and “hot spots” are the most frequently searched keywords by tourists. Therefore, these four words are used as keywords to search and aggregate the Baidu Index to get the data of users from all over the country, and take them as latent emissiveness index of Chinese residents.
Although, from a global perspective, the COVID-19 epidemic is still spreading without ending. But as far as China is concerned, due to the active and strong control measures taken by government departments at all levels in the early stage of the epidemic, that is, especially from February to April in 2020, it makes the fight against the epidemic effect significant. Starting in May 2020, China Many areas have successively allowed people to go out to participate in catering or tourism activities. By August 2020, the epidemic situation in large areas across the country has basically stabilized, and people’s domestic travel activities are basically no longer restricted. Therefore, taking January 2020 to August 2020 as the complete cycle of the COVID-19 outbreak in China is in line with the development cycle of the emergency in China. Although since then, China has still implemented epidemic prevention and control measures, and has imposed restrictions on individual epidemic areas from time to time, but they are generally small-scale and individual regions. It can be considered as a normalized management for the post-epidemic situation, so it doesn’t affect the selection of the time span of this study. However, in view of the fact that the search volume before 2011 has not been disclosed on Baidu Index, so the time range of search needs to be set from January 2011 to August 2020, amount to 116 sets of monthly data. Also, due to the lack of data of Macao before 2017, the amount of data is too small to be analyzed.
2.2Measures of variables
This article mainly involves four variables: latent emissiveness, Impaired travel ability, location conditions, and severity of the epidemic.
Latent emissiveness of residents in a certain area during a certain period of time is represented by the overall daily average search value of residents in each area on the Baidu index platform during a certain period of time. The data is real which comes from the two ports of the PC and mobile terminals, but not includes the number of appearances in news headlines. While, the predicted value of the latent emissiveness is also talked about, and then it is a simulated value based on the actual value of the latent emissiveness of each area in the past ten years simulated by the ARIMA model.
Impaired travel ability means the negative impact of COVID-19 on residents’ latent emissiveness. It can be calculated by comparing the predicted value of travel capacity with the actual value and using the gap ratio [25]. It can be expressed as:
Location conditions is a quantitative parameter that integrates many natural and social conditions of regional development, such as resources and environment, transportation, energy, labor, economy, technology, and government management. It can be expressed by the location index. The location index of each provincial area is based on that Beijing is taken as the center, according to the connection degree of railway passenger traffic volume based on O-D survey, it is divided into 8 grades, which are calibrated by the ordinal value of 8-1.
Severity of the epidemic refers to the infection status of COVID-19 transmission in various regions, and the specific number of confirmed cases can be expressed. in each region it refers to the total number of new confirmed cases per day from January to July 2020, which is found at the official websites of local health commission.
2.3Research method
Because of the seasonality of tourism and some previous research experience [26, 27], when discussing the travel potential of residents in tourist source areas, monthly time series are used as the observation unit, which is usually affected by seasonal factors, which often conceal other changes in economic development and cause difficulties for us to analyze the macroeconomic and financial situation. Therefore, when conducting economic analysis on monthly or quarterly time series, the influence of seasonal factors must be removed, and seasonal factors must be removed from the original series. This is called “seasonal adjustment”. Regarding the application research of seasonal adjustment methods, the two most widely used methods are X-12-ARIMA and TRAMO/SEATS. These two methods have their own advantages and disadvantages. Generally speaking, TRAMO/SEATS will have a better fitting effect on a longer time series, while the X-12-ARIMA method is more suitable for a relatively short time series. Serial data, but in principle, there should be more than 8 years of data. Given that the length of the research data in this paper is 10 years, the X-12-ARIMA model is more appropriate.
The X-12-ARIMA model was proposed by the Census Bureau of the US Department of Commerce in the 1990s. It consists of the X-12 method and the Autoregressive Integrated Moving Average Model (ARIMA). The X-12 method is a seasonal adjustment method based on the moving average method. The ARIMA model compensates for the missing end items of the moving average method by extending the original sequence. The X-12-ARIMA model includes two typical decomposition forms of seasonal adjustment, namely, the multiplicative model and the additive model. Its form is as follows: (1) Additive model means
When using the X-12-ARIMA model, this paper first uses the Census X-12 additive seasonal adjustment model to analyze the monthly series data of latent emissiveness of the national residents, and it summarizes the fluctuation of latent emissiveness index of Chinese residents under the COVID-19 epidemic situation. Then it uses ARIMA model to predict latent emissiveness index of national residents from January to August in 2020. Finally, by comparing the predicted value with the actual value, the impact degree of COVID-19 epidemic on latent emissiveness of the national residents was identified. According to this research process, latent emissiveness index of residents in each provincial area was simulated and predicted in order to investigate the spatial difference of the epidemic impact.
2.4Data analysis procedure
The specific data analysis procedure includes the following seven steps.
Step 1 is Exclude seasonal effects. Through the observation of the time series of the national residents’ latent emissiveness index from January 2011 to December 2019 in China, and in combination with the seasonal development law [28]; Of the tourism industry, residents travel more frequently in spring, summer and major holidays, while in autumn and winter, it shows obvious seasonal characteristics. Because the seasonal fluctuation will cover up and confuse other objective laws of residents’ latent emissiveness, only by eliminating the influence of seasonal factors can the data of different seasons be directly compared [29]. Therefore, this paper uses the additive model of census X-12 model to adjust it seasonally. The adjusted sequence diagram is shown in Fig. 1.
Figure 1.
Time series which is excluding seasonal fluctuation.
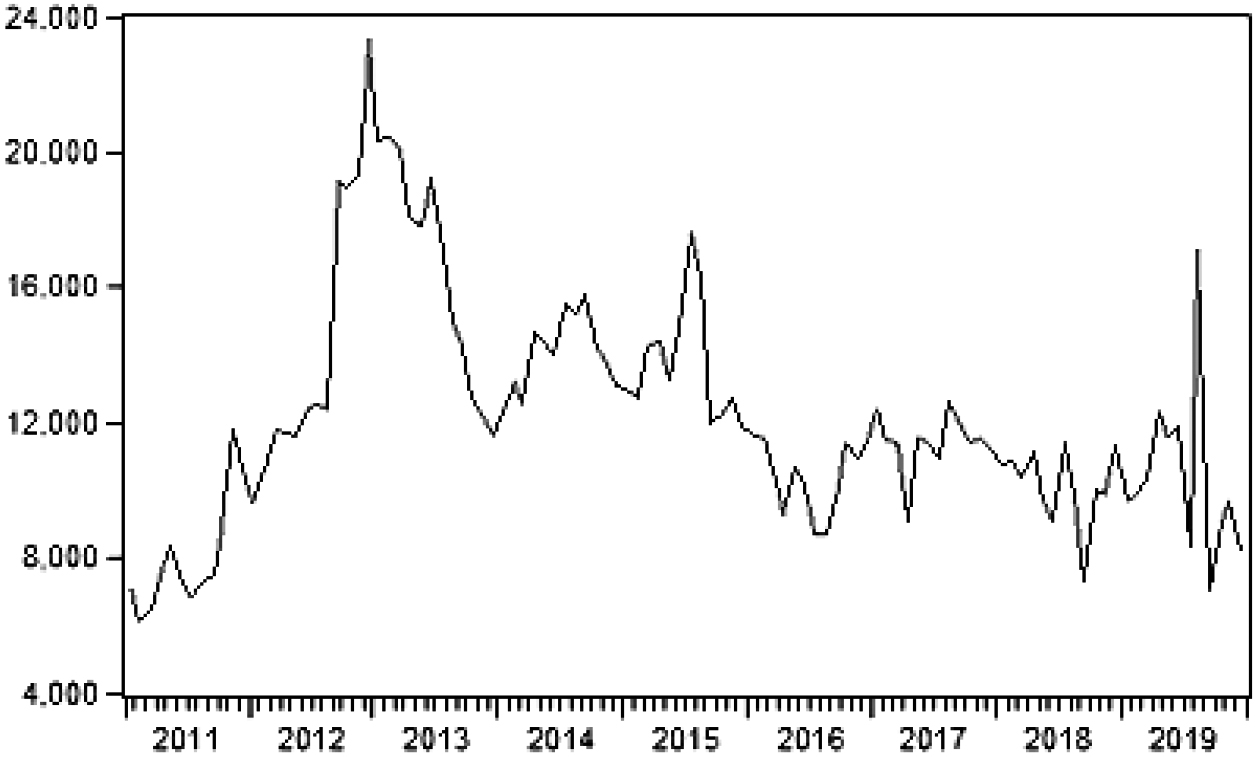
Step 2 is Unit root test. First of all, the unit root test is carried out on the monthly data of residents’ latent emissiveness index after seasonal adjustment. the original hypothesis is accepted at 1%, 5% and 10% confidence levels, indicating that there is unit root in the seasonally adjusted data. Therefore, the First-Order Difference (FOD) is conducted. As shown in Fig. 1, the first-order difference obtained at 1%, 5%, 10% significant levels rejects the original hypothesis and it explains that the monthly data of national residents’ latent emissiveness index after the seasonal adjustment is stable.
Step 3 is Model Identification. According to the test, it is known that the time series data is a first-order non-stationary process. the Auto-Correlation (AC) graph and Partial Correlation (PC) graph of stationary sequence after FOD are both trailing. Therefore, so ARIMA model can be used to simulation the travel intention of national residents under the COVID-19 epidemic situation. Since the first order of autocorrelation function is significant, it will decrease sharply from the second order. Therefore, the Q value of the model is firstly set to be 1, and the partial correlation function is significant in the first order and then it dropped a lot in the second order. Therefore, the model ARIMA (1, 1, 1) is initially established by setting the value of P in the model to be 1, and by FOD.
Step 4 is Model estimation. And then, the model of ARIMA (1, 1, 1) was estimated by Least Square Method. It can be seen that R
Step 5 is Model Identification. Next, first of all, the sequence correlation test is carried out on the model residuals. Through the values of auto-correlation function, partial correlation function, q-stat and the value of p, the value of p is less than 0.05 at the 3rd order of lag and greater than 0.05 at the 4th order of lag, indicating that residual is non white noise and the model fitting is relatively general. Meanwhile, because the AC and PC values of the model residual auto-correlation test fail to pass the significance test when the lag order is 3, so by increasing the lag length of the model, and then judging according to the Akaike Information Criterion value (AIC), we can see that when
Table 1
The correlation results
| Correlation coefficient | LLE | LI | NC | PV |
|---|---|---|---|---|
| LLE | 1.00 | – | – | – |
| LI | 0.30 | 1.00 | – | – |
| NC | 0.08 | 0.16 | 1.00 | – |
| PV | 0.98 | 0.32 | 0.08 | 1.00 |
Note: Since the number of confirmed cases in August 2020 is not yet complete, only July is analyzed here.
Figure 2.
AC and PC in ARIMA (1, 1, 2).
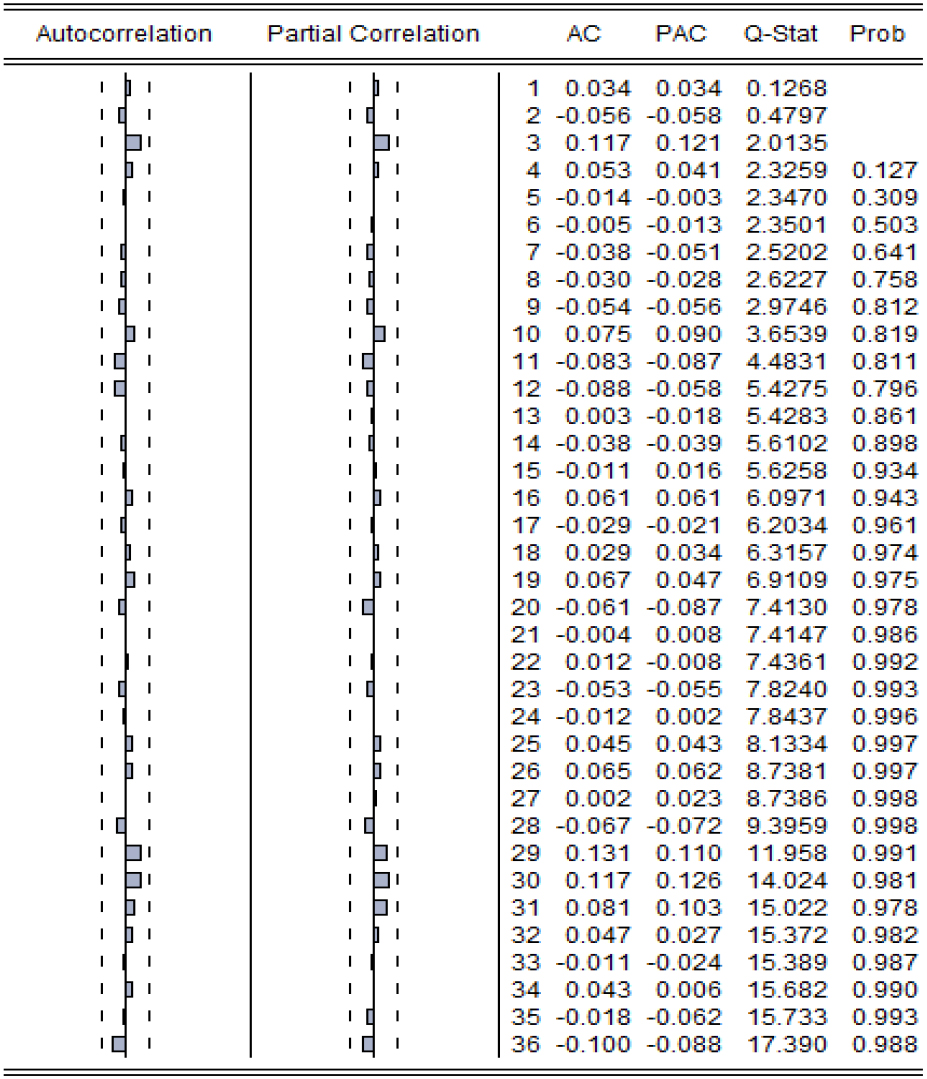
Step 6 is Model prediction. Then, ARIMA (1, 1, 2) model is used to predict latent emissiveness index of national residents in China from January 2020 to August 2020. At the same time, this model is used to predict the tourism capacity of each provincial area from January 2020 to August 2020, and all of them have passed the model test, so it is appropriate to use this model to predict. Finally, the simulation results are compared with the actual data, and then the author uses the gap ratio [25] to clearly reflect the comparison.
Step 7 is Analysis relevance. calculate the relevance between the loss of latent emissiveness and the number of confirmed in the COVID-19. The Correl function is used to calculate separately the correlation between the loss of latent emissiveness (LLE), the location index (LI), the number of confirmed (NC) in the COVID-19 and the predicted value (PV) of each region, and the results areas shown in Table 1. Among them, LLE of each provincial area refers to the sum of the loss value of each month from January 2020 to July 2020 in each provincial area. The monthly loss is the difference between the actual value and the simulated value. the location index of each provincial area is based on that Beijing is taken as the center, according to the connection degree of railway passenger traffic volume based on O-D survey, it is divided into 8 grades, which are calibrated by the ordinal value of 8-1. Severity of the epidemic in each region refers to the total number of new confirmed cases per day from January to July 2020, which is found at the official websites of local health commission. PV are obtained from the ARIMA model. In particular, in view of the integrity and availability of the data, only 31 regions are analyzed here, excluding Hong Kong, Macao and Taiwan.
3.Results
3.1Influencing characteristics
According to the results of the gap ratio, ArcGIS 10.2 software is used to visualize the data of each region. In order to show the greatest difference, the “natural breakpoint classification method” is selected, as shown in Fig. 3.
Figure 3.
Distribution of travel capacity loss of Chinese residents from January 2020 to August 2020.
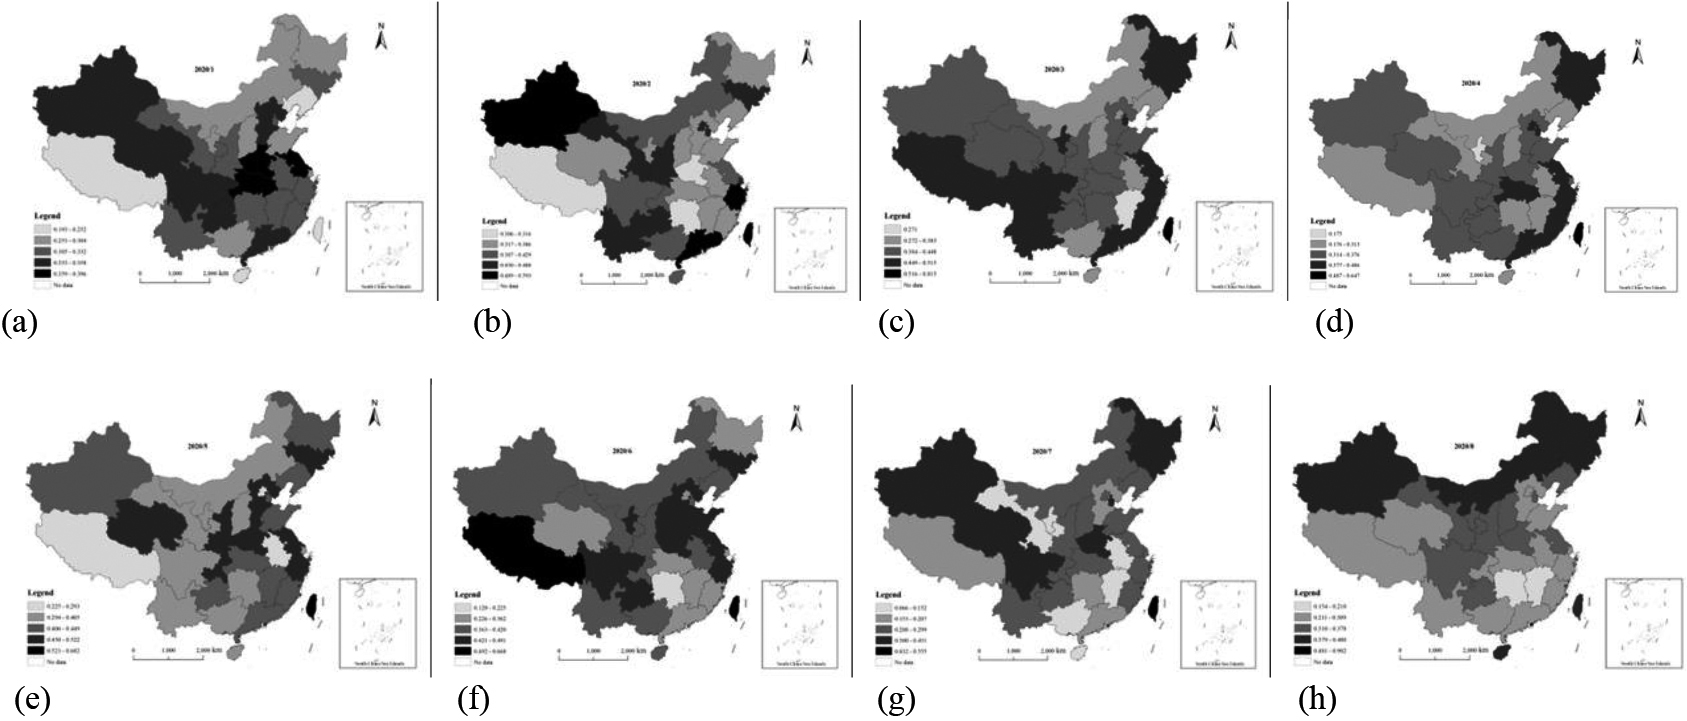
In terms of the geographical scope affected, the average damage rate of the latent emissiveness of whole residents in China reached 53.51%, that is to say, it was reduced by more than half. Among them, Taiwan area has the largest degree of damage, with an average of 60%, while Anhui Province, which has the smallest average degree of damage, also has 28.49%. This shows that the impact of the COVID-19 epidemic is regional and comprehensive for China. The impact is so great that the whole tourism industry has suffered huge losses. However, in particular, although Hubei Province is the most serious area of this epidemic, the average affected degree is about 36%, which is only at a medium level. In contrast, Taiwan and Hong Kong have suffered a very high degree of damage, and the loss of residents’ latent emissiveness has not decreased in the past two months. At the highest time, Hong Kong suffered the damage of 90.5%, which almost means the overall stagnation of tourism industry. Compared with Hong Kong and Taiwan, the reason why latent emissiveness of residents affected by the epidemic in mainland China has decreased less is because, with the gradual strengthening of the compulsory prevention and control of this epidemic situation in China, the number of infected people has gradually decreased, and many areas in mainland China has begun to slowly unseal. Since then, many local government also have launched a series of preferential policies such as issuing consumption coupons, etc., residents begin to walk out freely, and tourists from overseas can gradually be seen in various scenic spots, and the domestic tourism industry has a momentum of recovery. However, the travel potential of residents in Hong Kong and Taiwan has dropped significantly because of geographical location and immigration control policies. However, due to the particularity of location, Taiwan, Hong Kong did not pass customs clearance with other areas in China during the epidemic period, while their tourism development largely depends on tourists from other areas in China. Therefore, the epidemic has a very great impact on the tourism industry of Taiwan and Hong Kong.
In terms of the time range affected, in February and March, the degree of damage to latent emissiveness of residents all over the country reached the lowest, and began to improve gradually in June. The outbreak of the epidemic occurred at the end of 2019. After being highly valued by the government in January 2020, closed management and control began to be adopted throughout the country in order to control the spread of the epidemic. As the center of epidemic situation, Wuhan city implemented closure measures for the whole city from January 23, 2020. During this period, it precisely coincided with major traditional festivals such as the Spring Festival and the Lantern Festival. In previous years, it was the peak season and peak period for residents to travel, which was in sharp contrast to this year, making the impact of the epidemic in February and March reached the maximum. Similarly, May is usually the golden time for residents to travel. But at this time in this year, the epidemic situation has not been completely controlled, so the impact degree in all regions of China is still relatively large [30]. However, in July and August, with the gradual control of the epidemic situation, the number of confirmed cases is becoming less and less, and the residents’ access is no longer restricted, the government encourage people to go out for consumption, so the willingness of residents to travel around has increased significantly [31], and the damage degree for Chinese residents’ latent emissiveness has decreased significantly. In conclusion, the epidemic situation is developing in a good direction, the impact on Residents’ tourism is becoming smaller, and the willingness to travel is increasing.
3.2Influencing factors
According to the correlation results, it can be found that the correlation between the loss of latent emissiveness and the number of confirmed cases is not very close, because the correlation coefficients are very small, all less than 0.5. Similarly, in his study of SARS in 2003, Xue and Sun [32] also found that the elasticity coefficient of the number of confirmed cases in SARS to tourists flow loss in China was only 2.02%, and the relationship was also not significant. In other words, it is not the area with the largest number of confirmed cases, and the area with the most serious epidemic situation, the greater the loss of latent emissiveness. This conclusion can also be seen from the gap ratio value calculated above. For example, Hubei Province, which has the most serious epidemic situation in COVID-19 and the largest number of confirmed cases, has more than 60 000 confirmed cases, while its average loss of latent emissiveness is 36.07%, which is only at a medium level. Tibet, which has the smallest number of latent emissiveness, has only one patient, but its average loss of latent emissiveness is also 31.28%. Therefore, it can be seen that there is no significant relationship between the loss of latent emissiveness and the number of confirmed cases. There are probably two possible reasons: On the one hand, China has taken timely and good epidemic prevention and control measures during the COVID-19 epidemic. Since January 23 in 2020, Wuhan city was closed down, and the epidemic situation has been effectively contained. Since March, there have been zero new cases in other regions, so the number of new confirmed cases has not spread indefinitely. On the other hand, the decline of the residents’ latent emissiveness is not caused by the transmission of people in the process of tourism, but more because people are worried about their personal safety and give up travelling. At the same time, the widespread spread of the epidemic also makes people have a sense of fear, resulting in the decline of latent emissiveness. This reason was put forward by Xue and Sun [32] based on the analysis of SARS in 2003.
4.Discussion
The previous analysis found that the impact of COVID-19 on the travel potential of residents in various parts of China is very large, and from the severity of the epidemic, the location situation and other aspects, some interesting phenomena have been found. However, the differences in the impact of the epidemic in various regions cannot be analyzed simply from these factors, as shown in articles published by individual scholars. It can also be comprehensively discussed from factors such as climate factors [33, 34], geographical environment [35], traffic factors [36, 37] other environmental factors [38], population density [39], block time [40] and regional economic conditions [41]. Of course, when discussing the impact on the tourism industry, in addition to discussing the impact on residents’ travel potential, you can also analyze the changes in tourism-related companies such as financial status [42, 43] and tourists’ consumption behavior [44, 45]. These should be research topics that deserve special attention from scholars in the tourism field in the future.
Figure 4.
Comparison of the impact of (a) SARS and (b) COVID-19 on the travel potential of Chinese residents.
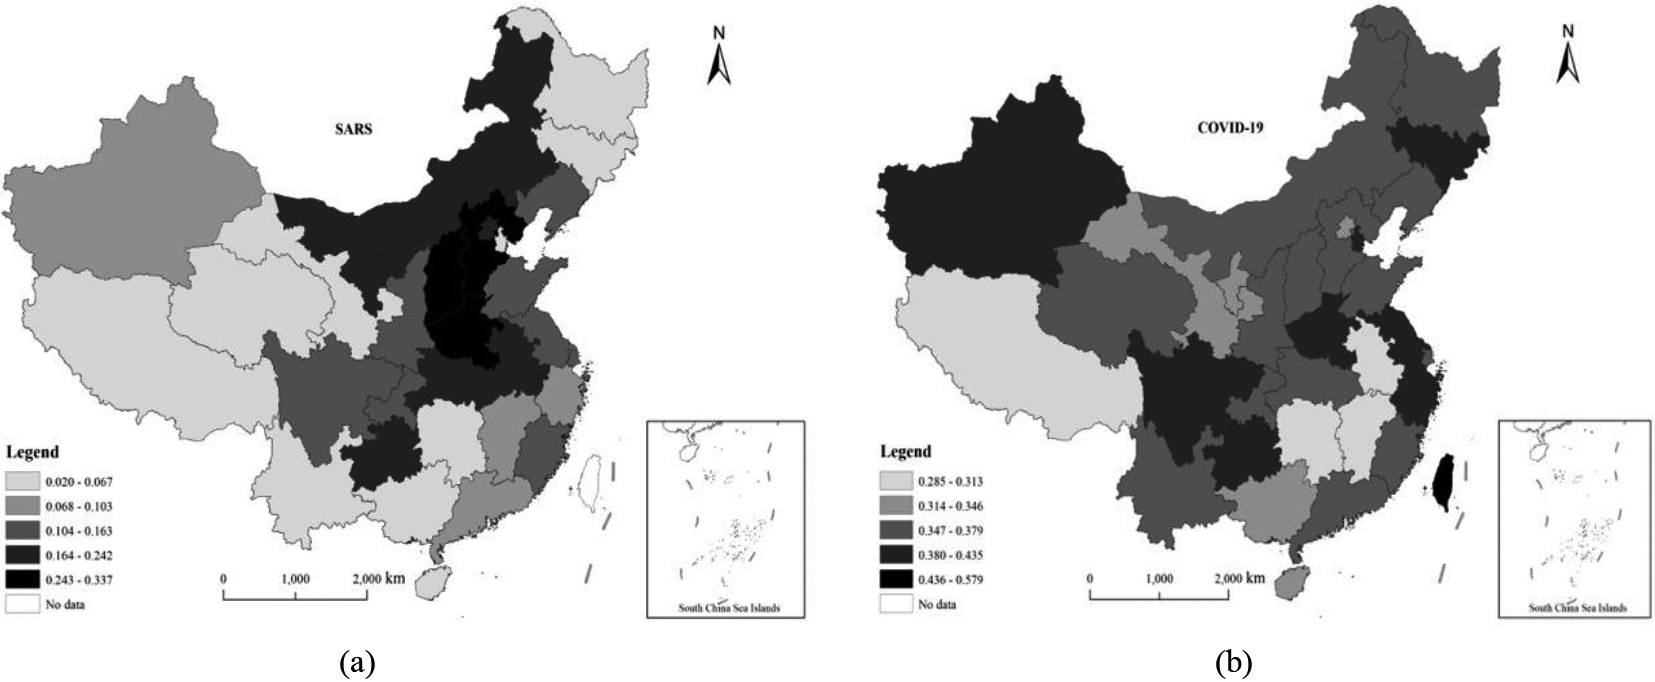
In addition, similarly, as a great public health event, SARS in 2003 had a very serious impact on the development of China’s tourism industry as the COVID-19 in 2019 (Fig. 4). Therefore, it is necessary to compare the impact of their two events on tourism, especially for tourist volume. When making comparisons, the extent of the impact of SARS on latent emissiveness of Chinese residents is the research conclusion of an article, the author of this article is Xue and Sun, published in 2010, while the impact of COVID-19 uses the conclusions of this research. Xue and Sun [32] used the method of tourism background trend line to find that the average loss rate of tourist volume caused by SARS crisis in all provincial areas in 2003 is 12.9%. And there is a great difference in the loss of domestic tourism between SARS crises, and the loss rate of tourists in Hebei Province is the largest which is 30.7%, while that in Heilongjiang Province is the smallest which is 2%. Correspondingly, the COVID-19 epidemic caused an average loss of tourist volume in all provincial areas is 37.02%. And there is a great difference in the loss of domestic tourism between SARS crises, and the loss rate of tourists in Taiwan is the largest which is 57.9%, while that in Anhui Province is the smallest which is 28.5%. It can be seen that the impact of COVID-19 is three times that of SARS, which means that the impact of COVID-19 on tourism is full scope, not local. Also, we need to pay more attention to the restoration of tourism in the future. Xue and Sun [32]discovered that the loss ratio of domestic tourists is related to the number of confirmed SARS cases. The more severe the SARS area is, the greater the loss of tourists in SARS crisis is. The COVID-19 epidemic also showed some similar characteristics. For example, at first, the COVID-19 epidemic early occurred in Wuhan, Hubei Province. Therefore, in the first month of the outbreak in January, the loss of latent emissiveness in Hubei was as high as 36.98%, while relatively low in other regions. However, because of the wide spread and highly infectiousness and invisibility of the COVID-19 epidemic, the number of confirmed cases in other areas has been found one after another after Hubei, so the loss rate of latent emissiveness in other regions gradually became very high since February and March. In particular, in Xinjiang, the early stage in COVID-19 epidemic was not a high incidence area. Until the outbreak of large-scale confirmed cases in mid-July, in 2020, this area began to be closed for prevention and control, and has not yet been unsealed. Therefore, the loss rate of residents’ latent emissiveness in Xinjiang is still at the level of 44.71% in August, even though at the same time the loss rate of other regions in China have showed a downward trend. Therefore, the COVID-19 epidemic also showed the synchronous characteristics of the epidemic’s severity and the loss rate of tourist flow like SARS. But the difference is that the impact of the COVID-19 epidemic is comprehensive, while the impact of SARS is relatively local. therefore, the impact scope of the COVID-19 epidemic on tourism is nationwide, while the impact scope of SARS is relatively concentrated. Specially, Hong Kong, Macao11 and Taiwan have suffered heavy losses in their residents’ latent emissiveness index in the COVID-19. In particular, the loss of Hong Kong in August in 2020 was as high as 90%, far higher than that in other regions. It can be seen that the impact of the epidemic on Hong Kong, Macao and Taiwan is higher than that in other regions. This phenomenon in the COVID-19 was also confirmed during SARS [46]. Therefore, Hong Kong, Macao and Taiwan maybe become the key areas for future tourism recovery.
Also, we can see that in responding to these two public health emergencies, the government’s handling attitudes at the beginning of the outbreak are also very different in China. For example, in the early stage of the SARS outbreak, due to the lack of a corresponding crisis management mechanism by the government, some government officials adopted an information blockade attitude. They only “digested and handled” internally and kept secrets to the outside world. As a result, the spread of the epidemic was serious, rumors spread, and the government’s credibility followed. The decline has also caused a certain amount of social panic. In order to stabilize people’s hearts, the then Minister of Health did not hesitate to conceal the truth at the press conference to cover up the truth of the epidemic. Even the WHO personnel who came to Beijing were also concealed, defrauding them to cancel the SARS epidemic area. Subsequently, as the situation of the epidemic is not optimistic, some government officials are unable to disclose information about the epidemic and fight the epidemic. On the contrary, in the early stage of the COVID-19 outbreak, the handling attitude of government departments was particularly positive and firm compared to the early stage of SARS. For example, firstly, do a good job in information release and international cooperation. Disseminate epidemic information in a timely, open and transparent manner, objectively report the progress of the epidemic and the prevention and control measures taken by the government, and scientifically disseminate knowledge of epidemic prevention based on facts. At the same time, continue to actively strengthen the epidemic information communication with the World Health Organization, relevant countries and Hong Kong, Macao and Taiwan regions, share epidemic monitoring, investigation, prevention information and risk assessment opinions in a timely manner, and jointly discuss and improve epidemic prevention and control measures. Secondly, deploy the national health system to strengthen on-duty duty, spare no effort to treat patients, and minimize deaths. Thirdly, timely and powerful control measures were taken in areas where the epidemic was particularly severe, such as the lockdown order in Wuhan and other places, which effectively contained the critical period of large-scale spread of the new crown virus. Fourthly, intensify scientific research on epidemic prevention and control, and give full play to the power of experts to identify the source of infection, the route of transmission, develop antiviral drugs, and develop vaccines as soon as possible, which has improved the scientificity and effectiveness of epidemic prevention and control. Therefore, the government’s response attitude and measures in the face of crisis events are also one factor which caused the two crisis events to bring different impact on tourism in China.
5.Conclusions
Through the analysis of the impact of the COVID-19 epidemic on the travel potential of Chinese residents, it can be seen that the travel enthusiasm of residents under the epidemic has been greatly affected, and the tourism industry has also been hit hard. However, with the advancement of epidemic prevention and control work in various places, the epidemic has been better controlled. In the post-epidemic era, how to restore people’s travel confidence and revitalize the tourism industry will be a long-lasting and arduous task. Specifically, it can be expanded from the following aspects: From the government level, on the one hand, we must do a good job in the prevention and control of the epidemic, on the other hand, we must orderly promote the resumption of production and business in the tourism industry. First of all, we must continue to do a good job of financial support, financial credit policies, tax reduction and exemption policies, social security policies, and stable employment policies, and orderly opening up guidelines, especially the implementation of some policies for small, medium and micro enterprises. Secondly, consider launching a number of tourist routes such as red tourism, ice and snow tourism, and national cultural parks in conjunction with the century-old Chinese party and the upcoming Winter Olympics to attract people to travel. Third, pay attention to the timely disclosure of various data during the epidemic, strengthen people’s daily health and safety publicity, and enhance people’s travel confidence. Finally, promote the integrated development of technology and tourism, and develop smart tourism. It is necessary to promote the in-depth integration of related information technologies such as the Internet, big data, and artificial intelligence with the tourism industry, and provide services such as time-sharing appointments, traffic monitoring, and digital guides to improve the quality of tourism services. From a social perspective, the mass media must establish a correct value orientation, avoid propagating negative concepts such as the end of the world, and actively advocate citizens to bravely leave their homes to eliminate the shadow of the epidemic. At the same time, through live broadcast or e-commerce, or by borrowing the influence of social celebrities, online marketing channels for tourism products can be increased, and people’s willingness to travel can be subconsciously driven. From a personal perspective, we must first do personal hygiene and stick to a safe distance of one meter when going out. In addition, during the period of normalized control of the epidemic, short-distance tourism activities such as rural tourism and suburban tourism can be carried out nearby to avoid crowds. At the same time, we must strictly abide by the policies and regulations of various departments and regions of the country during the epidemic period, and strengthen collective awareness.
After analyzing the impact of this COVID-19 epidemic, it is helpful to accurately evaluate loss of tourists affected by the crisis event, which is useful to grasp the law of the impact of the crisis, and to provide a scientific basis for the selection of this crisis management means and the formulation of tourism recovery policies. However, this epidemic has not really ended, even some foreign countries is still in a large number of transmission, the sustainability and scope of the impact is still expanding. Whether the long-term closure and immobility brought about by the epidemic will lead to retaliatory and blowout reverse growth in people’s travel potential after the epidemic is over is also a topic of particular concern. In addition, this study only selects the data of 8 months after the outbreak of COVID-19 to analyze its effect on tourists. So the follow-up research can put the follow-up impact of this epidemic into a longer period, such as selecting the development of tourism in 5 or 10 years after the outbreak of COVID-19 to study the follow-up effect of this epidemic event.
Notes
1 Although this paper does not analyze Macao, but through the news and other network resources, Macao is also very high degree of damage on residents latent emissiveness.
References
[1] | D. Gursoy and C.G. Chi, Effects of COVID-19 pandemic on hospitality industry: Review of the current situations and a research agenda, Journal of Hospitality Marketing & Management 29: (5) ((2020) ), 527–529. |
[2] | H.J. Song, J. Yeon and S. Lee, Impact of the COVID-19 pandemic: Evidence from the US restaurant industry, International Journal of Hospitality Management 92: ((2020) ). |
[3] | H. Khan, Asian contagion: Impact on Singapore tourism, Annals of Tourism Research 28: ((2001) ), 224–226. |
[4] | G. Carey and L. Rob, Modeling and forecasting tourism demand for arrivals with stochastic nonstationary seasonality and intervention, Tourism Management 23: ((2002) ), 499–510. |
[5] | J.N. Goodrich, September 11, 2001 attack on America: A record of the immediate impacts and reactions in the USA travel and tourism industry, Tourism Management 23: ((2002) ), 573–580. |
[6] | B.A. Anderson, Crisis management in the Australian tourism industry: Preparedness, personnel and postscript, Tourism Management 27: ((2006) ), 1290–1297. |
[7] | C. Mao, C.G. Ding and H. Lee, Post-SARS tourist arrival recovery patterns: An analysis based on a catastrophe theory, Tourism Management 31: ((2010) ), 855–861. |
[8] | W.Q. Ruan and Y.Q. Li, The impact and spatial difference of natural disaster crisis on tourist demand, Economic Geography 38: ((2018) ), 214–223. |
[9] | Y.Y. Fu, Q.B. Song and J.J. Kang, Evaluation of the impact of disaster crisis on regional tourism: Based on the synthetic control method, Tourism Tribune 34: ((2019) ), 124–134. |
[10] | G.X. Cheng and X.L. Yu, Impact of immigration tourism on the border areas emergencies, Economic Geography 35: ((2015) ), 204–208. |
[11] | H.D. Luan, External shocks and tourism development: A case of SARS, Statistics & Information Forum 24: ((2009) ), 66–69. |
[12] | L.P. Wu and J. Zhang, A study on the damage pattern and the impact mechanism of China’s inbound tourism in crisis events, Tourism science 30: ((2016) ), 37–51. |
[13] | L.J. Ma and G.N. Sun, Influences of crisis in late thirty years to China’s tourism and their comparison, Economic Geography 29: ((2009) ), 1005–1010. |
[14] | F.J. Cesario, Alternative model for spatial choice, Economic Geography 52: ((1976) ), 363–373. |
[15] | B.H. Wu, F. Fang and W.D. Yin, Emissiveness and destination choice behaviour of shanghainese in their weekend recreation, Human Geography 12: ((1997) ), 17–23. |
[16] | S.Z. Lai and Y.G. Zou, The Evaluation of tourism area’s origin emissiveness: A case study of Gutian Tourism Area in Fujian, Economic Geography 36: ((2016) ), 194–200. |
[17] | H.Y. Zheng and J.G. Bao, The regional diversity of Latent Domestic Emissiveness (LDE) in Guangdong Province, Areal Research and Development 20: ((2001) ), 70–74. |
[18] | S.E. Zhong, J. Zhang, L.X. Ren, H. Luo, M. Li and X.W. Dong, A study of the provincial emissiveness in china based on the socio-economic properties, Economic Geography 29: ((2009) ), 153–159. |
[19] | S.E. Zhong, L.X. Ren, Z.X. Jiang, H. Luo and J.H. Guo, A hypothesis of socio-economic phenomenon about travel capability in tourism-generating regions, Tourism Tribune 23: ((2008) ), 18–23. |
[20] | Y.H. Fan, Evolvement of temporal-spatial pattern of Latent Domestic Emissive ness (LDE) in Central Plains Economic Region (CPER), Economic Geography 35: ((2015) ), 195–201. |
[21] | M. Jansen-Verbeke, A regional analysis of tourist flows within Europe, Tourism Management 16: ((1995) ), 73–82. |
[22] | D.G. Pearce, Domestic tourist travel in Sweden: A regional analysis, Geographiska annaler 78: ((1996) ), 71–84. |
[23] | Y.L. Zhao, A discussion of new factor and analysis method subjecting to the study of latent domestic emissiveness, Areal Research and Development 2: ((2006) ), 52–56+100. |
[24] | Y.G. Zou, W.L. Lin and X.M. Zheng, Spatial-temporal characteristics and influential factors of network attention to tourism security, Tourism Tribune 2: ((2015) ), 101–109. |
[25] | J.H. Huang and J.C.H. Min, Earthquake devastation and recovery in tourism: the Taiwan case, Tourism Management 23: ((2002) ), 145–154. |
[26] | C. Zhou and X.G. Feng, On the seasonal characteristics, fluctuation cycle and development trends of Shanghai’s inbound tourist market: Based on X-12-ARIMA and HP filter method, Tourism Science 6: ((2016) ), 39–53. |
[27] | P. Chaitip and C. Chaiboonsri, Forecasting with X-12-ARIMA and ARFIMA: International tourist arrivals to India, Annals of the University of Petrosani: Economics, IX: (3) ((2009) ), 147. |
[28] | G.N. Sun, Some responses to the doubt of whether tourism develops with certain rules, Tourism Science 22: ((2008) ), 1–4. |
[29] | M. Topsakal and F. Tacan, Exact travelling wave solutions for space-time fractional klein-gordon equation and (2+1)-dimensional time-fractional zoomeron equation via auxiliary equation method, Applied Mathematics and Nonlinear Sciences 5: (1) ((2020) ), 437–446. |
[30] | K.S. Al-Ghafri and H. Rezazadeh, Solitons and other solutions of (3+1)-dimensional space-time fractional modified KdV-Zakharov-Kuznetsov equation, Applied Mathematics and Nonlinear Sciences 4: (2) ((2019) ), 289–304. |
[31] | Q.S. Wang and S.H. Liu, Impact of COVID-19 epidemic situation on the travel intention and behavior of domestic tourists, Areal Research and Development 39: ((2020) ), 1–5. |
[32] | G. Xue and G.N. Sun, Post evaluation of SARS in 2003 to domestic tourism in China – loss estimation in 31 provinces based on background trend line, Economic Geography 28: ((2008) ), 1059–1063. |
[33] | K.A. Rosario Denes, S. Mutz Yhan, C. Bernardes Patricia and A. Conte-Junior Carlos, Relationship between COVID-19 and weather: case study in a tropical country, International Journal of Hygiene and Environmental Health 229: ((2020) ), 113587. |
[34] | M. Coccia, How do low wind speeds and high levels of air pollution support the spread of COVID-19? Atmospheric Pollution Research 12: (1) ((2021) ), 437–445. |
[35] | M. Coccia, Factors determining the diffusion of COVID-19 and suggested strategy to prevent future accelerated viral infectivity similar to COVID, Science of the Total Environment 729: ((2020) ), 138474. |
[36] | M.A. Sahraei, E. Kukapan and M.Y. Odur, Public transit usage and air quality index during the COVID-19 lockdown, Journal of Environmental Management 286: ((2021) ), 112166–112166. |
[37] | M.A. Sahraei, E. Kukapan and M.Y. Odur, Impact of COVID-19 on public transportation usage and ambient air quality in Turkey, Promet-Traffic & Transportation 33: (2) ((2021) ), 179–191. |
[38] | M. Coccia, The effects of atmospheric stability with low wind speed and of air pollution on the accelerated transmission dynamics of COVID-19, Journal: International Journal of Environmental Studies 78: (1) ((2021) ), 1–27. |
[39] | Y. Diao, S. Kodera, D. Anzai, E.A. Rashed and A. Hirata, Influence of population density, temperature, and absolute humidity on spread and decay durations of COVID-19: A comparative study of scenarios in China, England, Germany, and Japan, One Health 12: ((2021) ), 100203. |
[40] | M. Coccia, The relation between length of lockdown, numbers of infected people and deaths of COVID-19, and economic growth of countries: Lessons learned to cope with future pandemics similar to COVID-19, Science of The Total Environment 775: ((2021) ), 145801. |
[41] | M. Yechezkel, A. Weiss, I. Rejwan, S. Ben-Gal and D. Yamin, Human mobility and poverty as key drivers of COVID-19 transmission and control, BMC Public Health 21: (1) ((2021) ), 596. |
[42] | J. Yeon, H.J. Song, H.C. Yu, Y. Vaughan and S. Lee, Are socially responsible firms in the U.S. tourism and hospitality industry better off during COVID-19? Tourism Management 85: ((2021) ), 104321. |
[43] | AA. Salisu, L.O. Akanni, X.V. Vo, Volatility spillovers and hedging effectiveness between health and tourism stocks: Empirical evidence from the US, International Review of Economics and Finance 74: ((2021) ), 150–159. |
[44] | I. Arbulú, M. Razumova, J. Rey-Maquieira and F. Sastre, Can domestic tourism relieve the COVID-19 tourist industry crisis? The case of Spain, Journal of Destination Marketing and Management 20: ((2021) ), 100568. |
[45] | J. Im, J. Kim and J.Y. Choeh, COVID-19, social distancing, and risk-averse actions of hospitality and tourism consumers: A case of South Korea, Journal of Destination Marketing and Management 20: ((2021) ), 100566. |
[46] | J.G. Yu and L.H. Wang, Evaluation of the number of inbound tourists in China after SARS – based on ARIMA model, Statistics & Decision 14: ((2005) ), 84–87. |


