
Diffusional analysis and textural properties of coated strawberries during osmotic dehydration treatment
Abstract
BACKGROUND:
The use of polysaccharide based edible coatings as a barrier against the solute entry of high caloric constituents, such as sucrose, is a suitable strategy to develop pro-healthy osmo-dehydrated products.
OBJECTIVE:
This work aims to study the effect of a calcium alginate film over the drying kinetics of strawberries during an osmotic dehydration (OD) treatment at 60°Brix, 4 h, 40°C (sucrose). Also, textural parameters were evaluated.
METHODS:
It was determined the changes in some selected physical properties, such as: moisture, total solid contents, one-dimensional shrinkage and texture, at 30 min steps during OD treatment. Besides, water and solid diffusion coefficients (
RESULTS:
Diffusion coefficients for water and solids showed significant differences due to coating presence as an evidence of the barrier effect. Coated strawberry samples presented several changes after 2 h of OD treatment at the assayed conditions for most of the parameters evaluated.
CONCLUSIONS:
Alginate coating at the tested conditions acts as a barrier to sucrose influx and to water outflux until 2 and 3 h of OD treatment, respectively. Besides, a good textural quality for osmotically-dehydrated strawberries was obtained.
1Introduction
Strawberry (Fragaria x ananassa spp.) as a seasonal and perishable fruit, undergoes a wide variety of biochemical changes during maturity that affect directly the nutritive and sensorial quality of the fresh product. These fruits are important sources of dietary components such as vitamins and minerals, as well as several phytonutrients that are potentially beneficial to human health and could be used against some chronic diseases including cancer and cardiovascular disorders [1]. Against the natural development of deteriorative reactions, man has devised homemade techniques to extend the shelf-life of perishable foods [2]. However, during process and storage steps, strawberries can be affected by many adverse changes due to heat treatments that industry usually applies to significantly modify the overall quality of the final product [3]. Among them, dehydration appears as one of the earliest preservation methods to remove water from different fresh raw materials [4]. Dehydration process usually includes pre-treatments or pre-processing steps in order to retard chemical or biochemical reactions that could affect the quality of the final product. This is the case of blanching and osmotic-dehydration (OD) pre-treatments [5–7]. Under certain OD operating conditions, large undesirable solute uptake and greater changes in the fruit constituents may adversely affect the sensory and nutritional attributes of fresh product. It has been reported that changes were favoured by high temperatures and longer processing times [8]. Focusing on alternatives to improve the final quality of the OD products, barrier technologies and combined methods to obtain best quality dehydrated products have been a focus of interesting research in the last decades [9–12]. Among the different treatments applied, in a preliminary stage, the use of edible coatings and films, covering fruits and vegetables, were used to promote the reduction of several solute and gas transports such as moisture, O2 and CO2. These edible coatings not only act as a barrier against external factors, but they are also used as carriers of food additives in order to improve the antimicrobial protection, appearance, texture and taste during storage [13, 14]. Polysaccharide-based edible coatings such as alginate (ALG) are often used due to their capacity to form stable gels [15]. In this sense, Matuska et al. [11] have defined several properties that edible coatings are expected to have during osmotic membrane processes. ALG coatings accounted most of those qualities, for instance: gel strength, simple and rapid film formation, high water diffusivities and maintenance of the coating in solid state without dissolving into the osmotic solution. By using suitable conditions, it may allow faster treatments reducing losses of desirable constituents while inhibiting solute penetration into the sample, among others [16, 17]. Moreover, in Argentina’s seacoast, a large amount of brown seaweed such as M. Pyrifera is available for the production of alginates salts, nevertheless industrial production in Argentina has not started yet [18].
On the other hand, users are more concerned about the consumption of healthy products, such as those lower in sugar content, as long as they cover their expectations in taste. Thus, the development of low sugar products with good sensory quality is of paramount importance to meet the requirements of today’s consumer. In this sense, the use of polysaccharide based coatings as barriers against the solid entry of high caloric constituents, such as sucrose, is a suitable strategy to make a new generation of osmotically dehydrated products, widely used as confectionary, ice creams and pastry ingredients [19]. In this regard, preservation of the nutritive and bioactive constituents has been an important focus of research over decades. However, in recent years, quality concept has been extended and sensorial quality aspects have become an integral part in modern formulation of foodstuffs [20]. In fruit derivatives products, the sugar content and the aromatic profile, were traditionally described as sensorial quality indicators. In addition, physical quality indicators are also intimately related to sensorial quality, encompassing aspects as colour, texture, geometric shape, shrinkage, rheology and structure of food materials [19, 21, 22]. Regarding physical indicators, shrinkage and hardening are considered the most important physical changes taking place during drying of fruits. Therefore, microstructure modifications and chemical changes affecting saccharides and proteins are, in some cases, responsible of the negative impact on rehydration ability of dehydrated fruits [23].
The influence of edible coatings on the OD parameters in coated strawberries and the determination of the effective diffusivity values (De) during a final drying step by using a microwave oven were previously studied [24]. From the results obtained, it has been concluded that the application of strawberry coatings during the tested conditions of osmotic dehydration constitute an efficient procedure to significantly reduce the solids gain without affecting the loss of water. This work aims to focus on the behaviour of strawberry samples coated with alginate films exposed to OD treatment by the determination of the water and solid diffusion coefficients (
2Materials and Methods
2.1Samples preparation
Strawberries (Fragaria x ananassa) were purchased from a local market in La Plata (Argentina), in ripe state and stored up to 2 days at 5°C until being osmotically-dehydrated. After being wiped with water and drained with blotting paper to remove the excess of external impurities, samples were hand cut into slices along their longitudinal axis (<5 cm) by using a special calibrated acrylic box and a long knife. Normally, 2 or 3 slices could be obtained per fruit, edges being rejected. Samples were subjected to a two-step combined treatment that include: coating application and OD treatment; this procedure is described in the next sections. The initial thickness values were 1.31 cm and 1.19 cm for non-coated and coated samples, respectively.
2.2Samples coating
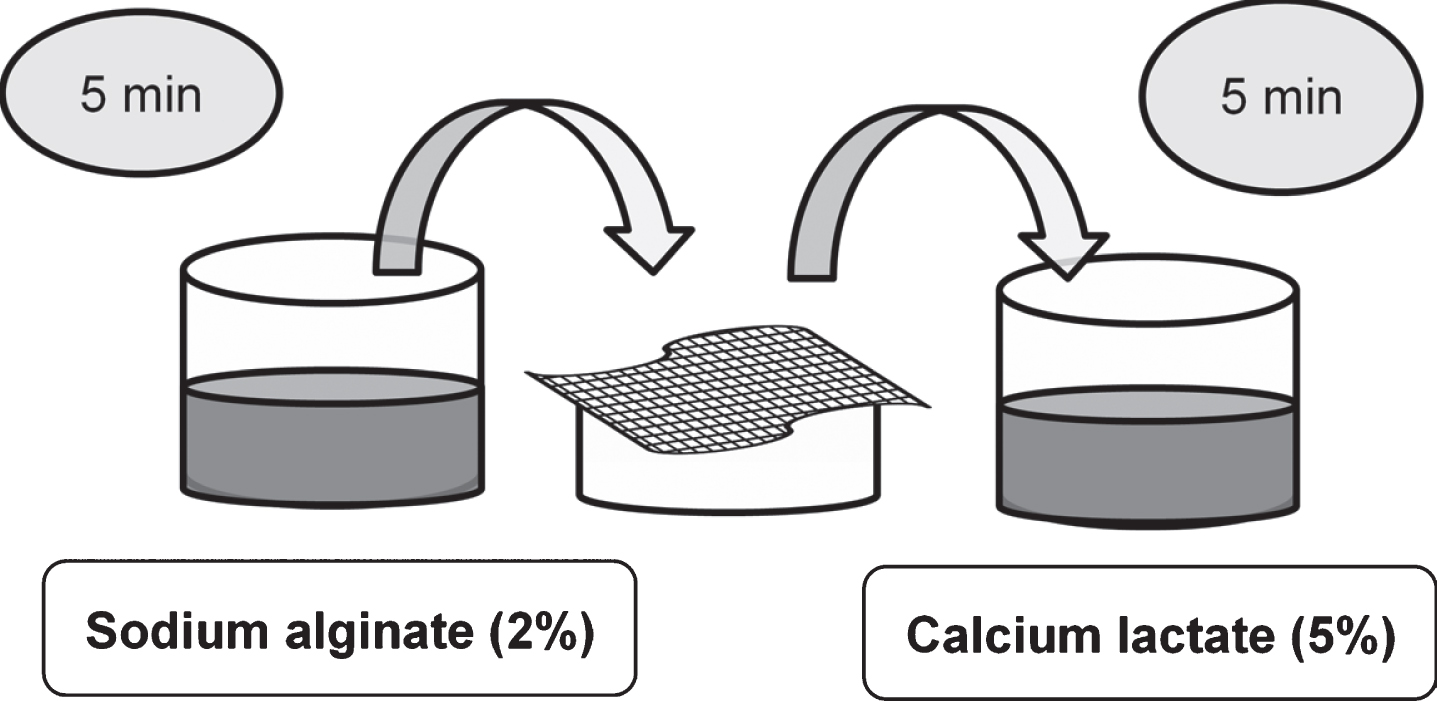
The edible coating was prepared from sodium alginate solutions (2% w/w) (NaAlg, SKU-180947, Sigma Aldrich) and calcium lactate solutions (5% w/w) (CaLac, SKU-C8356, Sigma Aldrich) as previously reported [24]. Distilled water was used for preparing the coating solutions. Fresh strawberries were weighed and dipped for 5 min in the sodium alginate coating solution. Then they were drained for 1 min in a plastic mesh and dipped for 5 min in 5% calcium lactate solution. After being drained the coated slices were left on blotting paper to remove surface excess of coating solution. Figure 1 shows the procedure to form the coating used to cover the strawberry slices.
Fig. 1
Schematic representation of the coating procedure to cover strawberry slices.
2.3Osmotic dehydration treatment
The samples of strawberry were individually weighed (coated: 8.99±1.00 g; non-coated: 7.77±1.52 g) and immediately treated. A half portion of the strawberry slices were coated (OD_C samples) before being osmotically dehydrated by immersion in sucrose solution (60 °Bx) at 40°C during 4 h. During the whole OD treatment, samples (material to solution ratio, 1:10 w/w) were kept submerged in a shaker containing the hypertonic solution (100 rpm, TT400, Perca, Argentina). After treatment, the excess of OD solution was drained, carefully wiped with water and dried in blotting paper. Four replicates of each experimental condition were carried out.
Since the initial moisture content was determined by AOAC 934.06 method [26], drying kinetic data during osmotic dehydration was estimated by weight loss recorded at 30 min regular intervals in a 0.1 g sensitivity balance (Denver Instrument, USA). The moisture content was finally expressed as kg water (w)/ kg dry matter (dm). Soluble solids determination of the fresh and osmo-dehydrated samples was performed in triplicate according to Gamboa-Santos & Campañone [24] by using a digital refractometer (Hanna Instruments Model HI96801, USA). Moisture (W) and soluble solids (SS) contents were used to model the drying kinetics and calculate the diffusional coefficients using the method described in Section 2.5.
The OD characteristic parameters: weight reduction (WR, %), moisture loss (WL, %) and solid gain (SG, %) were calculated according to the following equations [25]:
(1)
(2)
(3)
where m is the sample mass (g), W is the moisture content (kg water/kg dm) and TS is the total solid content (kg total solid/ kg initial dry matter, kg ts/ kg dmi). Subscripts 0 and t indicates the initial and final OD treatment time, respectively.
2.4Determination of physical properties
2.4.1Texture Analysis
Texture analysis was conducted by means of a texture PRO CT analyser (Brookfield, Middleboro, USA). Texture Profile Analysis Test (TPA) was carried out by using at least six strawberries (four OD treatment replicates). The test was performed using a TA11/100 probe and samples were analysed at a fixed rate (0.5 mm/s) and depth (30%). The necessary strength, area and distance values were determined in order to calculate the different textural parameters: firmness, adhesiveness, elasticity, cohesiveness and chewiness by using the available settings of Texture Pro CT software (V1.4, Build 17).
2.4.2One-dimensional shrinkage evaluation
One-dimensional shrinkage (Sh, %) of strawberry slices at each OD time and condition was calculated (Equation 4) from thickness measurements recorded by an electronic system (0.1 mm sensitivity) available in a texture PRO CT analyser (Brookfield, Middleboro, USA). Besides, thickness measurements were also verified by means of a manual calliper (0.1 mm sensitivity). Thickness values (2L, m) were normalized respect to initial values (2L0, m) and presented as Normalized thickness (NT, Equation 5). Half thickness values as a function of time were used as characteristic dimension (L, m) to calculate the diffusional coefficient (Section 2.5) [24].
(4)
where NT represents the Normalized thickness defined as follows:
(5)
where 2L is the measured thickness value. Subscripts 0 and t indicates the initial and final OD processing time, respectively.
2.5Modelling of the osmotic drying kinetics
One-dimensional transfer of water during OD treatment was described by Fick's diffusion theory. The geometrical shape considered for each strawberry sample was the infinite slab. As previously reported, the following assumptions were taken as valid: i- the solid is a homogeneous material, ii- the uniform initial temperature and moisture content, iii- the constant average effective moisture diffusivity (De). Besides, one-dimensional shrinkage of samples during OD treatment was considered [24].
The governing equations of the microscopic mass transfer phenomenon, presented below (Equation 6), were used to calculate the effective moisture and solid diffusivities during OD treatment.
(6)
Where W is the local moisture content (kg w/kg dm), t the time (s) and x the mass transfer direction (m) for infinite slab geometry.
(7)
(8)
(9)
Where L represents the half length of the infinity slab (m) and Weq and TSeq the equilibrium moisture and total solid contents. Those equilibrium values were approximated with the final W (1.38 kg w/ kg dm and 1.41 kg w/ kg dm for non-coated and coated samples, respectively) and TS (1.54 kg ts/ kg dmi and 1.73 kg ts/ kg dmi) values. The Crank's solution for infinite slab geometry in terms of the average moisture ratio (MR) and total solid ratio (TSR) defined in Equation 10 were taken into account to determine both
(10)
Where Wo and TS0 represents the initial moisture (kg w/ kg dm) and solid content (kg ts/ kg dmi). The models were fitted to the experimental drying and solid uptake kinetics by using the non-linear generalized reduced gradient optimization method available as a Solver function (Microsoft Excel Software, Microsoft Corporation, USA).
2.6Rehydration rate (RR) and leaching losses (LL)
OD treatment is applied to obtain intermediate moisture products, subsequent drying is necessary to ensure a microbiologically stable product. In order to evaluate the behaviour of the final dried strawberries, two parameters were selected: rehydration ratio and leaching losses. Coated and non-coated osmotically-dried samples (sucrose solution 60 °Bx, 40°C, 4 h, material to solution ratio 1:10 w/w) were dried by applying microwaves (MW, 1.2 W/g, 100 min). After MW drying step, coated (C_OD_MW) and non-coated samples (OD_MW) reached final moisture contents <18%.
Rehydration of MW dried strawberries were performed according to previous studies [3, 31]. Dried samples were immersed in distilled water at a 1:50 solid to liquid ratio (ambient temperature) for 2 h. Rehydration kinetic was determined at 30 min time intervals. At the specified times strawberries were removed and dried in paper towels to be weighed. Rehydration experiments were performed three times and rehydration ratio (RR) was calculated as follows:
(11)
where mr and md are the weights of rehydrated and dried strawberries, respectively.
Besides, the loss of soluble solids during rehydration step was gravimetrically determined. The soak water was evaporated for 24 h at 70°C. The residue was weighed, and the percentage of leached solids (LL, %) with respect to the initial weight of dehydrated fruit was calculated. As described for RR determination, dehydrated fruit refers to samples obtained after MW drying step [3].
2.7Statistical analysis
The goodness of the fit for each model to the experimental data was evaluated using the root mean square error (RMSE) [28] and the percentage of explained variance (VAR, %) [29], according to the following equations:
(12)
(13)
Where X represents the computed variable (moisture, W; or total solid content, TS), ei and ci subscripts are the experimental and calculated average values and N is the number of experimental data. Syx represents the relative variance explained by the model (Equation 14) and Sy the total variance (Equation 15).
(14)
(15)
In addition, to evaluate the significance (95%) of the application of edible films on fresh and OD strawberry samples, analysis of variance (ANOVA) was carried out for the individual factors: NS, WR, WL, SG, WL/SG, SS, W, TS,
3Results and Discussion
3.1Influence of coating application over shrinkage during OD treatment
During food processing, shape and size modifications may be produced. An excessive shrinkage, in most cases, negatively affects the preference and acceptance of the products by consumers [30]. Thickness (2L) values were found to be in the range 0.86–1.19 cm for non-coated and 0.86–1.31 cm for coated samples, thus, one-dimensional shrinkage reductions due to OD treatment were around 28 and 34%, respectively. In the previous research work, we observed that samples finished the OD treatment with almost 30% of shrinkage [24]. This finding allowed us to confirm that OD treatment applied in strawberry slices (60°C, 40°Bx, 4 h) produces a significant reduction in thickness values. In the present work, the kinetic of shrinkage during OD treatment from 0 to 240 min at 30 min intervals has been addressed. Table 1 shows the normalized thickness (NT) values during OD treatment for coated and non-coated samples. Initial values of OD_C samples were 11% greater than OD samples due to coating presence (thickness initial values: 1.31 cm for coated and 1.19 cm for non-coated samples). As can be seen, non-coated samples presented slightly higher thickness reduction (>shrinkage) during the first hour of OD treatment, however, at longer OD times coated samples showed a significantly greater one-dimensional shrinkage effect since their NT values were significantly lower for OD_C samples (>90 min of treatment, Table 1). Edible alginate coatings are highly hydrophilic and form a film over the sample that is easily dehydrated, conversely, coating could exert as an external resistance that could slow down the water loss at initial OD times. For longer immersion times, coated samples behaviour was similar than those of the non-coated ones. In general, independently of the coating presence, the decrease in drying rate might be related to the reduction in porosity of the material increasing the resistance to movement of water as the drying evolves [31, 32].
Table 1
Normalized thickness (NT)1 values during osmotic-dehydration treatment for coated (OD_C) and non-coated (OD) strawberry slices (n = 6)
| OD time (min) | NTOD | NTOD _ C |
| 0 | 1.00±0.00a2 | 1.00±0.00a |
| 30 | 0.83±0.01a | 0.87±0.00b |
| 60 | 0.77±0.06a | 0.79±0.00a |
| 90 | 0.77±0.01b | 0.75±0.00a |
| 120 | 0.76±0.01b | 0.72±0.01a |
| 150 | 0.77±0.01b | 0.72±0.00a |
| 180 | 0.74±0.01b | 0.67±0.00a |
| 210 | 0.74±0.02b | 0.65±0.00a |
| 240 | 0.72±0.00b | 0.65±0.01a |
1Measured thickness values (2L) were normalized respect to initial values (2L0). NT: 2L/2L0. One-dimensional shrinkage is calculated as (1-NT) * 100. 2Samples with the same superscript letter in the same row showed no statistically significant differences for their mean values at the 95.0% confidence level (Fisher LSD; 0.05).
3.2Influence of coating application over drying kinetics and OD parameters
In order to study in depth moisture losses and total solid contents, the drying kinetics of coated and non-coated samples are depicted in Fig. 2. Initial moisture content of raw strawberries was 90.88±1.43% w.b. (9.96 kg w/ kg dm dry basis, d.b.) for coated and non-coated samples. Final moisture contents of osmo-dehydrated (4 h) samples were in the range 58.0–58.6% (1.38 kg w/ kg dm and 1.41 kg w/ kg dm, for non-coated and coated samples), being in accordance with moisture content values obtained in a previous research work after identical treatment conditions (OD, sucrose, 4 h, 60°C) [24]. Ciurzynska and Lenart [33] reported final moisture contents of samples around 70% (2.24 g w/ g dm) during OD treatment in frozen strawberries (sucrose 61.5 °Bx, 30°C, 3 h). These values were similar to those obtained in the present work after 3 h of treatment for non-coated samples (2.18 kg w/ kg dm, Fig. 2a). Weight reduction (WR) and water loss (WL) parameters presented in Fig. 3a and 3b show a similar trend during the whole OD treatment regardless of the coating presence, that is, WR and WL values increase along with treatment time. Furthermore, several works have reported a faster removal of water even for coated samples [10, 11, 34–36]. It was stated that coating did not affect the water loss kinetics during OD treatment due to a great coating water permeability [35]. Despite this, significant differences could be observed in WR and WL values in favour of non-coated samples during the whole OD treatment (Fig. 3a, 3b). Hereby, it was described, for certain conditions and coating composition, that the presence of coating slows the transport of water [37]. This behaviour could suggest that ALG coating is rapidly dehydrated compared to strawberry sample from inside, thus, partial dehydrated coating probably acts as an external resistance to water movement. Results previously obtained by Soteras et al. [16] for an ALG coating characterization support the hypothesis stated above since for the individual system WL values of 69% after 2 h of OD treatment (60 °Bx, 40 °C) were obtained, being notably higher than those obtained here for the strawberry+coating system (32%, Fig. 3b). Thus, water diffusion at initial times was significantly greater for non-coated samples due to a barrier effect to water loss in coated samples which is due to ALG coating material (Table 3).
Fig. 2
Drying kinetics of moisture (a) and total solid (b) contents during osmotic dehydration treatments in strawberry samples (▴-coated; Δ-non-coated). The error bars are based on mean±SD (n = 4). Significant differences (Fisher LSD; 0.05) between coated (OD_C) and non-coated (OD) samples are marked with an asterisk (*) for a given OD time.
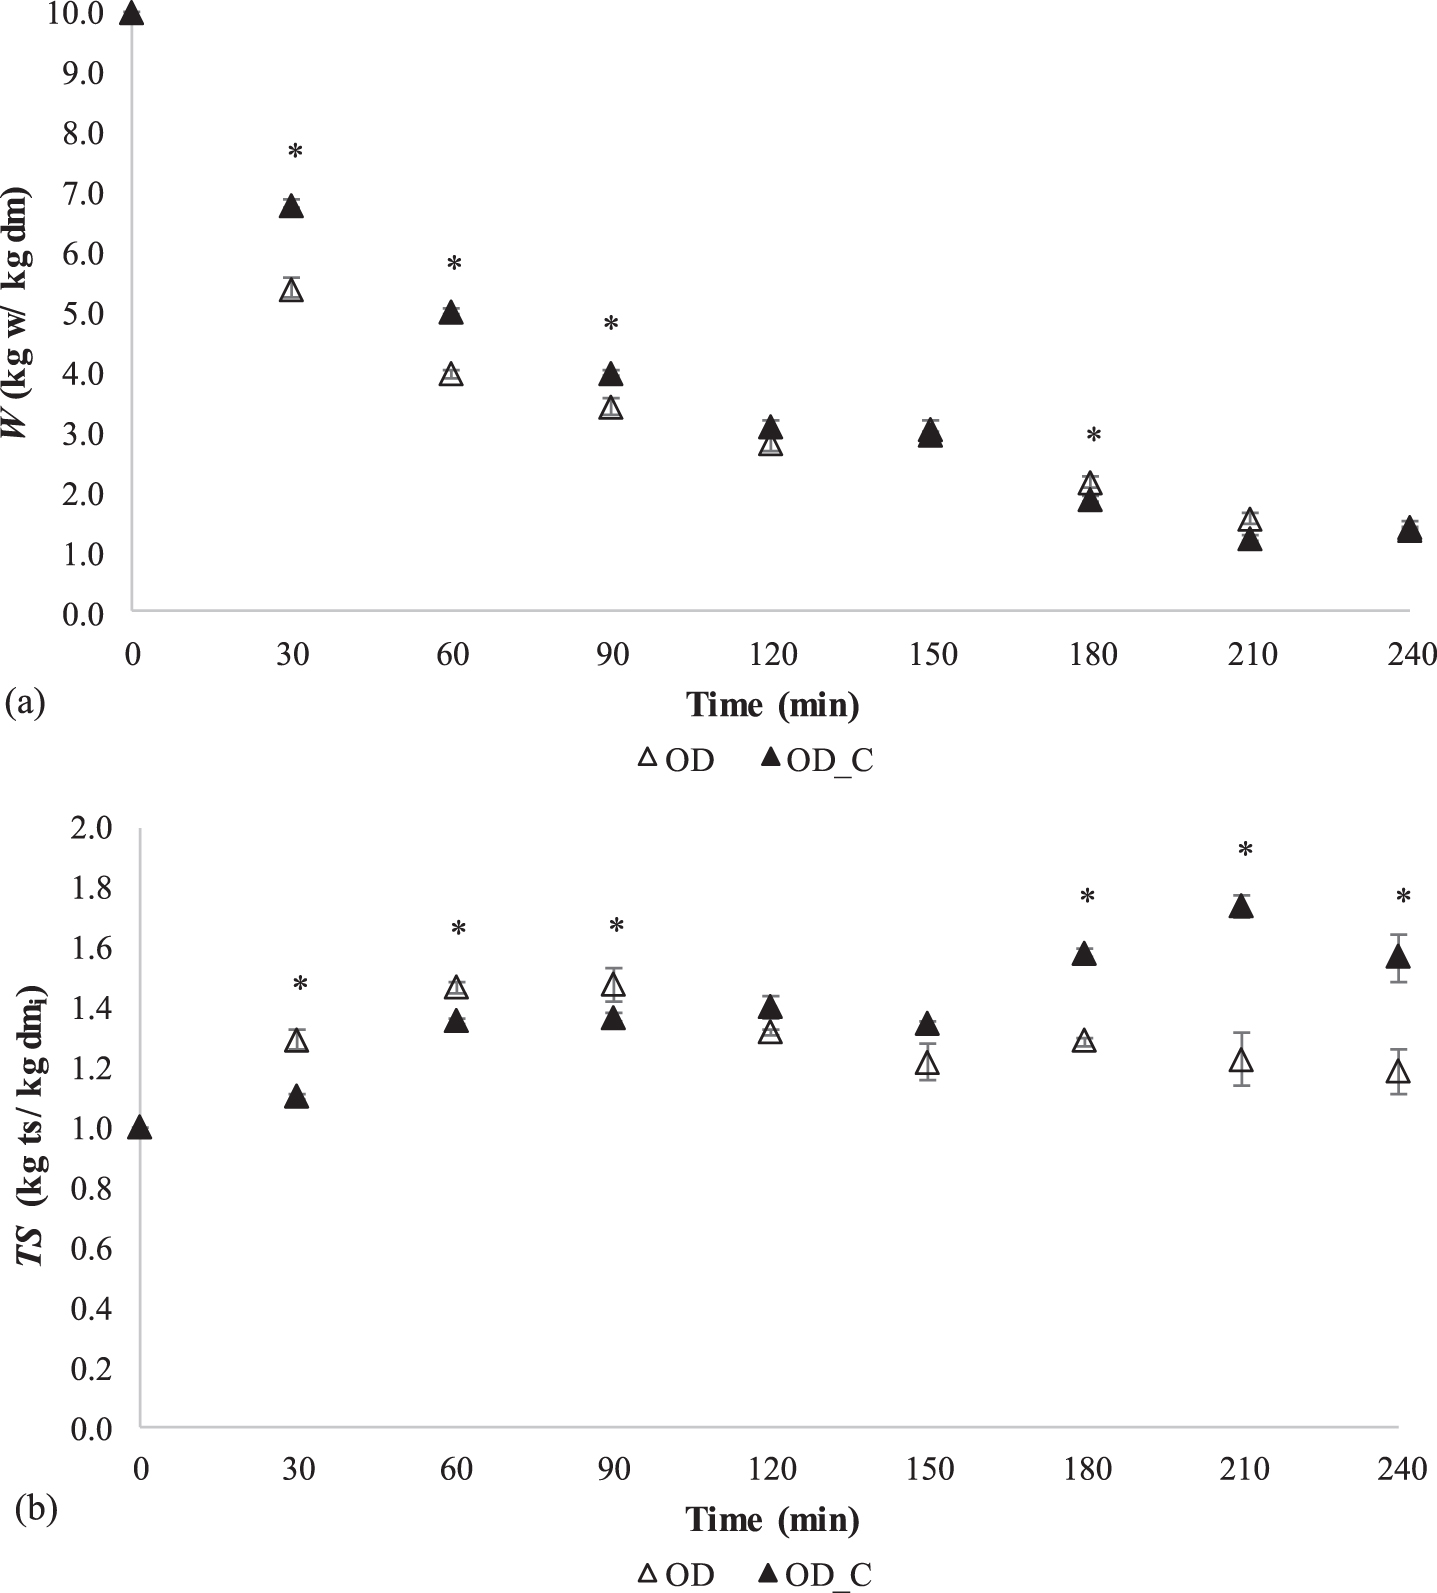
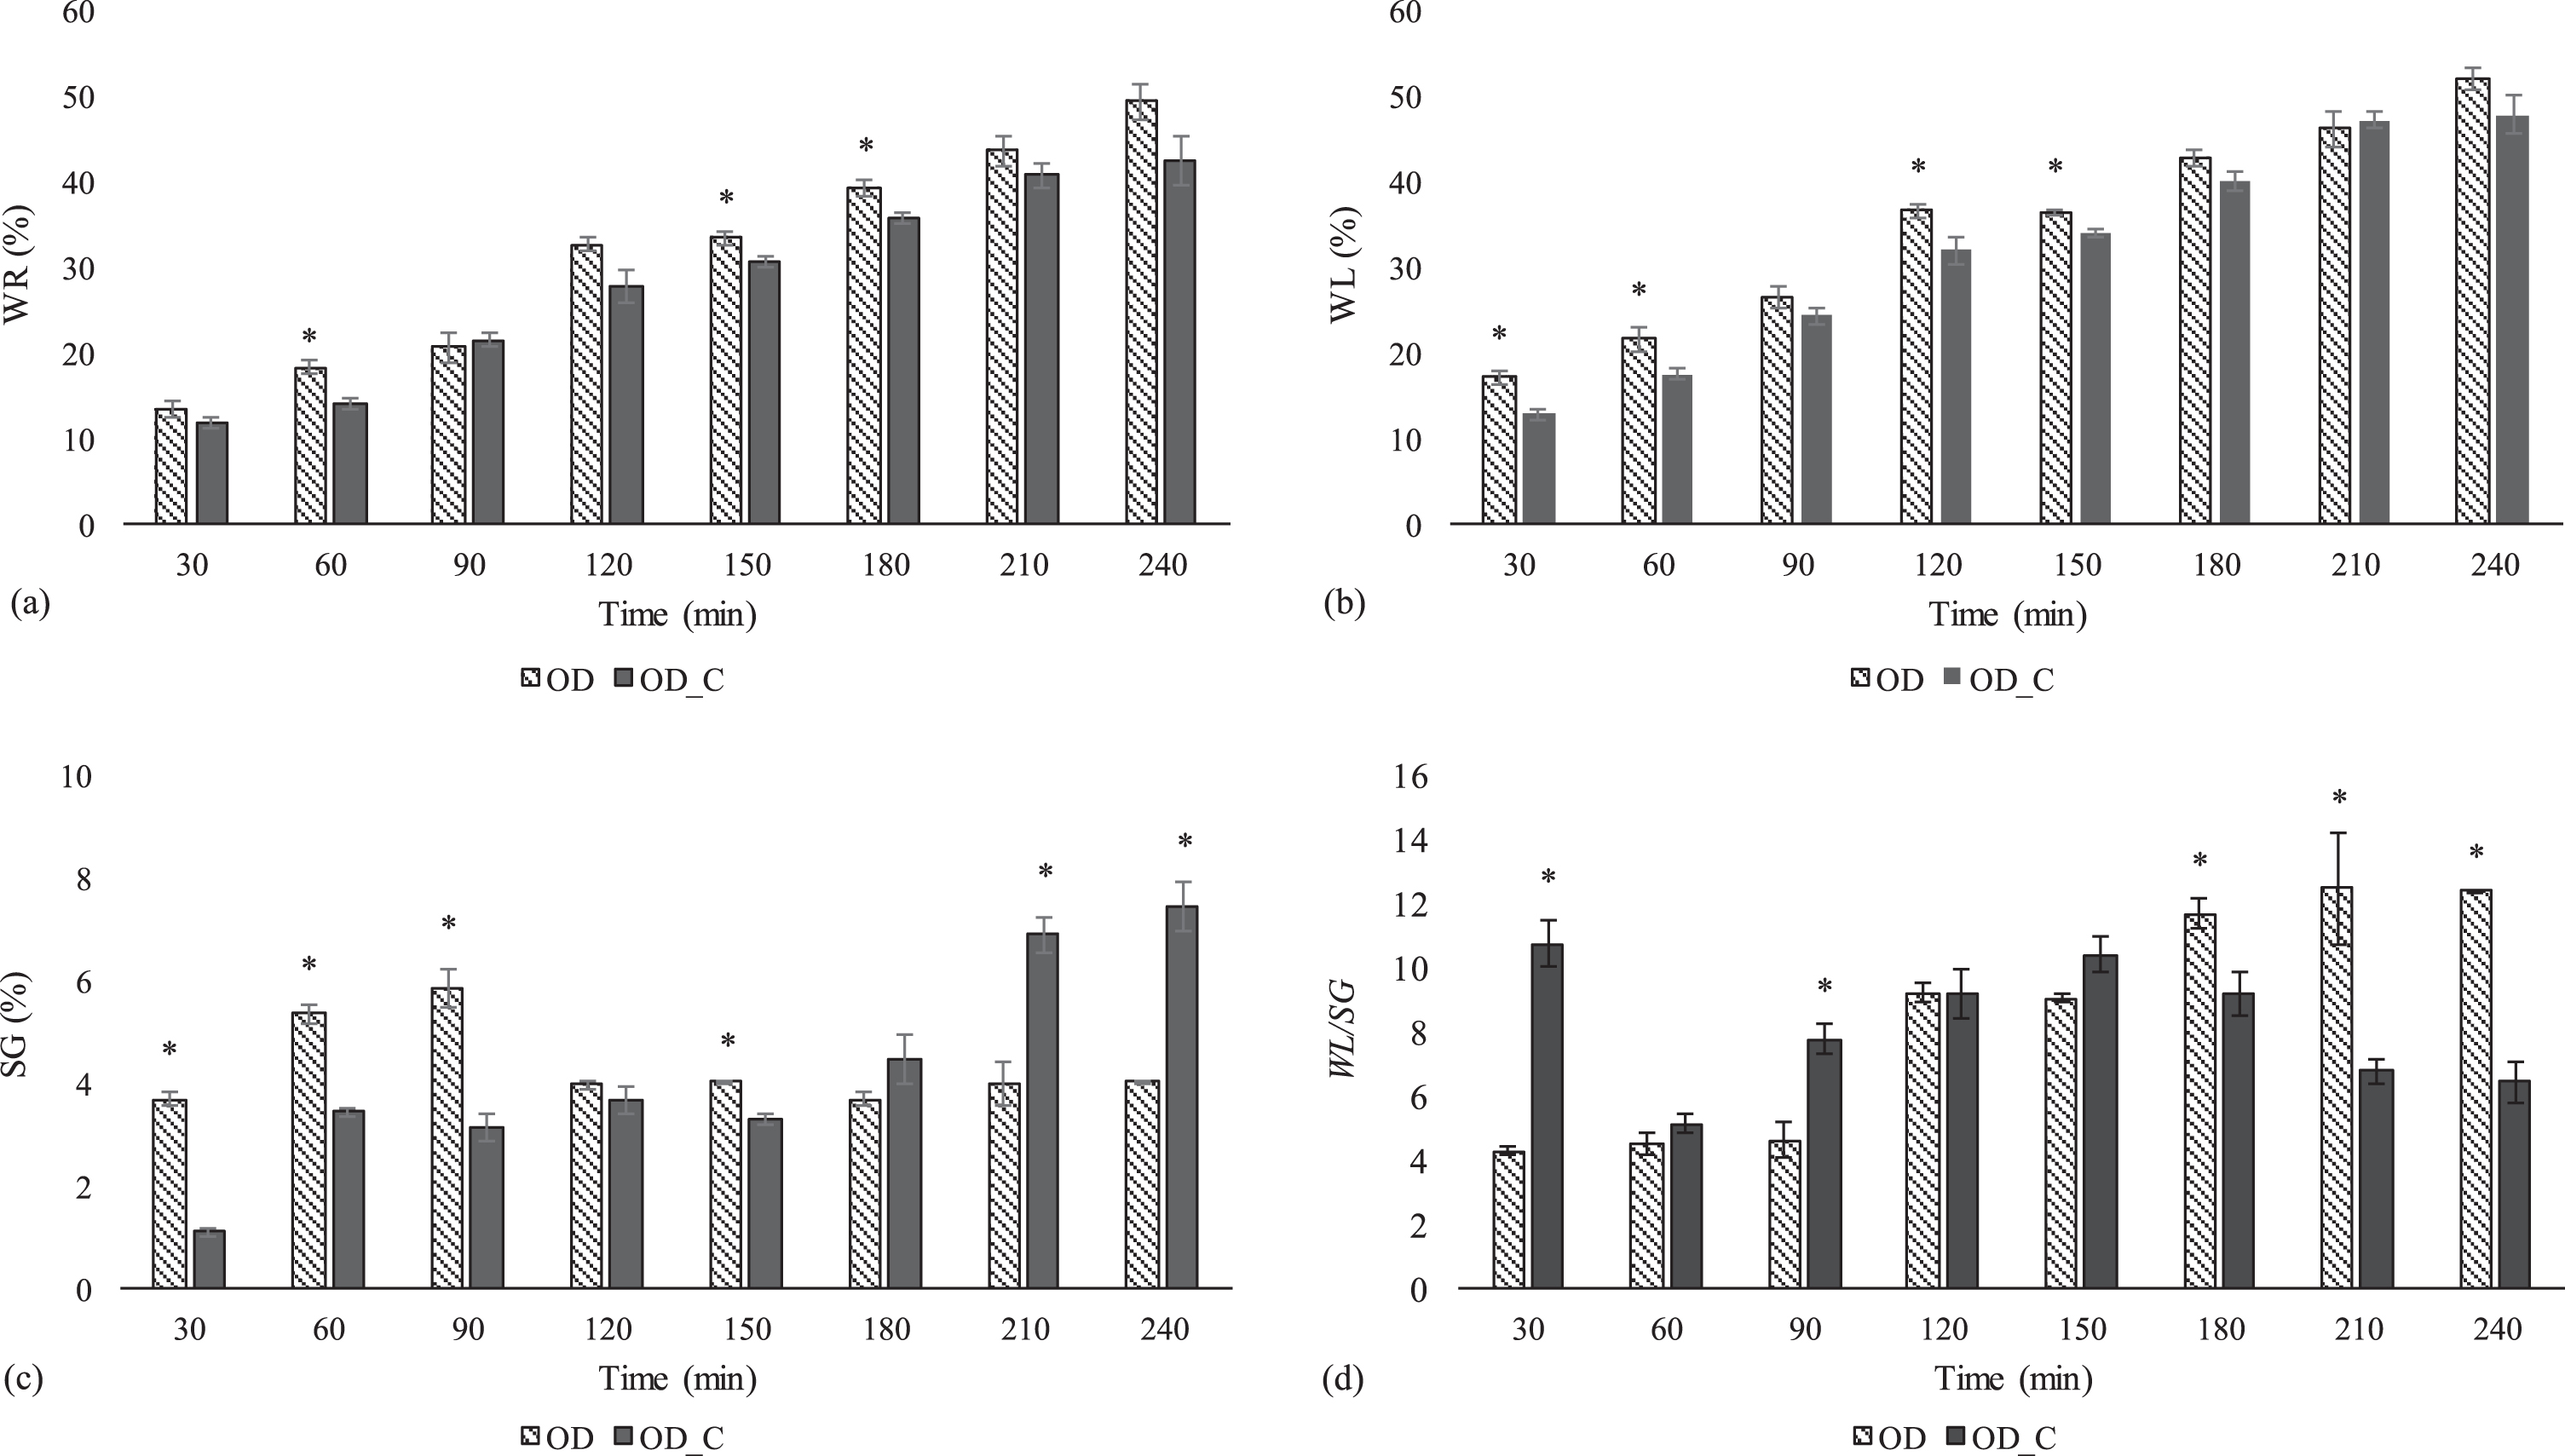
Fig. 3
OD characteristic parameters (WR: weight reduction, WL: water loss, SG: solid gain, WL/SG: water loss/solid gain ratio) for strawberry slices during OD treatment. The error bars are based on mean±SD (n = 4). Significant differences (Fisher LSD; 0.05) between coated (OD_C) and non-coated (OD) samples are marked with an asterisk (*) for a given OD time.
Besides, other studies have pointed out that coatings could reduce the permeability of sugar, limiting the solid uptake [38, 39]. Total solid content (kg ts/ kg dmi) at 30 min intervals during OD treatment is presented in Fig. 2b. During the first 2 h of treatment non-coated samples presented significantly increased TS values (maximum values up to 1.47 kg ts/ kg dmi) compared to coated samples (values up to 1.40 kg ts/ kg dmi). At long OD times (>120 min), TS values for coated samples were notably risen compared to those of non-coated samples. For coated strawberries, final TS values (4 h) (1.56 kg ts/ kg dmi) were significantly greater by 32% compared to non-coated ones (1.18 kg ts/ kg dmi). After 3 h of treatment coated samples showed a significant increase in TS content which reveals the coating ability, in the conditions here assayed, to uptake sugar at longer OD times (Fig. 2b). Net solid gain values of coated strawberries after 3 h of OD treatment (0.9 kg ts/ kg dmi) were similar than those obtained by Matuska et al. [11] for whole simple and double coated (0.5 and 1.0% ALG) frozen strawberries (0.9–1.2 kg ts/ kg dmi) at comparable operating conditions (61.5% sucrose, 30°C, 3 h). However, net solid gain values of frozen control samples reported by Matuska et al. [11] (2.0 kg ts/ kg dmi) were greater than those reported here for fresh non-coated samples after 3 h of treatment (TS values increased by 1.2 kg ts/ kg dmi). Differences in net solid gain values are attributed to the frozen [11] or fresh (this work) initial state of strawberry samples subjected to OD treatment. Ahmed et al. [40] reported that, after a freeze–thaw ice water transformation, the fruit cellular structure was disrupted, thus favoring higher solute gain. Solid gain of frozen+OD treated samples could be 3.5 times greater than samples not pre-freezing [40].
Table 2 shows the measured soluble solids (SS) content values obtained for OD samples. During the initial 90 min of treatment, SS content values in the range 12.9–17.5 °Brix (°Bx) were found for non-coated samples. At initial times, these values were significantly greater than those obtained for coated strawberries by comparing time to time (10.7–15.1 °Bx) OD treatments. At intermediate OD times (120 and 150 min) similar SS values were registered, independently of the coating presence (e.g., 16.8–17.3 °Bx for non-coated and coated samples at 120 min). Finally, after 180 min of treatment coated samples presented higher SS values (21.5–25.5 °Bx) as compared to non-coated samples (18.3–20.2 °Bx). SS values were in accordance to solid gain (SG) values depicted in Fig. 3c which shows a fast and significant increase in favour of non-coated samples from the starting point to 90 min of OD treatment. SG values for coated samples at 30, 60 and 90 min were significantly lower by 70, 52 and 50%, respectively, compared with uncoated ones, which is indicative of a solids barrier effect. As an evidence of the solid barrier effect caused by coating, it was previously reported a significant decrease (44%) in SG values for double-coated samples compared to control ones [11]. Otherwise, after 180, 210 and 240 min of treatment, SG values for coated samples increased by 21, 72 and 85% respect to those obtained for non-coated strawberries. These results are in accordance with the surprisingly huge solids gain values observed during a characterization study of calcium-alginate hydrogels (SG > 30%) prepared as the same conditions tested in this work and after 2 h of OD treatment (40 °C, 60 °Bx) [16]. Thus, taking into account SG values presented in Fig. 3c and TS values discussed above, the barrier effect of the ALG coating could be observed at the beginning of the OD treatment but not towards to the end.
Table 2
Soluble solid (SS, °Bx)1 content of strawberries during osmotic-dehydration treatment
| OD times (min) | SS (°Bx) | |
| OD | OD_C | |
| 0 | 8.6±0.1b | 7.7±0.2a |
| 30 | 12.9±1.1b | 10.7±0.6a |
| 60 | 15.7±0.8b | 13.7±0.8a |
| 90 | 17.5±1.2b | 15.1±0.5a |
| 120 | 16.8±1.9a | 17.3±1.0a |
| 150 | 16.6±1.2a | 16.8±4.1a |
| 180 | 18.3±2.2a | 21.5±3.6a |
| 210 | 19.9±1.8a | 25.5±0.9b |
| 240 | 20.2±1.7a | 23.8±4.1a |
1Samples with the same superscript letter in the same row showed no statistically significant differences for their mean values at the 95.0% confidence level (Fisher LSD; 0.05).
Table 3
Calculated diffusion coefficients of water loss (
| OD time: 2 h | ||||||
| OD treatment |
| RMSE | VAR (%) |
| RMSE | VAR (%) |
| OD | 4.56±0.48b1 | 0.23±0.09 | 99.91±0.14 | 2.41±0.26b | 0.12±0.03 | 78.89±11.63 |
| OD_C | 3.25±0.24a | 0.22±0.11 | 99.97±0.03 | 0.84±0.18a | 0.06±0.01 | 96.98±1.88 |
| OD time: 3 h | ||||||
| OD treatment |
| RMSE | VAR (%) |
| RMSE | VAR (%) |
| OD | 2.93±0.57b1 | 0.46±0.04 | 99.92±0.04 | 1.13±0.07a | 0.19±0.04 | - 2 |
| OD_C | 2.09±0.15a | 0.27±0.05 | 99.99±0.00 | 1.12±0.08a | 0.09±0.01 | 95.96±1.84 |
| OD time: 4 h | ||||||
| OD treatment |
| RMSE | VAR (%) |
| RMSE | VAR (%) |
| OD | 2.04±0.21a1 | 0.53±0.10 | 99.81±0.10 | 0.70±0.09a | 0.10±0.02 | - 2 |
| OD_C | 1.84±0.07a | 0.26±0.03 | 99.99±0.00 | 0.64±0.13a | 0.09±0.02 | 96.01±1.76 |
1Samples with the same superscript letter in the same column at each OD time showed no statistically significant differences for their mean values at the 95.0% confidence level (Fisher LSD; 0.05). 2Values out of range.
Related to WL/SG ratio, non-coated samples were in the range 4.3–12.5 (Fig. 3d). This is indicative of an efficient OD treatment since water diffusion is promoted over solid transfer during the complete OD treatment. As can be observed in Fig. 3b, during OD treatment, moisture losses increased with the immersion time, however, solid gain values were around 4% after 2 h of treatment [40]. As a consequence, final WL/SG values were greater than those reported in literature for similar OD treatments [39]. Previous studies indicated that SG and WL values during osmosis attain equilibrium state as the time evolves [41, 42]. At the conditions evaluated, SG values (Fig. 3c) seems to reach equilibrium levels after 2 h of OD treatment. As a consequence, WL/SG ratios continually increase during osmotic treatment since WL values are on the rise (Fig. 3b, 3d). In the case of coated samples, the most efficient processing time, in terms of WL/SG ratio, could be recorded in the middle of the OD treatment (near to 150 min). Omitting the large increase at 30 min of treatment (WL/SG values of 10.8) which is due to large WL and low SG individual values (30 min, Fig. 3b, 3c), WL/SG ratios for coated samples increased from 5.1 (60 min) to 10.4 (150 min) and then decreased to 6.5 (240 min), as a bell-shaped curve. For coated samples, initial WL/SG values (up to 90 min) showed to be significantly higher than those obtained for non-coated samples, however, at longer OD times (>180 min) the opposite trend occurs (Fig. 3d). García et al. [43] referred that WL/SG values for coated papaya samples were greater than those of non-coated ones due to the formation of a superficial crust which acts as a barrier to mass transfer, limiting both water and sugar countercurrent exchange. Therefore, at initial OD times high WL/SG values were mainly related to WL parameter, while at long OD times, SG parameters determine the efficiency of the OD treatment [43]. Final WL/SG values (6.5±1.3, Fig. 3d) were similar than those reported for ALG coated strawberry slices after 4 h of OD treatment (60 °Bx, 40 °C, WL/SG: 7.6) [24]. These results suggested that coating promoted the WL over the SG, to a greater extent, at initial times. The “egg structure” formed with calcium ions and alginate solution allows water to move through the semipermeable cellular membrane (coating) with much greater easiness than the dissolves solids [44, 45].
3.2.1Determination of diffusion coefficients (De) during OD treatments
Table 3 shows De values of water (
As can be observed (Table 3) the reduction in OD modelling times increased the calculated
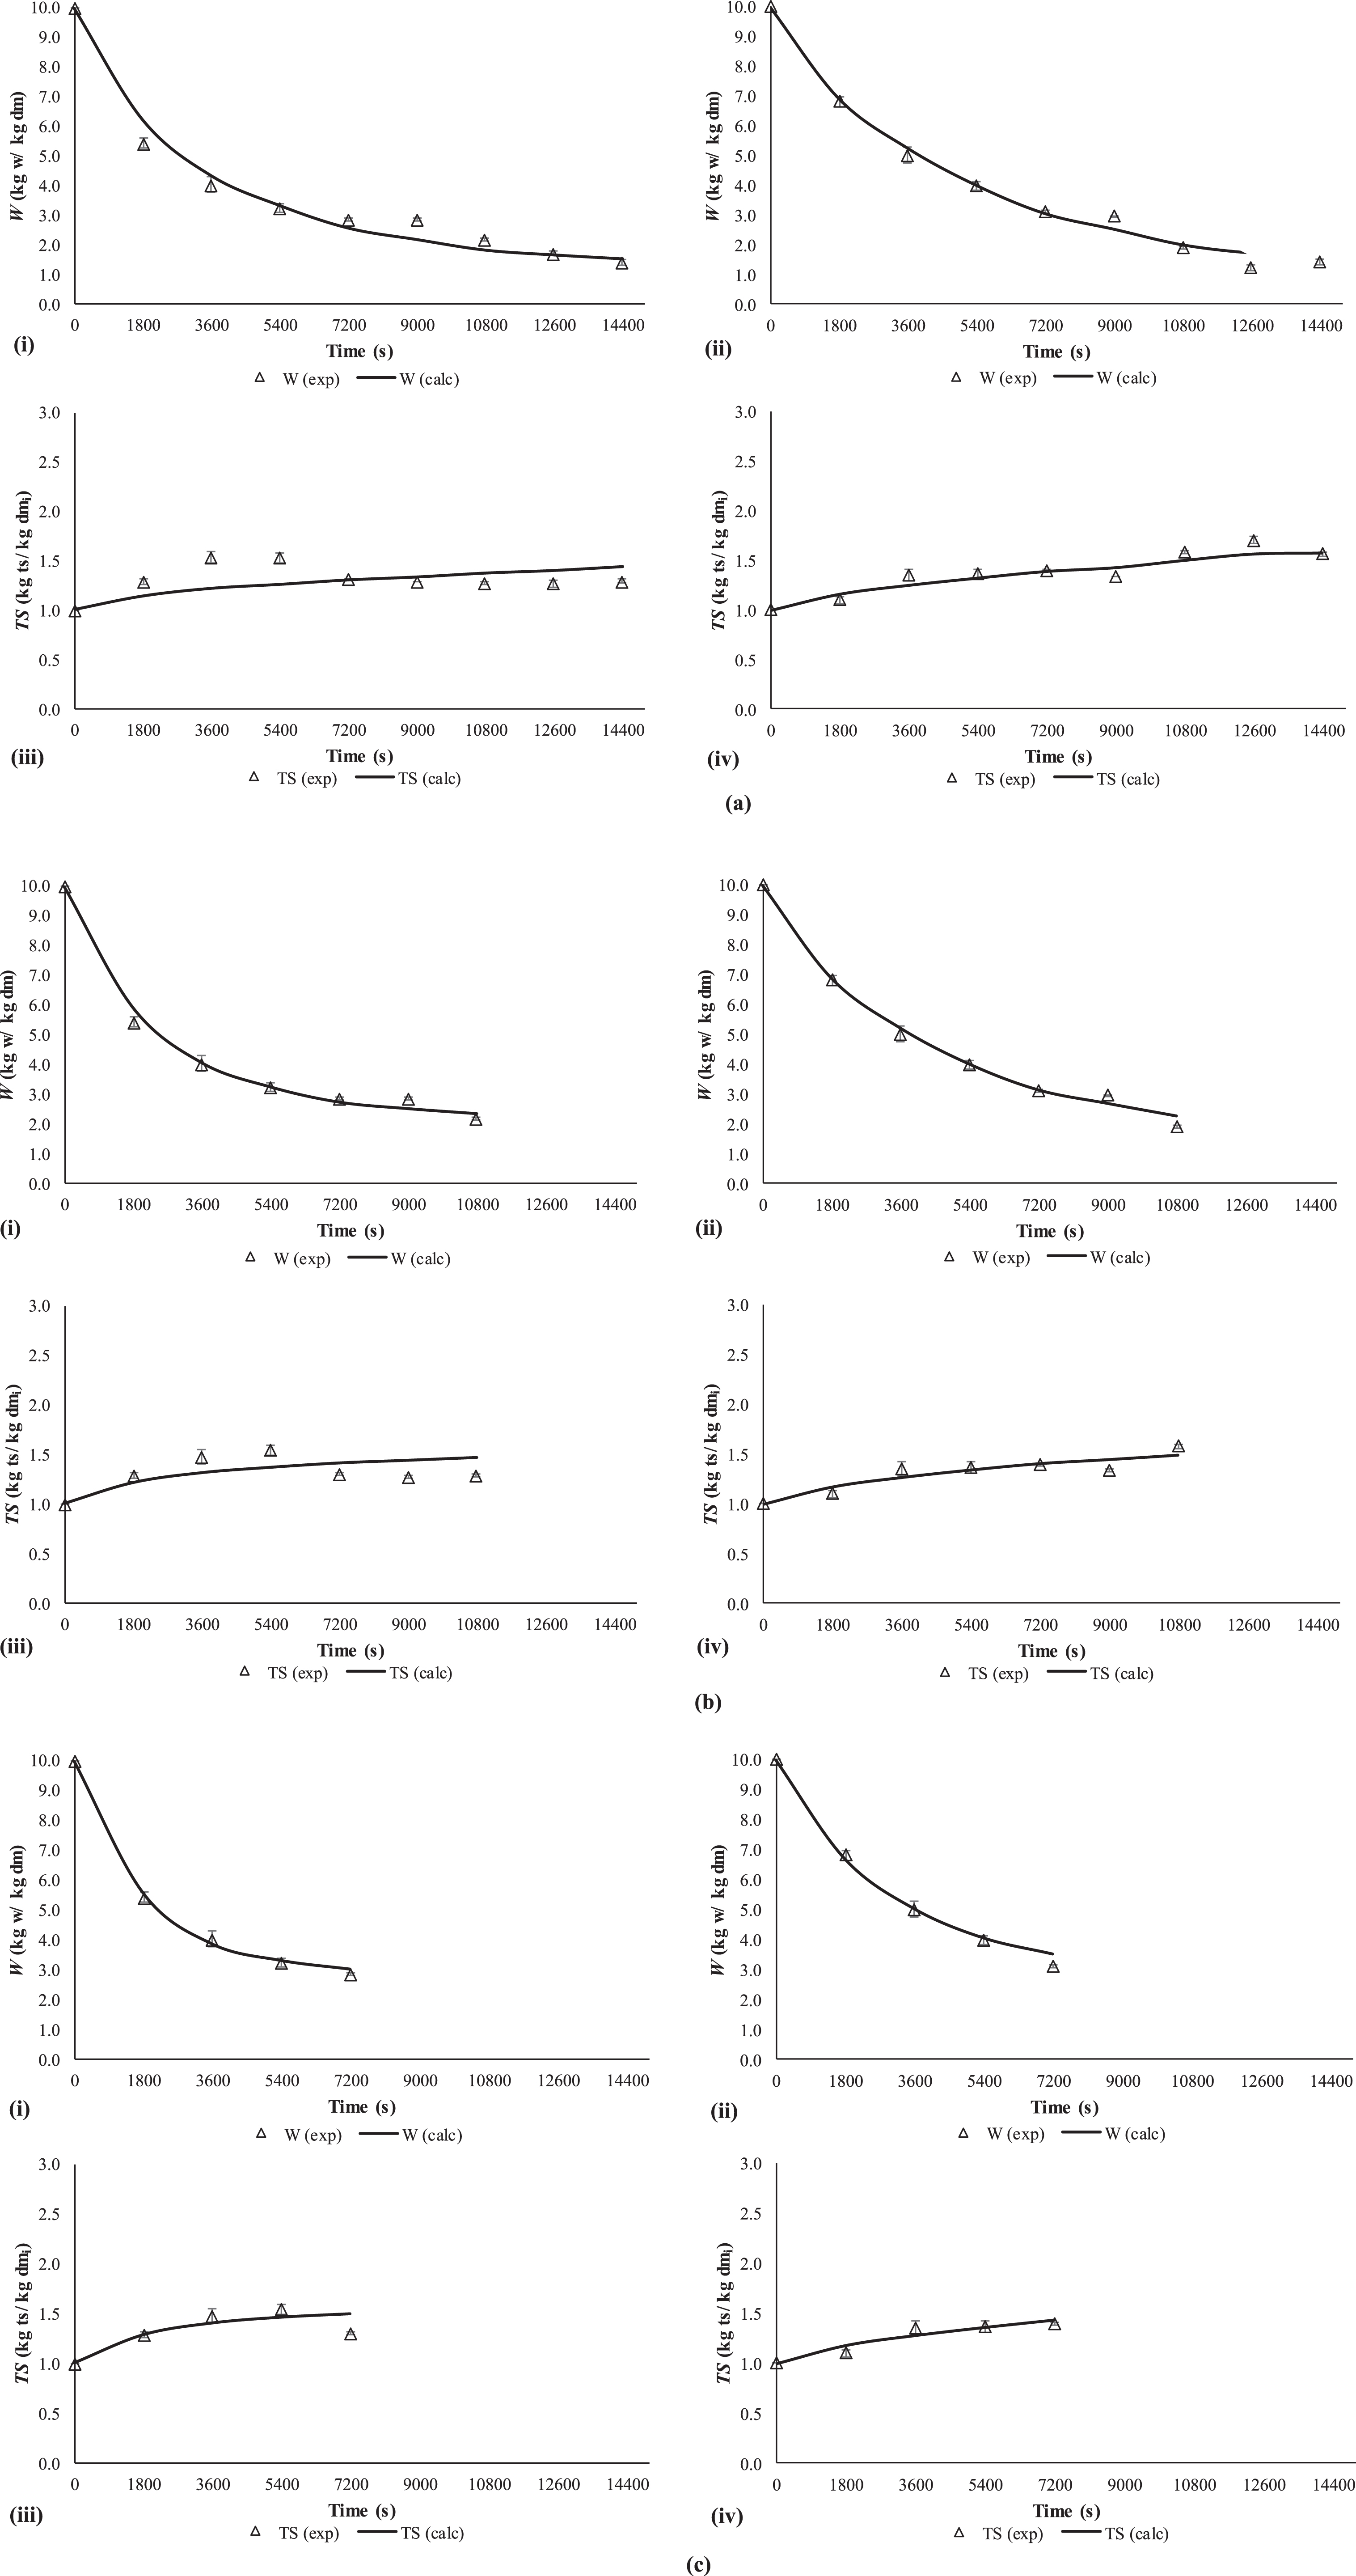
Fig. 4
Experimental (exp) and calculated (cal) moisture (W) and total solid (TS) content for non-coated (i. W, iii. TS) and coated (ii. W, iv. TS) strawberry slices considering three OD modelling scenarios: (a) 4 h, (b) 3 h, (c) 2 h of treatment times. The error bars are based on mean±SD (n = 4).
3.3Influence of coating application over textural properties during OD treatment
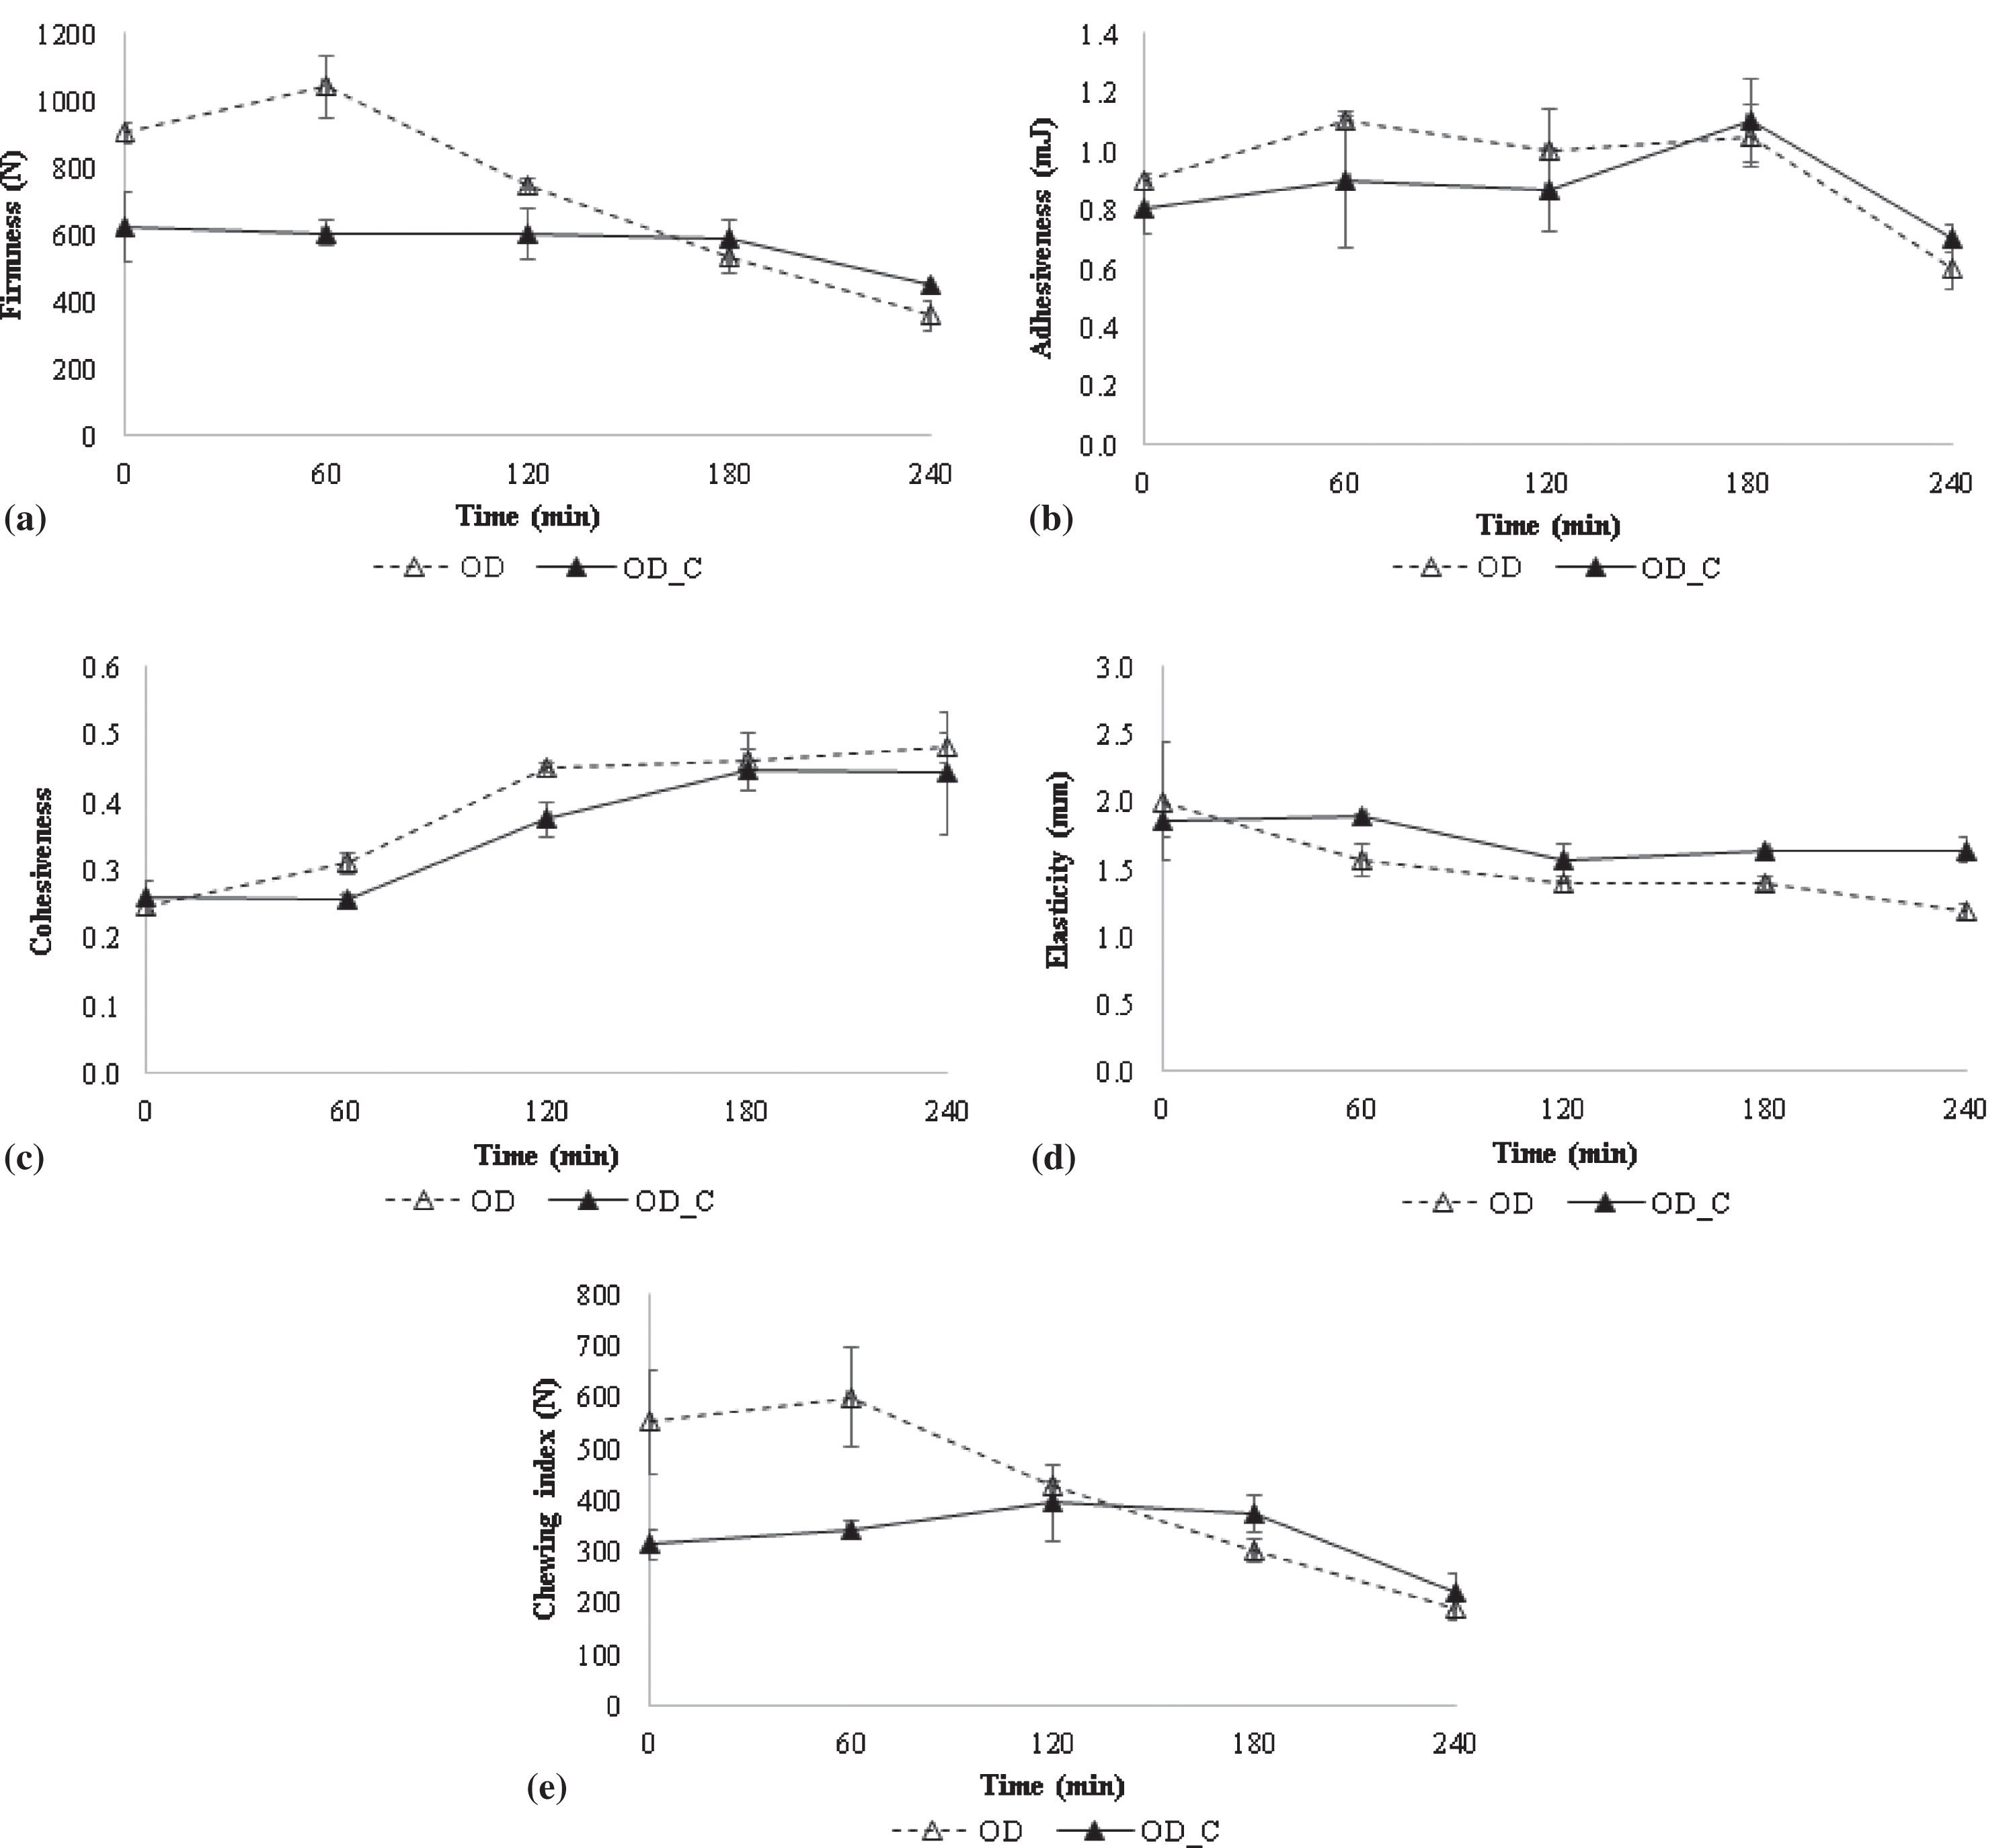
OD treatment causes changes in several physical properties of fresh products. Among them, texture is one of the most affected parameters probably due to the plasticizing and shrinkage effect of water on the pectic and cellulosic components of the fruit tissues. The low solids content and thin cell walls of strawberry samples could also favour the textural damage and the disruption of the intercellular structure. The release of enzymes and substrates will cause further problems with the flavour and colour [55]. Solid uptake notably modifies final product composition since a solid gain of up to 5–10% attained during OD treatment represents relative increases of 50–100% referred to an initial soluble solid content of 10% [56]. Thus, it also results in the development of a concentrated solids layer under the product surface which decreases the driving force for water flow. Solid uptake blocks the surface layers of the product, posing an additional resistance to mass transfer and lowering the rates of complementary dehydration. As a consequence, it was expected OD samples presented several changes in textural properties. Figure 5 depicts TPA parameters obtained for strawberry samples during OD treatments. Among them: firmness, adhesiveness, cohesiveness, elasticity and chewing index have been addressed. For non-coated samples a slight increase in firmness parameter was observed at 60 min of OD treatment (Fig. 5a). Previous research works have reported an increase in texture firmness along with the removal of water and solid uptake during OD treatment [48]. However, after the first hour of OD treatment, firmness parameter decreases for non-coated samples, probably as a result of cell wall degradation and loss of turgor induced by the rupture of the parenchyma cell walls [55]. OD could induce cells deformation and collapse along with the contraction of the intercellular spaces. Previous studies have reported that OD treated samples presented detached cell walls and damaged middle lamella [57]. As can be seen on Fig. 5a firmness of coated OD samples is maintained constant (600 N) during the first 180 min. Then, this parameter decreased until 450 N, being these values similar to those described by Moreno et al. [57] for strawberries (565 N) during a comparable OD treatment (40°C, sucrose 65 °Bx, 300 min). The Ca+ binding to pectic acid molecules could produce an increase in fruits texture resistance while preserving the firmness of the covered samples during almost the whole treatment [34]. Differences in firmness parameter between non-coated and coated samples have been obtained until 180 min of treatment. As mentioned earlier, firmness values were most reduced for non-coated samples compared to coated ones, however, the former showed a higher firmness at the beginning of the OD treatment. Due to coating soft texture, firmness values for coated samples are perceived as reduced at initial OD times (Fig. 5a). A previous work carried out on different hydrogels showed that combination of coating solutions of 2% sodium alginate and 5% calcium lactate presented the best performance regarding to consistency textural parameter, which is usually related to firmness [39]. Despite of being the most consistent, ALG hydrogel presented force compression values as lowest as 20 N when it was considered as unique system and before applying an OD treatment stage [39]. Hence, in the present work, ALG material covering strawberry samples could lower the overall firmness of the strawberry+coating system as has been observed in Fig. 5a at initial times. During the last 60 min, samples presented similar values and also the same trend in firmness parameter. In fact, it was described that at long OD times ALG coating reduces it thickness by dehydration and attaches to strawberry slices creating a unified strawberry+coating system [24]. In gelled products, adhesiveness, cohesiveness and gumminess are significant properties for texture evaluation [58]. Adhesiveness values obtained for strawberries are presented in Fig. 5b. During the complete OD treatment no differences were observed over adhesiveness due to coating presence. After 3 h of OD treatment a significantly decrease in this texture parameter has taken place. Cohesiveness represents the resistance of internal bindings which form the structure of the product. As reported in literature, fresh berries are characterized to be low in cohesiveness [55]. Then, after OD treatment, samples reported in the present work have almost duplicated their values (from 0.245 to 0.480 for non-coated samples and from 0.260 to 0.443 for coated samples) probably due to compaction phenomenon that occurs when water leaves the sample and the sugar enters. Until 180 min of treatment, coated samples showed significantly lowers cohesiveness values compared to those obtained for non-coated samples (Fig. 5c). As explained above, during the first hours of OD treatment coating is less compact than strawberry sample which is covering. During the last hours of treatment, strawberry and coating behave as a unified product, therefore, cohesiveness values, independently of coating, are similar (Fig. 5c). The absorption of sugar until saturation causes a decrease in elasticity along with an increase in fragility of sample texture [59]. This behaviour could be appreciated in non-coated samples subjected to OD treatment (Fig. 5d). Elasticity values decreased from 2.00 to 1.19 after 4 h of treatment. In the case of coated samples, values were in the range 1.64–1.85 during the whole OD treatment. According to the results presented in Fig. 5d some elasticity maintenance effect due to coating application could be attained. The chewing index is defined mathematically as the product between hardness, cohesiveness and elasticity. Figure 5d shows the values obtained for this parameter during OD treatment. As can be seen, non-coated samples presented significantly higher values during the first 120 min of treatment. Then chewing values (Fig. 5e) decreased and become comparable to those obtained for coated samples. Since chewing index depends on parameters discussed above, it was assumed that differences observed among coated and non-coated samples must be mainly attributed to significant microstructural changes and turgor losses of the vegetable matrix induced by OD treatment.
Fig. 5
TPA parameters obtained for strawberry samples during OD treatments: (a) Firmness, (b) Adhesiveness, (c) Cohesiveness, (d) Elasticity and (e) Chewing index. The error bars are based on mean±SD (n = 6).
3.4Rehydration properties in final dried strawberry samples
Rehydration ability and leaching losses are physical parameters that can provide valuable information about the quality characteristic of dried samples, especially when the product is added to yogurt, milk, ice creams, juices, etc. The rehydration ratio (RRt) of MW dried pre-treated samples at 30 min intervals during 2 h and the leaching losses (LL) after this time are presented in Table 4. Non-significant different RR values were obtained after 2 h of rehydration for non-coated and coated samples respectively (1.89 and 2.50). These achievements are in agreement with those reported by Megías-Pérez et al. [23] for OD samples. El-beltagy et al. reported values of 2.57–3.44 for strawberries subjected to solar drying (up to 24 h) [60].
Table 4
Rehydration properties: rehydration ratio (RR) and leaching losses (LL) of coated and non-coated dried strawberries as a function of the time
| Samples | RRt30 | RRt60 | RRt90 | RRt120 | LLt120 (g/ 100 g DM) |
| OD_MW | 1.38±0.08a | 1.58±0.14a | 1.83±0.15a | 1.89±0.28a | 45.29±5.94a |
| C_OD_MW | 1.72±0.28a | 2.03±0.27a | 2.31±0.31a | 2.50±0.28a | 44.87±6.36a |
1OD_MW: MW dried osmo-dehydrated samples; C_OD_MW: MW dried coated osmo-dehydrated samples. 2Samples with the same superscript letter in the same column showed no statistically significant differences for their mean values at the 95.0% confidence level (Fisher LSD; 0.05).
In a previous paper focused on quality indicators of air-dried strawberries, when samples were subjected to 60 and 70°C (420 min), RR values in the range 4.0–5.6 were obtained [61]. In general, samples increased their RR along with the rehydration time (from 0.5 to 2 h).
Leaching losses (LL) quantifies the solid losses from the food matrix to the rehydration medium. Table 4 shows LL values after OD treatment and final drying step (MW drying). LL values ranged between 44.8–45.3 (g/ 100 g DM) for coated and non-coated MW samples, respectively (without significant differences). Although LL results may seem excessive, even greater values for similar samples have been recorded in the literature. In a previous study of convective drying of strawberries (40–70 °C, 3–7 h), without pre-treatment stage, LL in the range 59.0–72.4 g/ 100 g DM were obtained for rehydrated samples [3]. In other study, carried out on strawberries dried by convection assisted by power ultrasound (40–70 °C, 30 and 60 W) and without applying a pre-treatment step, leaching losses during rehydration of dried strawberry samples were found to be in the range 61.8–77.6% [61]. Moreover, values of LL higher than 50% have been reported for several dried fruits and vegetables [23, 62, 63]. The values obtained in the present work were lower than those found in the literature and could be attributed to both (osmotic and microwave drying) processes and their combination.
4Conclusion
In this work it was explored the effect of alginate coating material over drying kinetics, OD parameters, one-dimensional shrinkage and textural properties of strawberry slices during an osmo-dehydration treatment. Special emphasis was made on the barrier effect of coating over the water outflux and solid uptake. Diffusion coefficients for water loss (
Conflict of interest
The authors have no conflict of interest to report.
Acknowledgments
This work has been founded by the National Agency for Scientific and Technological Promotion, Argentina; projects PICT 0923/17 and 2162/17, and the National University of La Plata, Argentina, project UNLP 1223/17.
References
[1] | Yeung AWK , Tzvetkov NT , Zengin G , Wang D , Xu S , Mitrović G , Brnčić M , Dall’Acqua S , Pirgozliev V , Kijjoa A , Georgiev MI , Atanasov AG . The berries on the top. Journal of Berry Research. (2019) ;9: (1):125–39. |
[2] | Sette P , Salvatori D , Schebor C . Physical and mechanical properties of raspberries subjected to osmotic dehydration and further dehydration by air- and freeze-drying. Food and Bioproducts Processing. (2016) ;100: :156–71. |
[3] | Gamboa-Santos J , Megías-Pérez R , Soria AC , Olano A , Montilla A , Villamiel M . Impact of processing conditions on the kinetic of vitamin C degradation and 2-furoylmethyl amino acid formation in dried strawberries. Food Chemistry. (2014) ;153: :164–70. |
[4] | Karam MC , Petit J , Zimmer D , Baudelaire Djantou E , Scher J . Effects of drying and grinding in production of fruit and vegetable powders: A review. Journal of Food Engineering. (2016) ;188: :32–49. |
[5] | Dermesonlouoglou EK , Giannakourou M , Taoukis PS . Kinetic study of the effect of the osmotic dehydration pre-treatment with alternative osmotic solutes to the shelf life of frozen strawberry. Food and Bioproducts Processing. (2016) ;99: :212–21. |
[6] | Prosapio V , Norton I . Influence of osmotic dehydration pre-treatment on oven drying and freeze-drying performance. LWT.. (2017) ;80: :401–8. |
[7] | Lech K , Michalska A , Wojdyło A , Nowicka P , Figiel A . The influence of physical properties of selected plant materials on the process of osmotic dehydration. LWT- Food Science and Technology. (2018) ;91: :588–94. |
[8] | Ozkoc SO , Sumnu G , Sahin S . Recent development in microwave heating. In: Da-Wen Sun (Ed.). Emerging technologies for Food Processing, Academic Press. (2014) ;361–83. |
[9] | Camirand WM , Forrey RR . Osmotic dehydration of coated foods 1969, p. 715, Zaragoza, Spain. US Patent. 3,425,848. |
[10] | Muhr AH , Blanshard JMV . Diffusion in gels. Polymer. (1982) ;23: (7):1012–26. |
[11] | Matuska M , Lenart A , Lazarides HN . On the use of edible coatings to monitor osmotic dehydration kinetics for minimal solids uptake. Journal of Food Engineering. (2006) ;72: (1):85–91. |
[12] | Rodriguez A , García MA , Campañone LA . Experimental study of the application of edible coatings in pumpkin sticks submitted to osmotic dehydration. Drying Technology: An International Journal. (2016) ;34: (6):635–44. http://doi.org/10.1080/07373937.2015. |
[13] | Ferrari CC , Sarantópoulos CIGL , Carmello-Guerreiro SM , Hubinger MD . Effect of osmotic dehydration and pectin edible coatings on quality and shelf life of fresh-cut melon. Food and Bioprocess Technology. (2013) ;6: :80–91. |
[14] | Dovale-Rosabala G , Casariego A , Forbes-Hernandez T , Garcıa M . Effect of chitosan-olive oil emulsion coating on quality of tomatoes during storage at ambient conditions. Journal of Berry Research. (2015) ;5: :207–18. |
[15] | Guerreiro AC , Gago CML , Faleiro ML , Miguel MGC , Antunes MDC . The use of polysaccharide-based edible coatings enriched with essential oils to improve shelf-life of strawberries. Postharvest Biology and Technology. (2015) ;110: :51–60. |
[16] | Soteras M , Gamboa-Santos J , Campañone L . Characterization of sodium alginate hydrogels and low methoxyl pectin during pre-treatments of osmotic dehydration. Latin American Congress of Engineering and Applied Sciences - CLICAP 2018, 585-91. http://fcai.uncuyo.edu.ar/upload/02-trabajo-completo-alimentos.pdf. |
[17] | Avendaño-Romero GC , López-Malo A , Palou E . Properties of alginate and food applications. Select Food Engineering Topics. (2013) ;7: (1):87–96. |
[18] | Gomez CG , Pérez Lambrecht MV , Lozano JE , Rinaudo M , Villar MA . Influence of the extraction–purification conditions on final properties of alginates obtained from brown algae (Macrocystis pyrifera). International Journal of Biological Macromolecules. (2009) ;44: (4):365–71. |
[19] | Vilela A , Sobreira C , Abraão AS , Lemos AM , Nunes FM . Texture Quality of Candied Fruits as Influenced by Osmotic Dehydration Agents. Journal of Texture Studies. (2016) ;47: (3):239–52. |
[20] | Contreras C , Benlloch-Tinoco M , Rodrigo D , Martínez-Navarrete N . Impact of microwave processing on nutritional, sensory, and other quality attributes. The Microwave Processing of Foods. 2017;65-99. |
[21] | Palzer S , Dubois C , Gianfrancesco A . Generation of Product Structures During Drying of Food Products. Drying Technology. (2012) ;30: (1):97–105. |
[22] | Niamnuy C , Devahastin S , Soponronnarit S . Some recent advances in microstructural modification and monitoring of foods during drying: A review. Journal of Food Engineering. (2014) ;123: :148–56. |
[23] | Megías-Pérez R , Gamboa-Santos J , Soria AC , Villamiel M , Montilla A . Survey of quality indicators in commercial dehydrated fruits. Food Chemistry. (2014) ;150: :41–8. |
[24] | Gamboa-Santos J , Campañone LA . Application of osmotic dehydration and microwave drying to strawberries coated with edible films. Drying Technology. 2018;1-11. |
[25] | Fernandes FAN , Rodrigues S . Optimization of osmotic dehydration of bananas followed by air-drying. Journal of Food Engineering. (2006) ;77: :188–93. |
[26] | AOAC. Method 934.06, in: Official Methods of Analysis of the Association of Official Analytical Chemists (15va ed.), vol. 1, ed. Association of Official Analytical ChemistsArlington, VA; 1997. |
[27] | Crank J . The Mathematics of Diffusion, 2nd ed. Oxford University Press, Oxford. 205–09;(1975) . |
[28] | Váquiro HA , Bon J , Diez JL . Fuzzi logic application to drying kinetics modelling. Proceedings of the 17th World Congress. The International Federation of Automatic Control. Seoul, Korea, July 6-11, 2008. |
[29] | Simal S , Femenia A , García-Pascual P , Roselló C . Simulation of the drying curves of a meat-based product: effect of the external resistance to mass transfer. Journal of Food Engineering. (2003) ;58: (2):193–9. |
[30] | Aghbashlo M , Hosseinpour S , Ghasemi-Varnamkhasti M . Computer vision technology for real-time food quality assurance during drying process. Trends in Food Science & Technology. (2014) ;39: (1):76–84. |
[31] | Gamboa-Santos J , Soria AC , Fornari T , Villamiel M , Montilla A . Optimisation of convective drying of carrots using selected processing and quality indicators. International Journal of Food Science and Technology. (2013) ;48: (10):1998–2006. |
[32] | Giovanelli G , Brambilla A , Sinelli N . Effects of osmo-air dehydration treatments on chemical, antioxidant and morphological characteristics of blueberries. LWT - Food Science and Technology. (2013) ;54: (2):577–84. |
[33] | Ciurzynska A , Lenart A . Rehydration and sorption properties of osmotically pretreated freeze-dried strawberries. Journal of Food Engineering. (2010) ;97: (2):267–74. |
[34] | Baldwin EA . Edible coatings for lightly processed fruits and vegetables. Journal of Hortsciene. (1995) ;30: (1):35–7. |
[35] | Tavassoli-Kafrani E , Shekarchizadeh H , Masoudpour-Behabadi M . Development of edible films and coatings from alginates and carrageenans. Carbohydrate Polymers. (2016) ;137: :360–74. |
[36] | Khin MM , Zhou W , Perera CO . A study of the mass transfer in osmotic dehydration of coated potato cubes. Journal of Food Engineering. (2006) ;77: (1):84–95. |
[37] | Nussinovitch A . Biopolymer films and composite coatings. In: S. Kasapis, I. T. Norton, & J.B. Ubbink (Eds). Modern biopolymer science: Bridging the divide between fundamental treatise and industrial application, Academic Press. 2009;295-326. |
[38] | Lazarides HN , Mitrakas GE , Matsos KI . Edible coating and counter-current product/solution contacting: A novel approach to monitoring solids uptake during osmotic dehydration of a model food system. Journal of Food Engineering. (2007) ;82: (2):171–7. |
[39] | Soteras EM . Application of edible coatings to products subjected to osmotic dehydration.Doctoral Thesis, 2020.Chemical Engineering Department, Faculty of Engineering, National University of La Plata. |
[40] | Ahmed I , Qazi IM , Jamal S . Developments in osmotic dehydration technique for the preservation of fruits and vegetables. Innovative Food Science and Emerging Technologies. (2016) ;34: :29–43. |
[41] | Ispir A , Toğrul ÐT . Osmotic dehydration of apricot: Kinetics and the effect of process parameters. Chemistry of Engineering Research and Design. (2009) ;87: :166–80. |
[42] | Phisut N . Factors affecting mass transfer during osmotic dehydration of fruits. International Food Research Journal. (2012) ;19: (1):7–18. |
[43] | García M , Díaz R , Martínez Y , Casariego A . Effects of chitosan coating on mass transfer during osmotic dehydration of papaya. Food Research International. (2010) ;43: (6):1656–60. http://doi.org/10.1016/j.foodres.2010.05.002. |
[44] | Cárcel JA , Garcia-Perez JV , Riera E , Mulet A . Improvement of convective drying of carrot by applying power ultrasound. Influence of mass load density. Drying Technology. (2011) ;29: :174–82. |
[45] | Yao ZM , Le Maguer M . Mathematical modelling and simulation of mass transfer in OD processes. Conceptual and Mathematical Models. Journal of Food Engineering. (1996) ;29: (3-4):349–60. |
[46] | Islam MZ , Das S , Monalisa K , Sayem A . Influence of Osmotic Dehydration on Mass Transfer Kinetics and Quality Retention of Ripe Papaya (Carica papaya L) during Drying. AgriEngineering. (2019) ;1: :220–34. |
[47] | Khin MM , Zhou W , Perera CO . Impact of process conditions and coatings on the dehydration efficiency and cellular structure of apple tissue during osmotic dehydration. Journal of Food Engineering. (2007) a;79: (3):817–27. http://doi.org/10.1016/j.jfoodeng.2006.02.046. |
[48] | Jalaee F , Fazeli A , Fatemian H , Tavakolipour H . Mass transfer coefficient and the characteristics of coated apples in osmotic dehydrating. Food and Bioproducts Processing. (2011) ;89: (4):367–74. |
[49] | Allali H , Marchal L , Vorobiey E . Blanching of Strawberries by Ohmic Heating: Effects on the Kinetics of Mass Transfer during Osmotic Dehydration. Food and Bioprocess Technology. (2010) ;3: (3):406–14. |
[50] | Brandelero PRH , Vieira AP , Telis RVN , Telis-Romero J , Yamashita F . Application of edible coatings in processed pineapples products by hurdle technology: desorption isotherms and kinetics of the osmotic dehydration. Ciencia y Tecnología de Alimentos. (2005) ;25: (2):285–90. |
[51] | Singh C , Sharma HK , Sarkar B . Influence of process conditions on the mass transfer during osmotic dehydration of coated pineapple samples. Journal of Food Processing and Preservation. (2010) ;34: (4):700–14. |
[52] | Lech K , Michalska A , Wojdyło A , Nowicka P , Figiel A . The influence of physical properties of selected plant materials on the process of osmotic dehydration. LWT- Food Science and Technology. (2018) ;91: :588–94. |
[53] | Ramaswamy HS . Osmotic drying. Workshop on drying of food and pharmaceuticals. Fourth Asia Pacific Drying Conference, 12 December, 2005, Kolkata, India. |
[54] | Tortoe C . A review of osmodehydration for food industry. African Journal of Food Science. (2010) ;4: (6):303–24. |
[55] | Suutarinen M , Autio K . Improving the texture of frozen fruit: the case of berries. In Texture in Food: Volume 2: Solid Foods, D. Kilcast (Ed.), 388-409;2004. |
[56] | Torregiani D , Lucas T , Raoult-Wack AL . The pre-treatment of fruits and vegetables. In: Managing Frozen Foods. Ed. C J Kennedy Cambridge, CRC Press; 2000. |
[57] | Moreno J , Simpson R , Baeza A , Morales J , Muñoz C , Sastry S , et al. Effect of ohmic heating and vacuum impregnation on the osmo-dehydration kinetics and microstructure of strawberries (cv. Camarosa). LWT - Food Science and Technology.. (2012) ;45: (2):148–54. |
[58] | Chen L , Opara UL . Approaches to analysis and modeling texture in fresh and processed foods - A review. Journal of Food Engineering. (2013) ;119: (3):497–507. |
[59] | Wong WS , Tillin S , Hudson JS , Pavlath E . Gas exchange in cut apples with bi-layer coatings. Journal of Agricultural Food Chemistry. (1994) ;42: :2278–85. |
[60] | El-Beltagy A , Gamea GR , Ammer Essa AH . Solar drying characteristics of strawberry. Journal of Food Engineering. (2007) ;78: :456–64. |
[61] | Gamboa-Santos J , Montilla A , Cárcel JA , Villamiel M , Garcia-Perez JV . Air-borne ultrasound application in the convective drying of strawberry. Journal of Food Engineering. (2014) ;128: :132–9. |
[62] | Maldonado S , Arnau E , Bertuzzi MA . Effect of temperature and pre-treatment on water diffusion during rehydration of dehydrated mangoes. Journal of Food Engineering. (2010) ;96: :333–41. |
[63] | Soria AC , Corzo-Martinez M , Montilla A , Riera E , Gamboa-Santos J , Villamiel M . Chemical and physicochemical quality parameters in carrots dehydrated by power ultrasound. Journal of Agricultural and Food Chemistry. (2010) ;58: :7715–22. |


