
Transcriptome sequencing and de novo assembly in red raspberry fruit development to elucidates the secondary metabolite pathways
Abstract
BACKGROUND:
Red raspberry (Rubus idaeus L.), known as “golden fruit”, has excellent potential for immune-regulation, anti-inflammation and anti-cancer due to its health-promoting secondary metabolites. The lack of genetic information in public databases has been a constraint for the genetic improvement of red raspberry.
OBJECTIVE:
The primary aim of the work was to find the key genes relating with the secondary metabolite pathways.
METHODS:
De novo assembly transcriptome sequencing of red raspberry (‘Heritage’ variety) fruit in different development stages was performed using an Illumina Hiseq platform. Transcriptome was obtained by the de novo assembly through Trinity assembler. Coding sequences were successfully characterized using databases including non-redundant protein (NR), euKaryotic Ortholog Groups of proteins (KOG), Gene Ontology (GO) and Kyoto Encyclopedia of Genes and Genomes (KEGG). Fragments Per Kilobase of transcript sequence per Million base pairs sequenced (FPKM) method was used to calculate the differentially expressed unigenes.
RESULTS:
In total, 205,880 unigenes with an average length of 1120 bp and an N50 of 2005 bp were obtained, of which 182,443 unigenes were annotated. Non redundant (NR) annotation showed that a majority of the best hits (58.6%) are wild strawberry (Fragaria vesca). Additionally, the unigenes were also annotated in euKaryotic Ortholog Groups of proteins database and Gene ontology database, and mapped the KEGG pathways. We predicted that 8331 TFs from the unigenes database and these TFs were classified into 94 different common families. The major families were associated with the C2H2 (9.19%), followed by the C3H (4.60%), MYB-related group (4.23%), bZIP (4.13%) and B3 (4.03%). These results were considered to be involved in the regulation of metabolic and secondary metabolic biosynthesis. Totally, 3,369, 3,461 and 441 differentially expressed genes (DEGs) were found in period 2 vs period 1, period 3 vs period 2 and period 4 vs period 3 paired comparisons, respectively. These DEGs were analyzed based on BLASTx, which were mapped to 22 KEGG pathways associating with secondary metabolites during red raspberry fruit ripening, involving anthocyanin biosynthesis, flavonoid biosynthesis, sesquiterpenoid and triterpenoid biosynthesis, etc. To validate the high-throughput sequencing results, six target genes involved in secondary metabolite pathways of red raspberry fruit were tested by qRT-PCR. The results of qRT-PCR assay were generally consistent with the results of RNA sequencing.
CONCLUSION:
The transcriptome sequencing of the red raspberry fruit at different development stage in this study enriched the genetic information resources of this variety, and will discover the genes relating with secondary metabolic pathways, benefiting to engineer high-quality plants with enhanced active ingredients.
1.Introduction
Natural and safe food, especially containing abundant bioactive components, is increasingly popular due to its healthy functions. Red raspberry (Rubus idaeus L.), known as ‘golden fruit’, is rich in raspberry ketone, anthocyanin, ellagitannin/ellagic acid, salicylic acid, flavonoids and other substances, and is widely distributed and cultivated in Europe, America and Asia. Its edible fruit is usually used for fresh or processed fruit [1–3], but its medicinal properties has drawn much attention recently due to the existed scientific works evidencing excellent potential for immune-regulation, anti-inflamation, anticancer and promoting stem cell differentiation into osteoblasts [4–10], mainly attributing to its health-promoting secondary metabolites. Therefore, increasing the secondary metabolites of the red raspberry fruit is much more favourable to human health.
The red raspberry fruit develpment is a genetically programmed process involving various biochemical and physiological processes. By genetic inheritance and environment regulation, the content of the secondary metabolites can be changed at different phisiological and developmental stage [11–13]. It has been proved that exogenous elicitors (e.g., methyl jasmonate, abscisic acid and pyrabactin) and modification of the nutritional status triggered the enhancement of bioactive compounds in red raspberry [14–16]. Functional genomics approaches accelerated the comprehensive research on biological systems and the gene discovery for secondary metabolite pathways [11]. Using the reverse transcriptase competitor polymerase chain reaction assay, two genes (RiPAL1 and RiPAL2) encoding L-phenylalanine ammonia-lyase (PAL) were determined in raspberry [17]. The expression of flavonoid pathway genes and developmental and environmental conditions governed the production and distribution of anthocyanin in the fruits [18, 19]. However, most of these functional genomics approaches have been limited to the sequenced plants.
Thanks to the next-generation high-throughput sequencing technologies such as Illumina HiSeq, 454 Pyrosequencing and SOLID sequencing, transcriptome sequencing has been broadly applied to get transcript sequences and gene expression data quickly and cost-effectively for non-model species without reference genomic information [20–22]. Tissue- and stage- transcriptomic profiling of woodland strawberry flower and early-stage fruit development were generated based on transcriptome analysis [23, 24], proving a wealth of genomic resources for the strawberry. Similarly, complete transcriptome data concerning mature fruit of blackberry has been obtained using the RNA-seq technology [25]. More studies by de novo assembly transcriptome sequencing on cranberry [26], blueberry [27], black raspberry [28, 29] and Salvia miltiorrhiza [30] facilitated our understanding of the molecular mechanisms of organs development of the plants and the secondary metabolic regulation mechanisms.
Despite significant progress in illuminating the molecular basis of the organ’s development and biosynthesis of active ingredients in many species, the secondary metabolic pathway genes operated in the red raspberry fruit development is not well understood. Taking advantage of the next-generation sequencing, we performed the de novo assembly transcriptome sequencing to profile the transcriptomes of red raspberry (Rubus idaeus L.) at four developmental stages. Moreover, we identified a set of putative gens involved in pathways of secondary metabolism, enriching the gene resource of Rubus idaeus L. with these data. Here, we report initial analysis of these molecular information, which is significant to discover the genes relating with secondary metabolic pathways and engineer high-quality plants with enhanced active ingredients.
2.Materials and methods
2.1.Plant material and tissue collection
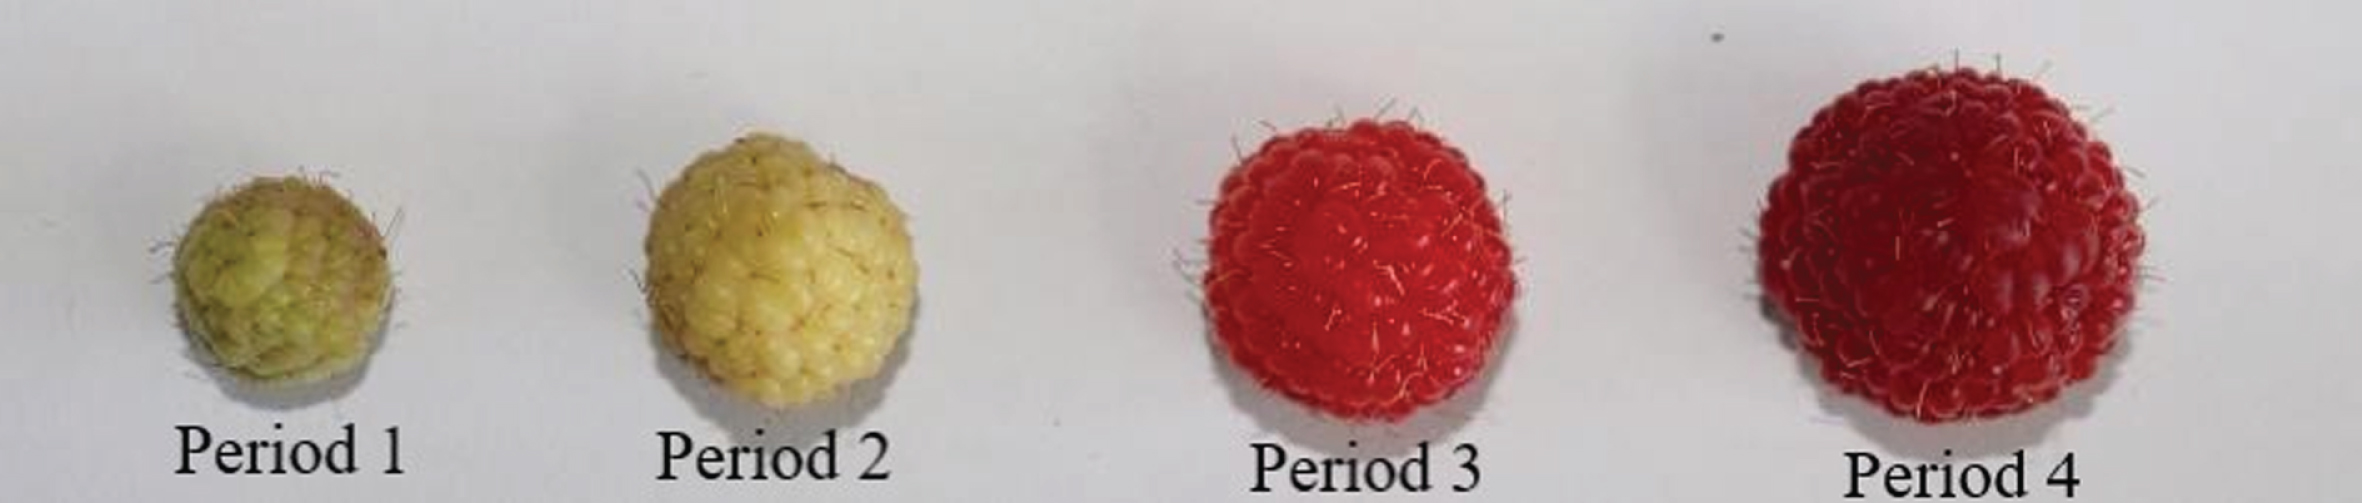
Red raspberry (Heritage) plants used in this study were cultivated in Xingtai, Hebei province, China (36° 50′ to 37° 47′ N and 113° 52′ to 115° 49′ E). This area has a warm temperate semi-humid continental monsoon climate, with four distinctive seasons. The annual mean temperature is 12∼14°C. The fruit sampling is divided into four developmental stages (Fig. 1), the green fruit (period 1, 15 d after full bloom (DAFB)), yellow fruit (period 2, 25 DAFB), red fruit (period 3, 28 DAFB) and deep red fruit (period 4, 30 DAFB). Fruit samples at the different developmental stage were collected from at least 5 plant individuals. All the samples were immediately frozen in liquid nitrogen and stored at –80°C until RNA extraction. At least three fruits were combined to form one biological replicate and each sample has three biological replicates.
Fig. 1.
The red raspberry fruits at different development stage.
2.2.Library construction and sequencing
Total RNA was extracted from the 0.1 to 0.5 g of fruits tissue at different developmental stages using RNA prep pure Plant Kit (Tiangen Biotech Co., Ltd., Beijing, China) according to the manufacturer’s instructions. A total amount of 1.5 μg RNA per sample was used as input material for the RNA sample.
The quality and quantity of RNA was determined using a quadruple check, Agilent 2100 Bioanalyzer (Agilent Technologies, CA, USA), NanoPhotometer spectrophotometer (Implen, CA, USA), Qubit 2.0 Fluorometer (Life Technologies, CA, USA) and gel electrophoresis. NEBnext Ultra RNA Library Prep Kit for Illumina (NEB, USA) was used to generate the sequencing libraries on the basis of manufacturer’s recommendations according to the reported work [31]. Sequencing was carried out at Beijing Novogene Biological Information Technology Co., Ltd. (Beijing, China) employing the Illumina TruSeqTM RNA Sample Preparation Kit (Illumina, San Diego, CA, USA) according to the manufacturer’s recommendations. The library preparations were sequenced using an Illumina Hiseq platform, and paired-end reads were generated.
2.3.Transcriptome assembly
Clean reads without adaptor sequences, reads containing poly-N and low-quality sequences were obtained after processing the raw reads. Meanwhile, Q20, Q30, GC-content and sequence duplication level of the clean reads were calculated. All the downstream analyses were based on clean data with high quality. Transcriptome de novo assembly with clean reads was carried out using the assembling program Trinity (version 2.4.0) [22] with min_kmer_cov set to 2 by default and all other parameters set default [31].
2.4.Annotation and classification of gene functions
Unigene sequences were firstly aligned by Blast X to the databases including National Center for Biotechnology Information (NCBI) non-redundant protein (NR) database, Swiss-Prot, euKaryotic Ortholog Groups of proteins (KOG), NCBI nucleotide sequences (NT), Protein family (Pfam), Gene Ontology (GO) and Kyoto Encyclopedia of Genes and Genomes (KEGG). Then we retrieved proteins owning the hightest sequence similarity with the given sequences and determined their functional annotations.
2.5.Analysis of differentially expressed genes
The expression levels of the unigenes from four samples, the green fruit (period 1), yellow fruit (period 2), red fruit (period 3) and deep red fruit (period 4), were compared and analyzed according to the reported method. RNA-Seq by Expectation Maximization (RSEM) was used to evaluate gene expression changes at different development stage of red raspberry fruit [32]. Differential expression analysis of two groups was performed using the DESeq R package (1.10.1) based on the negative binomial distribution [33]. The false discovery rate was controled by adjusting P values according to the Benjamini and Hochberg’s approach. Genes with an adjusted P-value <0.05 found by DESeq were assigned as differentially expressed. The expected number Fragments Per Kilobase of transcript sequence per Million base pairs sequenced (FPKM) method was used to calculate the differentially expressed unigenes. Gene ontology (GO) enrichment analysis of the differentially expressed genes (DEGs) was performed using the GOseq R packages based Wallenius non-central hyper-geometric distribution [34], which can adjust for gene length bias in DEGs.
2.6.KEGG enrichment of some secondary metabolic pathways
The highly integrated KEGG databases provide a reference knowledge base for linking genomes to life through the process of pathway mapping [35]. KOBAS software (version 2.0.12) was used to test the statistical enrichment of differential expression genes in KEGG pathways [36].
2.7.The genetic verification of secondary metabolism by qRT-PCR
To validate the high-throughput sequencing results, six target genes involved in secondary metabolite pathways at all four development stages of red raspberry fruit were tested by qRT-PCR. Three biological replicates per sample were performed.
The cDNA was got using the TIANScript II RT Kit (Tiangen Biotech Co., Beijing, China) according to the manufacturer’s instructions, and qRT-PCR was carried out using the ChamQ Universal SYBR qPCR Master Mix Kit (Vazyme Biotech Co., Ltd, Nanjing, China). The real-time PCR system (Applied Biosystems, Foster City, USA) with a 96-well plate was used to conduct the reaction. The conditions for the PCR amplifications were as follows: 50°C for 2 min, 95°C for 10 min, followed by 45 cycles of 95°C for 15 s, 60°C for 30 s, 95°C for 15 s, 60°C for 15 s, and 95°C for 15 s. At last, it was slowly heated from 60°C to 90°C (0.05°C/s). A gene encoding β-actin was used as a reference. Relative expression levels of genes were calculated with the 2–ΔΔCt method [37, 38].
3.Results and discussion
3.1.cDNA sequence generation and de novo assembly
To construct the complete transcriptome of red raspberry fruit, a total of twelve cDNA libraries were established from red raspberry fruit at different development stage, with three biological replicates. As shown in Table 1, after sequencing by Illumina paired-end sequencing technology, a total of 639,658,620 raw reads (each of the 12 libraries received more than 42 million raw reads, with the number of raw reads ranging from 42,491,226 to 66,361,300) are obtained. By getting rid of low-quality reads and adapter sequences, 528,910,176 clean reads (each of the 12 libraries received more than 41 million raw reads, with the number of raw reads ranging from 41,352,578 to 64,926,710) are remained. After a rigorous quality assessment, Q20 in each sample is greater than 95%, Q30 is greater than 93%, with GC percentage ranging from 45% to 48%. These results indicate that all the subsequent analyses based on the clean reads are high quality.
Table 1.
Summary of sample sequencing output statistics
| Sample | Raw Reads | Clean reads | Clean bases | Error(%) | Q20(%) | Q30(%) | GC(%) |
| Period 1_1 | 57774024 | 56394178 | 8.46G | 0.03 | 96.11 | 94.42 | 46.70 |
| Period 1_2 | 62192608 | 60359728 | 9.05G | 0.03 | 96.10 | 94.42 | 46.65 |
| Period 1_3 | 61373354 | 59871868 | 8.98G | 0.03 | 95.57 | 93.72 | 47.37 |
| Period 2_1 | 47822078 | 46888354 | 7.03G | 0.03 | 95.92 | 94.17 | 46.18 |
| Period 2_2 | 44992554 | 43762708 | 6.56G | 0.03 | 96.05 | 94.34 | 46.20 |
| Period 2_3 | 66361300 | 64926710 | 9.74G | 0.03 | 96.16 | 94.49 | 46.69 |
| Period 3_1 | 50289912 | 49124036 | 7.37G | 0.03 | 96.29 | 94.64 | 45.68 |
| Period 3_2 | 59784676 | 57168814 | 8.58G | 0.03 | 96.38 | 94.77 | 46.25 |
| Period 3_3 | 48500302 | 47249072 | 7.09G | 0.03 | 96.15 | 94.45 | 46.14 |
| Period 4_1 | 50574428 | 49225878 | 7.38G | 0.03 | 96.20 | 94.53 | 47.75 |
| Period 4_2 | 42491226 | 41352578 | 6.2G | 0.03 | 96.29 | 94.65 | 46.21 |
| Period 4_3 | 47502158 | 46362960 | 6.95G | 0.03 | 96.15 | 94.47 | 48.58 |
Due to no reference genome sequence for red raspberry, the Trinity assembler [21] is used for de novo assembly of the clean reads, and the transcripts with a total nucleotide of 323,892,215 are obtained with an average length of 1120 bp, a median length of 645 bp and an N50 of 2005 bp (Table 2). To reduce redundancy and potential assembly errors, the genes with a total nucleotide of 298,544,002 is assembled from the transcripts, with an average length of 1450 bp, a median length of 1079 bp and an N50 of 2160 bp (Table 2). This higher proportion of gene assembly results provides sufficient data for subsequent analysis of biological information.
Table 2.
Splice sequence length distribution of the de novo assembly
| Min Length | Mean Length | Median Length | Max Length | N50 | N90 | Total Nucleotides | |
| Transcripts | 201 | 1120 | 645 | 19522 | 2005 | 442 | 323892215 |
| Genes | 201 | 1450 | 1079 | 19522 | 2160 | 697 | 298544002 |
3.2.Annotation and classification of gene functions
In order to get a comprehensive annotation of gene function, 205,880 unigenes were annotated using several databases. As summarized in Table 3, the number of unigenes are highly similar to entries in the NR (70.56%), NT (81.71%), Pfam (57.98%), KOG (26.72%), SwissProt (60.83%), KEGG (30.27%) or GO (58.21%). Moreover, about 88.61% of the unigenes are annotated in at least one of the above public databases, and 15.11% of the unigenes are annotated in all databases. Apart from the annotated unigenes, the rest may be untranslated areas or new genes, playing a specific role in the development of red raspberry fruit.
Table 3.
Success rate of genes annotated in seven official databases
| Number of Genes | Percentage (%) | |
| Annotated in NR | 145,285 | 70.56 |
| Annotated in NT | 168,221 | 81.71 |
| Annotated in KO | 62,321 | 30.27 |
| Annotated in SwissProt | 125,251 | 60.83 |
| Annotated in PFAM | 119,387 | 57.98 |
| Annotated in GO | 119,857 | 58.21 |
| Annotated in KOG | 55,025 | 26.72 |
| Annotated in all Databases | 31,117 | 15.11 |
| Annotated in at least one Database | 182,443 | 88.61 |
| Unannotated in each database | 23,437 | 11.39 |
| Total Unigenes | 205,880 | 100 |
All unigenes were aligned against the NR protein database of GenBank using BLASTx. The results are shown in Fig. 2, indicating that a majority of best hits (58.6%) are wild strawberry (Fragaria vesca). Moreover, 6.8% unigenes is similarity with Prunus mume followed by 6.0% with Prunus Persica. It is noteworthy that about 21.9 % unigenes are identified with other species.
Fig. 2.
Comparison of NR protein database annotated genes with other species.
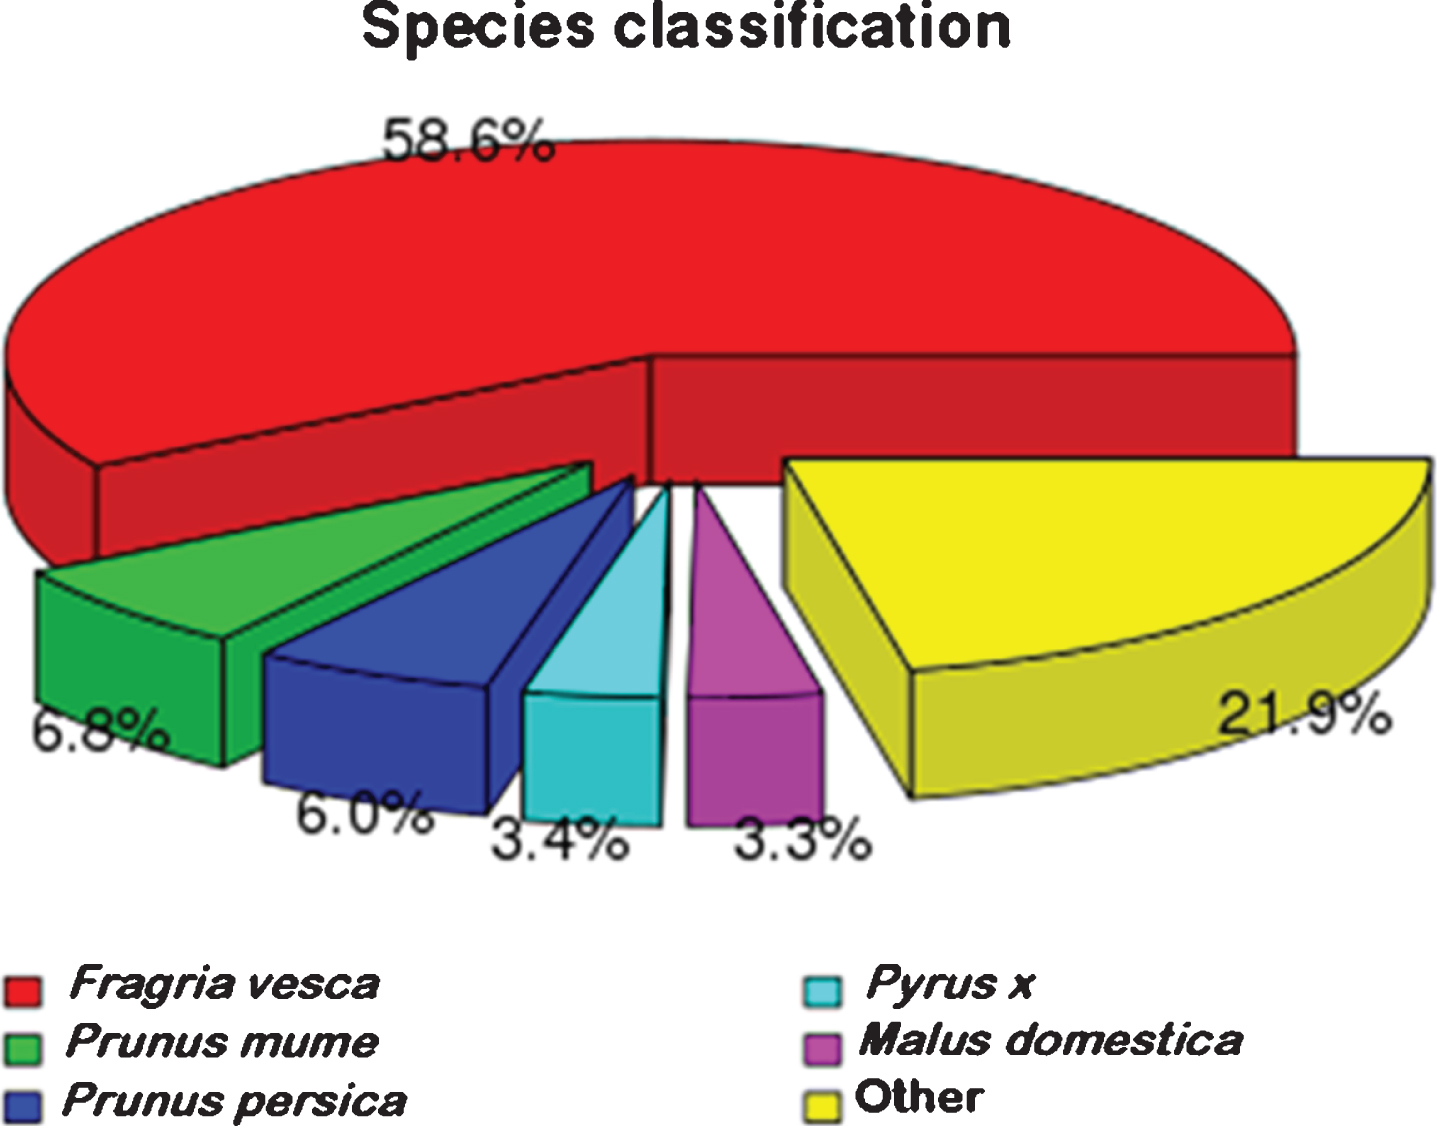
Among the annotated sequences, the species with the highest number of best hits were wild strawberry (Fragaria vesca), the similar result was found for blackberry [39] and Korean black raspberry [40]. These results are consistent since strawberry is the species closest to Rubus sp. with sequenced genomes, all belonging to the family Rosaceae, which also reflects the scientific nature of botany classification from the side. The strawberry sequence data in Fragaria×ananassa and Fragaria vesca have been presented [41, 42]. Unfortunately, the red raspberry genome has not yet been presented, and it is expected that when the raspberry genome is published, a comparison analysis with the strawberry genome will better elucidate the differences in their traits and the evolutionary relationships.
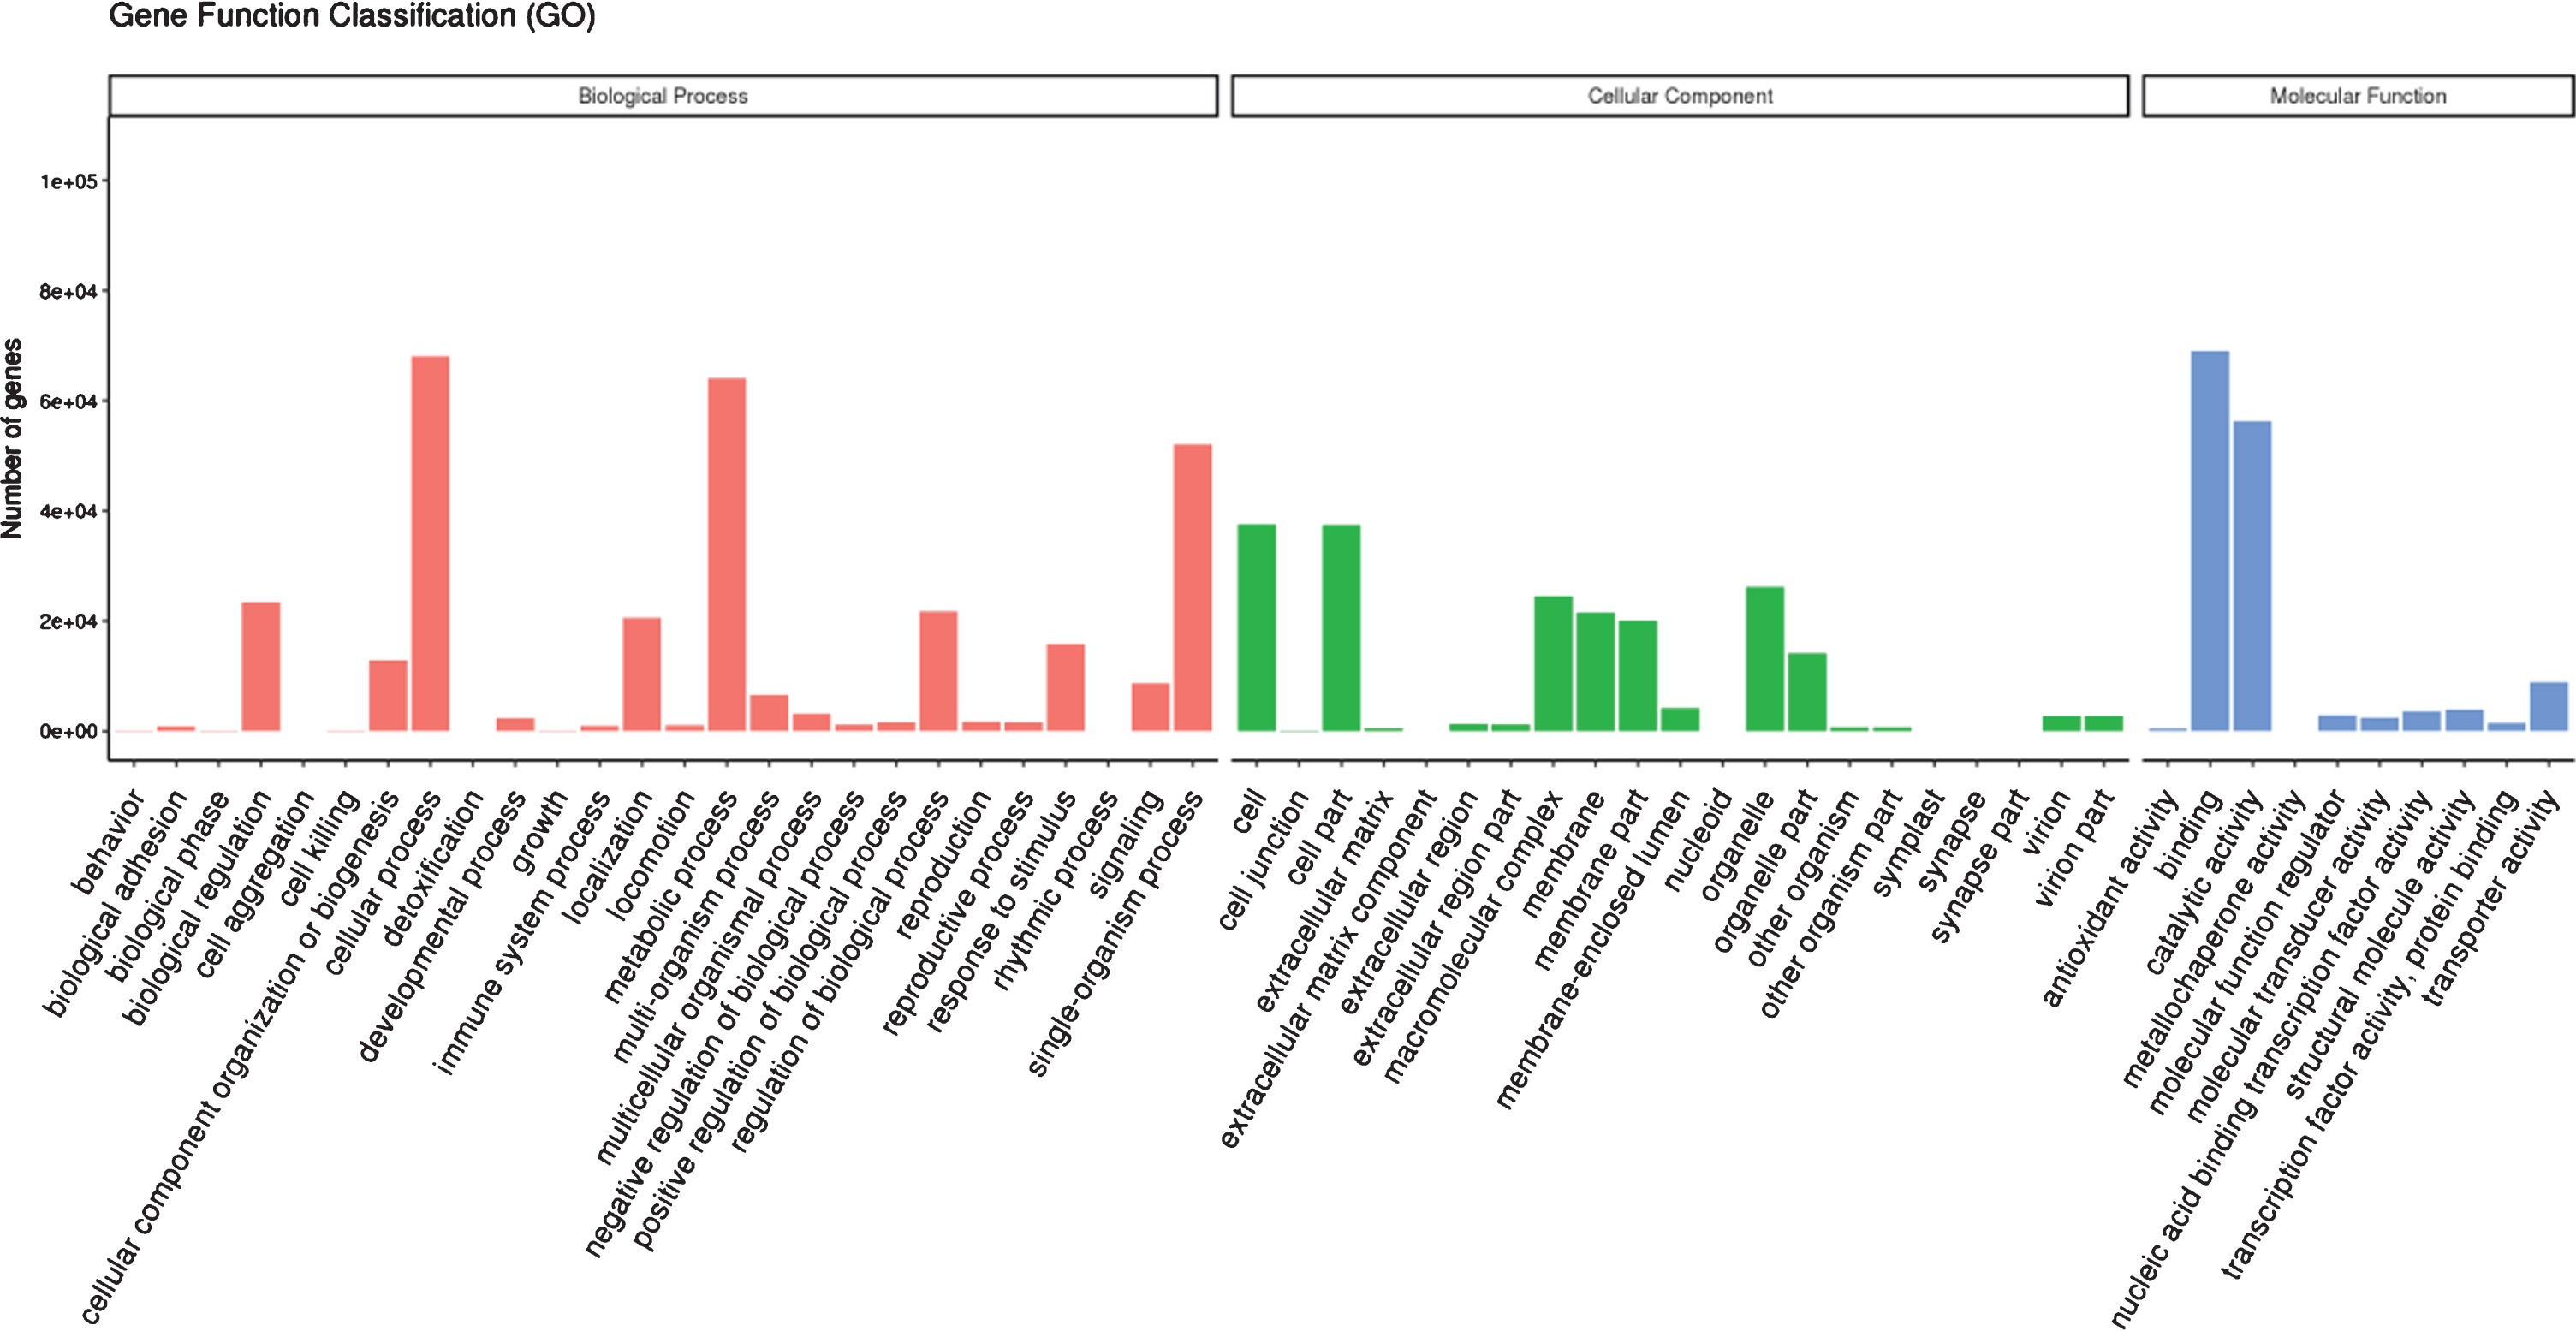
Gene ontology terms were assigned for the assembled unigenes. Based on sequence homology, 119,857 unigenes were assigned to 3 main GO categories with 57 classifications. As shown in Fig. 3, these genes are mainly associated with the categories of cellular process (68,030), metabolic process (64,124), single-organism process (52,079), biological regulation (23,456), regulation of biological process (21,723) and localization (20,583) in biological process categories, cell (37,496), cell part (37,475), organelle (26,207), macromolecular complex (24,424), membrane (21,526) and membrane part (20,077) in cellular component categories, and binding (68,985) and catalytic activity (56,297) in molecular function categories. The major volume of sequences was mapped in the biological process category with a high number of sequences associated to different metabolic processes, with similar observations for de-novo RNA-seq of Chilean red raspberry [43] and ripe blackberry [39]. For cellular component category, we observed a high number of sequences related to cell and cell part, with similar results to blackberry [39]. But a high percent of sequences associated to the cytoplasm for the cellular category was found in Chilean red raspberry [43]. Moreover, for molecular function category, de-novo RNA-seq of red raspberry in our study showed a major number of sequences associated to binding than to catalytic activity, and the similar result was determined for Chilean red raspberry [43]. But for blackberry, a similar percent of sequences associated to binding and catalytic activity for molecular function category was found [39].
Fig. 3.
Gene ontology terms assigned for functionally annotated genes of red raspberry fruit.
By blasting against the KOG database to predict and classify function of genes, the 55,025 uingenes were assigned to 26 KOG categories, including the categories of general function prediction only (7418), protein turnover and chaperones (7225), translation, ribosomal structure and biogenesis (5250), posttranslational modification and signal transduction mechanisms (4503), RNA processing and modification (3717), and other categories (Fig. 4).
Fig. 4.
Functional annotation and classification based on KOG database.
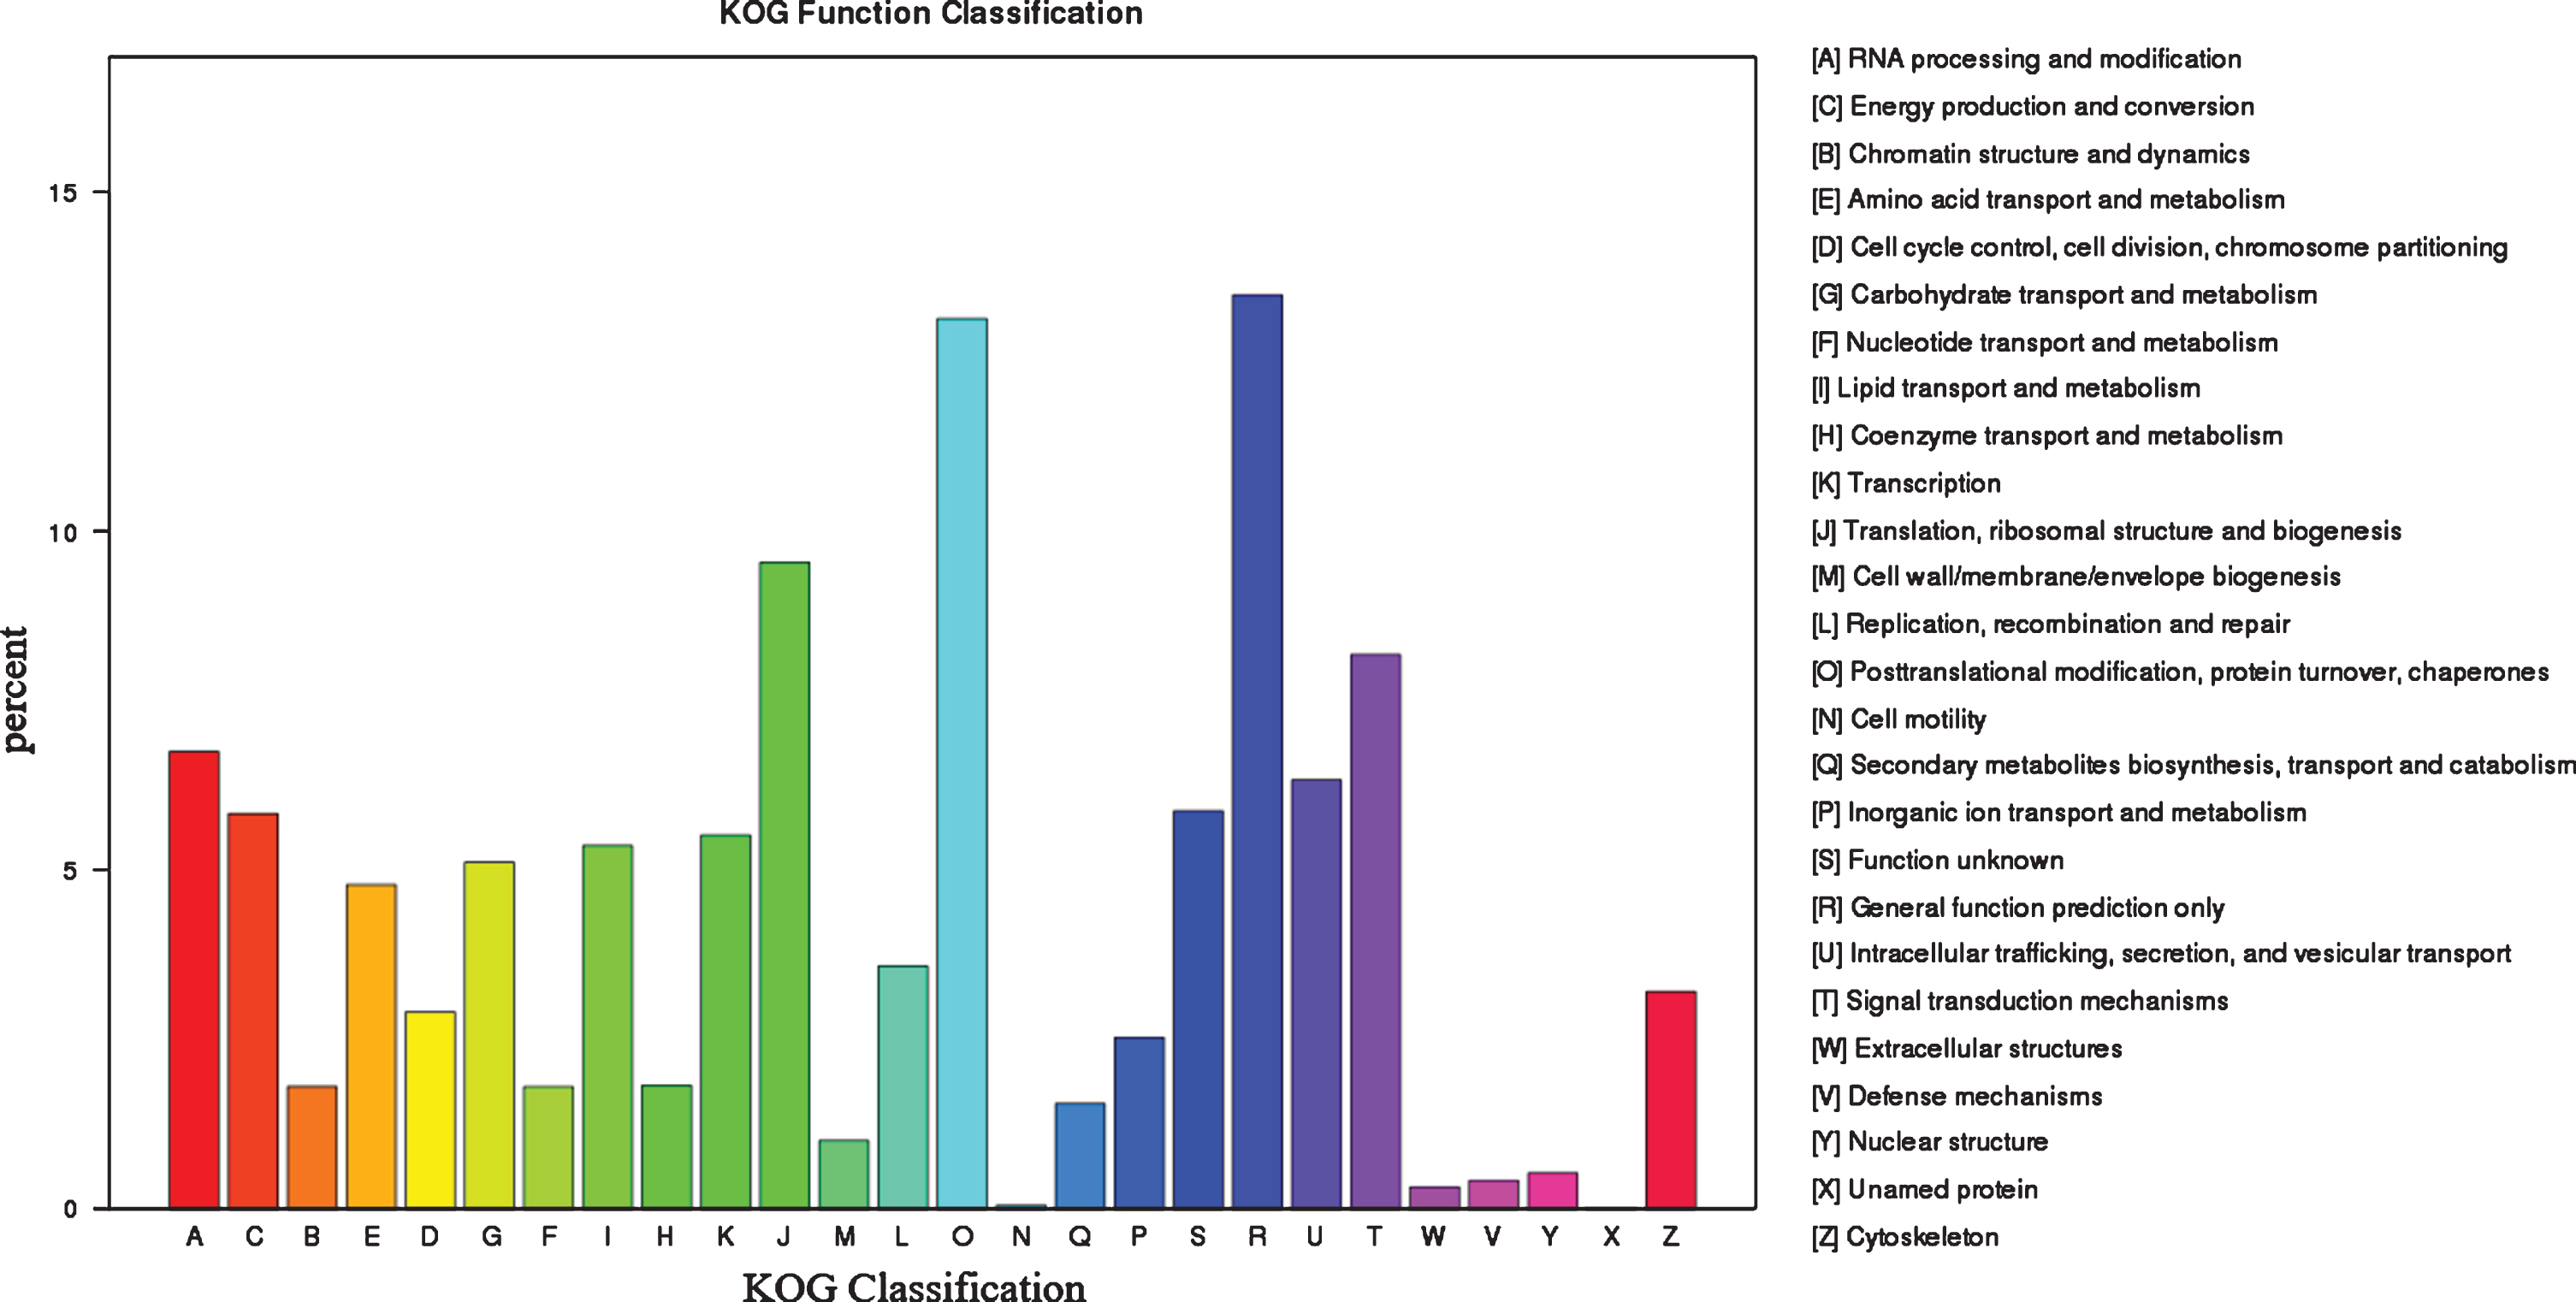
Fig. 5.
Functional annotation and classification based on KEGG database-The x-axis represents the ratio of the number of annotated genes to the total number of annotated genes, and the y-axis is the name of the KEGG metabolic pathway. According to the KEGG metabolic pathway involved in gene division, it is divided into 5 branches (A-Cellular Processes, B-Environmental Information Processing, C-Genetic Information Processing, D-Metabolism, E-Organismal Systems).
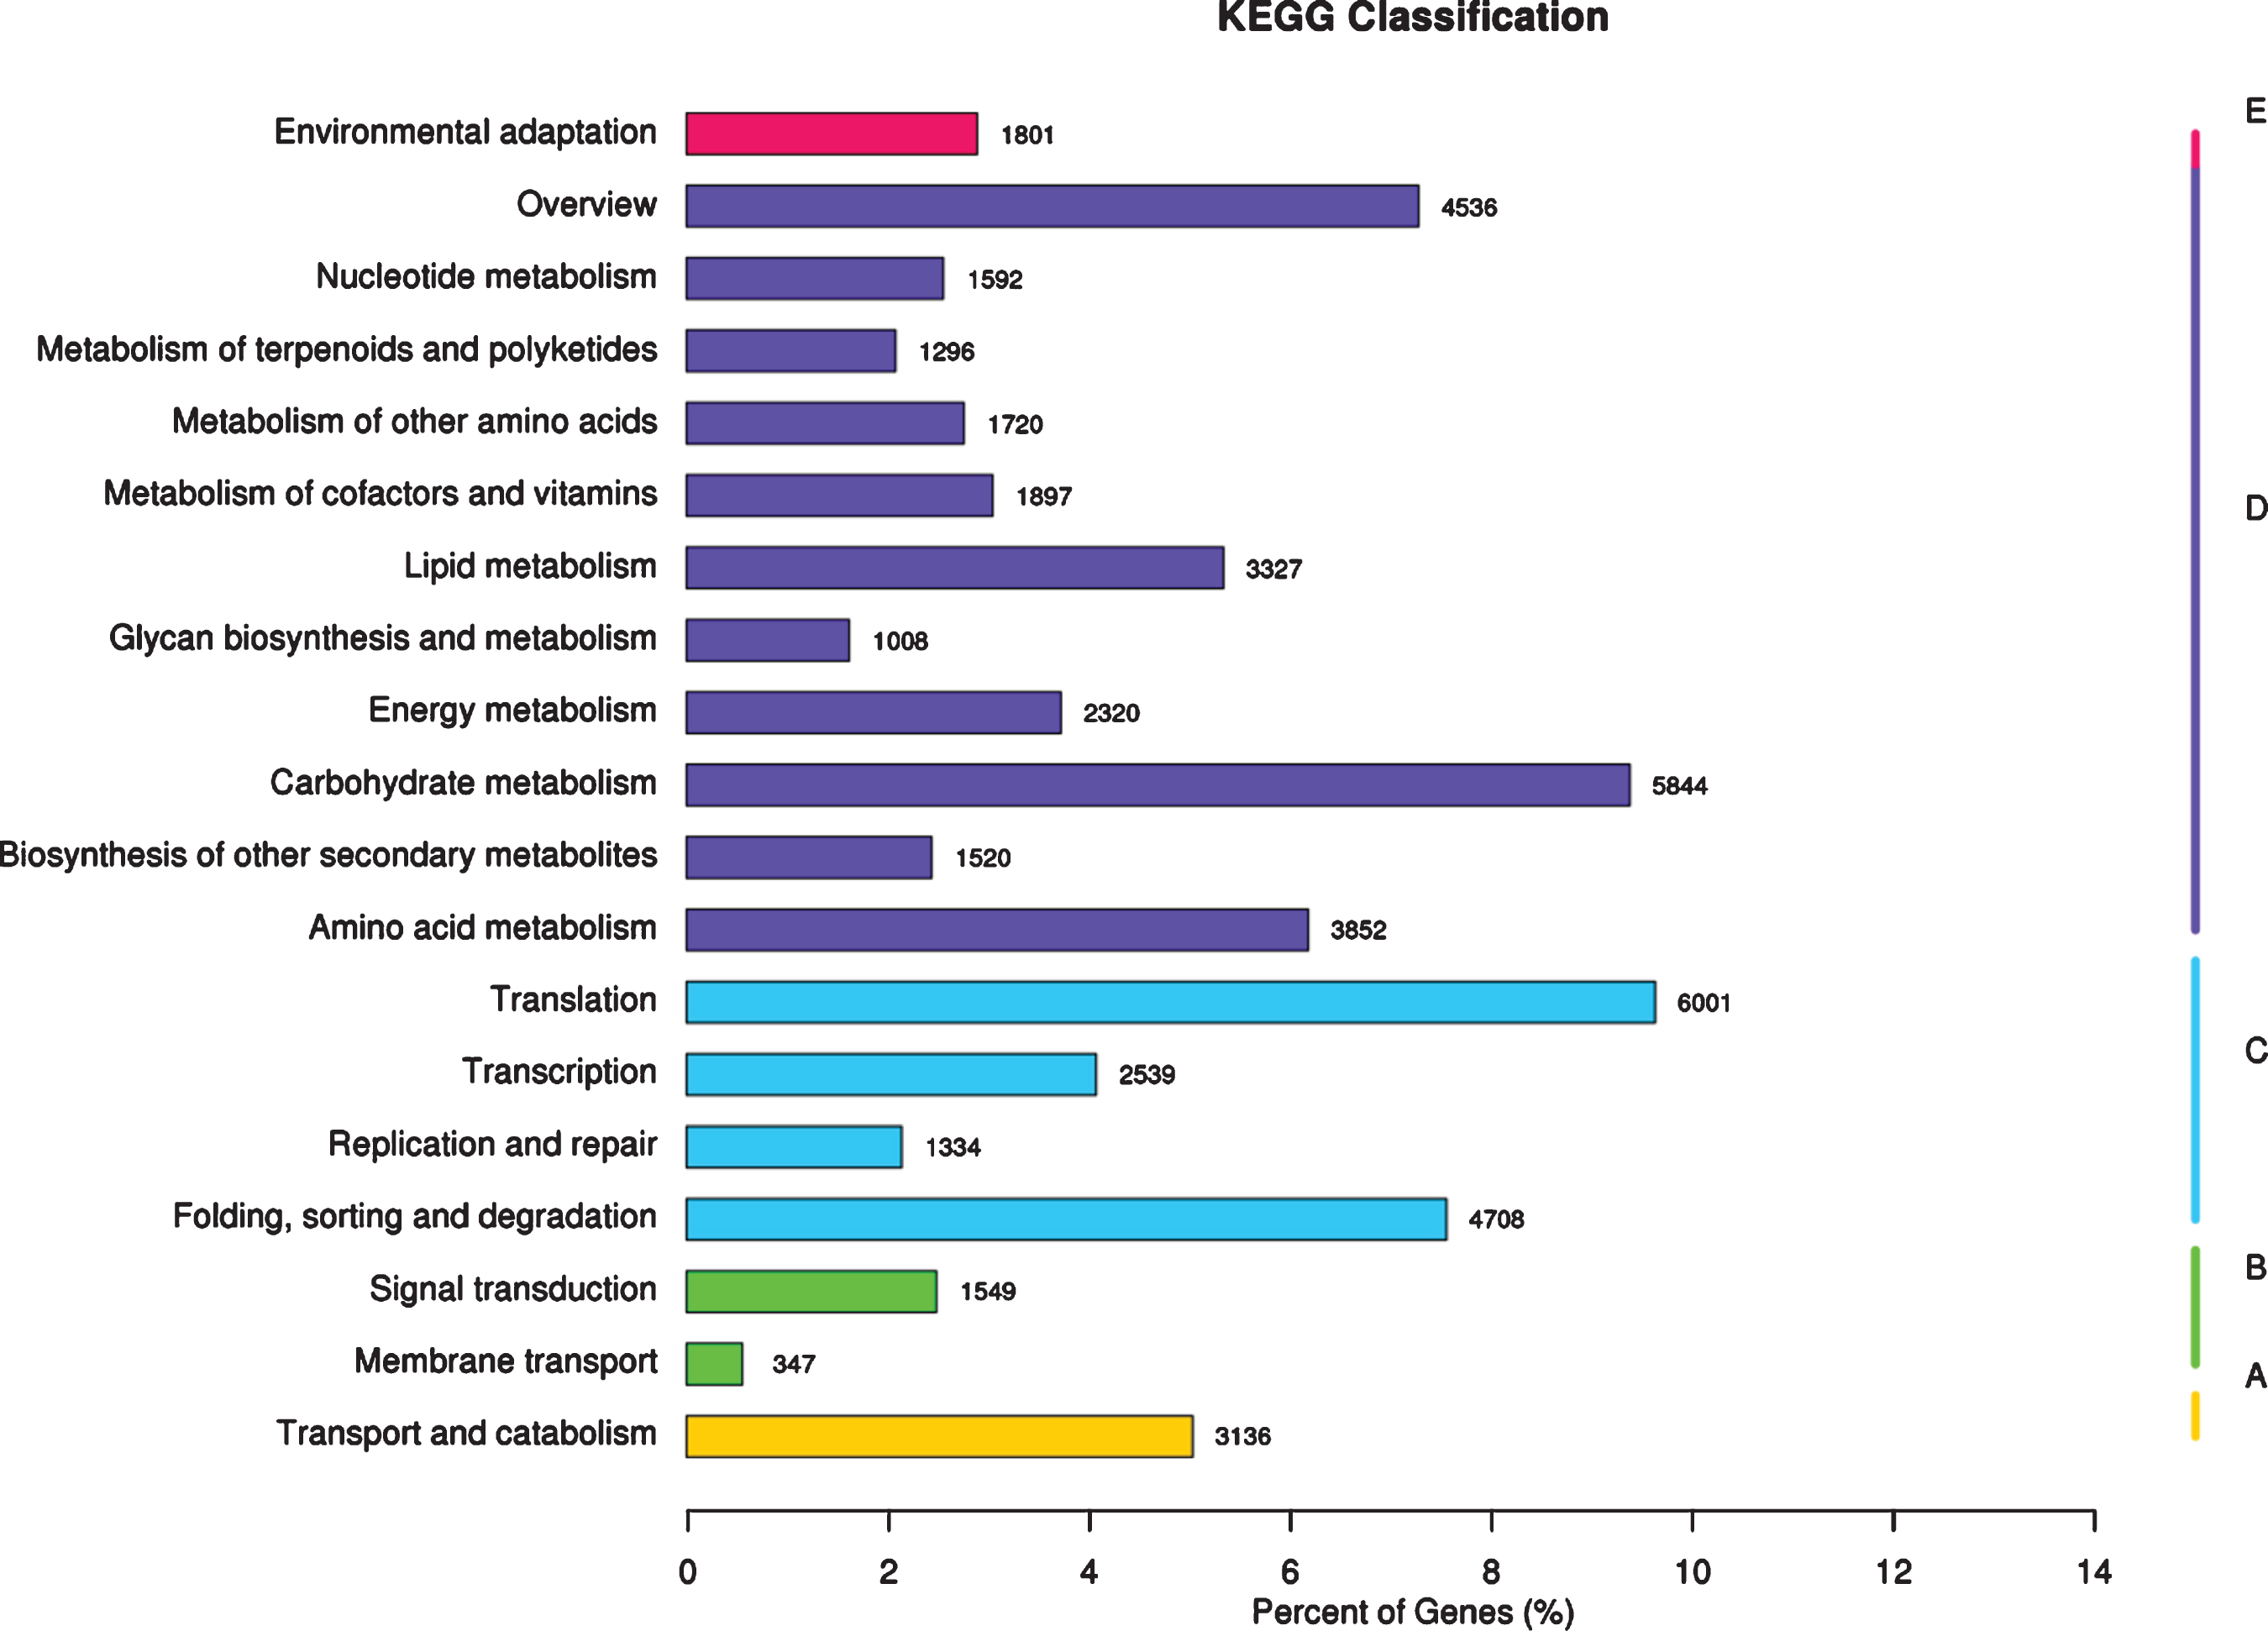
KEGG analysis system was used to assigned the unigene metabolic pathway. As illustrated in Fig. 5, the 62,321 unigenes significant matching in the database for KEGG pathway analysis are mapped to 19 pathways, mainly including translation (6,001), carbohydrate metabolism (5,844), folding, sorting and degradation (4,708), overview (4,536), amino acid metabolism (3,852), lipid metabolism (3,327), transport and catabolism (3,136), and transcription (2,539). These genes in the biosynthesis of secondary metabolites pathway expressed in red raspberry fruits will be useful for defining metabolic pathways for synthesis and turnover of active ingredients with beneficial to human health, and be modifiable by plant breeding in red raspberry.
3.3.Transcription factors
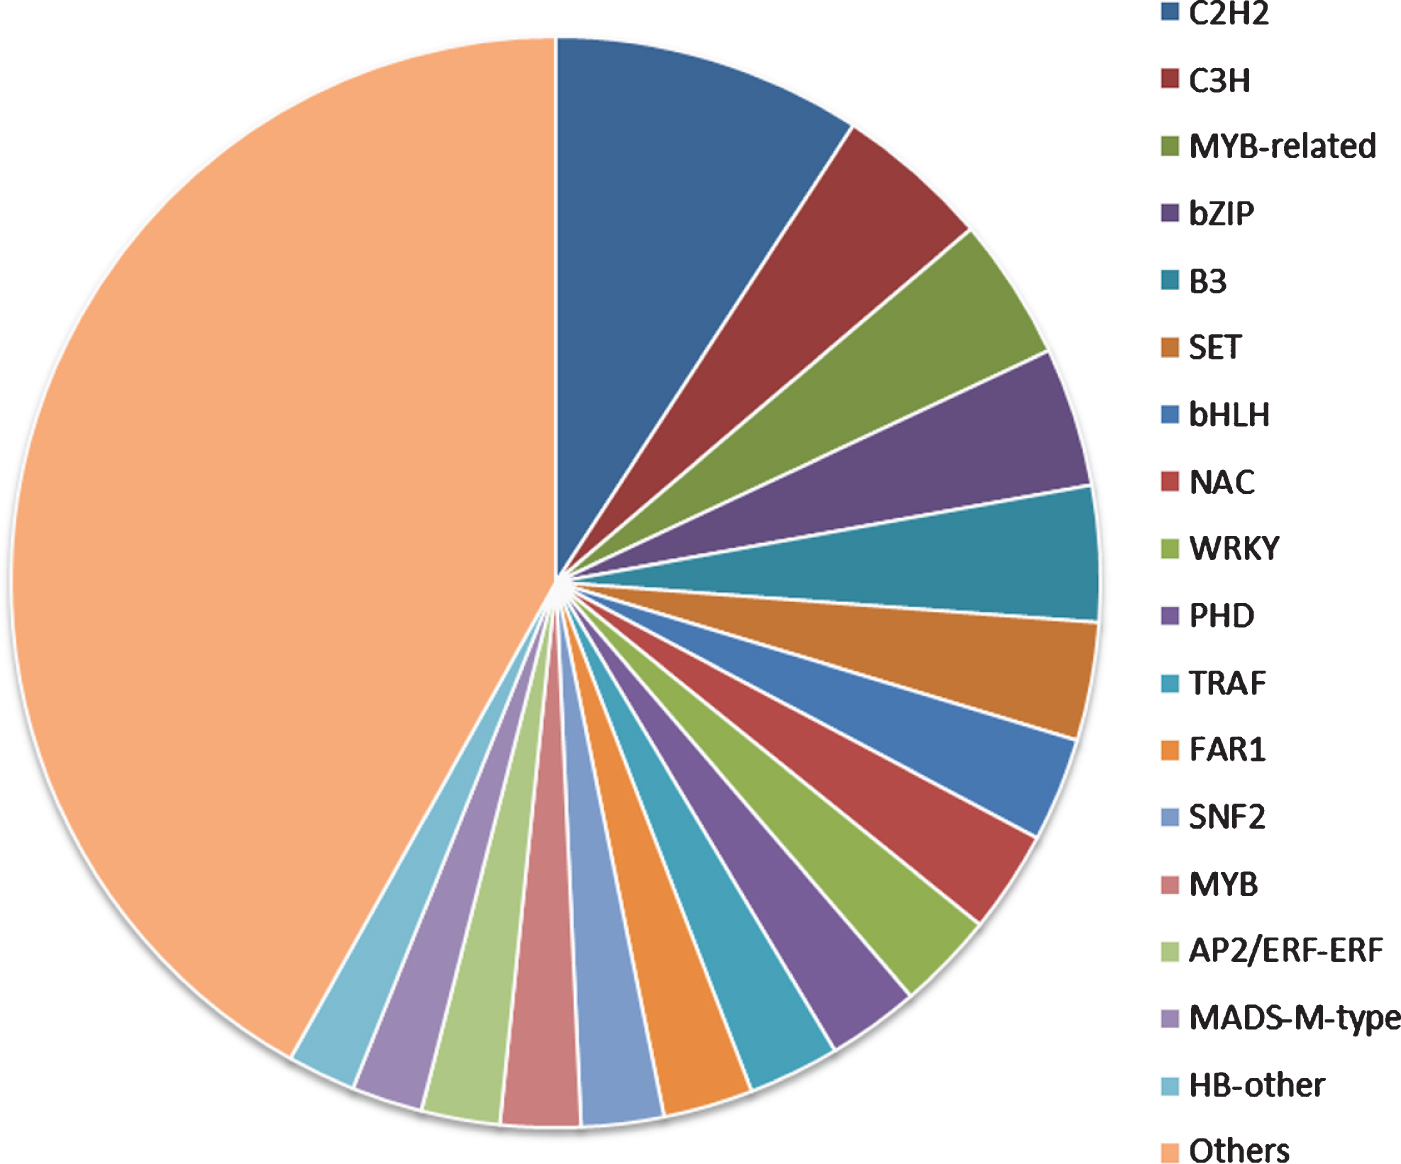
Transcription factors (TFs) play an important role in plant growth and development [44]. We predicted that 8331 TFs from the unigenes database and their annotation was retrieved from the PlantTFDB. These TFs were classified into 94 different common families. The major families were associated with the C2H2 (9.19%), followed by the C3H (4.60%), MYB-related group (4.23%), bZIP (4.13%) and B3 (4.03%) (Fig. 6). These results were considered to be involved in the regulation of metabolic and secondary metabolic biosynthesis in the green plants [45–47]. At the same time, transcription factors (bZIP, bHLH and MYB) influencing flavonoid biosynthesis have been identified, mapped and shown to underlie QTL for quantitative and qualitative anthocyanin composition [48]. Anthocyanin accumulation during the ripening process is strongly correlated with MYB transcription factors. The production of anthocyanins is the most important indicator of maturity and quality in various fruit species [49].
Fig. 6.
Transcription factor family classification.
3.4.Analysis of differentially expressed genes
To fully explore the genes expression during the red raspberry fruit development, the clean reads from each library were mapped to the reference transcriptome for profiling the expression of unigenes. The DESeq [32] provide statistical routines for determining differential expression in digital gene expression data using a model based on the negative binomial distribution. The resulting p-values were adjusted using the Benjamini and Hochberg’s approach for controlling the false discovery rate. Genes with an adjusted p-value <0.05 found by DESeq were assigned as differentially expressed.
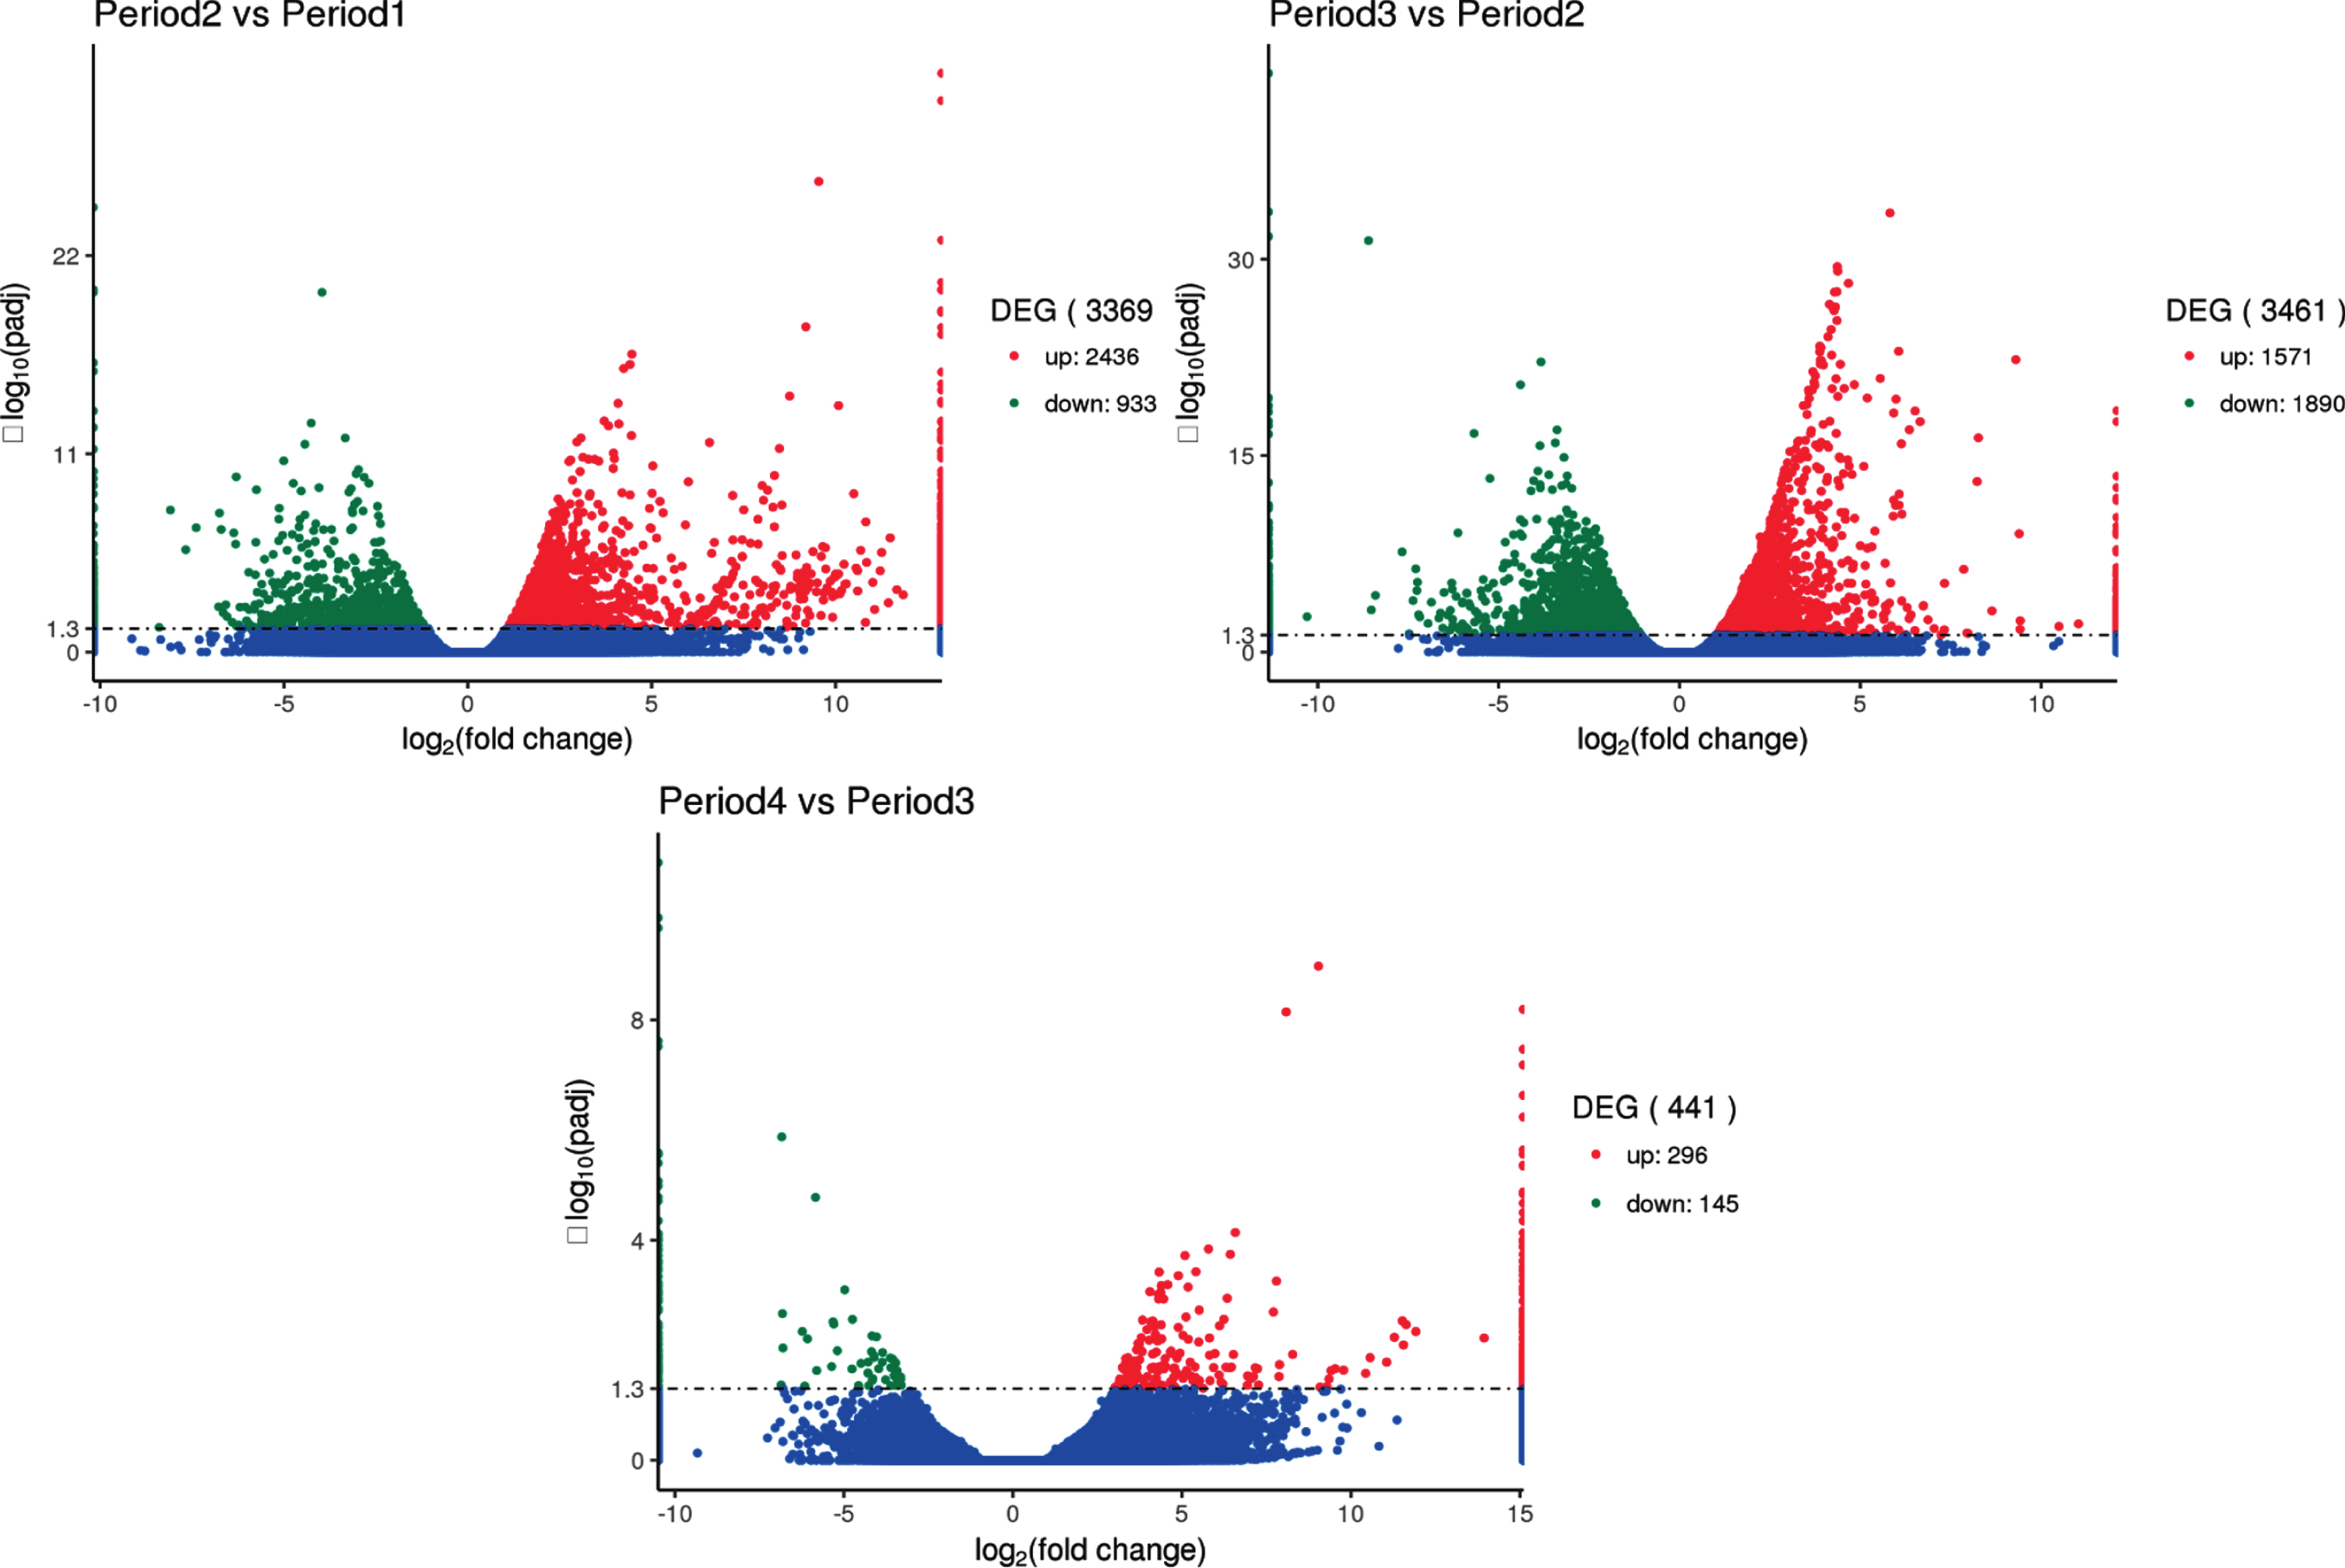
The results are shown in Fig. 7, indicating that 3,369, 3,461 and 441 differentially expressed genes are found in period 2 vs period 1, period 3 vs period 2 and period 4 vs period 3 paired comparisons, respectively. These results suggest that a large number of specific genes are needed to coordinate the complex process at early three developmental stages.
Fig. 7.
Comparison of transcriptome results to analyze the number of differential genes between groups. The x-axis represents the change in expression fold of the gene in different experimental groups/different samples, and the y-axis represents the statistically significant degree of change in gene expression. The smaller the corrected p value, the larger the -log10 (corrected p value), ie, the difference the more remarkable. The scatter points in the figure represent individual genes, the blue dots indicate genes with no significant differences, the red dots indicate up-regulated genes with significant differences, and the green dots indicate down-regulated genes with significant differences. (The screening conditions for differential genes: padj < 0.05).
3.5.KEGG enrichment of some secondary metabolic pathways
Differentially expressed genes were analyzed based on BLASTx. As listed in Fig. 8, these DEGs obtained from comparative transcriptome analysis were mapped to 22 KEGG pathways associating with secondary metabolites during red raspberry development.
Fig. 8.
Comparison of secondary metabolic-related KEGG pathways in the preliminary screening analysis between groups.
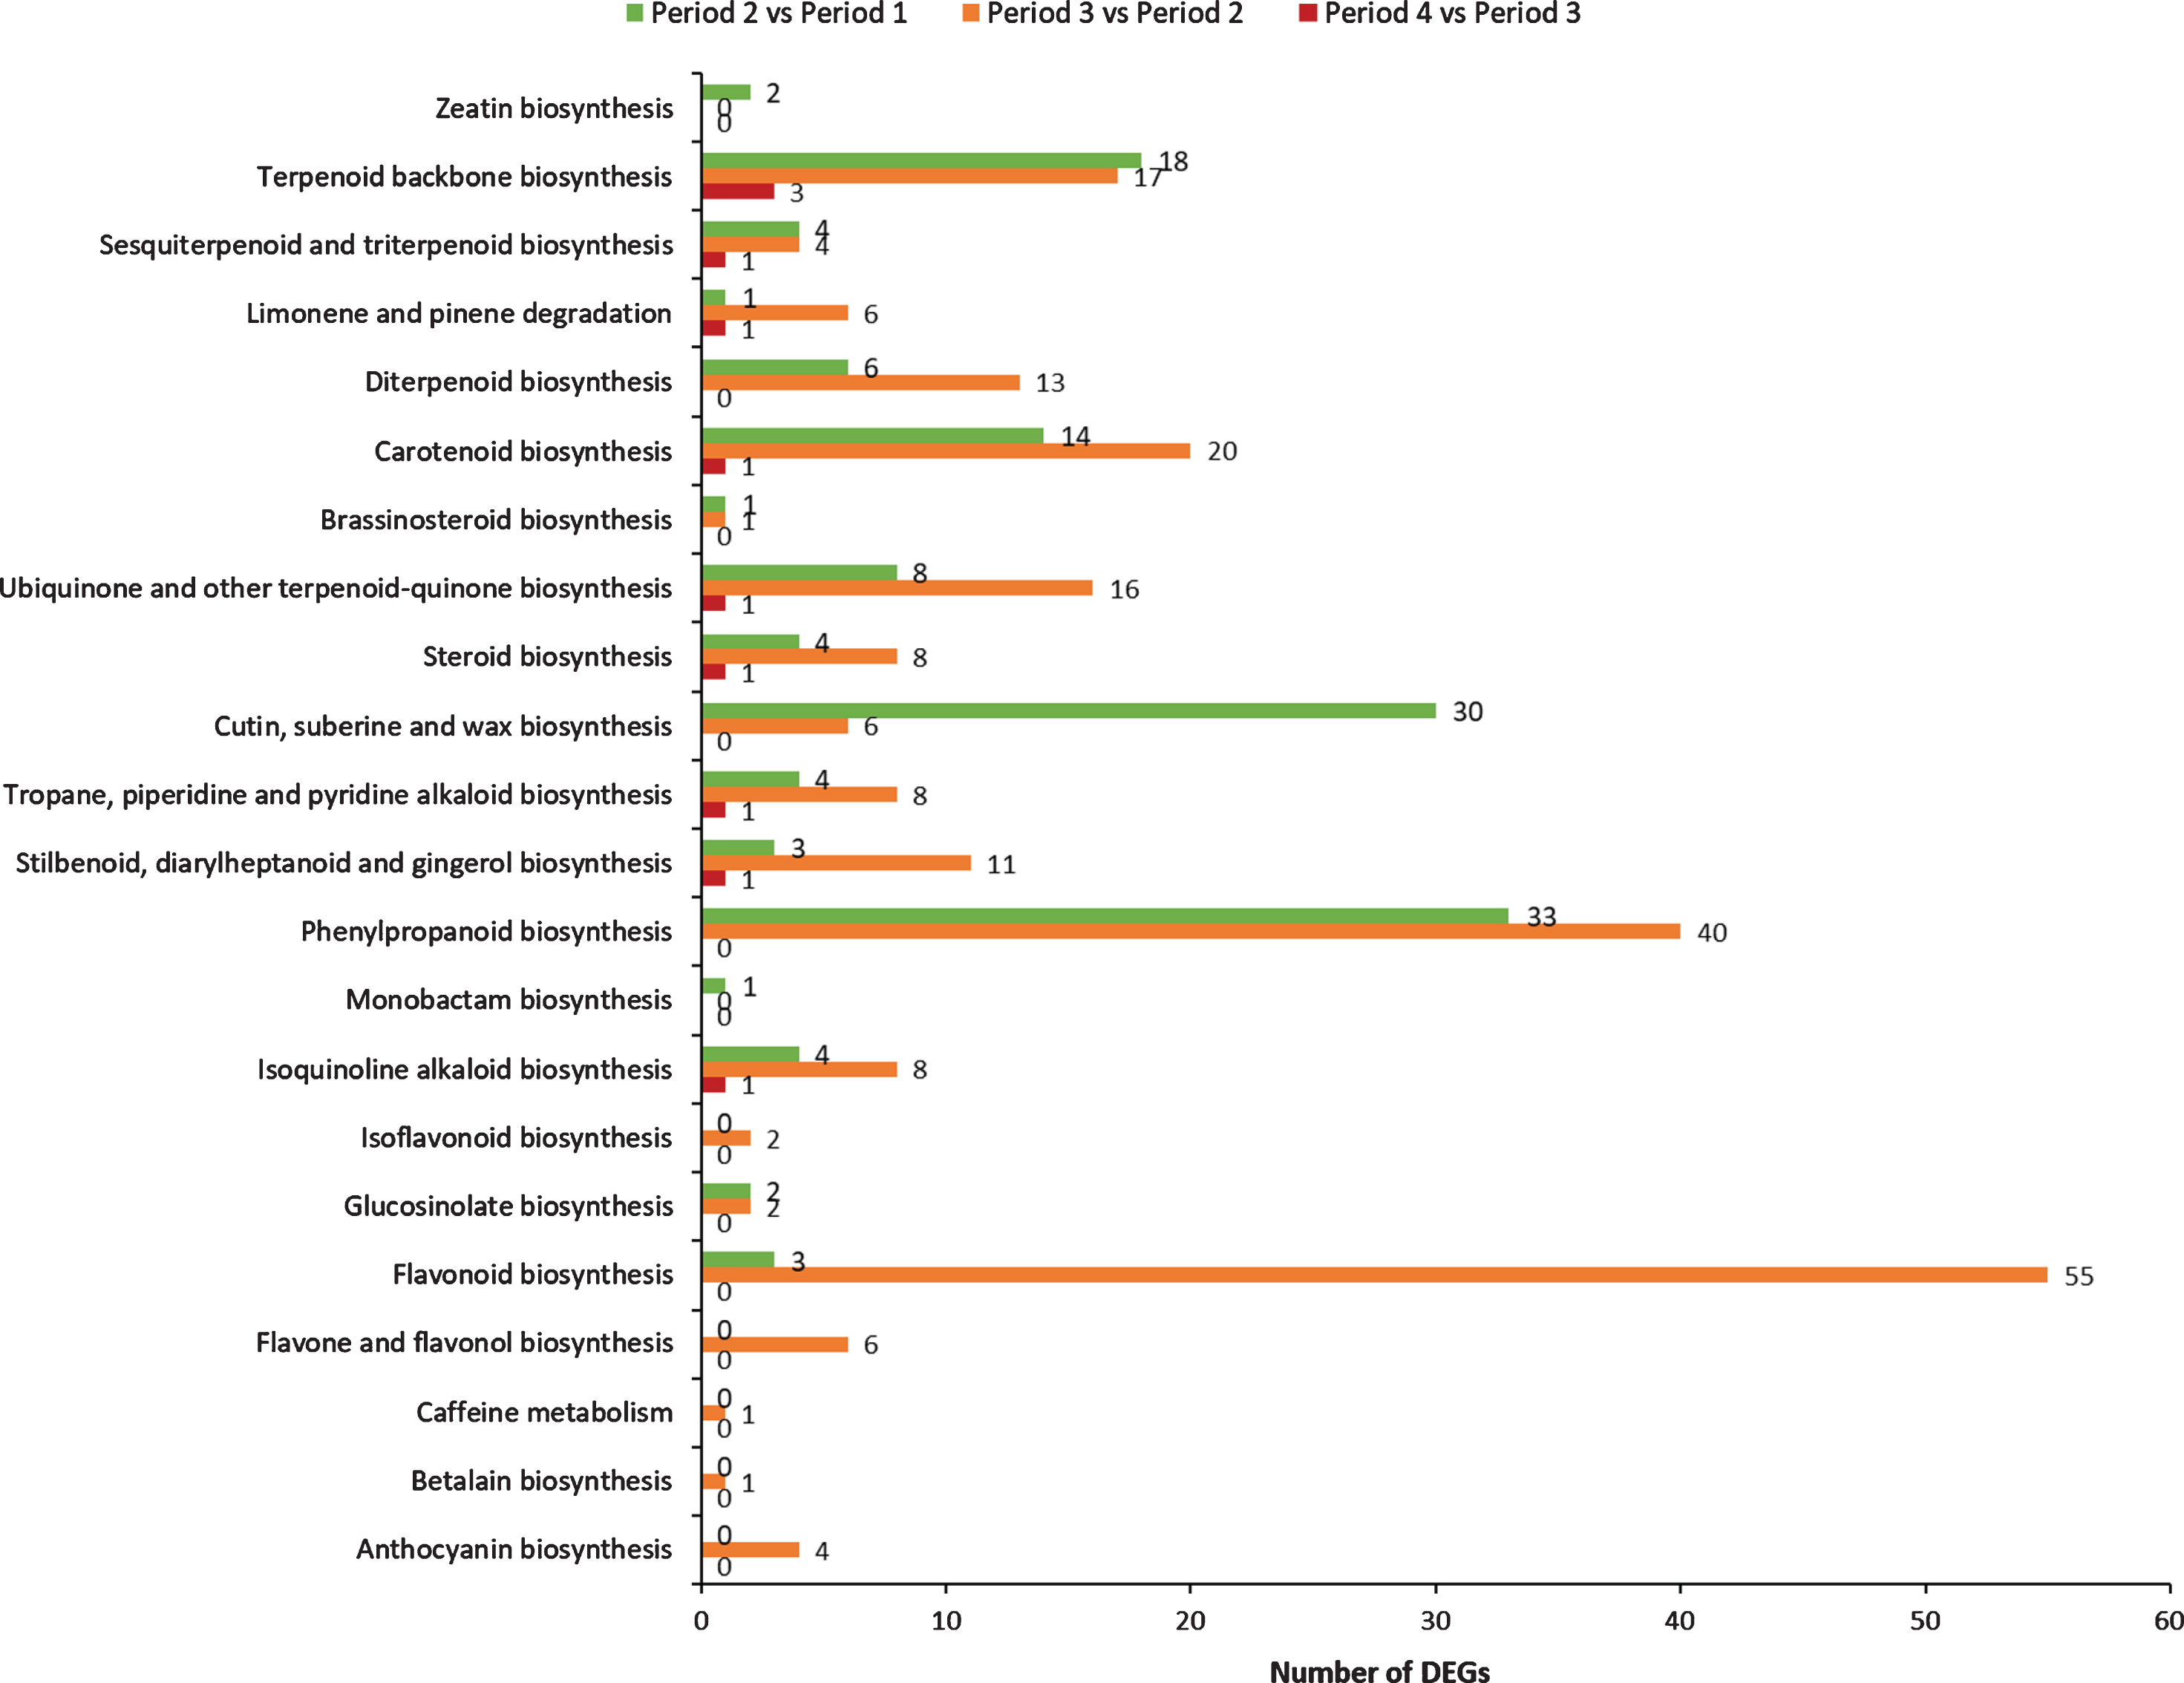
A total of 17 pathways are identified in period 1 vs period 2 with 138 DEGs, mainly associating with phenylpropanoid biosynthesis (33 DEGs), cutin, suberine and wax biosynthesis (30 DEGs), terpenoid backbone biosynthesis (18 DEGs) and Carotenoid biosynthesis (14 DEGs). In period 2 vs period 3, 20 pathways are identified with 229 DEGs mainly involved in flavonoid biosynthesis (55 DEGs), phenylpropanoid biosynthesis (40 DEGs), carotenoid biosynthesis (20 DEGs), terpenoid backbone biosynthesis (17 DEGs), ubiquinone and other terpenoid-quinone biosynthesis (16 DEGs), diterpenoid biosynthesis (13 DEGs) and stilbenoid, diarylheptanoid and gingerol biosynthesis (11 DEGs). Only 11 DEGs are found involved in 9 pathways in period 3 vs period 4, mainly associating with terpenoid backbone biosynthesis (3 DEGs), carotenoid biosynthesis (1 DEGs), isoquinoline alkaloid biosynthesis (1 DEGs), tropane, piperidine and pyridine alkaloid biosynthesis (1 DEGs).
Obviously, more DEGs and KEGG pathways related to secondary metabolism are occurred in period 2 vs period 3. During this period, the fruit will ripen and turn red with accumulation of important compounds [50]. Modifications in fruit size and color are considered important parameters for the ripening-stage differentiation of the raspberry [51]. These results suggest that the DEGs in period 2 and period 3 play important roles in regulating the fruit development and accumulating the secondary metabolites.
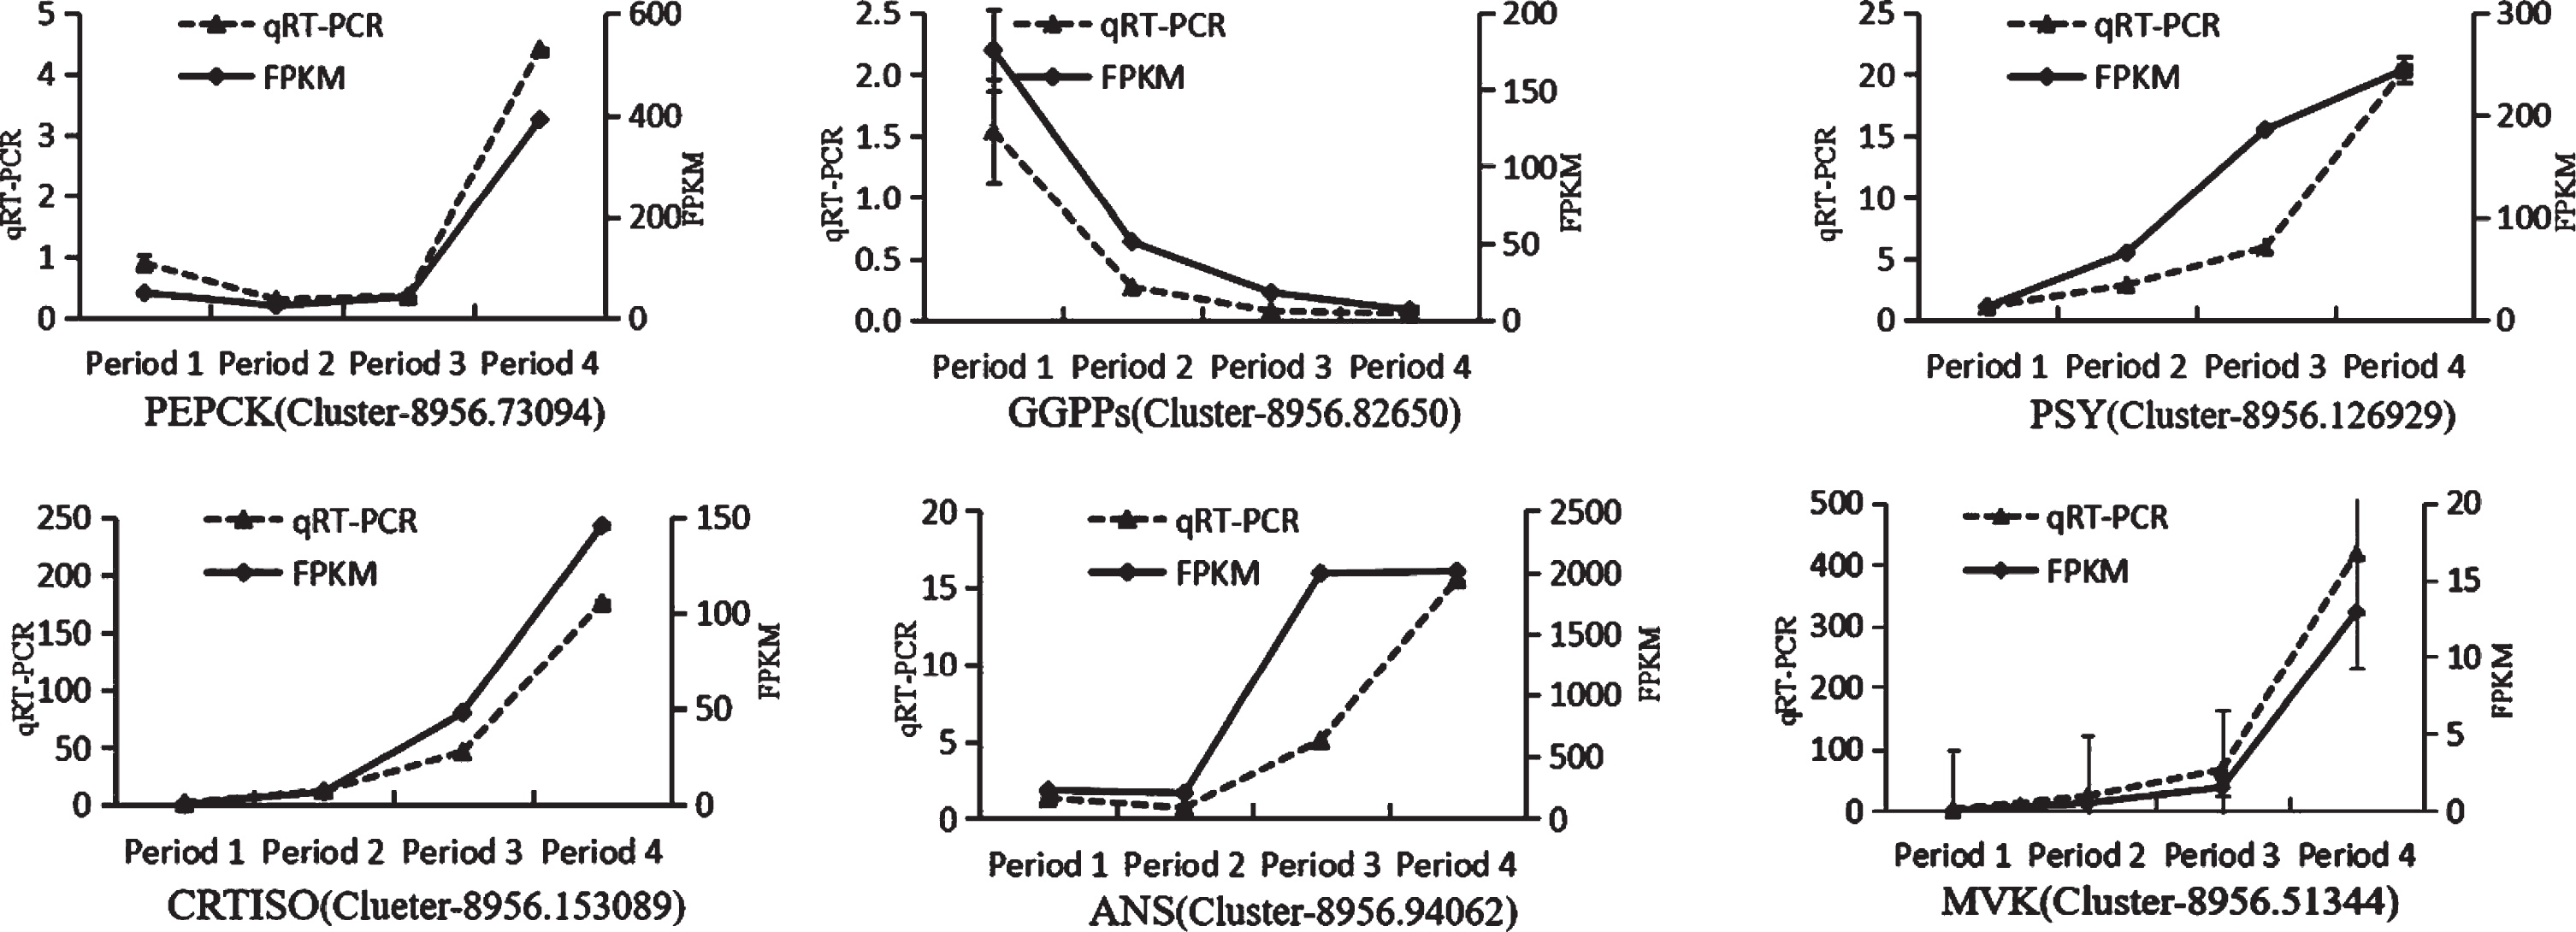
3.6.The genetic verification of secondary metabolism by qRT-PCR
The qRT-PCR experiment was performed to confirm the reliability of the RNA-Seq data using the β-action an internal control (Table 4). Six genes (PEPCK [52–54], GGPPs [55], PSY, CRTISO [56–60], ANS [61, 62] and MVK) involved in secondary metabolism were used as verification targets.
Table 4.
Primer sequence information verified by qRT-PCR
| Primer name | Primer sequence (5′ to 3′) | Primer name | Primer sequence (5′ to 3′) |
| β-action-F | CAGTGGTCGTACAACTGGTATC | PSY-F | GCCCATACTGGCCATCTACT |
| β-action-R | CTTCTGGGCATCTGAATCTCTC | PSY-R | GGACTATCGGACGACGACAT |
| PEPCK-F | CACCCATGTCCTCTATAACCTC | CRTISO-F | GAGTACTTCGCCGCCTTTAC |
| PEPCK-R | CTTCTGTGGTCTCATCCTTGAC | CRTISO-R | TGCACATCCCAACACACTTG |
| GGPPs-F | CTTCTGCAACACATCGAGCA | ANS-F | ACTTGCCGTTGCTCAGAATC |
| GGPPs-R | TTTGCAGCCAAGAGTGGAAG | ANS-R | CCACACCGATGTATCTGCAC |
| MVK-F | TGTCCCATGGTTAACTCGCT | ||
| MVK-R | TTCCAGGTGCAGGTAGACAG |
As shown in Fig. 9, the expression patterns of PEPCK (Cluster-8956.73094), GGPPs (Cluster-8956.82650), PSY(Cluster-8956.126929), CRTISO (Clueter-8956.153089), ANS (Cluster-8956.94062), and MVK (Cluster-8956.51344) are well consistent with the results of RNA sequencing, suggesting that the RNA sequencing data are reliable.
Fig. 9.
Quantitative real-time polymerase chain reaction analysis of the expression of Secondary metabolism-related genes (Analyses were completed in triplicate, and the error bars represent the standard errors).
4.Conclusions
Based on Illumina sequencing technology, the large-scale transcriptome sequencing data in red raspberry fruit are generated. The consensus unigenes were also alanalyzed against NR, GO, KOG and KEGG. The expressed genes were determined at different development stages, and these DEGs were mapped to 22 KEGG pathways including anthocyanin biosynthesis, flavonoid biosynthesis, sesquiterpenoid and triterpenoid biosynthesis. These pathways are associating with secondary metabolites during red raspberry development. We predicted that 8331 TFs from the unigenes database and these TFs were classified into 94 different common families. The major families were associated with the C2H2 (9.19%), followed by the C3H (4.60%), MYB-related group (4.23%), bZIP (4.13%) and B3 (4.03%). These results were considered to be involved in the regulation of metabolic and secondary metabolic biosynthesis. This information, together with metabolic profiling, will be of great importance for further studies to identify target genes underlying nutritional quality and engineer high-quality plants with enhanced active ingredients.
Funding
The authors report no funding.
Conflict of interest
The authors have no conflict of interest to report.
Acknowledgments
This work was supported by the Key R & D Plan Project of Hebei Province (19226815D).
References
[1] | Liu HP , Guo F , Li BG , Zhang XM , Qi GH . Annual change of active substances and embedded material in red raspberry root. Northern Horticulture. (2016) ;17: :11–6. |
[2] | Seeram NP , Adams LS , Zhang Y , Lee R , Sand D , Scheuller HS , Heber D . Blackberry, black raspberry, blueberry, cranberry, red raspberry, and strawberry extracts inhibit growth and stimulate apoptosis of human cancer cells in vitro. Journal of Agricultural and Food Chemistry. (2006) ;54: (25):9329–39. |
[3] | Li L , Wang LY , Wu ZQ , Yao LJ , Wu YH , Huang L , Liu K , Zhou X , Gou DM . Anthocyanin-rich fractions from red raspberries attenuate inflammation in both RAW264. 7 macrophages and a mouse model of colitis.Scientific Reports. (2014) ;4: :6234. |
[4] | Leu SY , Chen YC , Tsai YC , Hung YW , Hsu CH , Lee YM , Cheng PY . Raspberry ketone reduced lipid accumulation in 3T3-L1 cells and ovariectomy-induced obesity in wistar rats by regulating autophagy mechanisms. Journal of Agricultural and Food Chemistry. (2017) ;65: (50):10907–14. |
[5] | Tomoyo T , Chie M . Raspberry ketone promotes the differentiation of C3H10T1/2 stem cells into osteoblasts. Journal of Medicinal Food. (2014) ;17: (3):332–8. |
[6] | Teng H , Fang T , Lin QY , Song HB , Liu B , Chen L . Red raspberry and its anthocyanins: bioactivity beyond antioxidant capacity. Trends in Food Science and Technology. (2017) ;66: :153–65. |
[7] | Urszula S , Barbara B , Anna BK . Antioxidant, anti-inflammatory, and postulated cytotoxic activity of phenolic and anthocyanin-rich fractions from polana raspberry (Rubus idaeus L.) fruit and juice-in vitro study. Molecules. (2018) ;23: :1812–29. |
[8] | Enrico S , Urska V , Giuseppe R , Elisa C , Cecilia B , Laura B , Silvio T , Mattia G , et al. Ellagitannins from rubus berries for the control of gastric inflammation: in vitro and in vivo studies. PloS One. (2013) ;8: (8):e71762. |
[9] | Izabela B , Bogdan Z , Jolanta S , Miroslaw S , Andrzej G , Izabela F . Modulatory impact of selected ellagitannins on the viability of human breast cancer cells. Journal of Functional Foods. (2018) ;42: :122–8. |
[10] | Xiao D , Zhu LJ , Edirisinghe I , Fareed J , Brailovsky Y , Burton FB . Attenuation of postmeal metabolic indices with red raspberries in individuals at risk for diabetes: a randomized controlled trial. Obesity. (2019) ;27: (4):542–50. |
[11] | Oksman-C KM , Inzé D . Plant cell factories in the post-genomic era: new ways to produce designer secondary metabolites. Trends in Plant Science. (2004) ;9: (9):433–40. |
[12] | Jin J , Jae KK , HyeRan K , Yeon JK , Yun JP , Sun JK , Changsoo K , Sang UP . Transcriptome analysis and metabolic profiling of green and red kale (Brassica oleracea var. acephala) seedlings. Food Chemistry. (2018) ;241: :7–13. |
[13] | Zhu QL , Gao P , Liu S , Zhu ZC , Sikandar A , Angela R . Davis, et al. Comparative transcriptome analysis of two contrasting watermelon genotypes during fruit development and ripening. BMC Genomics. (2017) ;18: : 3 doi: 10.1186/s12864-016-3442-3. |
[14] | Flores G , Ruiz del Castillo ML . Influence of preharvest and postharvest methyl jasmonate treatments on flavonoid content and metabolomic enzymes in red raspberry. Postharvest biology and technology. (2014) ;97: :77–82. |
[15] | Miret , JA , Munné-Bosch S . Abscisic acid and pyrabactin improve vitamin C contents in raspberries. Food chemistry. (2016) ;203: :216–23. |
[16] | Valentinuzzi F , Pii Y , Mimmo T , Savini G , Curzel S , Cesco S . Fertilization strategies as a tool to modify the organoleptic properties of raspberry (Rubus idaeus L. ) fruits. Scientia Horticulturae. (2018) ;240: :205–12. |
[17] | Kumar A , Ellis BE . The phenylalanine ammonia-lyase gene family in raspberry. Structure, expression, and evolution. Plant Physiology. (2001) ;127: (1):230–9. |
[18] | Jaakola L . New insights into the regulation of anthocyanin biosynthesis in fruits. Trends in plant science. (2013) ;18: (9):477–83. |
[19] | Berland H , Albert NW , Stavland A , Jordheim M , McGhie TK , Zhou YF , Zhang HB , Deroles SC , Schwinn KE , et al. Auronidins are a previously unreported class of flavonoid pigments that challenges when anthocyanin biosynthesis evolved in plants. Proceedings of the National Academy of Sciences of the United States of America. (2019) ;116: (40):20232–9. |
[20] | Manimekalai R , Nair S , Naganeeswaran A , Karun A , Malhotra S , Hubbali V . Transcriptome sequencing and de novo assembly in arecanut, Areca catechu L elucidates the secondary metabolite pathway genes. Biotechnology reports. (2018) ;17: :63–9. |
[21] | Zhang L , Wan X , Xu J , Lin L , Qi J . De novo assembly of kenaf (Hibiscus cannabinus) transcriptome using Illumina sequencing for gene discovery and marker identification. Molecular breeding. (2015) ;35: (10):192. |
[22] | Grabherr MG , Haas BJ , Yassour M . , Levin JZ, Thompson DA, Amit I, Adiconis X, Fan L, Raychowdhury R, et al. Full-length transcriptome assembly from RNA-Seq data without a reference genome. Nature Biotechnology. (2011) ;29: (7):644–52. |
[23] | Courtney A , Hollender , Chunying K , Omar D , Aviva G , Benjamin F , Matthews , Janet S , et al. Floral transcriptomes in woodland strawberry uncover developing receptacle and anther gene networks. Plant Physiology. (2014) ;165: :1062–75. |
[24] | Chunying K , Omar D , Aviva G , Rachel S , Nadim A , Zhongchi L . Genome-scale transcriptomic insights into early-stage fruit development in woodland strawberry fragaria vesca. The Plant Cell. (2013) ;25: :1960–78. |
[25] | Daniel GS , Yang Z , Gutierrez-Mañero FJ , Cathie M , Beatriz RS . RNA-Seq analysis and transcriptome assembly for blackberry (Rubus sVar. Lochness) fruit. BMC Genomics. (2015) ;16: (5):5 doi: 10.1186/s12864-014-1198-1. |
[26] | Haiyue S , Yushan L , Yuzhuo G , Jinman G , Li C , Hongdi L , Limin K , Youwen T , Yadong L . De novo sequencing and analysis of the cranberry fruit transcriptome to identify putative genes involved in flavonoid biosynthesis, transport and regulation. BMC Genomics. (2015) ;16: (1) 652. doi: 10.1186/s12864-015-1842-4. |
[27] | Vikas G , April DE , Ivory B , Rob R , Ketan P , Mason DM , Stig UA , Allan FB , Mary AL , Ann EL . RNA-Seq analysis and annotation of a draft blueberry genome assembly identifies candidate genes involved in fruit ripening, biosynthesis of bioactive compounds, and stage-specific alternative splicin. GigaScience. (2015) ;4: 5 doi: 10.1186/s13742-015-0046-9. |
[28] | Tae KH , Sarah L , Yeonggil R , Ritesh K , Xiao H , Sang YL , Choong HL , Jae YK . De-novo RNA sequencing and metabolite profiling to identify genes involved in anthocyanin biosynthesis in Korean black raspberry (Rubus coreanus Miquel). PloS One. (2014) ;9: (2) 88292. doi: 10.1371/journal.pone.0088292. |
[29] | Liu JF , Ming YT , Cheng YQ , Zhang YC , Xing JY , Sun YQ . Comparative transcriptome analysis reveal candidate genes potentially involved in regulation of primocane apex rooting in raspberry (Rubus s). Frontiers in Plant Science. (2017) ;8: :1036–52. |
[30] | Hua WP , Zhang Y , Song J , Zhao LJ , Wang ZZ . De novo transcriptome sequencing in Salvia miltiorrhiza to identify genes involved in the biosynthesis of active ingredients. Genomics. (2011) ;98: :272–9. |
[31] | Li RJ , Gao X , Li LM , Liu XL , Wang ZY , Lü SY . De novo assembly and characterization of the fruit transcriptome of Idesia polycarpa reveals candidate genes for lipid biosynthesis. Frontiers in Plant Science.801. (2016) ;7: doi: 10.3389/fpls.2016.00801. |
[32] | Li B , Dewey CN . RSEM: accurate transcript quantification from RNA-Seq data with or without a reference genome. BMC Bioinformatics. (2011) ;12: 323. doi: 10.1186/1471-2105-12-323. |
[33] | Anders S , Huber W . Differential expression analysis for sequence count data. Genome biology. (2010) ;11: (10) R106. doi: 10.1186/gb-2010-11-10-r106. |
[34] | Young MD , Wakefield MJ , Smyth GK , Oshlack A . Gene ontology analysis for RNA-seq: accounting for selection bias. Genome Biology. (2010) ;11: (2) 14. doi: 10.1186/gb-2010-11-2-r14. |
[35] | Kanehisa M , Araki M , Goto S , Hattori M , Hirakawa M , Itoh M , et al. KEGG for linking genomes to life and the environment. Nucleic Acids Research. (2008) ;36: :480–4. |
[36] | Mao X , Cai T , Olyarchuk JG , Wei L . Automated genome annotation and pathway identification using the KEGG Orthology (KO) as a controlled vocabulary. Bioinformatics. (2005) ;21: :3787–93. |
[37] | Vandesompele J , Preter DP , Pattyn F , Poppe B , Roy NV , Paepe AD , Speleman F . Accurate normalization of real-time quantitative RT-PCR data by geometric averaging of multiple internal control genes. Genome Biology. (2002) ;3: (7):1–11. |
[38] | Cheng Y , Liu J , Zhang H , Wang J , Zhao Y , Geng W . Transcriptome analysis and gene expression profiling of abortive and developing ovules during fruit development in hazelnut. PloS One. (2015) ) 10: (4):e072. doi: 10.1371/journal.pone.0122072. |
[39] | Garcia-Seco D , Zhang Y , Gutierrez-Mañero F , Martin C , Ramos-Solano B . RNA-Seq analysis and transcriptome assembly for blackberry (Rubus sp. Var.Lochness) fruit. BMC Genom. (2015) ;16: :5. |
[40] | Hyun TK , Lee S , Rim Y , Kumar R , Han X , Lee SY , Lee CH , Kim JY . De-novo RNA Sequencing and Metabolite Profiling to Identify Genes Involved in Anthocyanin Biosynthesis in Korean Black Raspberry (Rubus coreanus Miquel). PLoS One. (2014) ;9: (2):e88292. |
[41] | Edger PP , Poorten TJ , VanBuren R , Hardigan MA , Colle M , McKain MR , Knapp SJ . Origin and evolution of the octoploid strawberry genome. Nature Genetics. (2019) ;51: :541–7. |
[42] | Edger PP , VanBuren R , Colle M , Poorten TJ , Wai CM , Niederhuth CE , Knapp SJ . Single-molecule sequencing and optical mapping yields an improved genome of woodland strawberry (Fragaria vesca) with chromosome-scale contiguity. GigaScience. (2017) . 7: (2). |
[43] | Travisany D , Ayala-Raso A , Di Genova A , Monsalve L , Bernales M , Martínez JP , Gonzílez-Agüero M , Defilippi B , Cherian S , Maass A , et al. RNA-Seq analysis and transcriptome assembly of raspberry fruit (Rubus idaeus ¨Heritage¨) revealed several candidate genes involved in fruit development and ripening. Sci Hort. (2019) ;254: :26–34. |
[44] | Qu LJ , Zhu YX . Transcription factor families in Arabidopsis: major progress and outstanding issues for future research. Current Opinion in Plant Biology. (2006) )544–9. |
[45] | Kobayashi S , Ishimaru M , Hiraoka K , et al. Myb-related genes of the Kyoho grape (Vitis labruscana) regulate anthocyanin biosynthesis. Planta. (2002) ;215: (6):924–33. |
[46] | Sarwar M B , Ahmad Z , Rashid B , et al. De novo assembly of A gavesisalana transcriptome in response to drought stress provides insight into the tolerance mechanisms. Scientific reports. (2019) ;9: :396. |
[47] | Wu Q , Bai X , Wu X , Xiang D , Wan Y , Luo Y , Zhao G . Transcriptome profiling identifies transcription factors and key homologs involved in seed dormancy and germination regulation of Chenopodium quinoa. Plant Physiology and Biochemistry. 151. (2020) )443–56. |
[48] | Hytönen T , Graham J , Harrison R (Eds.). The Genomes of Rosaceous Berries and Their Wild Relatives. Compendium of Plant Genomes. (2018) )199–212. |
[49] | Fuentes L , Figueroa CR , Valdenegro M . Recent Advances in Hormonal Regulation and Cross-Talk during Non-Climacteric Fruit Development and Ripening. Horticulturae. (2019) ;5: (2):45. |
[50] | Cherian S , Figueroa CR , Nair H , Movers and shakers’ in the regulation of fruit ripening: a cross-dissection of climacteric versus non-climacteric fruit. Journal of Experimental Botany. (2014) ;65: :4705–22. |
[51] | Fuentes L , Monsalve L , Morales-Quintana L , Valdenegro M , Martínez JP , Defilippi BG , González-Agüero M . Differential expression of ethylene biosynthesis genes in drupelets and receptacle of raspberry (Rubus idaeus). J Plant Physiol. (2015) ;179: :100–5. |
[52] | Xu ZR , Li CL , Cui GX , Sun Y , Li YH . Clone sequence analysis and expression of anthocyanidin synthase gene in turniLetters in Biotechnology (2009) ;20: (1):66–8. |
[53] | Yuyan S , Jinglei W , Yang Q , Tongjin L , Jiangping S , Xixiang L . Identification of ‘Xinlimei’ radish candidate genes associated with anthocyanin biosynthesis based on a transcriptome analysis. Gene. (2018) ;657: :81–91. |
[54] | Liyun W , Bei L , Yong L , Liying Y , Dongxin H , Yanping K , Huifang J , Jiazhuang T , Boshou L . Transcriptomic profiling reveals pigment regulation during peanut testa development. Plant Physiology and Biochemistry. (2018) ;125: :116–25. |
[55] | Fraser PD , Truesdale MR , Bird CR , Schuch W , Bramley PM . Carotenoid biosynthesis during tomato fruit development: Evidence for tissue-specific gene expression. Plant Physiology. (1994) ;105: (1):405–13. |
[56] | Moehs CP , Tian L , Osteryoung KW , DellaPenna D . Analysis of carotenoid biosynthetic gene expression during marigold petal development. Plant Molecular Biology. (2001) ;45: (3):281–93. |
[57] | Shewmaker CK , Sheehy JA , Daley M , Colburn S , Ke DY . Seed specific overexpression of phytoene synthase: increase in carotenoids and other metabolic effects. Plant Journal. (1999) ;20: (4) 401–12. |
[58] | Hou DX , Kai K , Li JJ , et al. Effect of procyanidins from cocao on glutathione levels in endothelial cells challenged by activated macrophages. Cardiovase Pharmacol. (1998) ;32: (4):5091. |
[59] | Nakajima J , Tanaka Y , Yamazaki M , et al. Reaction mechanism from leucoanthocyanidin to anthocyanidin 3-glucoside, a key reaction for coloring in anthocyanin biosynthesis. The Journal of Biological Chemistry. (2001) ;276: (28):25797–803. |
[60] | Rupert C , Jonathan J , Richard WD , et al. Structure and mechanism of anthocyanidin synthase from arabidopsisthaliana. Structure. (2002) ;10: :93–103. |
[61] | Liu C , Sun Z , Shen S , Lin L , Li T , Tian B , Hua Y . Identification and characterization of the geranylgeranyl diphosphate synthase in Deinococcus radiodurans. Letter in Applied Microbiology. (2014) ;58: (3):219–24. |
[62] | Gallagher CE , Matthews PD , Li F , Wurtzel ET . Gene duplication in the carotenoid biosynthetic pathway preceded evolution of the grasses. Plant Physiology. (2004) ;135: (3):1776–83. |


