
Climate-photothermographs, a tool for ecophysiological assessment of effects of climate warming in crop plants: Examples with three berry crops
Abstract
BACKGROUND:
The predicted and ongoing climate warming can have far-reaching effects on plant growth and life cycle. Therefore, there is need for simple and convenient methods for analysis and monitoring of consequences of the ongoing warming.
OBJECTIVE:
To demonstrate the usefulness of so-called climate-photothermographs for studying the consequences of the ongoing warming for production of berry crops.
METHODS:
Local photothermal climates can be expressed by so-called climate-photothermographs, which show the relationship between temperature and daylength for each month of the year in a rectangular coordinate diagram. When superimposing critical response curves for plant development processes on top of such a diagram, the limitations of the given climate for fulfilment of the processes can be readily assessed.
RESULTS:
Consequences of 2°C warming for critical development processes such as transition to flowering and breaking of winter dormancy in the berry crops raspberry, black currant and strawberry were clearly exposed by the technique. The locations Geisenheim, Germany and Ås, Norway were used as examples. Inadequate winter chill was identified as the most limiting factor for these crops.
CONCLUSIONS:
We conclude that the technique is an efficient and convenient tool for monitoring the consequences of climate warming for berry crops.
1Introduction
According to the Intergovernmental Panel on Climate Change [1], the future climate is predicted to be warmer and wetter. However, the predictions are also that the changes will vary among geographic regions. For example, the predictions are that increases in temperature and precipitation will be much larger at high latitudes than in Mediterranean areas which may even become more arid. Ongoing climatic changes in agreement with these predictions are also widely observed and documented over the last few decades [1]. Since plants are using environmental cues to regulate their growth and seasonal life cycles [2], such climate changes can have far-reaching effects on many aspects of plant growth and development. Particularly sensitive to such changes are seasonally controlled developmental processes such as flowering and dormancy regulation in perennial plants [3–6].
During evolution, plants have continuously adapted to new environmental conditions by natural selection as they have spread to new geographic regions with different climates. Likewise, since the very start of plant domestication, crop plants have continuously been adapted to the prevailing local climates by man-made selection as the plants have been transferred to new geographic and climatic regions. Therefore, the ongoing climate changes represent a major challenge that can have far-reaching implications for survival and productivity in both wild vegetation and cultivated plants.
Perennial plants are particularly vulnerable to climatic change since winter survival is necessary for these plants, and since the mechanisms regulating winter dormancy are closely mediated by climatic factors such as temperature and daylength [2, 6–9]. Furthermore, in perennial plants it is common that stressful or marginal weather conditions in one year can have lasting effects over several years. For example, in many perennial plants, and particularly in woody plants such as fruit trees and shrubs, floral formation takes place in the autumn in the year preceding flowering and fruiting [2, 3, 7–9]. Winter injury in one year will also affect plant growth and performance over several successive seasons [6].
Seasonal regulation of developmental processes such as flowering and dormancy regulation is mainly mediated by temperature and photoperiod (daylength) [2, 7]. Since the pioneering publications of Garner and Allard [8, 9] it has become clear that fundamental development processes such as flowering (reproduction) and dormancy are controlled by the length of day and night. However, it was soon found that the critical photoperiods for the various processes are highly dependent on temperature so that the factors daylength and temperature should always be considered together [7]. Thus, while daylength will remain unchanged under global warming, the ongoing climate change will still confer new photothermal challenges on plants because of the pronounced interaction of photoperiod and temperature.
In order to analyse and possibly mitigate the effects of the ongoing climate warming it is vital to have access to reliable methods for assessing the ecophysiological effects on plant growth and development. One such tool is the climate-photothermograph concept, introduced by Ferguson in 1957 [10] for description of the photothermal climate of a given location together with critical response curves showing the marginals of that climate for certain physiological processes in plants. Ferguson originally applied this technique for analysing the effect of temperature and photoperiod in the phenomenon of vernalisation for bolting and flowering in beet (Beta vulgaris). By comparison of critical flowering conditions from published experimental data on the process with climate-photothermographs for various locations he could demonstrate how even small differences in local photothermal climates and/or cultivar requirements could result in all-or-none effects.
Despite the potential of the technique for analysing and illustrating ecophysiological effects of climate changes, it has not found much application in recent climate change related plant research. We think, however, that the photothermograph concept can be successfully used for monitoring of the ecophysiological responses of crop plants to the ongoing climate warming. However, for the technique to be practically useful, it is essential that we know at which particular time of the year that the studied processes take place so that they can be specifically related to the climatic conditions at a given place at this particular time of the year. Likewise, it is also important that we know quite accurately the temperature and photoperiodic limitations for fulfilment of the studied ecophysiological process. With our present basis of knowledge, both of these criteria are fulfilled.
Here, we present examples with use of climate-photothermographs for assessment of the consequences of global warming for successful regulation of flowering and dormancy of the berry crops raspberry, strawberry and black currant, which have all been extensively studied for their photothermal requirements for flowering and dormancy regulation.
2The photothermograph concept
The relationship between temperature and daylength (photoperiod) at a given location can be accurately presented by rectangular coordinates specifying the monthly average mean temperature and the corresponding daylength on the 21st day of each month of the year. By entering twelve dots, one for each month in such a coordinate diagram and connecting the dots by a closed line, a climate-photothermograph denoting the photothermal climate of the place (location) is obtained. A number is added at each dot to indicate the monthly identity of the dots. The relevant temperature and daylength data for construction of such diagrams are usually freely available from national meteorological institutions.
The climate-photothermographs will of course differ greatly between distant locations. This was beautifully illustrated by Ferguson’s work [10] which compared the photothermographs for Paramaribo, Suriname, (6°N), Cairo, Egypt (30°N), Perpignan, France (42°42’N), De Bilt, Netherlands (52°07’N), Novgorod-Seversk, Ukraina (52°01’N) and Oslo, Norway (59°55’N) (see Fig. 1). While the equatorial climate at Paramaribo is nearly constant throughout the year, the seasonal climatic variation increases steadily with increasing distance from the equator. However, not only latitude and altitude of a place but also its degree of continentality may have considerable effect on the climate. This is clearly seen from Fig. 1 by comparing the graphs for De Bilt and Novgorod-Seversk, which have the same latitude and hence identical daylengths throughout the year, but differ in distance from the sea, which causes large differences in winter temperature in particular. In the same way, it is possible to construct weather-photothermographs for the temperature and daylength conditions during a certain year or growing season, or for temperature and photoperiod conditions in a greenhouse. If climatic conditions are kept constant for some time, the photothermograph will appear as a single dot, or as a small circle if the degree of variation is included. In such cases, the period of constant conditions should be indicated by numbers showing the relevant monthly timespan.
Fig. 1
Climate-Photothermographs for six different geographic locations with latitudes ranging from Paramaribo, Suriname near the equator to Oslo, Norway at nearly 60°N. Numbers denote the months of the year. (After Ferguson, 1957) [10].
![Climate-Photothermographs for six different geographic locations with latitudes ranging from Paramaribo, Suriname near the equator to Oslo, Norway at nearly 60°N. Numbers denote the months of the year. (After Ferguson, 1957) [10].](https://content.iospress.com:443/media/jbr/2020/10-3/jbr-10-3-jbr190490/jbr-10-jbr190490-g001.jpg)
In this way, the photothermic environment of a geographic location can be conveniently recorded and illustrated by the use of such climate-photothermographs (hereafter termed photothermographs).
3Photothermographs and limitations for plant development
When critical photoperiods and temperatures for a particular plant development step or process are known, photothermographs can conveniently be used to assess the limitations of the climate at a location for the fulfilment of that process. In his introductory paper [10], Ferguson successfully used the technique for assessing whether beetroots (Beta vulgaris) could be grown at a given location to produce fleshy roots without premature bolting and flowering, or vice versa, whether the climate at the location would be promising for beet seed production. Similarly, the system was used for evaluation of the fitness of Norway spruce ecotypes from different latitudes for timely apical growth cessation and dormancy induction at various locations [11]. By superimposing critical photothermal response curves for growth cessation in a range of latitudinal ecotypes obtained in phytotron experiments on top of photothermograph plots for various locations, the adaptation of the ecotypes to the photothermal climates of the various locations was clearly exposed. Thus, when the critical photothermal requirements for a given developmental process is known from experimental research, photothermographs can successfully be used for selection of favourable locations for fulfilment of the process or for successful production of a crop. The construction of critical response curves should be based on results from phytotron experiments or other well controlled experiments.
The same technique can be used for monitoring of location specific consequences of the ongoing climate warming for processes such as flowering and dormancy regulation of various crop plants. The critical temperatures and daylengths for flowering and induction and breaking of dormancy is now well documented for berry crops such as strawberry [12, 13], raspberry [14–16], and black currant [17–19]. Here, we have compared the suitability and limitations of the climates at two locations in Europe, viz. Geisenheim, Germany (50°N) and Ås, Norway (60°N) for each of these berry crops, and the consequences of a 2°C warming throughout the year at the two places.
4Consequences of 2°C warming for three berry crops
Figure 2 presents the photothermographs for Ås, Norway (60°N) and Geisenheim, Germany (50°N) using the official 1961-1990 temperature normal for the two locations (continuous lines), together with the corresponding photothermographs that would result from a 2°C warming for each month of the year at both locations (stippled lines). These graphs illustrate the greater seasonal variation in the photothermal climate at Ås, compared with Geisenheim that is typically associated with differences in latitude at the two places. It is also seen that during every month of the year, the temperature is several degrees lower at Ås than at Geisenheim. When compared with critical response curves for floral initiation and breaking of winter dormancy in black currant and biennial fruiting raspberry, it is further seen that the consequences of climate warming will be quite different at the two studied locations (Fig. 2).
Fig. 2
Climate-photothermographs for Ås, Norway (60°N) and Geisenheim, Germany (50°N) together with critical response curves for floral initiation and release from winter dormancy in black currant and biennial-fruiting raspberry. For illustration of the consequences of a 2°C warming for the two crops, stippled graphs with +2°C displacement are also presented for each of the two locations. Numbers denote the months of the year.
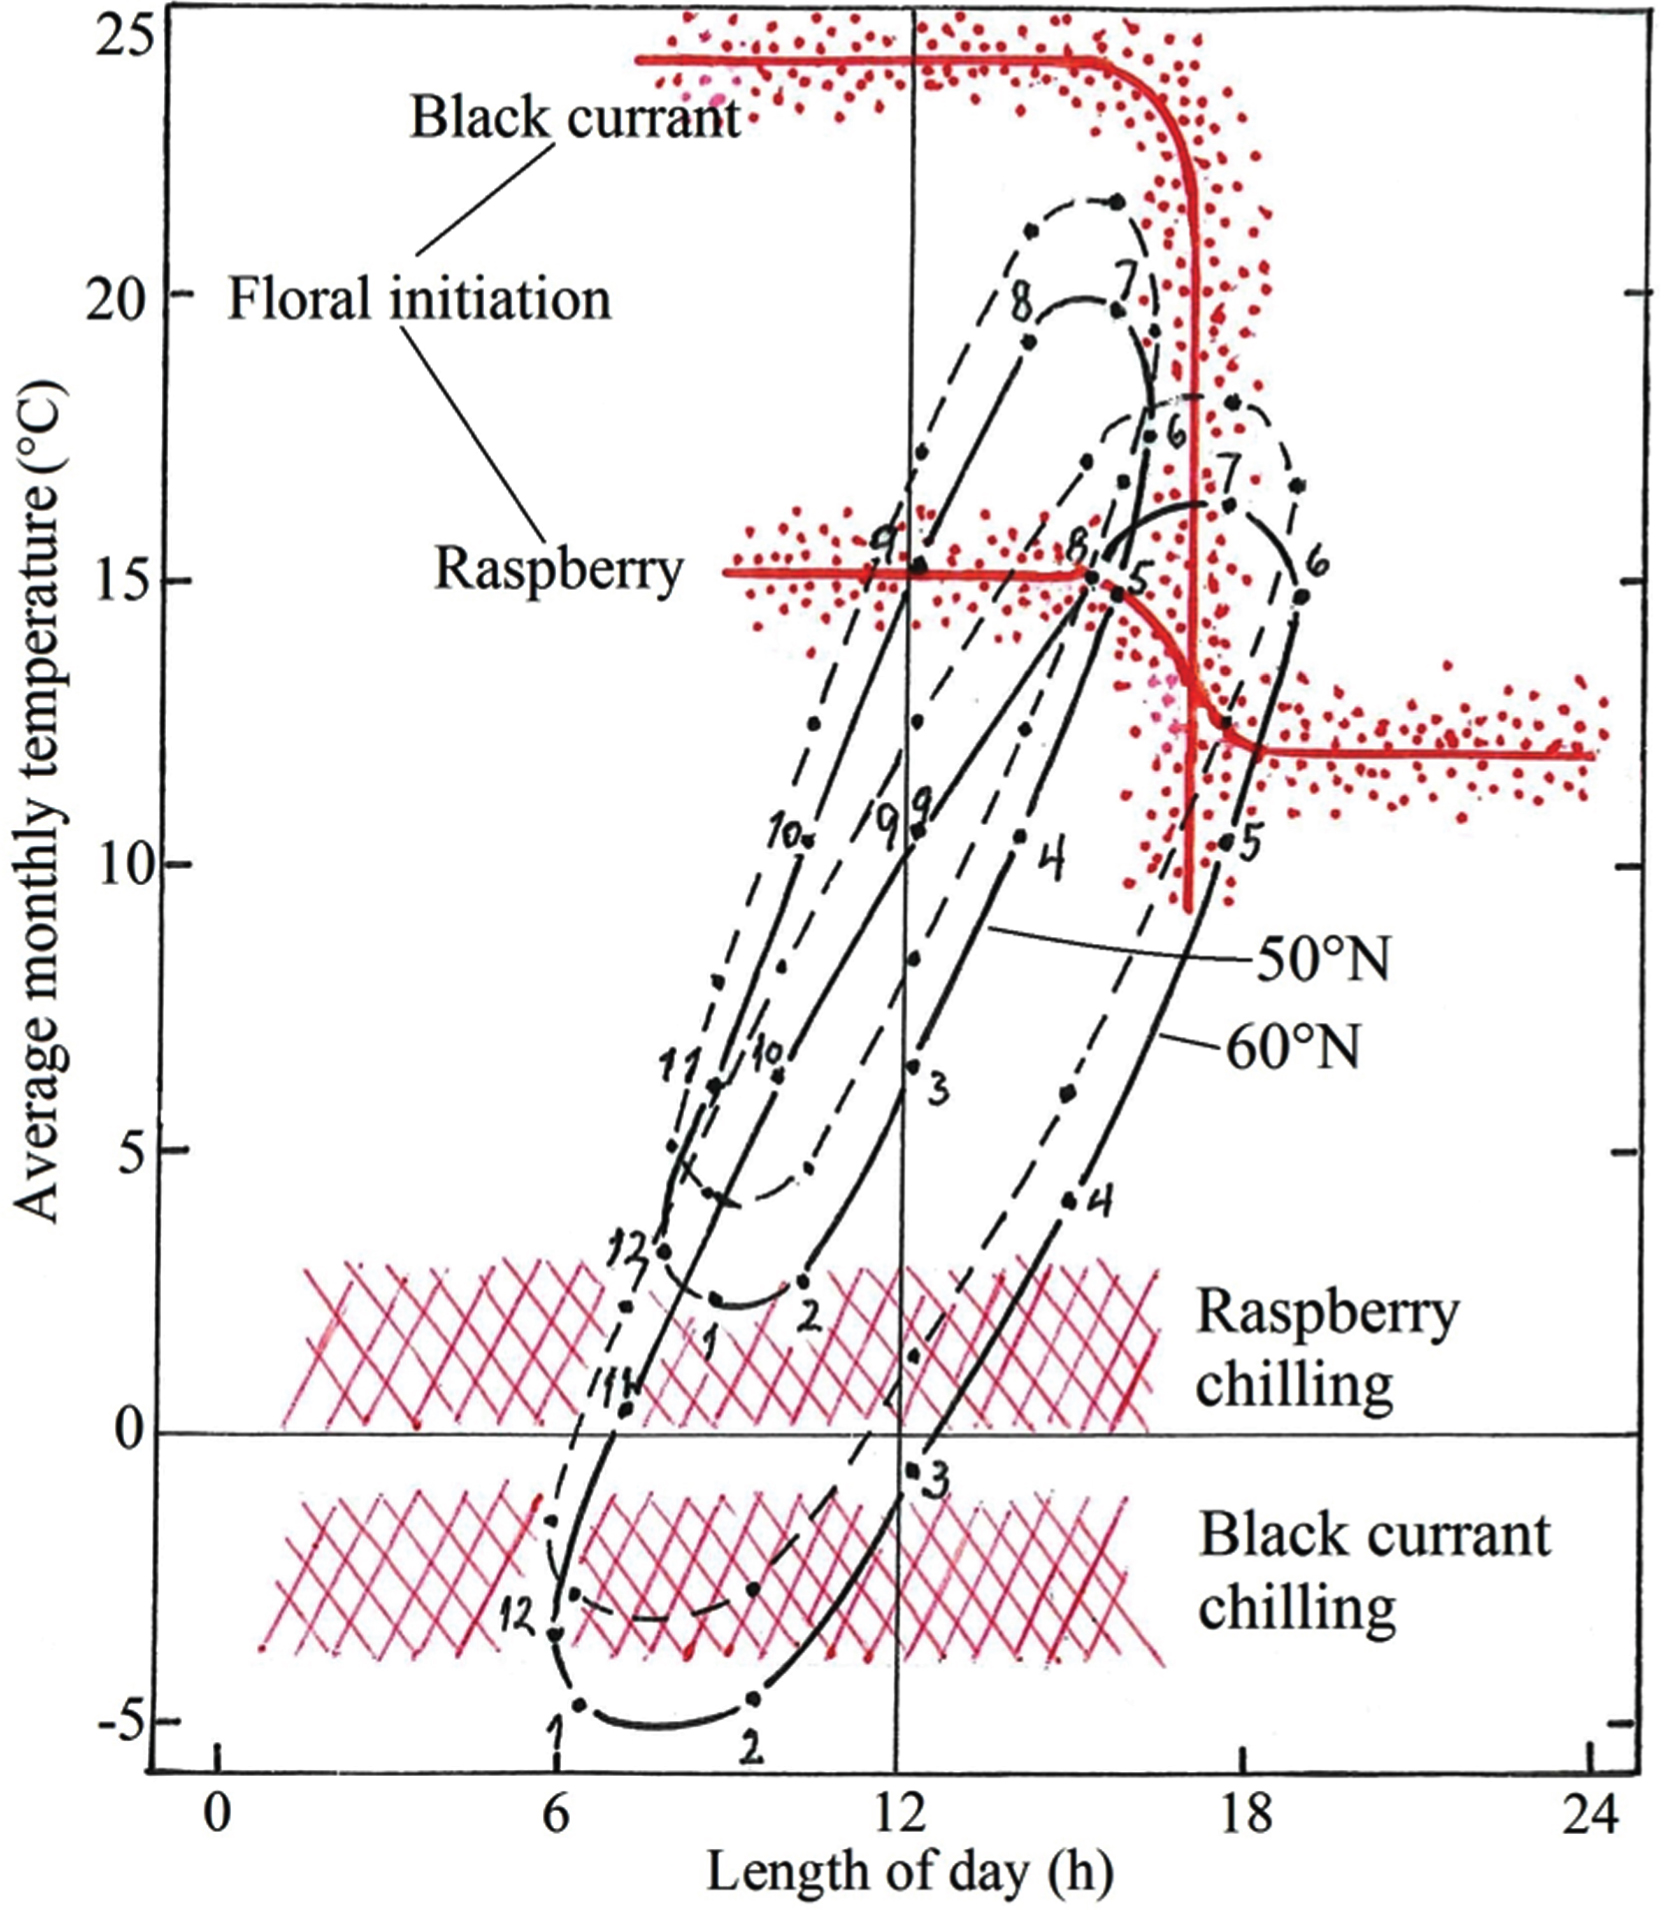
Since floral initiation in most black currant cultivars of Western European origin has a critical photoperiod of approximately 17 h [19] and is promoted by increasing temperature up to at least 24°C [18], the climate at Geisenheim permits initiation at any time throughout summer and autumn as soon as the shoots have reached the so-called ripeness to flower size. This will be the case also after a 2°C warming. At the longer photoperiods at Ås, on the other hand, photoperiodic conditions do not permit floral initiation in black currant until early August when the daylength is down to 17 h. This will also be the case at the elevated temperature. In other words, flowering will not be adversely influenced at any of the locations even with a warming of 3–4°C. However, since black currant have a large chilling requirement for breaking of winter dormancy with an optimum at 0 to –5°C for at least 14 weeks [20], inadequate winter chill is already experienced in this crop at many Western European locations with mild winters [6]. The results in Fig. 2 indicate that inadequate winter chill is already a problem for black currant at Geisenheim, whereas at Ås, the crop will get adequate winter chill even with a 2°C warming during winter.
For biennial-bearing raspberries on the other hand, a temperature increase of 2°C will be critical for timely floral induction at many locations in Central and Southern Europe. According to the results in Fig. 2, the main effect will be delayed flower initiation, since any degree of warming will postpone the time when temperature drops below the critical temperature threshold of 15–16°C for SD floral initiation in raspberry [14–16]. At present, this event takes place in late August and mid-September, respectively, at Ås and Geisenheim, and at both locations floral initiation will be delayed by 1–2 weeks with a 2°C warming, the effect being largest at Ås. However, at neither location will such a delay be critical for commercial production. However, as seen from Fig. 2, inadequate winter chill may already be noticeable for raspberry at Geisenheim, and it will represent an even greater challenge at more southerly and coastal locations with mild winters. In the cool Nordic climate at Ås, the chilling needs of raspberry will be fully met even with a winter temperature increase of 2°C.
Most cultivars of the seasonal flowering (non-everbearing) strawberry are classified as facultative short day (SD) plants with a pronounced interaction of temperature and photoperiod [12, 13, 21], At temperatures above 18–20°C, they need exposure to SD (≤15 h) for induction of flowering, while at lower temperatures, most cultivars also initiate flowers in LD [21, 22]. However, the flower-inducing effect of SD is optimal at 18–20°C and is progressively declining at temperatures <12°C and >21°C.
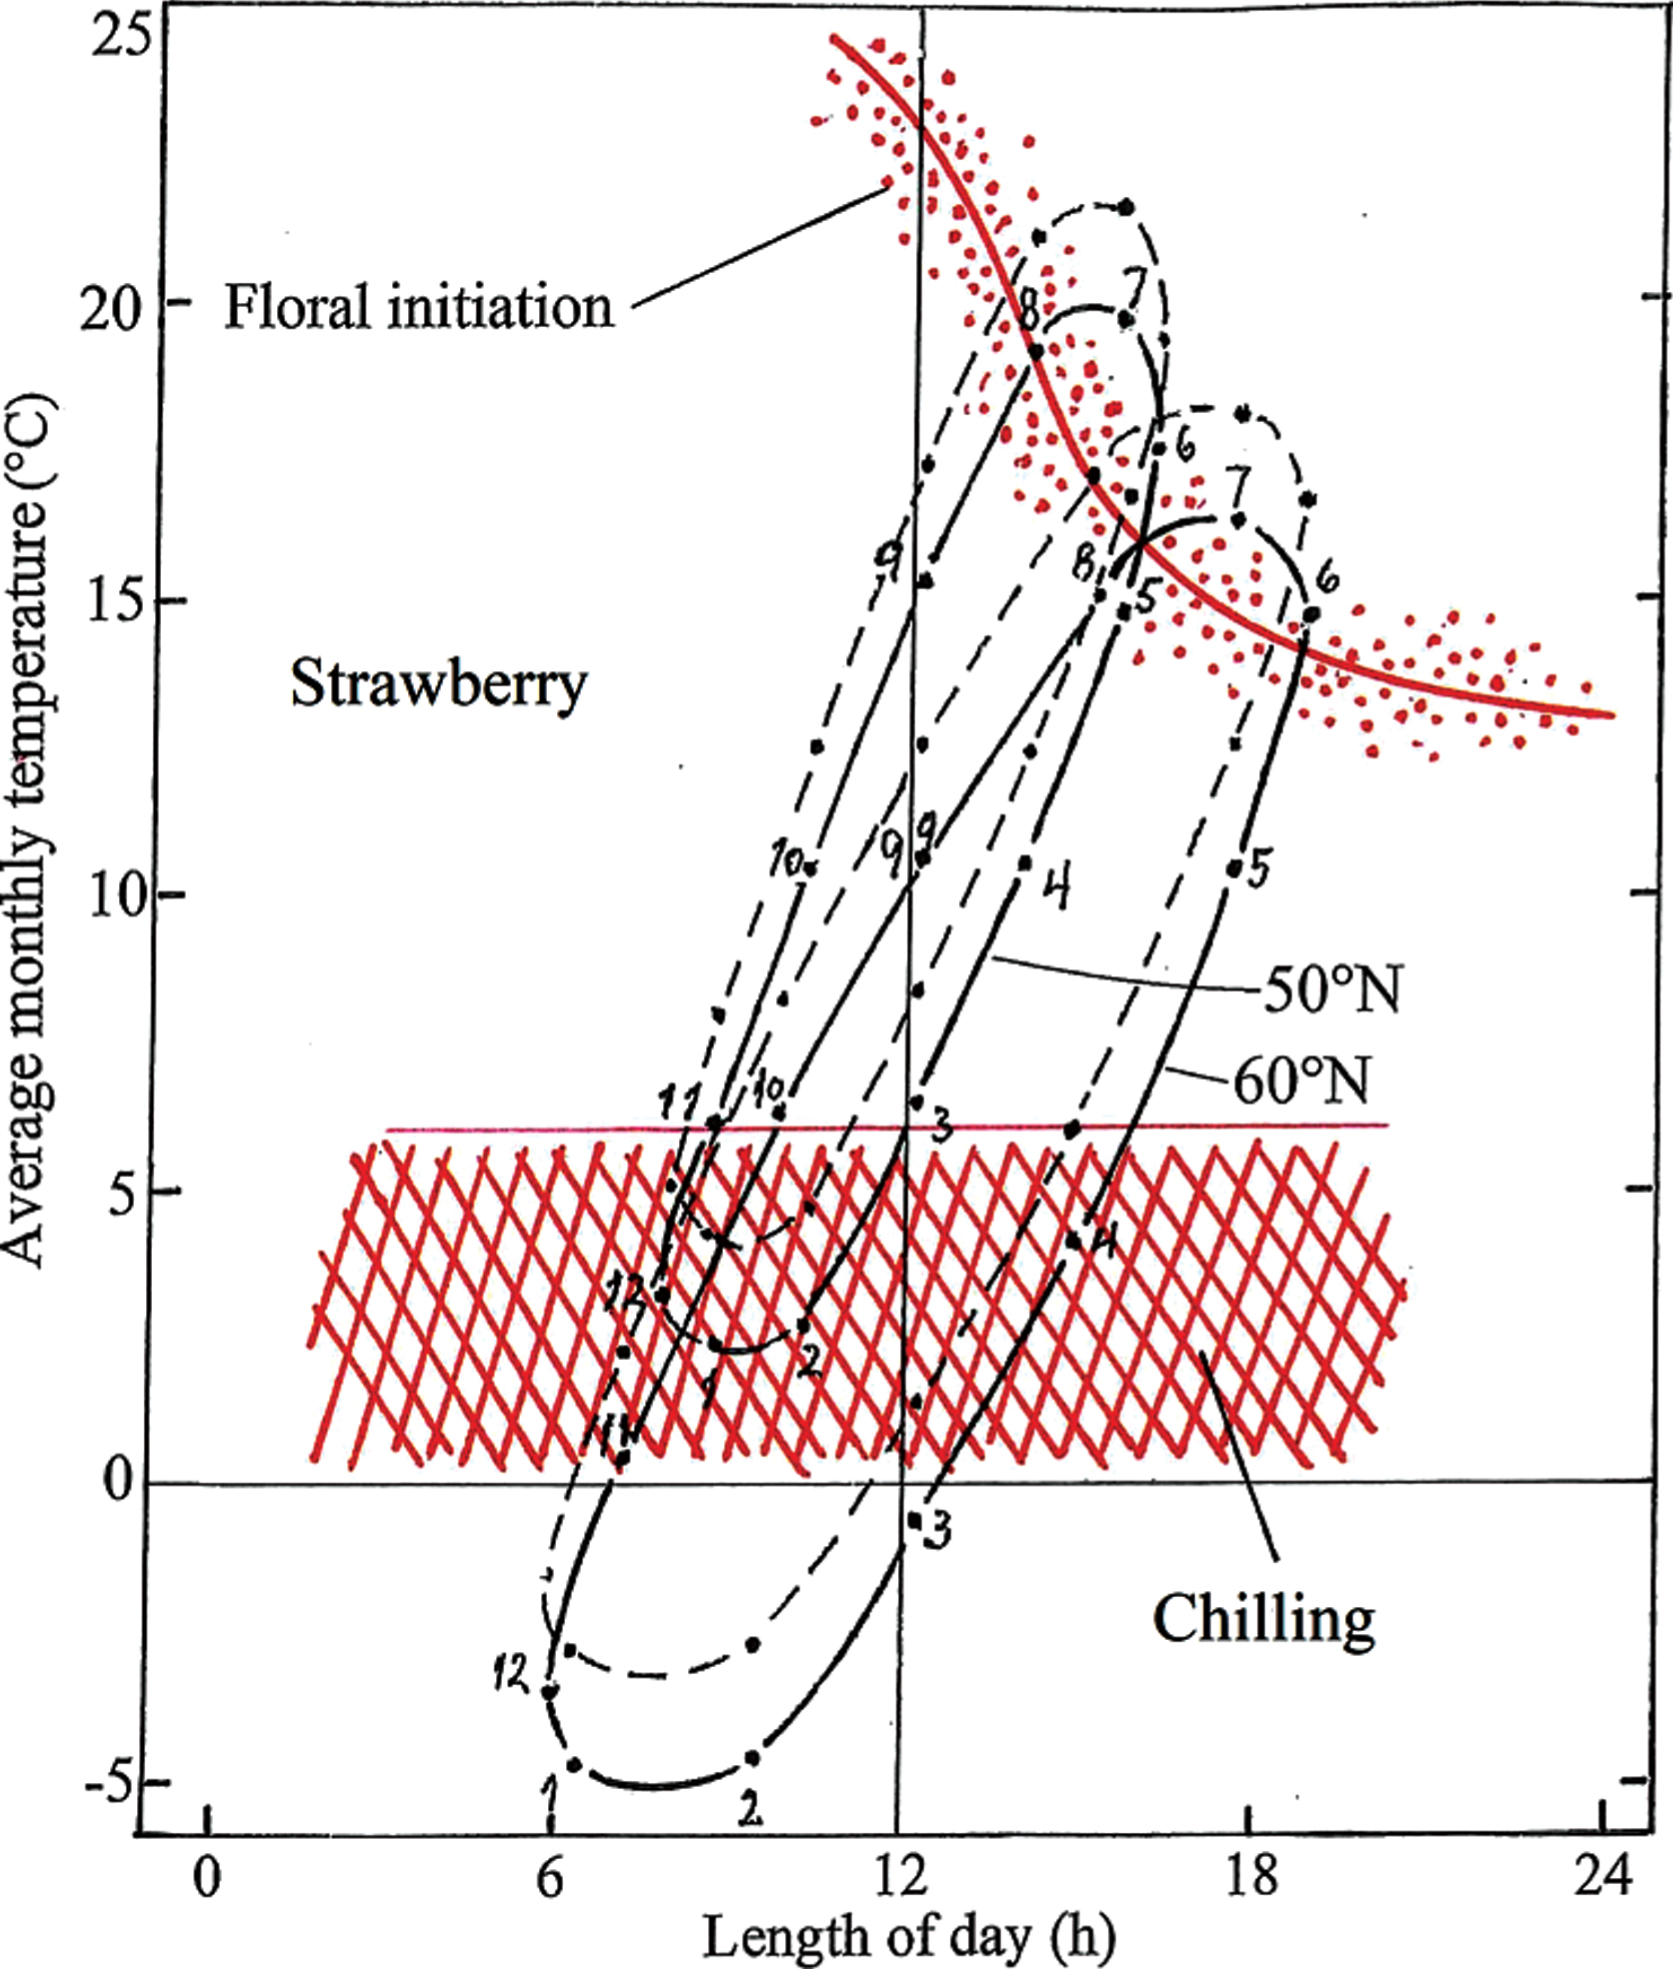
In Fig. 3, the critical photothermal response curve for floral initiation in representative SD strawberry cultivars are plotted on top of the photothermographs for Geisenheim and Ås with and without an overall warming of 2°C. The figure shows that at either location, 2°C warming will have no dramatic consequences for timely induction of flowering. Rather, because of the relatively high temperature optimum for SD floral initiation in strawberry, a 2°C increase in temperature will in fact be beneficial and advance strawberry flower initiation in the cool Nordic climate at Ås. However, as with black currants, the amount of winter chill might already be marginal for full dormancy release of strawberry at Geisenheim, an effect that has in fact been observed in exceptionally mild winters (Dr. Erika Krüger, personal information). It can therefore, be anticipated that with a further increase in winter temperature to 2°C above the 1960-1990 normal level, inadequate dormancy release as witnessed by dwarfed leaf petioles and flower peduncles and even reduced berry yields is likely to occur more or less regularly in many European regions with mild winters. This effect is likely to be accentuated by high autumn temperatures, which have been shown to consistently increase the depth of dormancy in many temperate plants [23]. In the cold winters at Ås, Norway, on the other hand, the amount of chilling will be adequately met in strawberry even with several degrees centigrade winter warming.
Fig. 3
Climate-photothermographs for Ås, Norway (60°N) and Geisenheim, Germany (50°N) together with critical response curves for floral initiation and release from winter dormancy in seasonal-flowering (non-everbearing) strawberry. For illustration of the consequences of a 2°C warming, stippled graphs with +2°C displacement are also presented for each of the two locations. Numbers denote the months of the year.
5Discussion and conclusion
The presented examples clearly demonstrate that the photothermograph technique can be an efficient and convenient tool for assessing ecophysiological and horticultural effects of climate warming in crop plants such as berry crops. For simplification, a blanket temperature increase of 2°C was used in the present elaborations, whereas of course the actual temperature changes for each month and for different locations must be used for real assessments. Attention must also be focused on the particular months when the studied developmental events are known to take place. As already mentioned, the predictions are that the climate warming will be largest at high latitudes [1], and so far, the observed warming has also been largest during the winter season. Therefore, the real effects of climate warming on crop performance may of course deviate somewhat from those presented and discussed above. Also, since cultivars vary in their specific photothermal requirements, it may be necessary to construct cultivar specific critical response curves for testing of the adaptability of cultivars with deviating or unusual climatic requirements. This can also be useful for testing of the performance of new breeding material that are better adapted to a warmer climate.
Since some plants are highly thermo periodic and respond differently to day and night temperatures [7], it may be argued that it is an over-simplification to use only daily mean temperatures for this type of assessments. However, none of the berry crops used as examples here has this type of behaviour. In strawberry for example, Verheul et al. [24] varied day and night temperatures systematically in two well-known strawberry cultivars and concluded that the extent of flowering was as closely related to mean daily temperature as it was to specific day and night temperatures.
Global climate change is a complex and multi-factorial process that involves changes in several interacting climatic factors. One such component is rainfall, which we all know is crucial for plant growth and development, but which has not been considered as a variable in the present discussion. The reason for this is two-fold. In the first place, under horticultural production conditions, water supply as well as fertilization and soil conditions are maintained at near-optimal level. It is therefore, presumed that these edaphic factors are adequately provided for both before and after climate warming. Secondly, under such near-optimal horticultural production conditions, variation in water supply has a negligible effect on plant developmental processes compared with the fundamental interactive effects of temperature and photoperiod [7]. In strawberry for example, it is known that drought stress can advance flowering under marginally inductive temperature and daylength conditions [12, 13], but this drought effect is small compared with the predominant flower induction effect of photoperiod and temperature.
In conclusion, the photothermograph technique present itself as a promising tool for analysing and monitoring the consequences of climate warming on the performance of berry crops as well as other horticultural plants. It can also be used for assessment of the suitability of the photothermal climate at various production locations as well as for evaluation of the suitability of new breeding materials in a scenario of global warming.
Funding
This work was supported by the European Union’s Horizon 2020 research and innovation programme [grant number 679303].
Conflict of interest
The authors have no conflict of interest to report.
Acknowledgments
We thank Dr. Erika Krüger for provision of climatic data for Geisenheim, Germany.
References
[1] | IPCC. Managing the risk of extreme events and disasters to advance climate change adaptations. In: Field CB , editor. A special Report of Working Groups I and II of the Intergovernmental Panel on Climate Change. Cambridge University Press; (2014) . |
[2] | Lambers H , Chapin III FS , Pons TL . Plant Physiological Ecology, 2nd ed. New York, US: Springer; (2008) . |
[3] | Fitter AH , Fitter RSR . Rapid changes in flowering time in British plants. Science. (2002) ;296: :1689–91. |
[4] | Schleip C , Luterbacher J , Menzel A . Time series modelling and central European temperature impact assessment of phenological records over the last 250 years. Journal of Geophysical Research: Biogeosciences. (2008) ;113: :(G4). |
[5] | Schwartz MD , Hanes JM . Continental scale phenology: Warming and chilling. International Journal of Climatology. (2000) ;30: :1595–98. |
[6] | Atkinson CJ , Brennan RM , Jones HG . Declining chilling and its impact on temperate perennial crops. Environmental and Experimental Botany. (2013) ;91: :48–62. |
[7] | Thomas B , Vince-Prue D . Photoperiodism in Plants., 2nd. ed. London, UK: Academic Press; (1997) . |
[8] | Garner WW , Allard HA . Effect of the relative length of day and night and other factors of the environment on growth and reproduction in plants. Journal of Agricultural Research. (1920) ;18: :553–606. |
[9] | Garner WW , Allard HA . Further studies in photoperiodism, the response of the plant to relative length of day and night. Journal of Agricultural Research. (1923) ;23: :871–920. |
[10] | Ferguson JHA . Photothermographs, a tool for climate studies in relation to the ecology of vegetable varieties. Euphytica. (1957) ;6: :97–105. |
[11] | Heide OM . Growth and dormancy in Norway spruce ecotypes (Picea abies) I. Interaction of photoperiod and temperature. Physiologia Plantarum. (1974) ;30: :1–12. |
[12] | Guttridge CG . Fragaria x ananassa, In: Halevy AH, editor. Handbook of Flowering, Vol. III. Boca Raton, US: CRC Press; 1985. pp. 16-33. |
[13] | Heide OM , Stavang JA , Sønsteby A . Physiology and genetics of flowering in cultivated and wild strawberries – a review. Journal of Horticultural Science and Biotechnology. (2013) ;88: :1–18. |
[14] | Williams IH . Effects of environment on Rubus idaeus L.V. Dormancy and flowering of the mature shoot. Journal of Horticultural Science. (1960) ;35: :214–20. |
[15] | Heide OM , Sønsteby A . Physiology of flowering and dormancy regulation in annual- and biennial fruiting red raspberry (Rubus idaeus L.) – a review. Journal of Horticultural Science and Biotechnology. (2011) ;86: :433–42. |
[16] | Hodnefjell R , Heide OM , Rivero R , Remberg SF , Sønsteby A . Control of growth cessation and floral initiation in red raspberry (Rubus idaeus L.) cultivars of diverse origin in controlled and natural environments. Scientia Horticulturae. (2018) ;233: :412–20. |
[17] | Tinklin IG , Wilkinson EH , Schwabe WW . Factors affecting flower initiation in the black currant Ribes nigrum (L.). Journal of Horticultural Science. (1970) ;45: :275–82. |
[18] | Sønsteby A , Heide OM . Elevated autumn temperature promotes growth cessation and flower formation in black currant cultivars. Journal of Horticultural Science and Biotechnology. (2011) ;86: :120–7. |
[19] | Heide OM , Sønsteby A . Critical photoperiod for short-day induction of flowering in black currant (Ribes nigrum L.). Journal of Horticultural Science and Biotechnology. (2011) ;86: :128–34. |
[20] | Sønsteby A , Heide OM . Chilling requirements of contrasting black currant (Ribes nigrum L.) cultivars and the induction of secondary bud dormancy. Scientia Horticulturae. (2014) ;179: :256–65. |
[21] | Heide OM . Photoperiod and temperature interactions in growth and flowering of strawberry. Physiologia Plantarum. (1977) ;40: :21–6. |
[22] | Ito H , Saito T . Studies on the flower formation in the strawberry plant. I. Effects of temperature and photoperiod on the flower formation. Tohoku Journal of Agricultural Research. (1962) ;13: :191–203. |
[23] | Heide OM . High autumn temperature delays spring bud burst in boreal trees, counterbalancing the effect of climate warming. Tree Physiology. (2003) ;23: :931–36. |
[24] | Verheul MJ , Sønsteby A , Grimstad SO . Influence of day and night temperatures on flowering of Fragaria x ananassa Duch. cvs. Korona and Elsanta. Scientia Horticulturae. (2007) ;112: :200–206. |

