
Characterizing the phenolic constituents of U.S. Southeastern blackberry cultivars
Abstract
BACKGROUND:
Georgia’s small fruit sector is important to the state’s agricultural economy, and is seeking ways to promote their fruits in the health and wellness market. Based on the hot, humid, climatic conditions of the U.S. Southeast, three blackberry varieties, namely ‘Navaho’, ‘Ouachita’, and ‘Kiowa’, can grow, but a complete characterization of their antioxidant phenolic constituents has not been reported.
OBJECTIVE:
This study aims to investigate the phenolic compounds and antioxidant activities in U.S. Southeastern erect-type blackberry cultivars of commercial significance.
METHODS:
Phenolics from blackberries were isolated, separated, and elucidated both qualitatively and quantitatively by various chromatographic means, including HPLC–ESI–MS and MALDI–TOF–MS.
RESULTS:
Delphinidin-3-O-glucoside, malvidin-3-O-glucoside, quercetin-3-O-glucoside malonate, and propelargonidin B-type dimer were present in the Southeastern blackberries, which have not been found in any major U.S. cultivars. MALDI–TOF–MS analysis revealed a distinctive ellagitannin profile among the cultivars, and identified 5 additional ellagitannin compounds that were not elucidated by HPLC–ESI–MS.The detection of the propelargonidin B-type dimer revealed that the flavan-3-ols of blackberries are not limited to (epi)catechin-based compounds.
CONCLUSIONS:
U.S. Southeastern erect-type blackberry cultivars grown in Georgia showed distinct phenolic profiles and antioxidant activities from those of Pacific Northwestern cultivars.
1Introduction
In recent decades, highly dynamic food and nutraceutical industries have been incorporating natural polyphenolic extracts to their products. The purported health benefits from the intake of dietary phenolics at delaying or even inhibiting degenerative diseases, like cancer and cardiovascular disease, have been studied extensively [1]. Polyphenols are broadly distributed throughout the plant kingdom with more than 8000 naturally occurring phenolic structures discovered, of which > 4000 are flavonoids [2]. These phytochemicals are found in fruits, vegetables, and cereals, and vary amongst other food types. Of particular interest is the blackberry (Rubus spp.), which has been ranked by some researchers as the highest in terms of its phenolic content and antioxidant capacity amongst the berry fruits, as well as exhibiting a strong biological antioxidant activity when compared to other fruit species [3–5].
Blackberry cultivars of the United States (U.S.) differ in their genetic makeup, growth characteristics, and the number of types available [6]. They are categorized morphologically into erect, semi-erect, and trailing types [7]. In the U.S., most blackberries are cultivated in the Pacific Northwest. Oregon is the largest producing state, contributing roughly 65% of the total national yield, with 99% of its production comprising trailing and semi-erect types [8]. The drastic increase in acreage dedicated to blackberry production in recent years reflects the importance of products derived therefrom for commercial use. Blackberries are used in beverage syrup formulations, employed as a natural colorant, and are popular in nutraceutical formulations [9, 10]. Over the past few decades, the breeding program at the University of Arkansas has developed erect-type blackberries, bred to be commercially viable in the hot and humid climatic conditions of the Southeastern U.S. It is well known that the geographic location, surrounding climate, and soil type can have a great impact on a fruits’ phenolic composition and levels [11].
Often, phenolic profiles are reported only on a crude extract, but difficulties in the separation of particular classes of phenolics and the detection limits of certain analytical instrumentation can thwart complete characterization of samples. Suitable sample preparation and purification steps are sometimes required to achieve a more complete characterization of the phenolic constituents. This study employed column chromatography using Sephadextrademark LH-20, a hydroxypropylated cross-linked dextran, to separate phenolic classes based on their distinctive chemical composition and molecular masses. Due to Sephadex LH-20’s unique chromatographic selectivity on account of the matrix’ dual hydrophilic and lipophilic nature, flavonoids can be separated/purified to a high degree [12]. Collected fractions, containing separated phenolic constituents, will exhibit characteristic absorption behavior for the phenolic class in question when scanned over the ultraviolet-visible spectrum. The spectral data obtained can provide limited information towards the identification of phenolic compounds, but often become quite useful after HPLC–MS analysis. Electrospray ionization (ESI) and matrix-assisted laser desorption/ionization (MALDI) mass spectrometry (MS) are techniques employed in the qualitative identification of phenolics. The first method, which typically has an HPLC system connected to it, is suitable for analyzing phenolics possessing small molecular masses like those of flavonoids, while the latter is appropriate for identifying larger molecules such as proanthocyanidin and ellagitannin polymers [13]. Moreover, MALDI features a relatively rapid analysis time for high throughput, easy sample preparation steps, as well as high sensitivity and resolution, making it a great option for the elucidation of polyphenolics [14]. The purpose of this study was to characterize the phenolic constituents of three commercial blackberry cultivars, which were bred to thrive in the hot and humid climatic conditions of the U.S. Southeast, by a number of chromatographic strategies. This study provides knowledge on the blackberry phenolics in U.S. Southeastern varieties, and presents growers and consumers with details on selected bioactives in these cultivars with potential health benefits. Such information could be used to strengthen or expand the market of U.S. Southeastern blackberries.
2Materials and methods
2.1Chemicals
ACS-grade acetone, methanol, diethyl ether, and ethanol (95%), glass wool, glacial acetic acid, hydrochloric acid, sodium hydroxide, as well as HPLC-grade water, methanol, and acetonitrile were purchased from the Fisher Scientific Co., LLC (Suwanee, GA, USA). Sephadex LH-20, Folin & Ciocalteu’s phenol reagent, gallic acid, (+)-catechin hydrate, chlorogenic acid, vanillic acid, caffeic acid, ellagic acid, protocatechuic acid, p-coumaric acid, and quercetin-3-O-rutinoside hydrate were obtained from the Sigma-Aldrich Chemical Company (St. Louis, MO, USA). Cyanidin-3-O-glucoside chloride was procured from the Indofine Chemical Co. (Hillsborough, NJ, USA).
2.2Sample preparation
Ripe blackberries (Rubus spp.) were harvested at Jacob W. Paulk Farms, Inc. (Wray, GA) in June 2016, 2017 and 2018. The three blackberry cultivars collected were ‘Navaho’, an erect thornless variety; ‘Kiowa’, an erect thorny variety; and ‘Ouachita’, a very erect thornless variety. Handpicked blackberries were transported to the UGA Department of Food Science & Technology (Athens, GA). Representative samples of each variety were transferred to polyethylene pouches, vacuum packed (Henkelman 600, Henkelman BV, The Netherlands), and stored at –40°C until analyzed.
2.3Extraction of blackberry phenolics
Random samples of each cultivar were lyophilized in a FreeZone® 2.5-L bench-top freeze dryer (Labconco Corporation, Kansas City, MO) and then ground to a fine powder in a Ninja NJ100 Express Chop (Shark Ninja, Newton, MA, USA). Blackberry powder (15 g) of each cultivar was mixed with 150 mL of extractant ((CH3)2CO/H2O/CH3COOH, 70.0/29.5/0.5, v/v/v). An extraction was performed by blending the slurry with a PT-3100 Polytrontrademark homogenizer (Brinkmann Instruments, Westbury, NY, USA) at 13,000 rpm for 10 min, followed by centrifugation at 4,000 rpm for 20 min. The supernatant was filtered through Whatman No.1 filter paper (Whatman International Ltd., Maidstone, UK) using a Büchner funnel. The extraction was performed in triplicate, and the filtrates were pooled. The organic solvent was removed using a Büchi Rotavapor R-210 using a V-700 vacuum pump connected to a V-850 vacuum controller (Büchi Corporation, New Castle, DE) at 45°C. The simple sugars and organic acids in the resultant aqueous fraction were removed using an Amberlite XAD-16 chromatographic column as described by Liao et al. [16]. The crude phenolic extracts were lyophilized and stored in amber-glass vials at 4°C.
2.4Hydrolysis of phenolics from crude blackberry extracts
Based on the method described by Amarowicz et al. [17] with slight modification, phenolic compounds from the crude blackberry extracts were fractionated into free, soluble esterified, and glycoside-bound phenolics. Crude extract (400 mg) was taken, dispersed in deionized water, acidified to pH 2 with 6 M HCl, and sonicated to ensure its dissolution. The free phenolics were extracted 5× with 20 mL portions of diethyl ether using a separatory funnel. The ether extracts were pooled. The residual aqueous-phase was hydrolyzed with 2 M NaOH under a N2 atmosphere for 4 h at room temperature, and then acidified back to pH 2. Extraction of alkali-liberated phenolics was carried out 5× with 30 mL portions of diethyl ether using a separatory funnel, and the ether layer containing the esterified phenolics fraction was collected. The residual aqueous-phase was then hydrolyzed with 6 M HCl under a N2 atmosphere for 1 h at 100°C. Extraction of the acid-liberated phenolics was carried out 5× with 45 mL portions of diethyl ether using a separatory funnel, and the ether layer containing the glycoside-bound phenolics was pooled. For all fractions, the ether was removed using the Rotavapor. The resultant preparations were stored in amber-glass vials at 4°C until further analyzed.
2.5Fractionation of crude blackberry extracts
The ‘Ouachita’ blackberry cultivar is known for its high yield, large fruit size, and high quality. This has resulted in its commercial popularity especially among home gardeners [18]. Hence, a detailed characterization of the phenolics was undertaken on this particular cultivar. Following the method of Robbins et al. [19], the crude phenolic extract (2 g) was mixed with a small volume of 95% (v/v) ethanol and sonicated until dissolved. The sample was loaded onto a chromatographic column packed with Sephadex LH-20 (bead size: 25–100 μm; Chromaflex column, 30×400 mm [I.D.×length], Kontes, Vineland, NJ, USA) for fractionation. About 400 mL of 95% (v/v) ethanol were used to elute the LMW fraction. Eluate (∼8 mL) was collected in 13×100 mm borosilicate glass culture tubes using a SC100 fraction collector (Beckman Coulter, Inc., Brea, CA, USA). After which, the mobile phase was switched over to 50% (v/v) aqueous acetone to elute the HMW constituents as a single fraction; 400 mL of the second mobile phase were used. Employing an Agilent 8453 diode array spectrophotometer (Agilent Technologies, Inc., Wilmington, DE, USA), the UV-Vis spectral characteristics of each ethanolic fraction in the test tubes were recorded over the wavelength range of 200 to 600 nm. Based on similarities in the bands observed, the eluates were pooled into four major fractions (F1 thru F4). Organic solvent from all fractions (i.e., four for the LMW and one for the HMW compounds) was removed using the Rotavapor. The aqueous product from the HMW fraction was transferred to a crystallization dish (100×50 mm, dia.×H), covered with filter paper, and placed in a –80°C freezer until frozen. The sample was lyophilized as aforementioned, and then stored in an amber-glass vial at 4°C until analyzed. HMW fractions of ‘Kiowa’ and ‘Navaho’ blackberry cultivars were also prepared for MALDI–TOF–MS analysis.
2.6Total phenolics content (TPC) assay
The TPC for each crude phenolic extract and fraction was determined according to Folin-Ciocalteu’s phenol assay [20]. Quantitation was based on a gallic acid (GA) standard curve. Each experiment was conducted in triplicate, and the data expressed as mg gallic acid equivalents/100 g fresh weight blackberries, herein after simply mg GA eq./100 g f.w.
2.7Total monomeric anthocyanins content (TMAC) assay
The TMAC value in the crude phenolic extracts of the three cultivars was determined using the pH differential method [21]. Anthocyanins exist as colored oxonium-ion and colorless hemiketal forms at pHs of 1.0 and 4.5, respectively. The difference in absorbance readings at λ= 510 nm for the two pH conditions is proportional to the anthocyanins concentration. The calculation is performed using the following equations:
2.8HPLC characterization of phenolic compounds
The separation and quantitation of the blackberry phenolics were performed on all LMW and HMW fractions of the ‘Ouachita’ cultivar according to Gong and Pegg [22] using an Agilent 1200 series HPLC system consisting of a quaternary pump with degasser, autosampler, thermostatted column compartment, UV-Vis diode array detection with standard flow cell, and 3D ChemStation software (Agilent Technologies). A reversed-phase fused-core Kinetex® XB-C18 column (4.6×150 mm i.d., 2.6 μm particle size, 100 Å; Phenomenex, Torrance, CA, USA) was employed. The linear gradient elution comprised mobile phase A(H2O/CH3CN/CH3COOH, 93 : 5: 2, v/v/v) and B (H2O/CH3CN/CH3COOH, 58 : 40 : 2, v/v/v) from 0 to 80% B over a 35 min period at a flow rate of 0.6 mL/min. The four LMW and one HMW fractions were dissolved in anhydrous CH3OH at a 3 mg/mL concentration, passed through a 0.2 μm regenerated cellulose syringe filter (Phenomenex), and transferred into 2 mL amber HPLC vials, which were then capped and placed in the autoinjector. The injection volume was 20 μL. Detection wavelengths were set at λ= 255 nm (ellagic acid, and ellagic acid derivatives), 280 nm (phenolic acids of the benzoic acid family, catechin, epicatechin, flavan-3-ols), 330 nm (phenolic acids notably of the trans-cinnamic acid family), 360 nm (flavonols), and 520 nm (anthocyanins). Tentative identification of chromatographed components was made by matching UV-Vis spectra and retention time (tR) mapping with commercial standards. Further identification was achieved by HPLC–ESI–MS, as described below.
The identification of soluble esterified and glycoside-bound phenolics was performed according to Ma et al. [23]. The same HPLC system as described above was employed, except that a reversed-phase Luna C18(2) column (4.6×250 mm i.d., 5-μm particle size; Phenomenex) was used. Mobile phases A (H2O/CH3CN/CH3COOH, 93 : 5: 2, v/v/v) and B (H2O/CH3CN/CH3COOH, 58 : 40 : 2, v/v/v) comprised the gradient for compound elution from 0 to 100% B over a 50 min period at a flow rate of 1 mL/min. Detection wavelengths were set as described above.
2.9High-performance liquid chromatography–electrospray ionization–mass spectrometry characterization (HPLC–ESI–MS)
An Agilent 1100 HPLC system coupled to a Waters® Q-TOF microtrademark Mass Spectrometer in the negative-ion mode with an ESI interface (Waters Corporation, Milford, MA, USA) was employed to further identify the separated phenolics. MassLynx software (Version 4.1, Waters Corporation) was used to acquire the spectrum information. Based on the MS conditions described by Robbins et al. [19] with slight modification, the capillary voltage was set at –2.5 kV, the nitrogen flow rate at 450 L/h, and the ion-transfer capillary temperature at 300°C. Argon was used as the collision gas. The voltage for collision was set at 5 V for MS and 20 V for MS/MS. The detector was set to a scanning mass range of 80 to 3000 Da. The identification of compounds was achieved by comparing parent molecular ions [M–H]– and fragmentation patterns against those of known standards and reported literature values.
2.10Matrix-assisted laser desorption/ionization–time of flight–mass spectrometry (MALDI–TOF–MS)
The tannin constituents in the HMW fraction of the three cultivars were further characterized by MALDI–TOF–MS. Samples were mixed with a matrix comprising 2,5-dihydroxybenzoic acid at a concentration of 10 mg/mL in highly purified H2O:CH3CN:CF3COOH (50 : 50 : 0.1, v/v/v). One microliter of the resultant solution was spotted onto a flat, stainless-steel MALDI plate and the solvent was vaporized in air. A Bruker Daltonics Autoflextrademark MALDI-TOF mass spectrometer (Bruker Corporation, Billerica, MA, USA) was employed. Quasi-molecular [M + H]+ and [M + Na]+ ions, generated by the laser desorption process, entered the flight tube with a delay time of 100 ns in the linear positive-ion mode. All mass spectra were collected by averaging the signals of at least 3,000 laser shots over an m/z range of 620 to 7,898 using an external standard. The detected hydrolyzable tannin structure was determined based on the theoretical or calculated monoisotopic mass according to the following equation:
[M + Na]+ = (634.47 × Ellagitannins) + (784.56×Pedunculagin) + (936.66×galloyl-bis-HHDP glucopyranose) + (169.10×Gallate) – (2.02×linkage) + 22.99
where, ellagitannins, pedunculagin, and galloyl-bis-hexahydroxydiphenoyl (HHDP) glucopyranose are numbers of units contained in the molecule, with ester linkages between the units.
2.11Statistical analysis
All observations were expressed as the mean±standard deviation (n = 3). Statistical evaluations used t-tests and one-way analysis of variance (ANOVA) with cultivar as the variable factor and post-hoc tests for significance of differences by Duncan’s multiple comparison test. Statistical significance was considered at p < 0.05.
3Results and discussion
3.1TPC, TMAC and ellagitannin contents in U.S. Southeastern cultivars
The various phenolic compounds in the blackberry extracts will have differing responses with the Folin & Ciocalteu reagent, so the standard employed needs to be clearly stated. Even though gallic acid is not the dominant phenolic acid in blackberries, the TPC findings were reported as GA eq., so that comparisons could be made with values reported in literature. ‘Navaho’ blackberries showed a significantly (p < 0.05) greater TPC of 459±2 mg GA eq./100 g f.w. than that of ‘Kiowa’ and ‘Ouachita’ (i.e., 409±1 and 411±3 mg GA eq./100 g f.w., respectively) (Table 1). The higher content of total phenolics in ‘Navaho’ might be attributed to its prolonged ripening period feature [24, 25]. In this study, ‘Navaho’ was found to have a markedly greater TPC value than the 304±6.2 mg GA eq./100 g f.w. reported by Moyer et al. [26], while ‘Kiowa’ displayed a similar concentration to that reported by Sellappan et al. [27]. However, these TPC values are roughly half of those from Northwestern blackberry cultivars, which have been reported to contain anywhere from 682 to 1,056 mg GA eq./100 g f.w. [28]. A number of compounds can interfere with the TPC assay including reductants like ascorbic acid and simple sugars, thereby overestimating the true phenolics content. One may argue that the assay is better at representing a sample’s reducing capacity than its TPC. For this reason, we passed our extracts through an Amberlite XAD16 column with water as the eluent to facilitate the removal of ascorbic acid, simple sugars, and organic acids to correct for potential interference. The phenolics were then recovered using methanol before TPC determinations. Furthermore, the phenolics content in a blackberry is clearly dependent on a number of factors including the growth region and cultivars sowed. Pantelidis et al. [29] investigated the blackberry cultivars ‘Chester Thornless’ and ‘Hull Thornless’ from Northern Greece and expressed their data on the basis of dry weight. When these data are adjusted to fresh weight based on moisture content of the samples, TPC values ranged from 201 to 235 mg GA eq./100 g f.w. When these same cultivars were grown in Maryland, the phenolics concentrations was found to be only half of those reported in the Greece-grown blackberries [6, 29].
Table 1
Total phenolics content (TPC), total monomeric anthocyanins content (TMAC) and ellagitannins content in ‘Navaho’, ‘Kiowa’, and ‘Ouachita’ blackberry cultivarsa
| Cultivars | TPC (mg gallic acid eq./100 g f.w.) | TMAC (mg cyanidin-3-O-glucoside eq./100 g f.w.) | Ellagitannins (mg ellagic acid eq./100 g f.w.)b |
| ‘Navaho’ | 459±2 x | 140±3 y | 27.8±0.4 x |
| ‘Kiowa’ | 409±1 y | 150±2 x | 17.0±0.6 y |
| ‘Ouachita’ | 411±3 y | 143±1 y | 10.4±0.3 z |
aValues are means of triplicate analyses±standard deviation. Means in a column with the same letter are not significantly (p > 0.05) different. bQuantitation of ellagitannins was performed on RP-HPLC system, and the data was calculated against ellagic acid standard curve.
Southeastern U.S. cultivars displayed a similar percentage of anthocyanins, as determined by the TMAC assay, compared to those of Northwestern varieties (Table 1). In this work, anthocyanins were found to be the predominant phenolic class in blackberries representing 30 to 36% of the total phenolics present. The TMAC values of three cultivars were 140±3, 150±2, and 143±1 mg C3 G eq./100 g f.w. for the ‘Navaho’, ‘Kiowa’, and ‘Ouachita’ cultivars, respectively. Our data were comparable to those previously reported for ‘Navaho’ (130 mg C3G eq./100 g f.w.) and ‘Kiowa’ (154 mg C3G eq./100 g f.w.), as well as to the anthocyanin contents in 39 Oregon varieties (ranging from 75 to 201 mg C3G eq./100 g f.w.) [10]. ‘Navaho’ possessed 27.8±0.4 mg ellagic acid eq./100 g f.w., which is significantly (p < 0.05) greater than that found in the ‘Kiowa’ and ‘Ouachita’ cultivars, namely 17.0±0.6 and 10.4±0.3 mg ellagic acid eq./100 g f.w., respectively. Our findings also fall within the range of the content of ellagitannins determined in the harvested Oregon cultivars (ranging from 8.8 to 27.2 mg ellagic acid eq./100 g f.w.) [28].
3.2Sephadex LH-20 column chromatography and HPLC–ESI–MS analysis
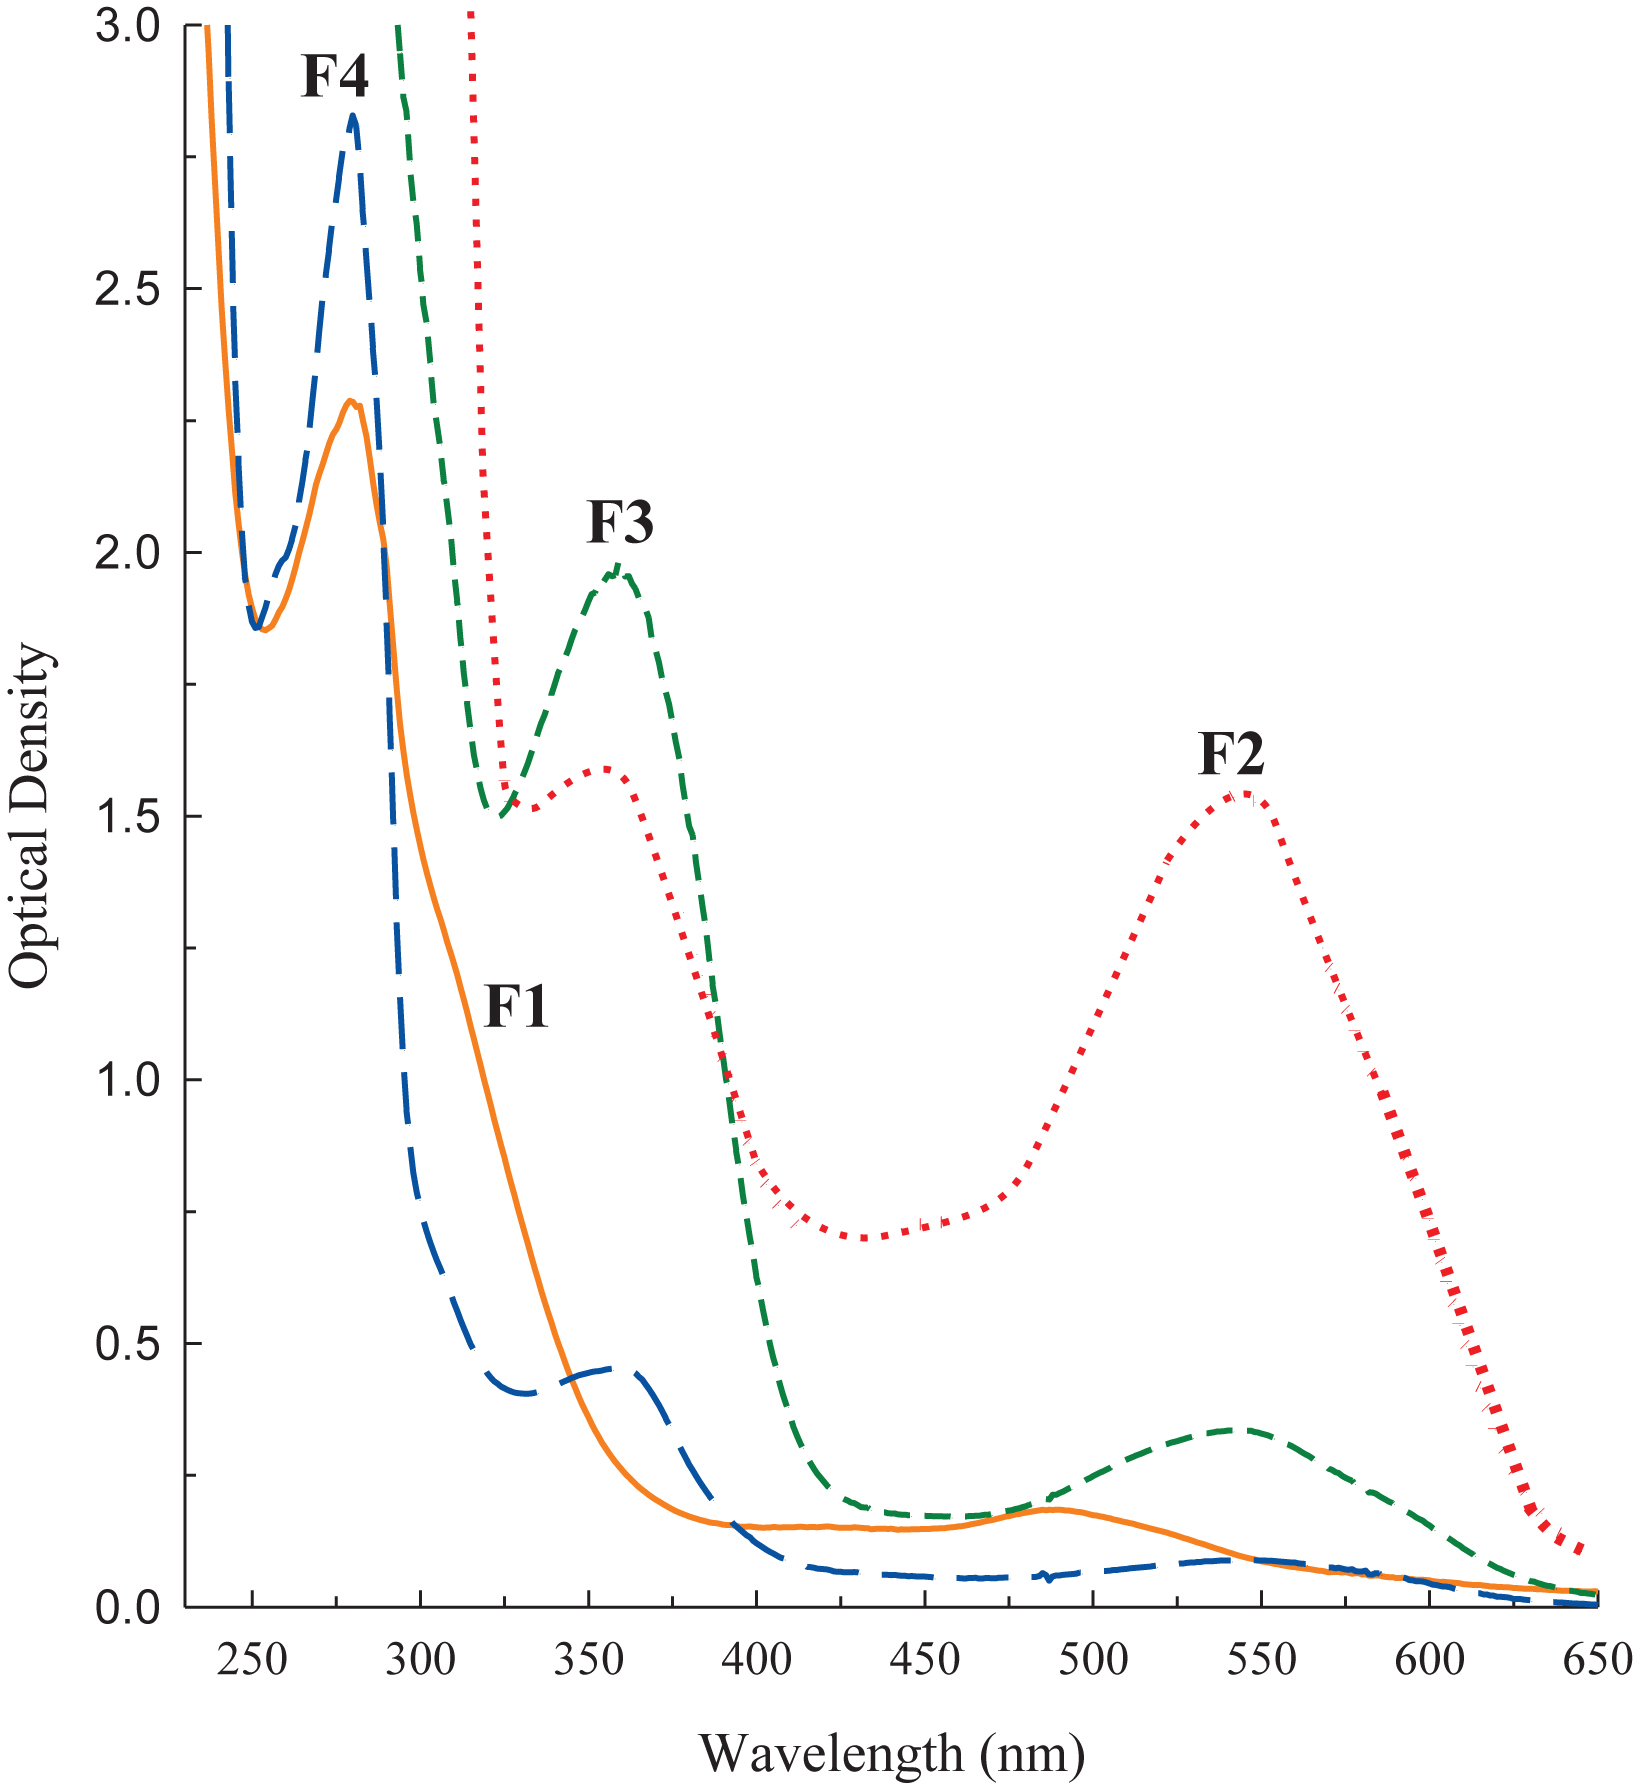
The recovery of blackberry phenolic extracts loaded onto the Sephadex LH-20 column ranged between 96 and 97% based on gravimetric analysis. The phenolics of ‘Ouachita’ that eluted from the column with 95% (v/v) ethanol were grouped into four LMW fractions according to differences observed in optical density readings over a wavelength range of 230 to 650 nm (Fig. 1). The first fraction (F1) was light orange in appearance and possessed a major band at 282 nm.The transition from F1 to F2 showed pronounced differences in its spectral characteristics highlighted by an increase in absorbance at 546 nm, which is typical for purple-pigmented anthocyanins, and a band at 358 nm of equal prominence. The appearance of a maximum at 360 nm in F3 is indicative of the presence of flavonol compounds. Finally, the transition from F3 to F4 was exemplified by a sharp increase in a spectral band at 281 nm, signifying the likely presence of phenolic acids, flavan-3-ols and their derivatives. The spectral information served as a guide for further identification of the blackberry phenolics via HPLC–ESI–MS analysis.
Fig.1
Spectral characteristics of four low-molecular-weight (LMW) fractions (F1 thru F4) isolated by Sephadex LH-20 column chromatography from an acetonic crude extract of the blackberry variety ‘Ouachita’. The spectral curves are denoted as, F1  ; F2
; F2  ; F3
; F3  ; and F4
  ).
).
Phenolic acids are an important class of phenolics present in blackberries, and comprised 2.71±0.32 mg/100 g f.w. in ‘Ouachita’. Three dominant phenolic acids, namely protocatechuic acid hexoside, a p-coumaric acid derivative, and hydroxybenzoic acid hexoside (i.e., F1-2, F1-4, and F1-5), were isolated and identified in F1 (Table 2). They were present at 0.55±0.03, 0.55±0.1, and 0.35±0.03 mg/100 g f.w., respectively. Additional phenolic acids identified, but in smaller quantities, were gallic acid hexoside, a caffeic acid derivative, ferulic acid hexoside, and sinapic acid hexoside. Apropos phenolic acids: after alkaline hydrolysis of the ‘Ouachita’ crude extract, no soluble esterified phenolic acids were released according to our HPLC data. On the other hand, Mertz et al. [30] did find small quantities of liberated caffeic, ferulic and p-coumaric acids after hydrolysis in two blackberry species from South America, namely Rubus glaucus and Rubus adenotrichus. After acid hydrolysis of the crude extract, three phenolic acids, namely gallic, protocatechuic, and p-coumaric acid, were liberated from their glycoside-bound forms in this study (Table 3). Compared with existing literature [30–32], this research shows an improved characterization and identification of more phenolic acid species in blackberry. Trace quantities of anthocyanins, including cyanidin-3-O-glucoside and cyanindin-3-O-xyloside, were also found in F1.
Table 2
Identification of phenolic compounds isolated in four LMW fractions by Sephadex LH-20 column chromatography of a crude phenolic extract from ‘Ouachita’ blackberries
| Peak ID | tR (min)b | UVmax (nm) | [M–H]– (m/z) | MS2(m/z)c | Tentative Identificationd |
| F1-1 | 3.981 | 280 | 331 | 169, 93 | gallic acid hexoside |
| F1-2 | 4.63 | 260 | 315 | 195, 153, 113, 109 | protocatechuic acid hexoside |
| F1-3 | 5.612 | 368 | 144, 119, 113, 89 | unknown | |
| F1-4 | 6.453 | 300 | 343 | 163, 119, 89 | p-coumaric acid derivative |
| F1-5 | 7.00 | 300 | 300 | 239, 179, 137, 119, 89 | hydroxybenzoic acid-hexoside |
| F1-6 | 9.3 | 310 | 387 | 207, 163, 119, 89 | p-coumaric acid derivative |
| F1-7 | 10.72 | 300 | 403 | 329, 223, 167, 119, 89 | vanillic acid derivative |
| F1-8 | 12.324 | 520 | 447 | 285 | cyanidin-3-O-glucoside |
| F1-9 | 12.9 | 310 | 325 | 145, 163, 119 | p-coumaric acid hexoside isomer |
| F1-10 | 13.54 | 310 | 325 | 145, 163 | p-coumaric acid hexoside isomer |
| F1-11 | 14.256 | 320 | 355 | 193, 175, 149, 134 | ferulic acid-O-hexoside |
| F1-12 | 14.8 | 300 | 385 | 223, 205, 190, 179 | sinapic acid hexoside |
| F1-13 | 15.4 | 320 | 537 | 341, 179 | caffeic acid derivative |
| F1-14 | 18.025 | 520 | 417 | 285, 125, 147 | cyanidin-3-O-xyloside |
| F1-15 | 21.891 | 200 | 147 | 103 | trans-cinnamic acid |
| F2-1 | 9.294 | 520 | 463 | 283, 301, 163 | delphinidin-3-O-glucoside |
| F2-2 | 12.23 | 520 | 447 | 284, 125 | cyanidin-3-O-glucoside |
| F2-3 | 14.19 | 520 | 465 | 329, 166, 149, 125 | malvidin-3-O-glucoside |
| F2-4 | 15.335 | 520 | 447 | 284, 125 | cyanidin-3-O-hexoside |
| F2-5 | 16.18 | 520 | 417 | 285 | cyanidin-3-O-arabinoside |
| F2-6 | 17.05 | 435 | 285, 241 | unknown | |
| F2-7 | 17.56 | 520 | 417 | 285, 147, 125 | cyanidin-3-O-xyloside |
| F2-8 | 18.881 | 520 | 489 | 324, 285, 125 | cyanidin 3-O-acetoylglucoside |
| F2-9 | 20.36 | 520 | 591 | 447, 285 | cyanidin-3-O-dioxalylglucoside |
| F2-10 | 21.8 | 255/355 | 477 | 315 | isorhamnetin-3-O-glucoside |
| F2-11 | 22.13 | 256/370 | 609 | 301 | quercetin-3-O-rutinoside |
| F2-12 | 24.377 | 255/355 | 593 | 285 | kaempferol-3-O-rutinoside |
| F2-13 | 24.809 | 255/355 | 463 | 301 | quercetin-3-O-glucoside |
| F2-14 | 25.34 | 255/355 | 447 | 284 | kaempferol-3-O-galactoside |
| F3-1 | 13.307 | 255/355 | 447 | 284 | cyanidin-3-O-hexoside |
| F3-2 | 14.989 | 520 | 465 | 329,285, 241 | malvidin-3-O-glucoside |
| F3-3 | 16.273 | 280 | 289 | 245,205 | (+)-catechin |
| F3-4 | 17.477 | 520 | 417 | 285 | cyanidin-3-O-xyloside |
| F3-5 | 18.37 | 435 | 285, 241 | unknown | |
| F3-6 | 19.233 | 520 | 489 | 324, 285, 125 | cyanidin-3-O-acetylgalactoside |
| F3-7 | 20.318 | 520 | 447 | 285 | cyanidin derivative |
| F3-8 | 20.622 | 520 | 591 | 447, 285 | cyanidin-3-O-dioxalylglucoside |
| F3-9 | 22.985 | 255/355 | 433 | 301 | quercetin-3-O-pentoside isomer |
| F3-10 | 23.466 | 255/355 | 609 | 301 | quercetin-3-O-rutinoside |
| F3-11 | 24.219 | 255/355 | 463 | 301 | quercetin-3-O-galactoside |
| F3-12 | 24.777 | 255/355 | 463 | 301 | quercetin-3-O-glucoside |
| Peak ID | tR (min)b | UVmax (nm) | [M–H]– (m/z) | MS2(m/z)c | Tentative Identificationd |
| F3-13 | 26.273 | 255/355 | 433 | 301, 179, 151 | quercetin3-O-pentoside isomer |
| F3-14 | 26.721 | 255/355 | 505 | 463, 301 | quercetin-3-O-glucoside-malonate |
| F3-15 | 27.057 | 255/355 | 447 | 315,300 | quercetin-3-O-acetylglucoside |
| F3-16 | 27.579 | 323 | 253, 223 | unknown | |
| F4-1 | 7.204 | 280 | 739 | 587, 449, 425, 407, 289 | (epi)catechin-4,8′-(epi)catechin hexoside isomer |
| F4-2 | 9.347 | 280 | 739 | 587, 449, 425, 289 | (epi)catechin-4,8′-(epi)catechin hexoside isomer |
| F4-3 | 11.945 | 280 | 723 | 597, 525, 433, 407, 289 | proanthocyanidin dimer |
| F4-4 | 12.973 | 520 | 447 | 285, 125 | cyanidin-3-O-glucoside |
| F4-5 | 13.566 | 280 | 577 | 425, 407, 289 | procyanidin B-type dimer |
| F4-6 | 14.386 | 520 | 465 | 329, 285, 241 | malvidin-3-O-glucoside |
| F4-7 | 15.332 | 280 | 561 | 435, 425, 407, 289 | propelargonidins B-type dimer |
| F4-8 | 15.59 | 280 | 577 | 425, 289, 245 | procyanidin B-type dimer |
| F4-9 | 16.724 | 520 | 417 | 285, 125 | cyanidin-3-O-arabinoside |
| F4-10 | 17.632 | 520 | 489 | 285, 125 | cyanidin 3-O-acetylgalactoside |
| F4-11 | 20.265 | 255 | 433 | 301 | ellagic acid pentoside |
| F4-12 | 21.095 | 255/355 | 491 | 315 | isorhamnetin derivative |
| F4-13 | 21.828 | 255 | 300 | 257, 284, 229 | ellagic acid |
| F4-14 | 22.745 | 255/355 | 301 | 179, 151, 121 | quercetin derivative |
| F4-15 | 24.363 | 255/355 | 463 | 301 | quercetin-3-O-glucoside |
aF1 to F4 refers to fraction 1 to 4. The F2 peak numbers listed here correspond to the separated compounds annotated in Fig. 2A. btR = retention time of eluted compounds from the fused-core C18 column. cThe most abundant ions observed in the mass spectra are indicated in bold; quinone methide fission diagnostic ions are underlined. dPhenolic compounds identification were achieved using UV spectra and tR mapping and fragmentation pattern comparison to those to relevant literature.
Table 3
Tentative identification of glycoside-bound phenolic compounds in blackberry crude phenolic extracts
| Peak No. | tR(min)a | UVmax(nm) | [M–H]– (m/z) | MS2(m/z)b | Tentative Identificationc |
| 1 | 6.055 | 280 | 169 | 125 | gallic acid |
| 2 | 10.408 | 260 | 153 | 109 | protocatechuic acid isomer |
| 3 | 13.727 | 260 | 137 | 108, 92 | protocatechuic aldehyde |
| 4 | 15.848 | 260 | 153 | 109, 95 | protocatechuic acid isomer |
| 5 | 17.981 | 280 | 289 | 179, 151, 109, 125 | (+)-catechin |
| 6 | 23.436 | 274 | 341 | 183, 153, 139 | syringic acid derivative |
| 7 | 24.688 | 310 | 163 | 119, 93 | p-coumaric acid |
| 8 | 25.605 | 255 | 300 | 284, 257, 229, 185 | ellagic acid |
| 9 | 32.236 | 255/355 | 315 | 300, 271, 256, 151 | isorhamnetin |
| 10 | 34.587 | 255/355 | 469 | 315, 300, 151 | isorhamnetin derivative |
| 11 | 35.95 | 491 | 473, 315, 179, 149 | unknown | |
| 12 | 39.387 | 255/355 | 301 | 273, 229, 179, 151, 121, 107 | quercetin |
atR = retention time of eluted compounds from a Luna C18(2) analytical column (4.6×250 mm i.d., 5 μm particle size; Phenomenex). bThe most abundant ions observed in the mass spectra are indicated in bold. cPhenolic compound identifications were achieved using UV spectral data, tR mapping of commercial standards, and fragmentation pattern comparisons to those reported in relevant literature.
Fig.2
Reversed-phase HPLC chromatograms at λ= 255 nm of (A) fraction 2; and (B) the high-molecular-weight (HMW) fraction isolated by Sephadex LH-20 column chromatography from a crude extract of the blackberry variety ‘Ouachita’.
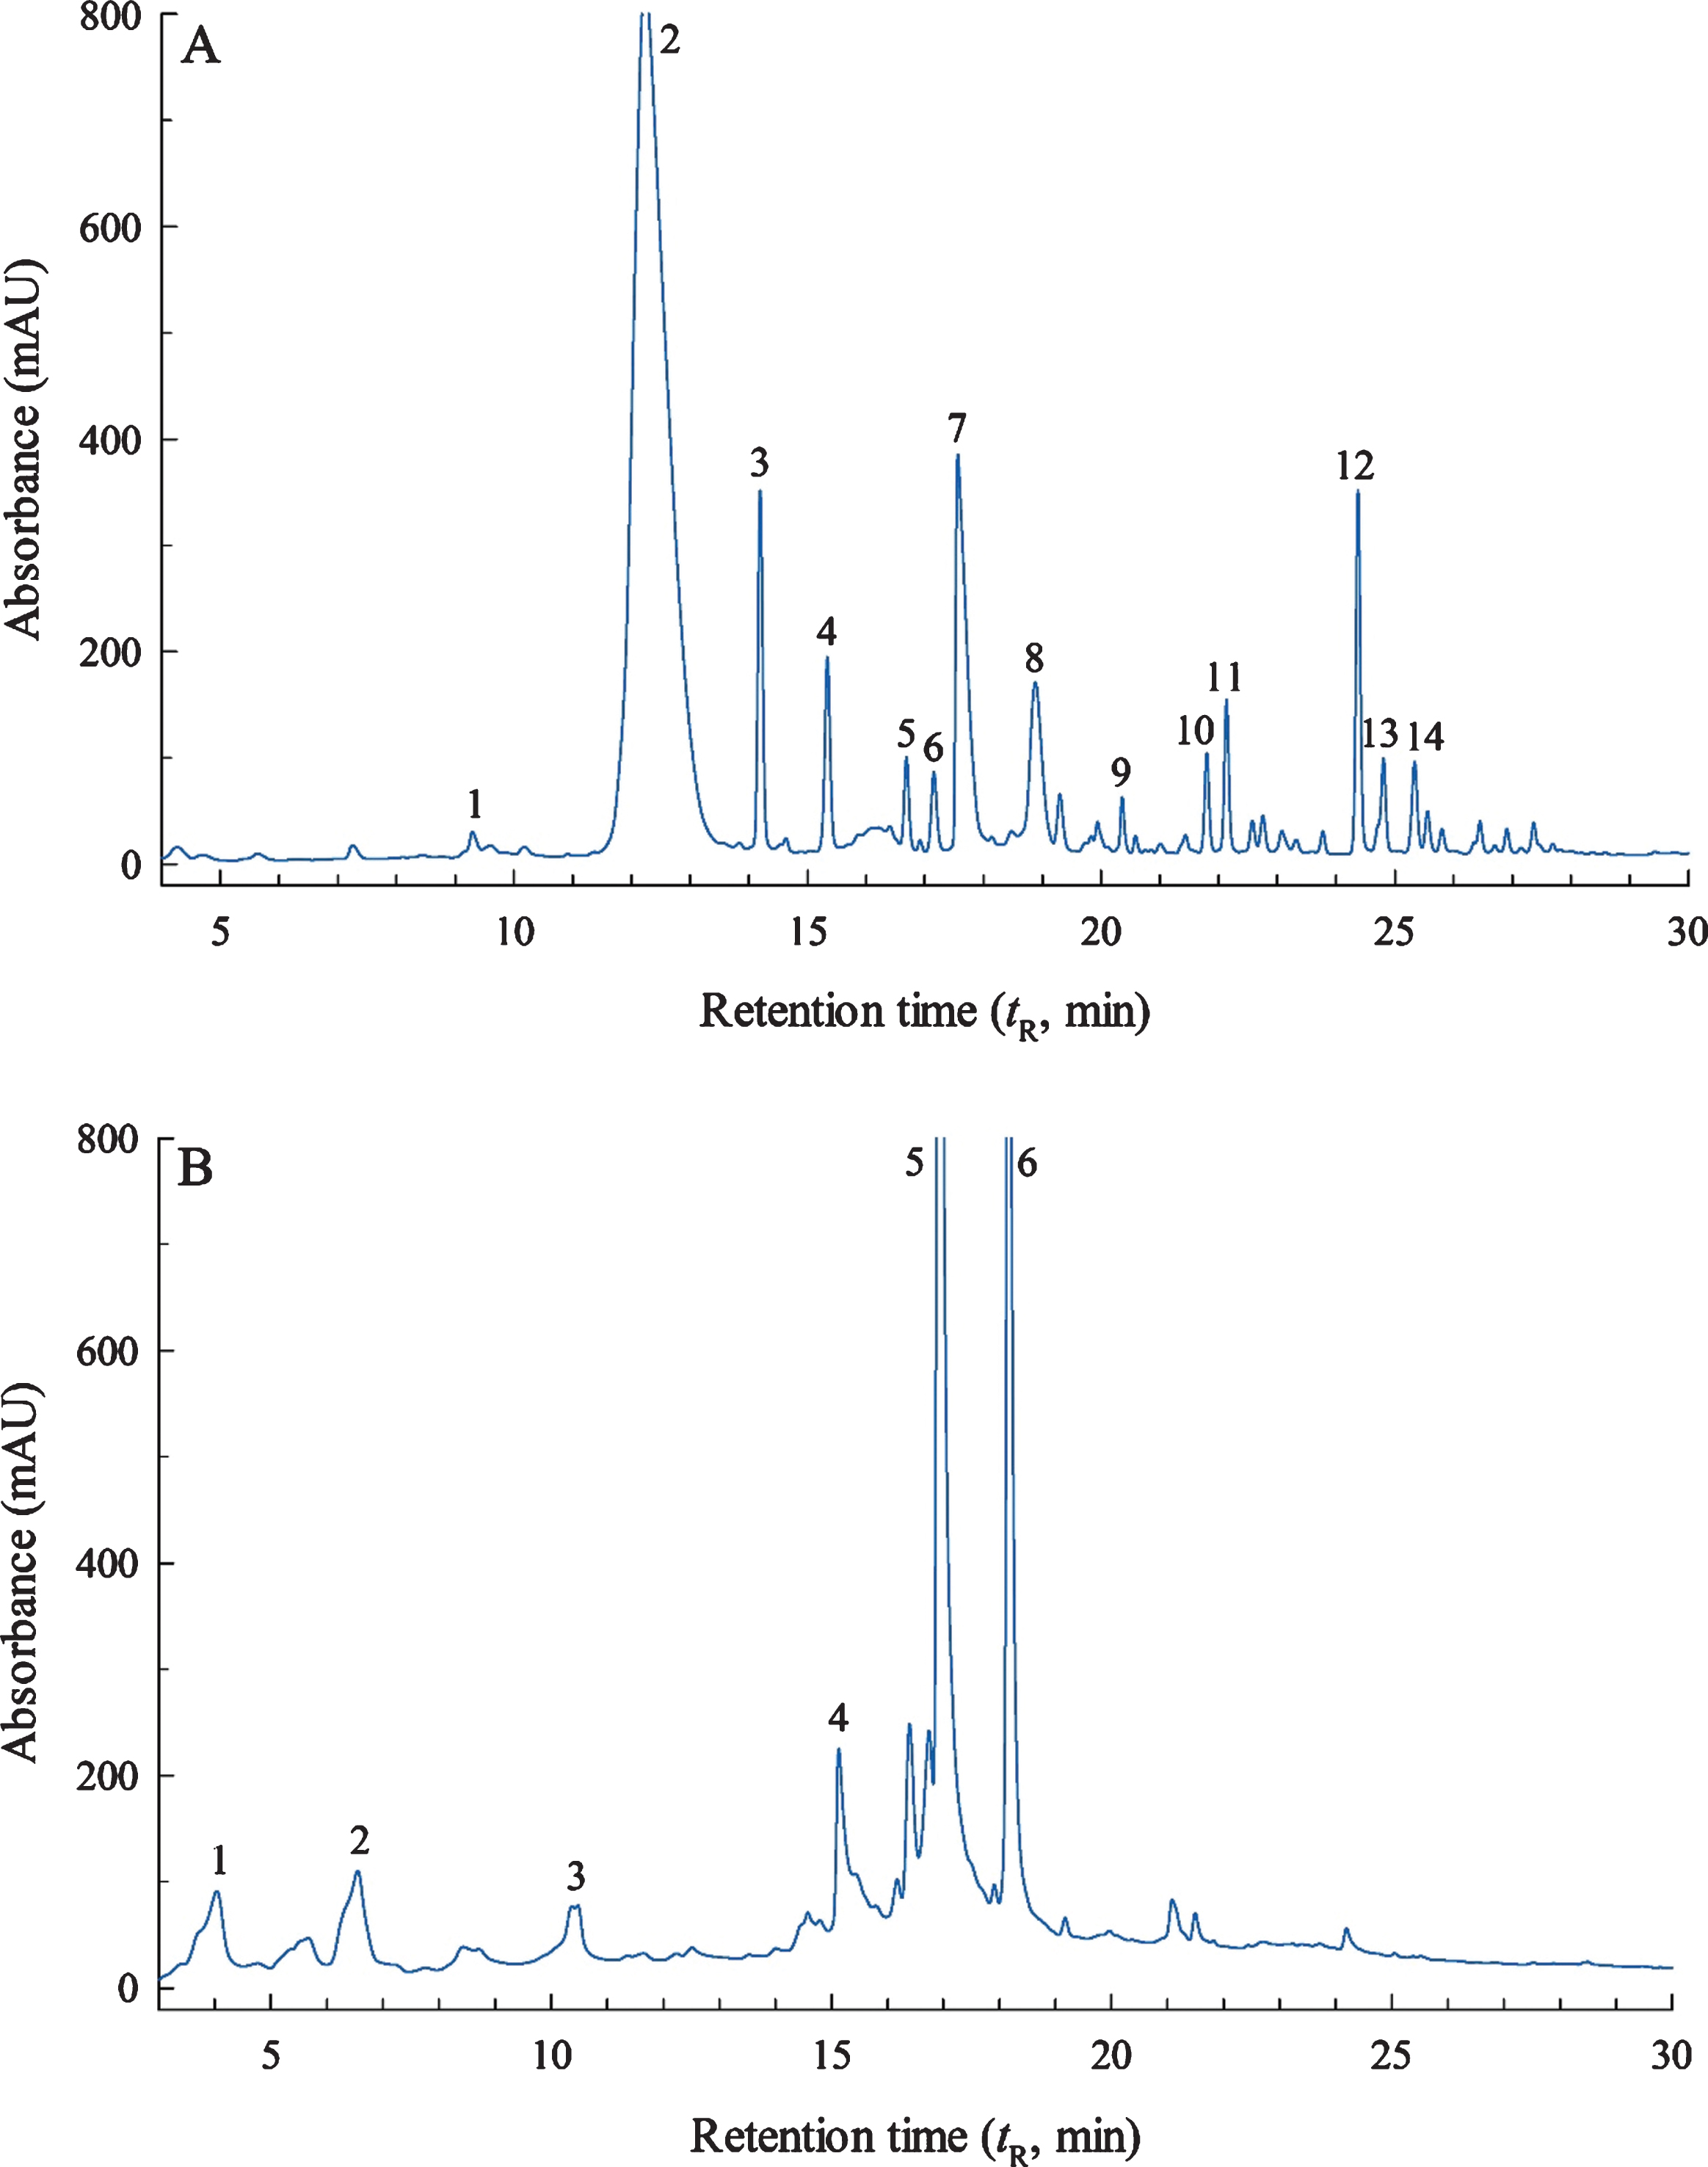
Chromatographed phenolics from F2, as monitored by UV diode array detection at a λ of 255 nm, are depicted in Fig. 2A, and these were identified by HPLC–ESI–MS analysis (Table 2). F2 possessed the lion’s share of the anthocyanins present in the blackberry extract, as confirmed by spectral data (Fig. 1) and HPLC–ESI–MS analysis (Table 2). Cyanidin-3-O-glucoside was the dominant anthocyanin present (F2-2; 99.9±2.2 mg/100 g f.w.), which is consistent with previous blackberry research [10, 30–34]. Other cyanidin glycosidic derivatives, tentatively identified by matching their visible spectra, m/z of [M–H]–, and MS2 fragmentation patterns, were cyanidin-3-O-arabinoside, cyanidin-3-O-xyloside, cyanidin-3-O-dioxalylglucoside, cyanidin 3-O-acetoylglucoside, and cyanidin-3-O-glucoside (Table 2). The high-resolution MS/MS assignments of separated blackberry phenolics by Kolniak-Ostek et al. [31] were most helpful. Even though all blackberry varieties contain anthocyanins, the literature indicates that they can be different both quantitatively as well as qualitatively. In the present work, delphinidin-3-O-glucoside and malvidin-3-O-glucoside were also elucidated, and their occurrence has not been reported before in major U.S. blackberry cultivars. UV spectra of F2 also indicated the presence of flavonol species (F2-10 thru F2-14), which were later confirmed by HPLC–ESI–MS analysis. The dominant flavonol was kaempferol-3-O-rutinoside (F2-12), but quercetin-3-O-rutinoside and quercetin-3-O-glucoside were also tentatively identified. Mass spectral data for these latter derivatives showed an intensive fragment ion at m/z 301 as well as other important ions at m/z 273, 229, 179, and 151, which correspond to literature data characteristic of quercetin derivatives. The quercetin aglycone was not found in F2 nor F3, but was detected in the crude ‘Ouachita’ extract after it had been subjected to acid hydrolysis. In other words, quercetin was liberated from glycoside-bound phenolics (Table 2). Ellagic acid also shares a major fragment ion at m/z 301, but does not give fragment ions at m/z 179 and 151 in its MS2 spectrum, like that of quercetin and its derivatives [35]. Consequently, misidentification of a quercetin species with that of an ellagic acid derivative is avoided. Isorhamnetin-3-O-glucoside was also found in F2, but its aglycone was noted only after acid hydrolysis of the crude extract, indicating that it was a component of the glycoside-bound phenolics.
F3 was dominated by flavonols, but traces of anthocyanins were also present. Just like that of F2, the spectral band at 360 nm confirmed the presence of flavonol species. This is consistent with the literature that indicates blackberries possess marked quantities of flavonols, whose profiles are chiefly made up of quercetin linked to differing sugar moieties [36]. In this study, HPLC quantitative data revealed that flavonols comprise ∼15% (i.e., 29.1±1.8 mg/100 g f.w.) of the total phenolics in blackberries, with quercetin derivatives being the predominant constituents. The major phenolic in F3 was quercetin-3-O-galactoside (F3-11; 7.06±0.14 mg/100 g f.w.). Other flavonols tentatively identified by HPLC–ESI–MS included quercetin-3-O-(6"-(3-hydroxy-3-methylglutaroyl)-β-galactoside, quercetin-3-O-rutinoside, and quercetin-3-O-glucoside; all were present at ∼4 mg/100 g f.w. The high-resolution MS/MS assignments of blackberry phenolics by Kolniak-Ostek et al. [31] and the quercetin derivative identifications of Cho et al. [37] were most helpful. Minor flavonols, namely quercetin-3-O-pentoside, quercetin-3-O-acetylglucoside, and quercetin-3-O-glucoside malonate, were also detected. These findings are comparable to those reported for selected Southeastern blackberry cultivars, including ‘Kiowa’ and ‘Navaho’ [37], except for the quercetin-3-O-glucoside acylated with malonic acid, which is noted in a Southeastern variety for the first time. The total flavonols content of U.S. Southeastern blackberry varieties is roughly twice that of Northwestern cultivars [28, 38]. Noteworthy is that epidemiological studies have revealed a significant reduction in cardiovascular disease mortality and cancer incidence from the consumption of quercetin when compared to other types of flavonols [39].
Flavan-3-ols are an important class of flavonoids present in blackberries, and were the largest phenolic class after the anthocyanins; they were foremost in F4. Flavan-3-ols accounted for ∼25% of the total phenolics determined by HPLC in this study. Propelargonidin B-type dimer was predominant (31.8±2.3 mg/100 g f.w.) in the ‘Ouachita’ cultivar. Though propelargonidin B-type dimer has been detected in strawberries [40], to the best of our knowledge this is the first reporting of this specific proanthocyanidin in blackberries; moreover, it was present at a substantial quantity as indicated above. It is noteworthy that both extrinsic and intrinsic factors can influence the qualitative profile of blackberry phenolics, as well as their concentrations, and these include the choice of cultivar, degree of maturity, growing conditions, time of harvest, and storage conditions [11]. The phenolic constituents of blackberries can vary markedly even when subjected to identical growing conditions and harvested from the same location [28]. It is possible that the growing conditions of South Georgia may play a role in the unanticipated occurrence of propelargonidin B-type dimer in ‘Ouachita’ blackberries. This dimer yielded a molecular ion [M –H]– at m/z 561 in the negative-ion mode. The molecular ion gave fragment ions in MS2 at m/z 435 and 289 through heterocyclic ring and quinone methide fission, respectively. The heterocyclic ring of the flavan-3-ol unit also underwent retro-Diels-Alder cleavage and yielded a further ion at m/z 425, which then fragmented to m/z 407, resulting from the loss of a water molecule [40]. Furthermore, two (epi)catechin-4,8′-(epi)catechin hexoside isomers were noted based on their molecular ion [M –H]– at m/z 739 with MS2 fragments at m/z 587, 449, 425 and 289. Two procyanidin B-type dimers were also determined by the observed [M –H]– at m/z 577 and characteristic fragment ions at m/z 425 and 289, based on the fragmentation mechanisms as described above for the propelargonidin B-type dimer. An ellagic acid species, an ellagic acid pentoside, a proanthocyanidin dimer, and a few anthocyanins and flavonols were also detected in F4.
Procyanidin-rich foods with marked antioxidant activity have been reported to bestow healthful benefits, and we speculate this to be so, especially for those with procyanidins of lesser degrees of polymerization. Using human intestinal epithelial Caco-2 cells, Deprez et al. [41] showed that radiolabeled LMW proanthocyanidins (i.e., dimers and trimers) were more easily transported across a Caco-2 monolayer than those with extended polymerization. In fact, (+)-catechin and proanthocyanidin dimers and trimers had similar permeability coefficients. Thus, the quantities of flavan-3-ols in blackberries, as reported in this work, may potentially contribute to one’s health when consumed as part of a daily diet.
3.3Characterization of ellagitannins using HPLC–ESI–MS and MALDI–TOF–MS
Blackberries possess a considerable amount of ellagitannins. In this work, all ellagitannins (10.4±0.3 mg ellagic acid eq./100 g f.w.) were isolated in the HMW fraction from the ‘Ouachita’ crude extract after Sephadex LH-20 column chromatography. The chromatogram of the separated ellagitannins in the HMW fraction, as monitored by UV diode array detection at a λ of 255 nm, are depicted in Fig. 2B, and these were identified by HPLC–ESI–MS analysis (Table 4). Lambertianin C isomer was found to be the most abundant at 5.47±0.41 mg/100 g f.w. Chemically speaking, the basic unit of an ellagitannin comprises a central glucose molecule esterified with hexahydroxydiphenic acid or ellagic acid. These units can be further esterified generating highly polymerized forms with large molecular masses. Hence, MALDI–TOF–MS is a commonly employed technique to elucidate the structure of these polymers [13, 14]. Unlike HPLC–ESI–MS, MALDI–TOF–MS does not provide fragmentation ions and tR information; so, elucidating the chemical structure of ellagitannins is carried out by assessing the degree of hydroxylation and presence of galloylation.
Table 4
Identification of ellagitannins in the HMW fraction of the ‘Ouachita’ cultivar using HPLC–ESI–MS and MALDI–TOF–MS
| Peak No.a | tR (min)b | ESI–MS [M –H]– m/z (fragment ions) | MALDI–TOF–MS | Tentative Identificationc [M + Na]+ (m/z) |
| 1 | 4 | 783 (481, 301) | 807.1 | pedunculagin isomer |
| 2 | 6.5 | 783 (481, 301) | 807.1 | pedunculagin isomer |
| 3 | 10.4 | 633 (301) | – | galloyl-HHDP glucose isomer |
| 4 | 15 | 933 (1869, 1568, 1264, 633, 301) | 957.1 | castalagin |
| 5 | 17 | [1401]–2 (1235, 935, 763, 633, 301) | 2827.3 | lambertianin Cd |
| 6 | 18 | 1869(1567, 1250, 1235, 934, 633, 301) | 1893.3 | sanguiin H-6 |
| 7 | – | – | 975.1 | tris-galloyl HHDP glucose isomer |
| 8 | – | – | 1127.1 | 1galloyl-bis-HHDP glucopyranose + 1gallate |
| 9 | – | – | 1143.1 | 1bis-HHDP glucopyranose + 2gallates |
| 10 | – | – | 1741.2 | degalloyated sanguiin H-6 |
| 11 | – | – | 1910.2 | 1bis-HHDP glucopyranose + 1galloyl-bis-HHDP glucopyranose + 1gallate |
aThe peak numbers listed here correspond to the separated compounds annotated in Fig. 2B. btR = retention times of eluted compounds from a fused-core Kinetex® XB-C18 column (4.6×150 mm i.d., 2.6 μm particle size, 100 Å; Phenomenex) of an HPLC system coupled with ESI–MS. cPhenolic compounds separated by HPLC–ESI–TOF–MS were identified using UV spectra spectral data, tR mapping of commercial standards, and fragmentation pattern comparisons to those of relevant literature. The structure of compounds identified by MALDI–TOF–MS was determined by calculating the theoretical or calculated monoisotopic mass based on the equation described in the Materials and Methods section. Abbreviations: HHDP, hexahydroxydiphenoyl. dLambertianin C is presented as an isomer with an m/z of 1401, which is doubly charged according to the HPLC–ESI–TOF–MS data.
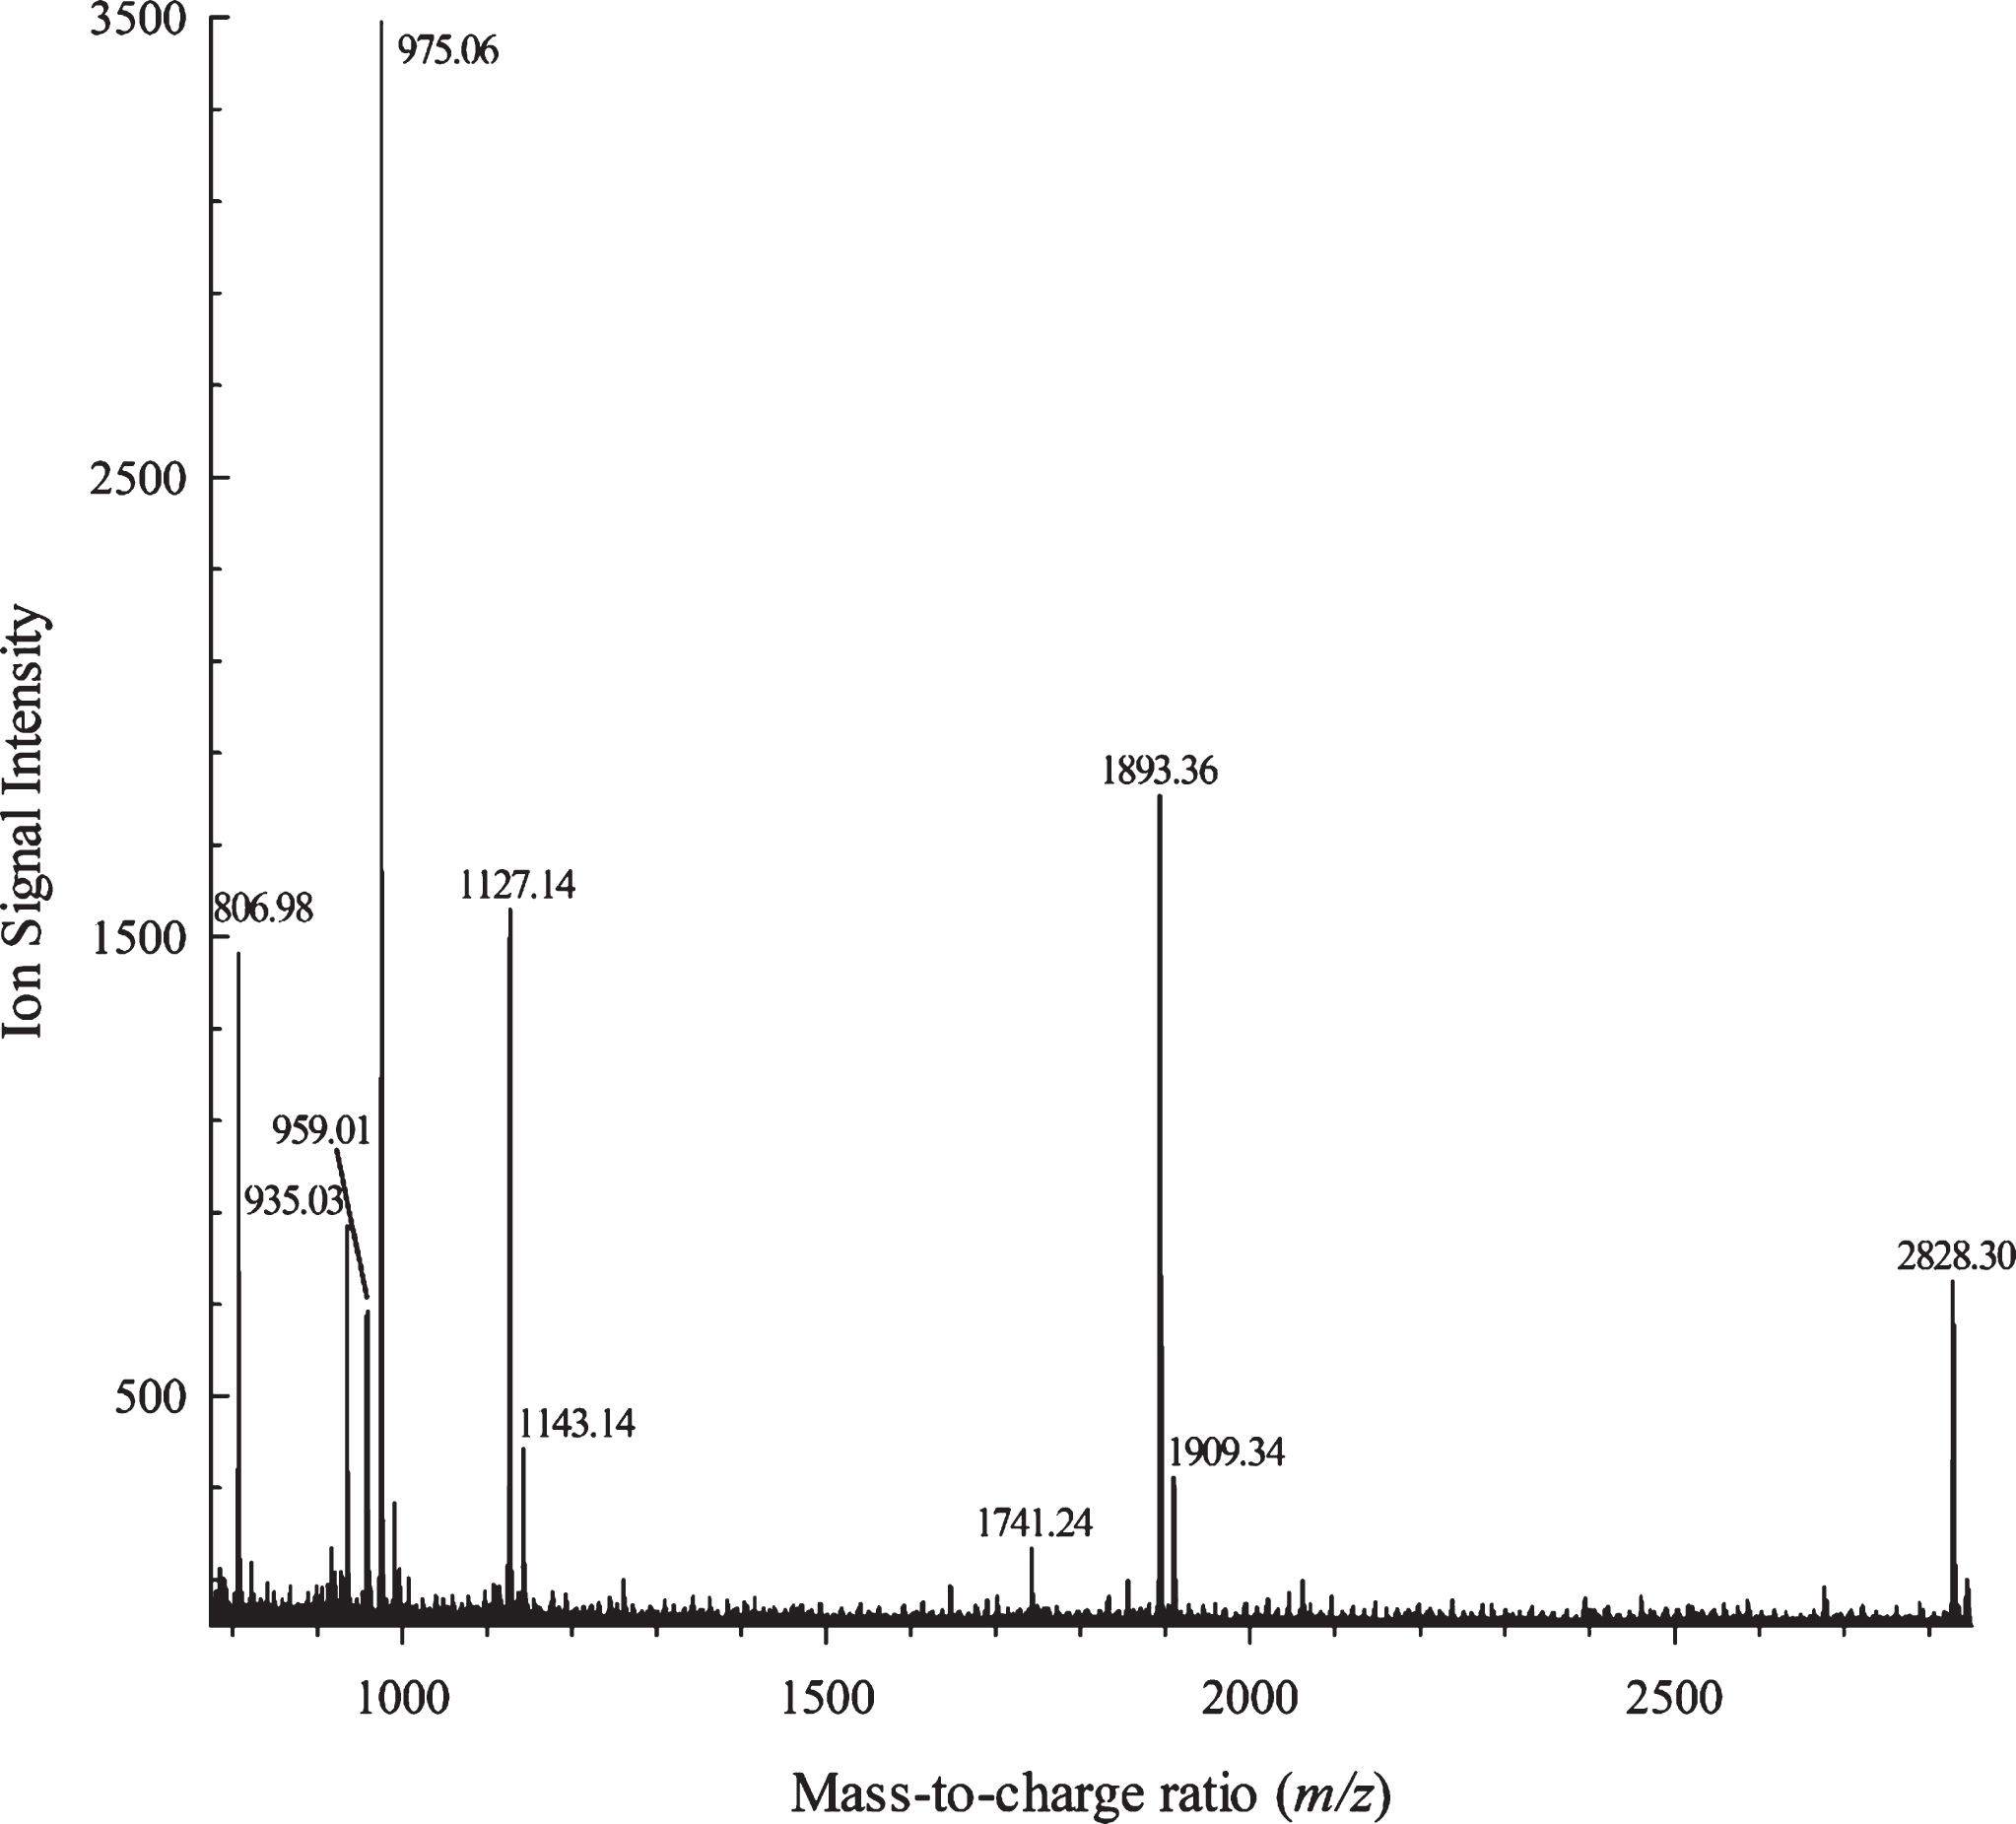
As shown in Table 4, most ellagitannins identified by HPLC–ESI–MS were also observed by MALDI–TOF–MS. Key peaks from the MALDI–TOF–MS used for identification were sodium adducts of the ellagitannins, and ranged from 807.1 to 2827.3 u. Compounds identified by both MS techniques included two pedunculagin isomers (1 and 2), castalagin (4), lambertianin C(5), and sanguin H-6 (6). All of these ellagitannins were reported in an Arkansas cultivar ‘Apache’ by Hager et al. [15]. When pedunculagin is galloylated via esterification, it gives galloyl-bis-HHDP glucopyranose with a molecular mass of 935 u; this ellagitannin was identified in the ‘Apache’ blackberry cultivar by Hager et al. [15], but not in ‘Ouachita’ here. Because of enzymatic activity, galloyl-bis-HHDP glucopyranose can be deprotonated, resulting in an open-ring glucoside structure, known as castalagin with an m/z of 933. Compound 4 in this work was determined to be castalagin by both MS techniques. Compound 5 was assigned as lambertianin C: it exhibited a doubly charged compound at m/z 1401 due to the detection range limit of the ESI–MS unit; furthermore, it appeared as a sodium adduct ion of [M + Na]+ at m/z 2827 in MALDI–TOF–MS.
Five additional compounds (7 thru 11) were identified only by MALDI–TOF–MS. Compound 7 gave an intense positive-ion signal atm/z 975 (Fig. 3), which was also observed as an ‘unidentified phenolic’ in the Southeastern blackberry cultivar of ‘Apache’ by Hager et al. [15]. Their ESI–MS data showed fragmentation ions for this compound at m/z 783 (di-HHDPglucose) and m/z 301 (ellagic acid), which are both characteristic of ellagitannins [15]. A few years later, Dutra et al. [42] reported this compound and its MS fragmentation patterns (i.e.,m/z 783 and 301, which correspond to bis-HHDP-glucopyranose and ellagic acid ions, respectively), and identified it in geopropolis as tris-galloyl HHDP glucose isomer. The fragment ion detected at m/z 783 is representative of [M–H–168]–, indicating the loss of a galloyl residue, which was linked to the HHDP moiety via a C–C bond [42]. Hassimotto and Lajolo [43] also detected this particular ellagitannin in Brazilian blackberries. Thus, compound 7 has been tentatively identified here as being a tris-galloyl HHDP glucose isomer. The chemical structures of compounds 8 thru 11 were assigned based on the calculation of monoisotopic masses using the equation given in the Materials and Methods section. Compound 8 with an [M + Na]+ ion at m/z 1127.1 was assigned as the sodium adduct of galloyl-bis-HHDP glucopyranose, possessing an additional gallate moiety. Compound 9 at m/z 1143.1 was tentatively identified as having two gallate groups attached to a bis-HHDP glucopyranose with a molecular mass of 1120.1 u. The positive ion at m/z 1741.2 for compound 10 was determined to be the sodium adduct of degalloylated sanguiin H-6, with the exact molecular mass of 1719 u. Compound 11 appeared as a sodium adduct for a dimer comprising bis-HHDP glucopyranose and galloyl-bis-HHDP glucopyranose with an additional gallate residue attached.
Fig.3
MALDI–TOF–MS of the high-molecular-weight (HMW) fraction isolated by Sephadex LH-20 column chromatography from an acetonic crude extract of the blackberry variety ‘Ouachita’.
Though major ellagitannins including lambertianin C and sanguiin H-6 are always present in blackberries regardless of the variety in question [36], ellagitannin profiles do somewhat differ amongst cultivars. This study compared and showed distinct profiles of identified ellagitannins in three U.S. Southeastern blackberry varieties by MALDI–TOF–MS (Table 5). Lambertianin D was detected in ‘Kiowa’, but not so in the other two varieties investigated. It was also found by Hager et al. [15] in the ‘Apache’ cultivar, released from the University of Arkansas breeding program. Sanguiin H-10 at m/z 1591.5 was identified in all cultivars, except ‘Ouachita’. Finally, pedunculagin (also known as 4,6-bis-HHDP glucopyranose) was present in all cultivars, except ‘Kiowa’. The results of Table 5 clearly illustrate that there are qualitative differences in the ellagitannin composition of Southeastern blackberry cultivars, even when all were an erect type and harvested from the same farm in Wray, GA. It is unfortunate that comparisons cannot be made between the ellagitannin profiles of U.S. Southeastern blackberry varieties with those of the Pacific Northwestern, as no reports exist.
Table 5
Observation of major ellagitannins in ‘Navaho’, ‘Kiowa’, and ‘Ouachita’ cultivars using MALDI–TOF–MSa
| Identified Ellagitannins | [M + Na]+b | ‘Navaho’ | ‘Kiowa’ | ‘Ouachita’ |
| pedunculagin | 807.1 | × | × | |
| tris-galloyl HHDP glucose isomer | 975.1 | × | × | × |
| 1galloyl-bis-HHDP glucopyranose+1gallatec | 1127.1 | × | × | × |
| sanguiin H-10 | 1591.5 | × | × | |
| degalloyated sanguiin H-6 | 1741.5 | × | × | × |
| sanguiin H-6 | 1893.3 | × | × | × |
| 2 galloyl-bis-HHDP glucose + 1 1′-galloyl-HHDPglucopyranosed | 2525.0 | × | ||
| lambertianin C | 2827.3 | × | × | × |
| lambertianin D | 3762.9 | × |
aMALDI–TOF–MS, matrix-assisted laser desorption/ionization–time of flight–mass spectrometer.× is a qualitative measure and indicates the presence of this compound. b[M + Na]+, sodium cation adduct of the hydrolyzable tannin’s molecular ion. cIdentified as1 galloyl-bis-HHDP glucopyranose with a gallate moiety attached to it. dIdentified as lambertianin C with the loss of a HHDP moiety.
4Conclusions
This study offers a systematic profiling of phenolics in U.S Southeastern erect-type blackberry cultivars grown in Georgia, which showed distinct profiles from those of Pacific Northwestern cultivars. The major phenolic classes in all three cultivars investigated displayed similar contents quantitatively to those reported in Northwestern cultivars, whose total phenolics contents; however, were twice the value reported here. ‘Navaho’, featuring a late ripening time, exhibited a greater phenolics content. The study also provided for the first time evidence of the presence of new phenolic compounds in the ‘Ouachita’ cultivar. These included delphinidin-3-O-glucoside, malvidin-3-O-glucoside, quercetin-3-O-glucoside malonate, and propelargonidin B-type dimer. The detection of the propelargonidin B-type dimer also showed that the flavan-3-ols of blackberries are not limited to (epi)catechin-based compounds in contrast to previous studies. The abundance of flavan-3-ol dimers may be biologically significant towards human health. A marked quantity of flavonols, roughly twice that quantitated in Northwestern trailing cultivars, were determined. MALDI–TOF–MS was able to characterize additional ellagitannin compounds, which were not detected in the chromatograms by HPLC–ESI–MS. In addition, this study reported distinct ellagitannin compositions amongst the three cultivars based on MALDI–TOF–MS data. Blackberry cultivars released by the University of Arkansas breeding program have greatly contributed to the economy of the small fruit industry in Georgia, which was the impetus for this study. It is hoped that the findings from this research can help to reduce the knowledge gap pertaining to the antioxidant phenolic constituents of blackberries grown in the U.S. Southeast.
Conflict of interest
The authors have no conflict of interest to report.
Funding
Seed grant funding for this research from the Southern Region Small Fruit Consortium is acknowledged.
Acknowledgments
The authors are extremely grateful to Mr. Chris Paulk of Jacob W. Paulk Farms, Inc. (Wray, GA) for supplying the blackberries for the study. Use of the Proteomics and Mass Spectrometry (PAMS) core facility under the direction of Dr. Dennis Phillips of UGA’s Department of Chemistry is greatly appreciated.
References
[1] | Pandey KB , Rizvi SI . Plant polyphenols as dietary antioxidants in human health and disease. Oxidative Medicine and Cellular Longevity. (2009) ;2: :270–8. |
[2] | Tsao R . Chemistry and biochemistry of dietary polyphenols. Nutrients. (2010) ;2: :1231–46. |
[3] | Wolfe KL , Liu RH . Cellular antioxidant activity (CAA) assay for assessing antioxidants, foods, and dietary supplements. Journal of Agricultural and Food Chemistry. (2007) ;55: :8896–907. |
[4] | Álvarez R , Araya H , Navarro-Lisboa R , Lopez de Dicastillo C . Evaluation of polyphenol content and antioxidant capacity of fruits and vegetables using a modified enzymatic extraction. Food Technology and Biotechnology. (2016) ;54: :462–7. |
[5] | Pellegrini N , Serafini M , Colombi B , Del Rio D , Salvatore S , Bianchi M , et al. Total antioxidant capacity of plant foods, beverages and oils consumed in Italy assessed by three different in vitro assays. The Journal of Nutrition. (2003) ;133: :2812–19. |
[6] | Dai J , Gupte A , Gates L , Mumper RJ . A comprehensive study of anthocyanin-containing extracts from selected blackberry cultivars: Extraction methods, stability, anticancer properties and mechanisms. Food and Chemical Toxicology. (2009) ;47: :837–47. |
[7] | Strik BC , Finn CE . Blackberry production systems – A worldwide perspective. Acta Horticulturae. (2012) ;946: :341–7. |
[8] | Strik BC , Clark JR , Finn CE , Bañados MP . Worldwide production of blackberries. Acta Horticulturae. (2008) ;777: :209–17. |
[9] | Strik BC . Blackberry cultivars and product trends in the Pacific Northwest. Fruit Varieties Journal. (1992) ;46: :202–6. |
[10] | Fan-Chiang H-J , Wrolstad RE . Anthocyanin pigment composition of blackberries. Journal of Food Science. (2005) ;70: :C198–C202. |
[11] | Parr AJ , Bolwell GP . Phenols in the plant and in man. The potential for possible nutritional enhancement of the diet by modifying the phenols content or profile. Journal of the Science of Food and Agriculture. (2000) ;80: :985–1012. |
[12] | Johnston KM , Stern DJ , Waiss AC . _Jr. Separation of flavonoid compounds on Sephadex LH-20. Journal of Chromatography. (1968) ;33: :539–41. |
[13] | Karas M . Matrix-assisted laser desorption ionization MS: A progress report. Biochemical Society Transactions. (1996) ;24: :897–900. |
[14] | Cai Y-Z , Xing J , Sun M , Zhan Z-Q , Corke H . Phenolic antioxidants (hydrolyzable tannins, flavonols, and anthocyanins) identified by LC-ESI-MS and MALDI-QIT-TOF MS from Rosa chinensis flowers. Journal of Agricultural and Food Chemistry. (2005) ;53: :9940–8. |
[15] | Hager TJ , Howard LR , Liyanage R , Lay JO , Prior RL . Ellagitannin composition of blackberry as determined by HPLC-ESI-MS and MALDI-TOF-MS. Journal of Agricultural and Food Chemistry. (2008) ;56: :661–9. |
[16] | Liao X , Greenspan P , Pegg RB . Characterizing the phenolic constituents andantioxidant capacity of Georgia peaches. Food Chemistry. (2019) ;271: :345–53. |
[17] | Amarowicz R , Weidner S . Content of phenolic acids in rye caryopses determined using DAD-HPLC method. Czech Journal of Food Sciences. (2001) ;19: :201–5. |
[18] | Clark JR , Moore JN . ‘Ouachita’ thornless blackberry. HortScience. (2005) ;40: :258–60. |
[19] | Robbins KS , Gong Y , Wells ML , Greenspan P , Pegg RB . Investigation of the antioxidant capacity and phenolic constituents of U.S. pecans. Journal of Functional Foods. (2015) ;15: :11–22. |
[20] | Singleton VL , Rossi JA . Colorimetry of total phenolics with phosphomolybdic-phosphotungstic acid reagents. American Journal of Enology and Viticulture. (1965) ;16: :144–58. |
[21] | Giusti MM , Wrolstad RE . Characterization and measurement of anthocyanins by UV-visible spectroscopy. In: WrolstadRE, AcreeTE, AnH, DeckerEA, PennerMH, ReidDS, et al., editors. Current protocols in food analytical chemistry. Hoboken: John Wiley & Sons; (2001) . p. F1.2.1–13 . |
[22] | Gong Y , Pegg RB . Separation of ellagitannin-rich phenolics from U.S. pecans and Chinese hickory nuts using fused-core HPLC columns and their characterization. Journal of Agricultural and Food Chemistry. (2017) ;65: :5810–20. |
[23] | Ma Y , Kosińska-Cagnazzo A , Kerr WL , Amarowicz R , Swanson RB , Pegg RB . Separation and characterization of soluble esterified and glycoside-bound phenolic compounds in dry-blanched peanut skins by liquid chromatography–electrospray ionization mass spectrometry. Journal of Agricultural and Food Chemistry. (2014) ;62: :11488–504. |
[24] | Moore JN , Clark JR . ‘Navaho’erect thornless blackberry. HortScience. (1989) ;24: :863–5. |
[25] | Leccese A , Bartolini S , Viti R . Total antioxidant capacity and phenolics content in apricot fruits. International Journal of Fruit Science. (2007) ;7: :3–16. |
[26] | Moyer RA , Hummer KE , Finn CE , Frei B , Wrolstad RE . Anthocyanins, phenolics, and antioxidant capacity in diverse small fruits: Vaccinium, Rubus, and Ribes. Journal of Agricultural and Food Chemistry. (2002) ;50: :519–25. |
[27] | Sellappan S , Akoh CC , Krewer G . Phenolic compounds and antioxidant capacity of Georgia-grown blueberries and blackberries. Journal of Agricultural and Food Chemistry. (2002) ;50: :2432–8. |
[28] | Siriwoharn T , Wrolstad RE , Finn CE , Pereira CB . Influence of cultivar, maturity, and sampling on blackberry (Rubus L. hybrids) anthocyanins, polyphenolics, and antioxidant properties. Journal of Agricultural and Food Chemistry. (2004) ;52: :8021–30. |
[29] | Pantelidis GE , Vasilakakis M , Manganaris GA , Diamantidis GR . Antioxidant capacity, phenol, anthocyanin and ascorbic acid contents in raspberries, blackberries, red currants, gooseberries and Cornelian cherries. Food Chemistry. (2007) ;102: :777–83. |
[30] | Mertz C , Cheynier V , Günata Z , Brat P . Analysis of phenolic compounds in two blackberry species (Rubus glaucus and Rubus adenotrichus) by high-performance liquid chromatography with diode array detection and electrospray ion trap mass spectrometry. Journal of Agricultural and Food Chemistry. (2007) ;55: :8616–24. |
[31] | Kolniak-Ostek J , Kucharska AZ , Sokół-Łętowska A , Fecka I . Characterization of phenolic compounds of thorny and thornless blackberries. Journal of Agricultural and Food Chemistry. (2015) ;63: :3012–21. |
[32] | Veberic R , Stampar F , Schmitzer V , Cunja V , Zupan A , Koron D , et al. Changes in the contents of anthocyanins and other compounds in blackberry fruits due to freezing and long-term frozen storage. Journal of Agricultural and Food Chemistry. (2014) ;62: :6926–35. |
[33] | Cuevas-Rodríguez EO , Yousef GG , García-Saucedo PA , López-Medina J , Paredes-López O , Lila MA . Characterization of anthocyanins and proanthocyanidins in wild and domesticated Mexican blackberries (Rubus s). Journal of Agricultural and Food Chemistry. (2010) ;58: :7458–64. |
[34] | Wu X , Prior RL . Systematic identification and characterization of anthocyanins by HPLC-ESI-MS/MS in common foods in the United States: Fruits and berries. Journal of Agricultural and Food Chemistry. (2005) ;53: :2589–99. |
[35] | Mullen W , Yokota T , Lean MEJ , Crozier A . Analysis of ellagitannins and conjugates of ellagic acid and quercetin in raspberry fruits by LC–MSn. Phytochemistry. (2003) ;64: :617–24. |
[36] | Kaume L , Howard LR , Devareddy L . The blackberry fruit: A review on its composition and chemistry, metabolism and bioavailability, and health benefits. Journal of Agricultural and Food Chemistry. (2011) ;60: :5716–27. |
[37] | Cho MJ , Howard LR , Prior RL , Clark JR . Flavonol glycosides and antioxidant capacity of various blackberry and blueberry genotypes determined by high-performance liquid chromatography/mass spectrometry. Journal of the Science of Food and Agriculture. (2005) ;85: :2149–58. |
[38] | Siriwoharn T , Wrolstad RE . Polyphenolic composition of Marion and Evergreen blackberries. Journal of Food Science. (2004) ;69: :FCT233–40. |
[39] | Graf BA , Milbury PE , Blumberg JB . Flavonols, flavones, flavanones, and human health: Epidemiological evidence. Journal of Medicinal Food. (2005) ;8: :281–90. |
[40] | Gu L , Kelm MA , Hammerstone JF , Beecher G , Holden J , Haytowitz D , et al. Screening of foods containing proanthocyanidins and their structural characterization using LC-MS/MS and thiolytic degradation. Journal of Agricultural and Food Chemistry. (2003) ;51: :7513–21. |
[41] | Deprez S , Mila I , Huneau J-F , Tome D , Scalbert A . Transport of proanthocyanidin dimer, trimer, and polymer across monolayers of human intestinal epithelial Caco-2 cells. Antioxidants & Redox Signaling. (2001) ;3: :957–67. |
[42] | Dutra RP , Abreu BVB , Cunha MS , Batista MCA , Torres LMB , Nascimento FRF , et al. Phenolic acids, hydrolyzable tannins, and antioxidant activity of geopropolis from the stingless bee Melipona fasciculata Smith. Journal of Agricultural and Food Chemistry. (2014) ;62: :2549–57. |
[43] | Hassimotto NMA , Lajolo FM . Antioxidant status in rats after long-term intake of anthocyanins and ellagitannins from blackberries. Journal of the Science of Food and Agriculture. (2011) ;91: :523–31. |


