
Kinetic deterioration and shelf life in Rose hip pulp during frozen storage
Abstract
Rose hip is of great interest among food manufacturers and consumers because it contains compounds that give it a high antioxidant capacity. To determine the effect of the frozen storage process over the vitamin C content, total phenols, antioxidant capacity, linolenic acid, linoleic acid, and other properties, rose hip pulp was stored at –5°C, –10°C, –15°C and –20°C. Also, the temperature of –18°C was considered in order to verify differences between the predicted and experimental rates at this commercial storage condition. The kinetics were modeled using the Weibull model, and their rates were correlated with the temperature using the log-logistic model. Results showed that vitamin C, total phenols content, antioxidant content, and linoleic decreased while frozen. The degradation of vitamin C in rose hip pulp during frozen storage was lower than the degradation rate of the total phenols and the antioxidant capacity, respectively. Shelf life of frozen rose hip pulp was established to be 329.8 days at –18°C.
1Introduction
Fruits and vegetables are important dietary sources of antioxidants. Take for instance berries, which have a good polyphenols content, are of interest among nutritionists, food manufacturers and consumers, because of their presumed safety and potential therapeutic value [1, 2]. Similarly in the case of rose hip, one of the most valued berries by consumers in the world, whose consumption has been associated with a benefit to human health [3]. In fact, rose hip is widely used in food, cosmetics, and as a traditional medicine It is considered safe and has a long history as food [4].
Studies on rose hip preserves and air dried rose hips have demonstrated the presence some important functional compounds, such as ascorbic acid (vitamin C) and phenolic content [5–12]. Moreover, important bioactive compounds have been detected and associated with the anti-inflammatory and antitumor risk properties [3, 6, 9]. For example, along the same line is the report by Cavalera, Axling [13] who mentioned that dietary rose hip increases energy expenditure and induces browning of white adipose tissue; thus, rose hip could have potential therapeutic implications for treatments of obesity and related metabolic disorders.
Rose hip is a highly perishable food product due to rapid microbiological growth and senescence. Freezing is an important processing method for rose hip as it can reduce the deterioration rate and in this way it can be preserved. However, fresh fruits and vegetables undergo various chemical changes and then deterioration when they are frozen for prolonged periods. For instance, fresh fruits contain biologically active compounds and important nutrients in the form of enzymes, which lose their nutrition value, color, and flavor when they are stored in a freezer [14, 15].
In general, frozen fruit (in the form of pulp), is a good alternative for preserving its nutritional properties for a long time [16]. However, the level at which these components are present during storage may be affected by processing operating conditions, besides storage temperature and time [14]. Since consumer’s expect fruits with good nutritional content and biological active compounds, it becomes very important to indicate the level of these compounds during storage. For that, kinetic modeling of the degradation of these compounds during the storage are necessary to be developed to simulate diverse quality parameters during shelf life. In fact, the rate at which the loss of these components during storage of rose hip has been poorly reported by the literature. Knowledge on the levels of certain important components, such as, phenol content, vitamin C, essential fatty acids content and antioxidant capacity [17]; possibly, the frozen storage process in fruits, in a near future, labelling will include antioxidant capacity of fruits or fruit products.
The aims of this study were: i) to monitor the changes in the content of phenols compounds, vitamin C content, some fatty acids content (linoleic and linolenic acids), antioxidant capacity, color, and viscosity among other quality indexes during this storage at –5°C, –10°C, –15°C, and –20°C.; ii) to model the rates of these changes using a kinetic model; and, iii) to correlate the rates with storage temperature.
2Materials and methods
2.1Samples
500 kg of fresh rose hip was purchased from a local company. The fresh fruit, containing 15.4 soluble solids (%), a pH value of 4.05 (HANNA pH meter, HI 2221 model) and 0.42% of fat (Soxhlet method), was processed in a pulping machine (VULCANO, DFV004 model) to obtain 400 kg of rose hip pulp. From 400 kg, only 180 kg of pulp were used in the experiment; and it was distributed into 360 bags 500 g each.
2.2Frozen storage
Twelve freezers (temperature control accuracy: ±1°C) were used and grouped in four sub groups each containing three freezers. Every group of freezers were set at –5°C, –10°C, –15°C and –20°C, respectively. This system allowed the triplicates to control simultaneously at the four temperatures. In each one of the twelve freezers, 30 bags of rose hip pulp were stored. Additionally, two independent freezing chambers that were set up at –18°C were used as a way to experimentally corroborate the rate values predicted at this temperature by the model proposed in section 2.5 (Equation 2).
2.3Kinetic sampling plan
To represent a point in the kinetics, three bags were sampled from each freezer and the mean and a standard deviation were calculated. The frequency of the sampling was: once per week, once per 15 days, every 20 days and every 30 days, corresponding to –5°C, –10°C, –15°C and –20°C, respectively. Before the analysis, samples were thawed by putting them in a refrigerator for 5 hours at 5°C.
2.4Physical-chemical analysis
Instrumental color parameters on rose hip pulp, luminance (L*), redness (a*) and yellowness (b*), were measured using a computer vision system according to Quevedo, Pedreschi [18]. The Computer Vision System consisted mainly in a Canon SX200 camera (image resolution 3000 by 4000 pixels). The viscosity of the pulp was measured using a Labolan viscometer V.2 at the temperature of the 20°C. Soluble solid (%) was measured using an Abb
Vitamin C (ascorbic acid) was extracted with meta-phosphoric acid (3% w/v) and analyzed by reversed-phase HPLC in a HP Agilent 1100 series (Hewlett-Packard, Palo Alto, CA, USA) with auto sampler and quaternary pump coupled to a diode array detector. A 3.9×300 mm column 10μm, 125 Å, Waters, μBondapak™ C18 was used, being elution (flow rate of 0.8 mL/min) performed in isocratic condition with 2 mmol/L potassium chloride buffer (pH 2.5), monitored at 245 nm. Total ascorbic acid was estimated after reduction of dehydroascorbic acid (DHA) with dithiothreitol 10 mM. Results were expressed as mg ascorbic acid equivalents (AA)/g sample in dry weight (DW) [19].
The antioxidant capacity of the samples were estimated spectrophotometrically by determining the free radical scavenging capacity evaluated with the stable radical DPPH, according to Van de Velde, Grace [20]. The determinations were made in triplicate and results were calculated using a standard curve of ascorbic acid (AA) and expressed as mg AA/100 g DW.
For the total phenols content, a sample (10 g) was added with 40 mL of 0.5 M sodium phosphate buffer (pH 6.5) containing 20 g/L of Polyvinylpyrrolidone (PPVP, Sigma). Then it was centrifuged at 2903 G-Force for 35 min at 4°C and filtered through Whatman N° 1 filter paper to obtain a supernatant (enzymatic extract). Total phenols were determined by the Prussian blue assay. Seventy-five μL of enzymatic extract was added to 625μL of distilled water, followed by the addition of 3.0 mL of 0.10 M FeNH4(SO4)2 in 0.10 M HCl. After 20 minutes, 0.008 M K3 Fe (CN)6 was added. The absorbance was read after 20 minutes at 720 nm. A standard curve was constructed using gallic acid and the results were expressed as milligram of gallic acid (GA) Equivalent on 100 g dry weight basis (mg GA/100 g DW) [18].
The fatty acid composition of the samples was determined by gas chromatography. Samples were lyophilized, using 250 g of sub sample obtained from each bag, in an Operon FD -8602 freeze-drier (Operon Co., Ltd., Korea) at –80°C and 100 mTorr for 24 h. Fifty milligrams of fat, obtained from the lyophilized samples (using chloroform), was saponified with 1 mL NaOH 0.5 M in methanol, heated at reflux for 10 min, and then esterified using the methodology described by Bastias, Balladares [21]. The methyl esters of fatty acids were analyzed with a Shimadzu GC-2010 gas chromatograph with an FID detector using a Rt 2560 capillary column (100 m, 0.25 mm ID, 0.2μm df). Both injector and detector temperatures were 250°C. Separation was carried out by a temperature ramp program with an initial temperature of 140°C that was increased at 10°C min–1 to 200°C and then held for 20 min; there was a further increase of 2°C min–1 until reaching the final temperature of 240°C that was held for 10 min. Helium was the carrier gas and injection was performed in “Split” mode (1 : 100). Fatty acid methyl esters were identified by comparing them with retention times of a mixture of saturated fatty acid standards (C4-C24) (1000μg/ml in hexane, analytical standard, 49453-U Supelco) and PUFAs (C4-C24) (wt% varied, analytical standard, 18919–1 AMP Supelco). Linolenic acid C18 : 3 n-3 (ω3) and linoleic acid C18 : 6 (n-3) (ω6) values were used (expressed as mg per 100 g of total fat) to build the respective kinetics at each temperature.
2.5Kinetic modeling
Weibull model was used to calculate a kinetic rate to each proposed indicator. The model is seen as a failure phenomenon, where the fraction of intact molecules decreases with time. Therefore, it is not surprising that the kinetic curves of foods can be described by this model [22]:
(1)
Where C/C0 is the retention of a component with respect to the initial value; k is a velocity parameter which, when positive describes the exponential isothermal growth, and when it is negative an exponential isothermal decay. The value n is a parameter called “form factor”. The relationship of the kinetic rate with the temperature was done using the log-logistic model [23] following the equation:
(2)
Where T (°k) is the storage temperature; and Tc, D, and m; are parameters.
We used this model instead the Arrhenius model because it is especially formulated to identify the temperature level at which changes in the food system start their acceleration (Tc). Also, since the rate–temperature relationship is expressed as K(T) and not lnK(1/T), as in the Arrhenius model, the excessive weight usually given to the low-temperature range is thus avoided [24].
The Equations were fit to the data using a nonlinear least squares regression software. To detect statistical differences between calculated kinetic rates at each temperature level, a t-student test (95% of confidence) was performed.
3Results and discussion
In Fig. 1 the kinetics of the vitamin C content in rose hip pulp, fit to the Weibull model at 4 frozen storage temperatures, are shown. The fitted models were developed using the Software Excel®, 2016 version. Values of vitamin C in the samples during the entire experiment ranged from 400±18 mg of ascorbic acid/100 g DW pulp to 304±18 mg ascorbic acid/100 g DW. These values confirmed that rose hip pulp is a good source of vitamin C, for example when it is compared orange juice (69±30 mg/100 g DW), gooseberry (44.7±0.69 mg/100 g DW) strawberry (32.6±0.52 mg/100 g DW), raspberry (12.7±0.67 mg/100 g DW) or “umbu” spondia tuberosa (10.06±0.39 mg/100 g DW) [25, 26]. However, rose hip pulp showed lower vitamin C value when it is compared with camu – camu frozen pulp (1889±68 mg/100 g DW) [19]. The World Health Organization recommends a daily consumption of 45–90 mg of vitamin C, depending of body weight, age, and others factors [27].
Fig.1
Kinetics of the vitamin C content in rose hip pulp, fit to the Weibull model at 4 frozen storage temperatures.
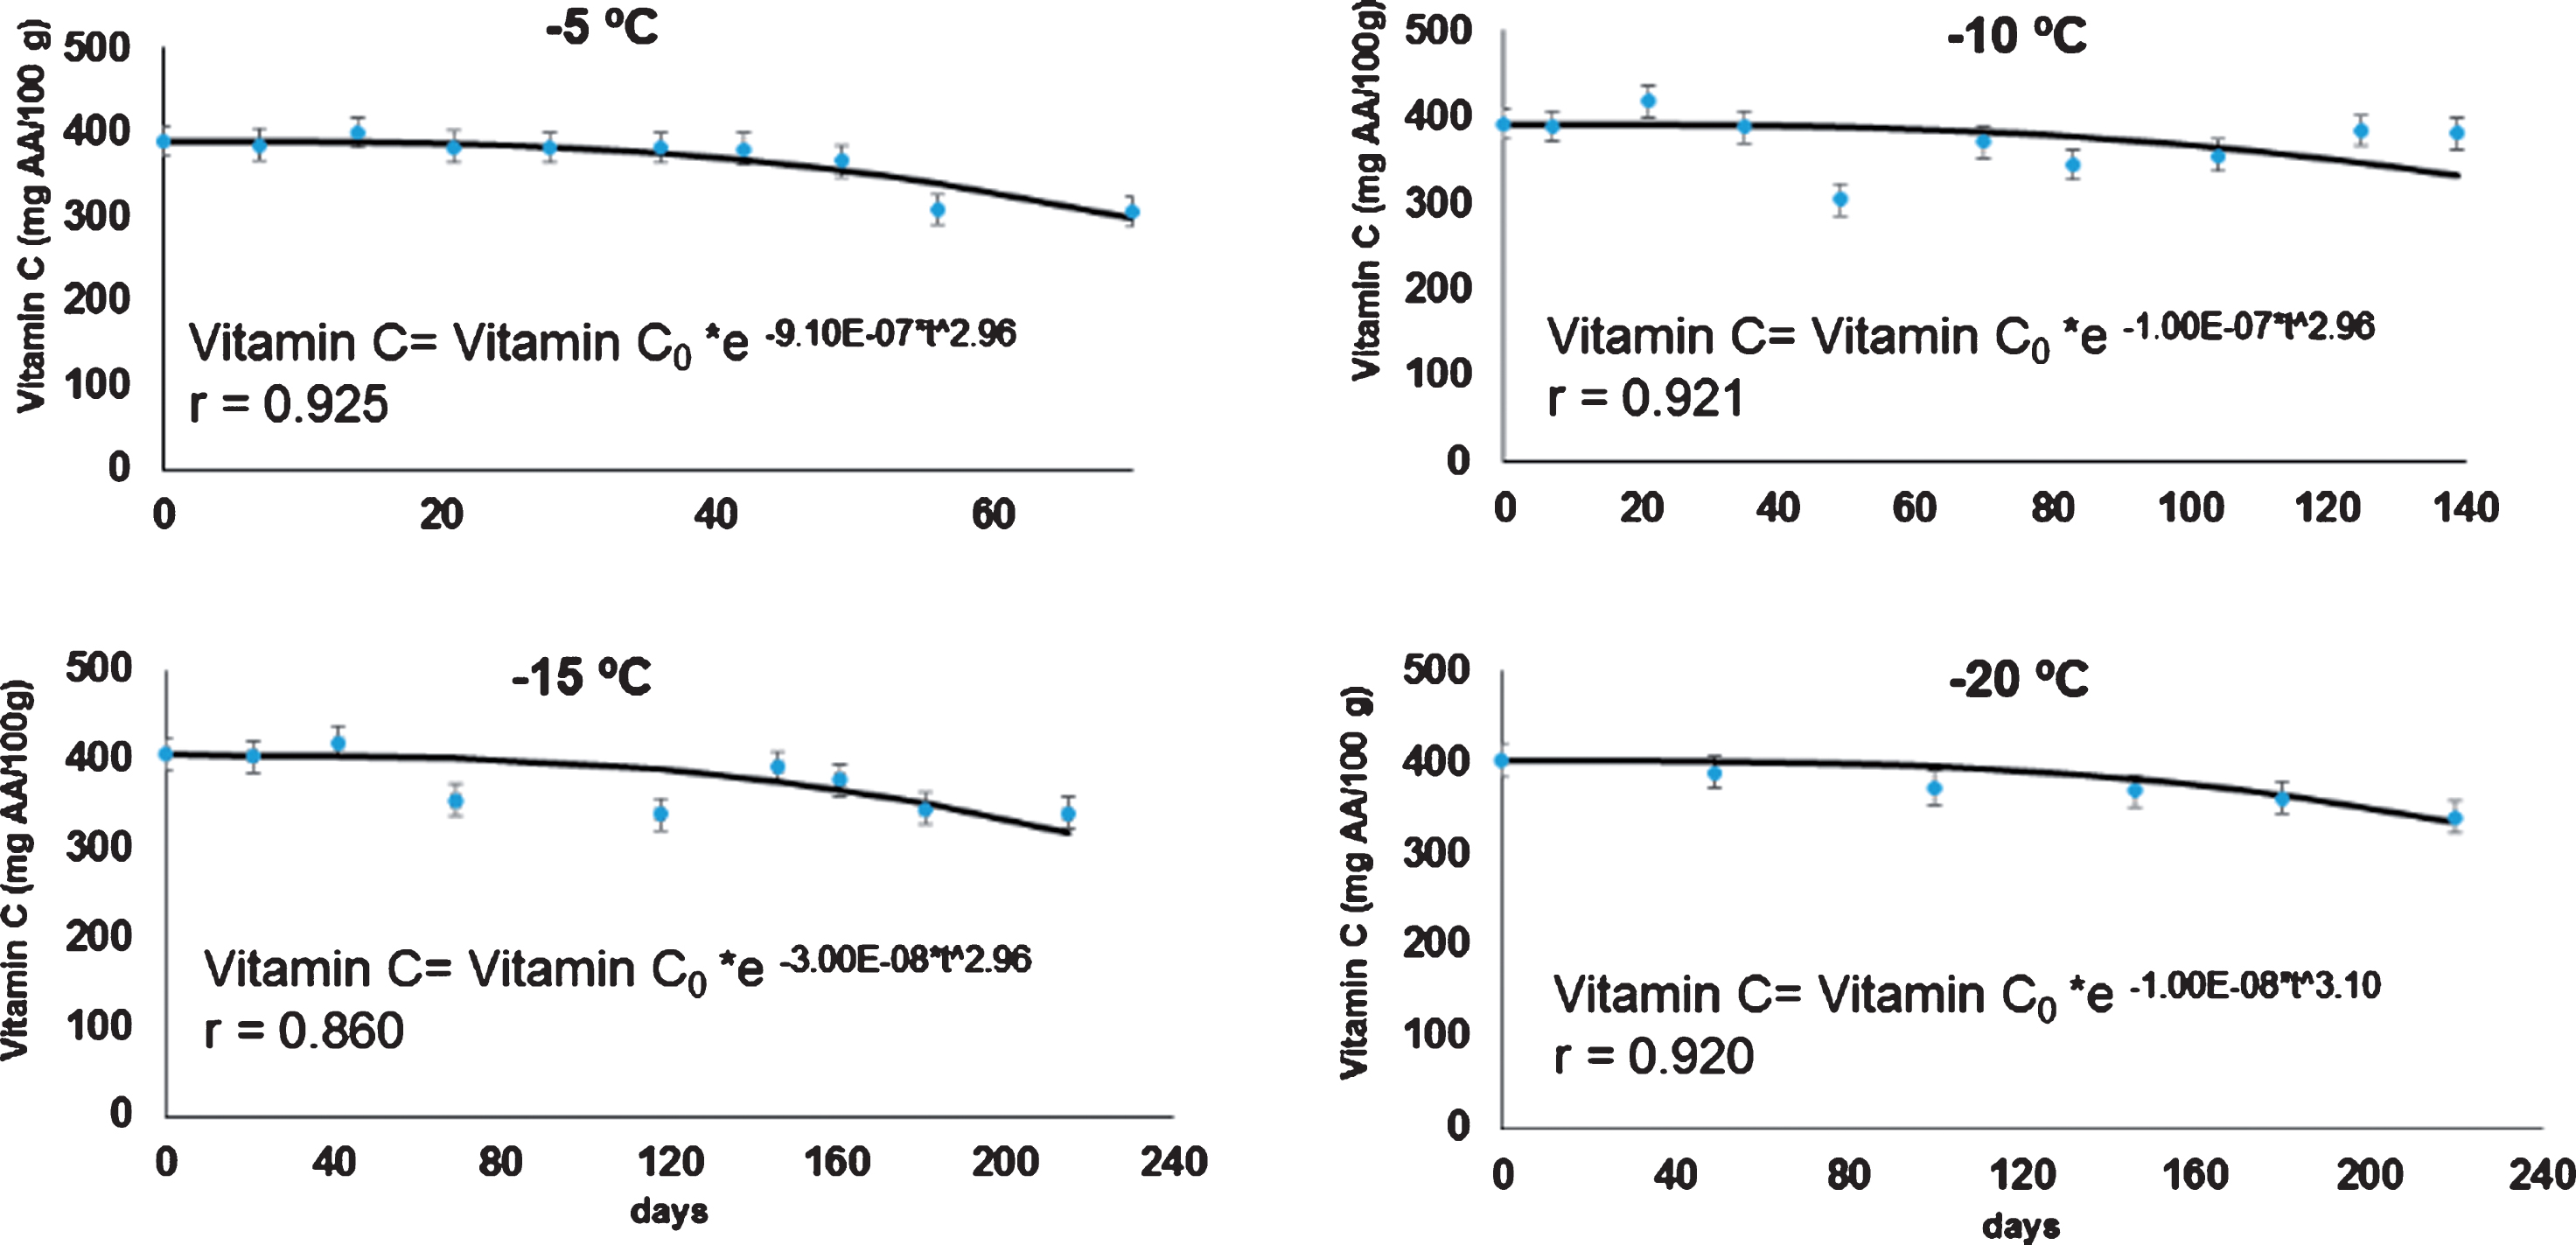
The vitamin C content in rose hip pulp decreased with time during frozen storage. With respect to the temperature, the higher the storage temperature, the faster the rate of vitamin C degradation (Table 1). In general, the degradation of vitamin C during the frozen storage (9E-07 to 1E-08 mg AA/100 g DW day), was comparatively lower than that reported for other frozen fruits. For instance, in frozen strawberry [28], the degradation rate was between 0.0477 to 0.0048 mg AA/100 g DW day, when it was stored between –5°C to –16°C, respectively.
Table 1
Rate parameters k (min–1), and n parameters, calculated from the Weibull model (Equation 1)
| Temperature (°C) | Parameter | Vitamin C | Phenols content | Antioxidant capacity |
| –5 | K | –9.10E–07a | –0.280b | –0.401c |
| n | 2.9L | 0.1m | 0.3o | |
| –10 | K | –1.00E–07d | –0.201e | –0.110f |
| n | 2.9L | 0.1m | 0.4o | |
| –15 | K | –3.00E–08g | –0.035h | –0.070i |
| n | 2.9L | 0.5n | 0.4o | |
| –20 | K | –1.00E–08g | –0.015j | –0.040k |
| n | 3.0L | 0.7n | 0.3o | |
| Std. deviations* | K | ±2E–08 | ±0.050 | ±0.011 |
| n | ±0.2 | ±0.3 | ±0.3 |
*Average of the standard deviations. A different subscript letter is indicative of a statistical difference at 95% of confidence.
In Fig. 2, the kinetics were fit into the model (Equation 1), corresponding to the total polyphenols level in the rose hip pulp stored at –5°C, –10°C, –15°C and –20°C, are shown. Total polyphenol levels ranged from 803.6 mg Gallic acid/100 g DW to 312.8 mg Gallic acid/100 g DW. These ranges showed that the rose hip pulp is also a good source of phenolic compounds; even still if the pulp is in frozen storage of –5°C for 2.3 months or –20°C for 8 months and when it is compared, for example, with the total polyphenols levels reported by Guerrero, Ciampi [29] who reported 145.7 mg Gallic acid/100 g DW for fresh rose hip; and, 15.57 mg Gallic acid/100 g DW for dried “Hassk” berries. Reddy, Sreeramulu [1], for many dried fruits reported levels between 959 to 99 mg Gallic acid /100 g DW.
Fig.2
Kinetics of the phenols content in rose hip pulp (mg GA/100 g DW), fit to the Weibull model at 4 frozen storage temperatures.
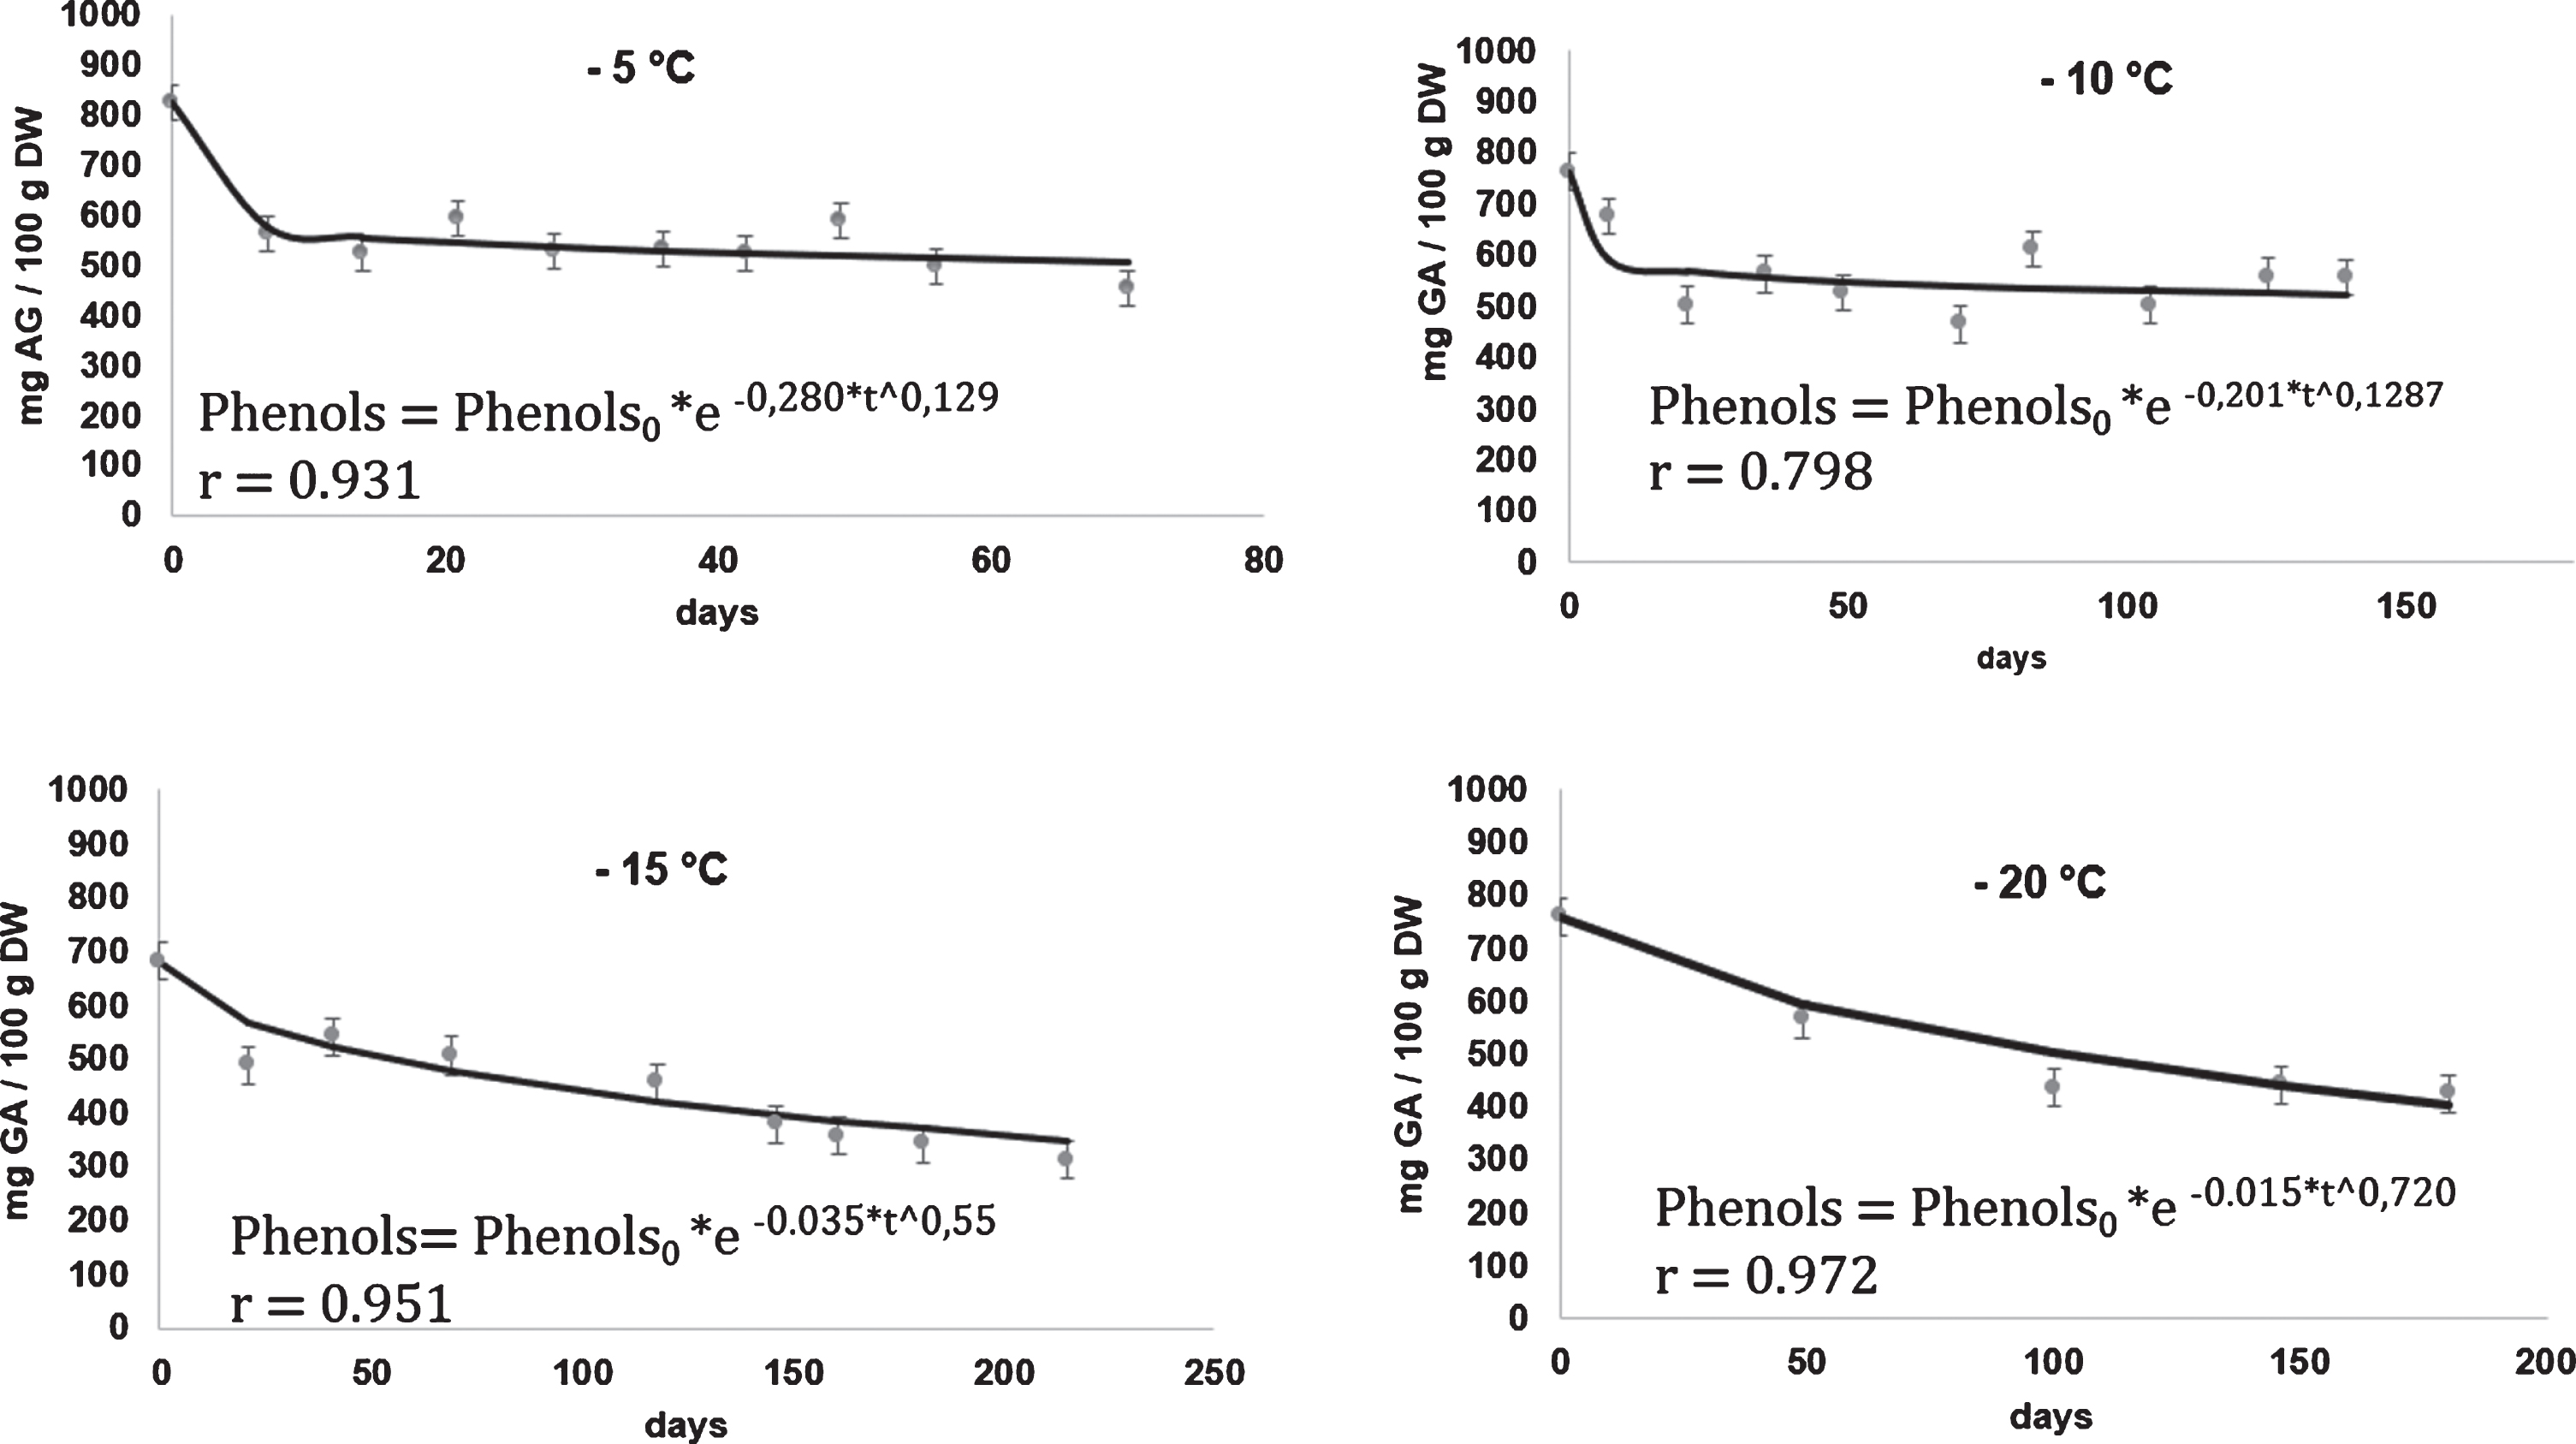
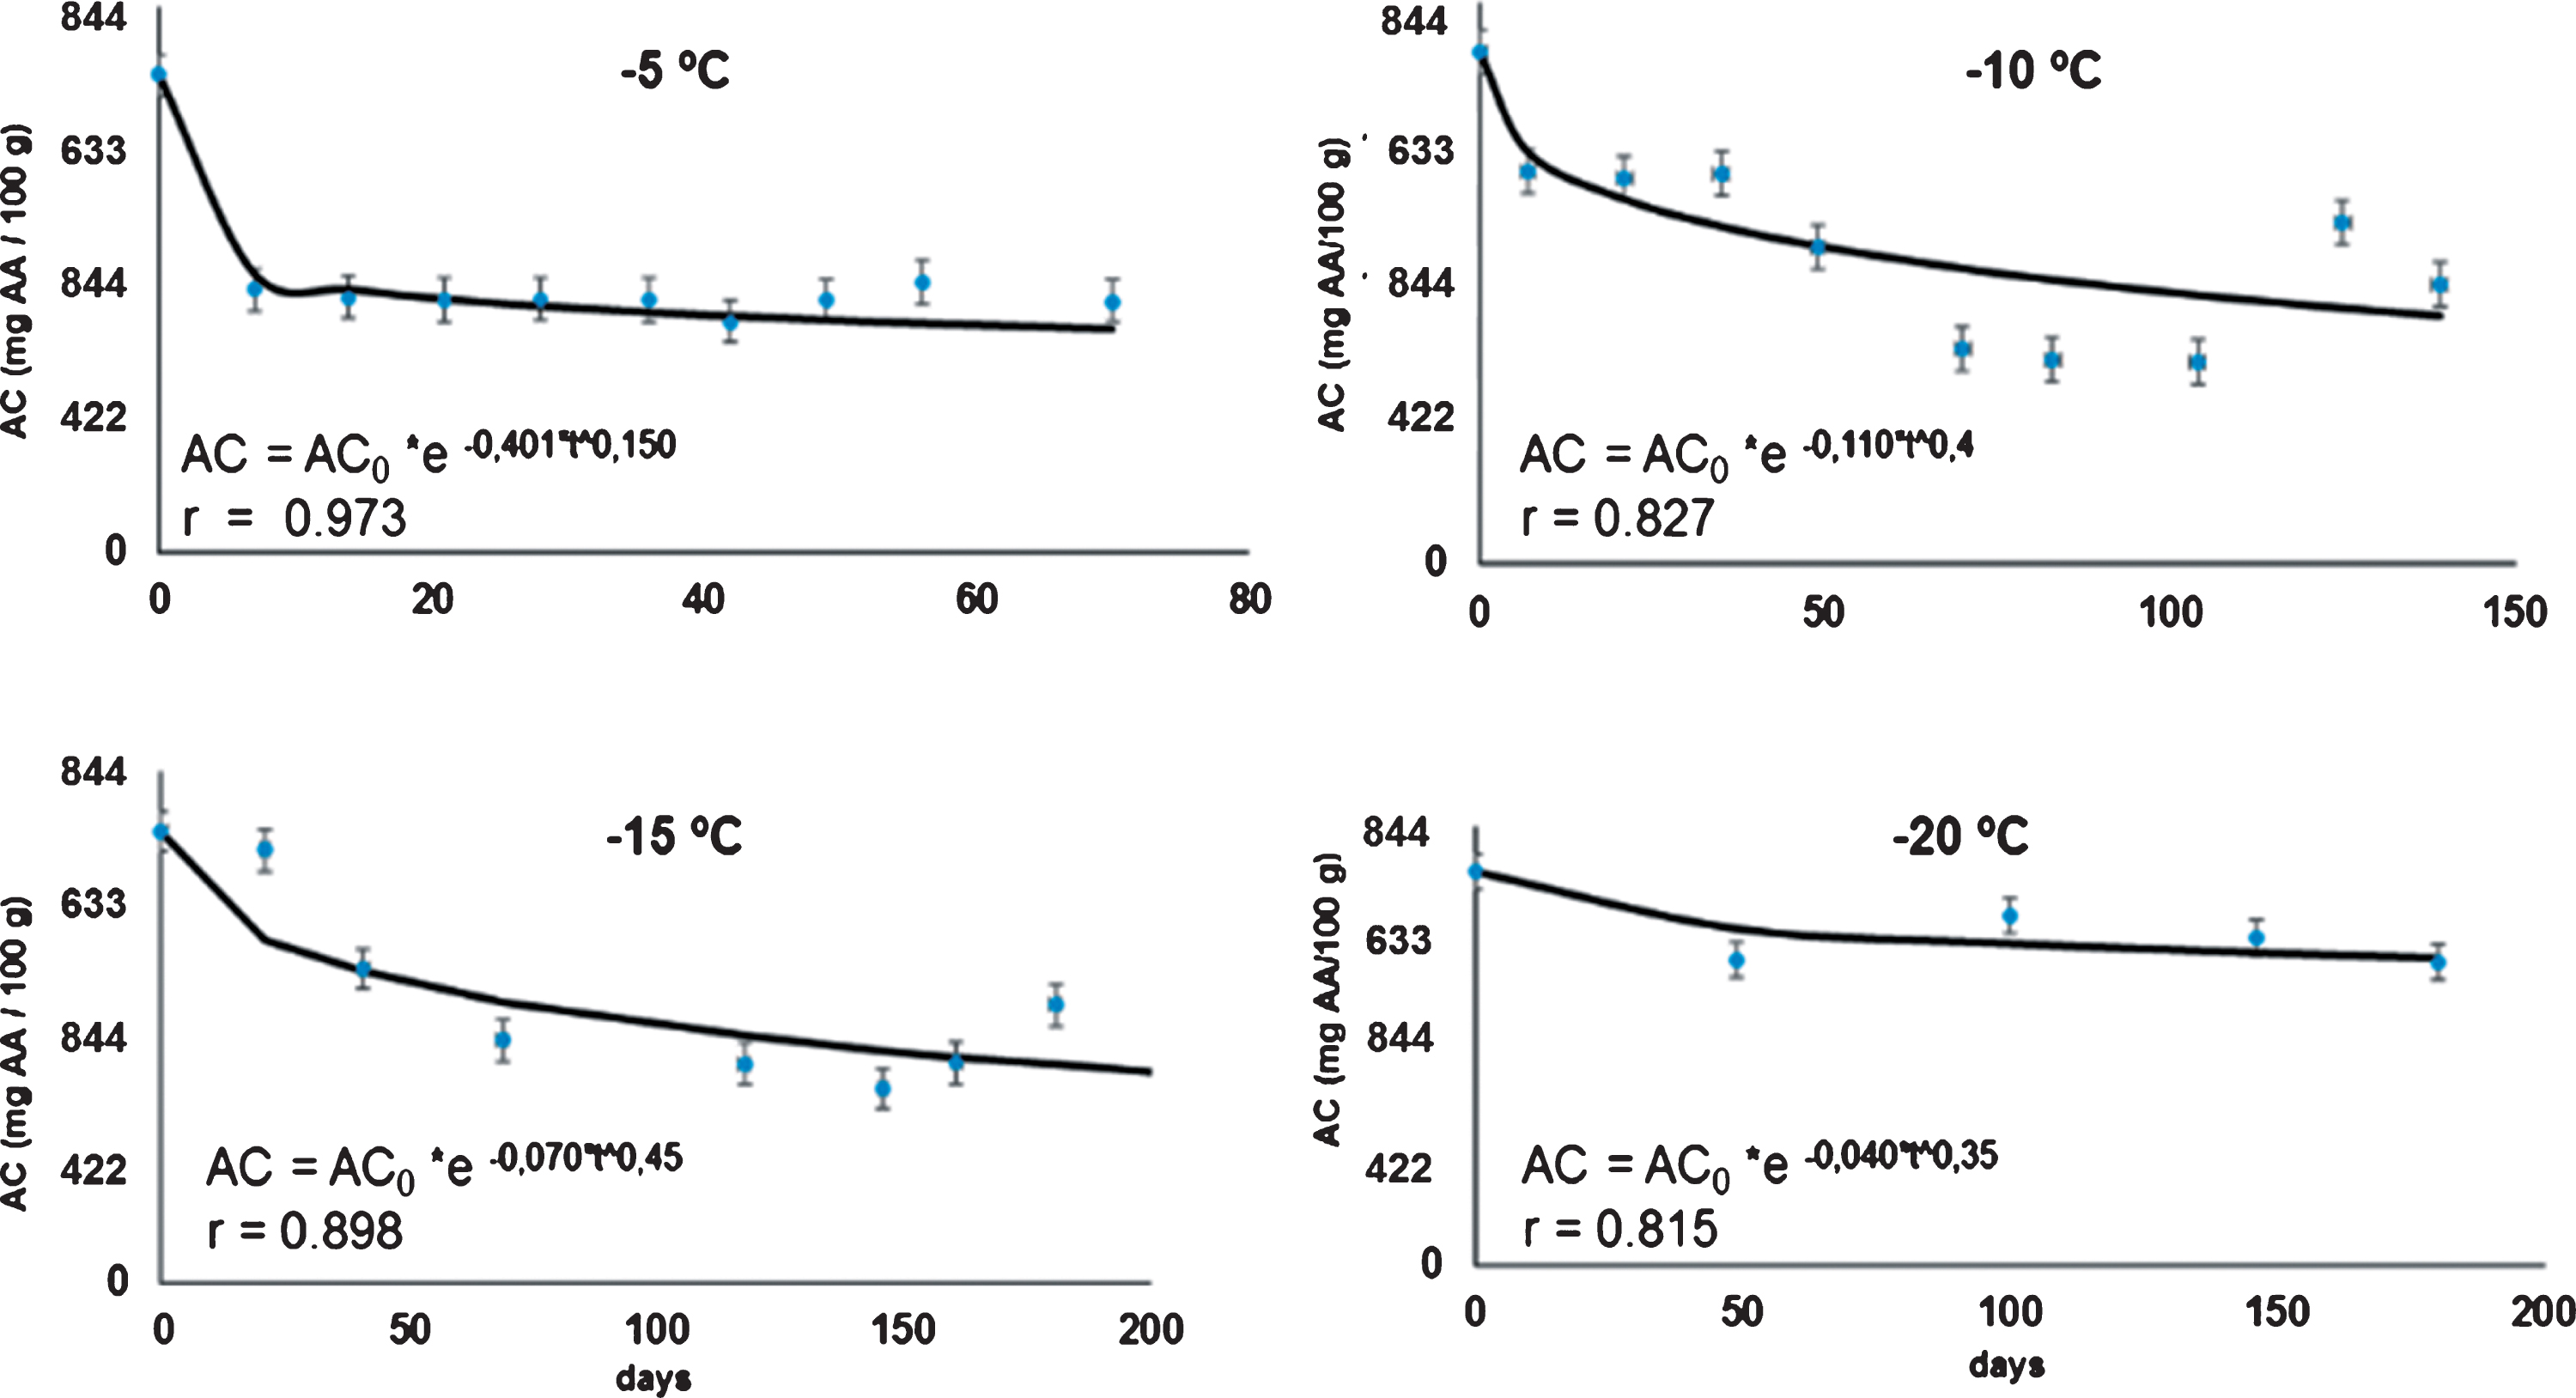
Kinetic rates of total phenols content in the rose hip pulp (Table 1) were comparatively much higher than the vitamin C degradation rates obtained under the same storage conditions (retention in vitamin C was about, 2.25 times as high as retention in phenols). During the frozen storage process, the fast degradation of the total phenols obtained in the samples gives an indication of the loss of antioxidant capacity is in the pulp. Phenols are largely distributed in fruits and vegetables and they have been studied mainly because of their potential health benefits as an antioxidant [30, 31]. The kinetics values of the antioxidant capacity are displayed in Figure 3. The results shown that the levels of the antioxidant capacity (AC) in the samples varied between 740±80 mg AA/100 g DW to 304.4±80 mg AA/100 g DW during frozen storage. These values were higher than that reported by Reddy et al. [1] for many fruits. However, for thick-skinned red table grape, [32] found levels around 737.8 mg AA/100 g DW for.
Fig.3
Kinetics of the antioxidant capacity (AC in mg AA/100 g DW) in rose hip pulp, fit to the Weibull model at 4 frozen storage temperatures.
A first order kinetic model was not suitable describe successfully al kinetic data. For this, we used the Weibull model which was more suitable and allowed to obtained comparable data at each temperature, considering that the n values were statistically similar (Table 1). With the exception of total phenols, the n fitted values did not statistical differ at different temperatures.
The rapid loss of antioxidant capacity in rose hip pulp stored under freezing conditions can be seen in Fig. 3, as well as in Table 1, where the values of the rate of loss of antioxidant capacity are shown. The rate of loss in the samples of the antioxidant capacity diminished with the storage temperature, and they are much higher when they are compared with the degradation rate of vitamin C. Hoffmann, Zandon
In general, this result has a great practical implication for consumers. The top characteristic for which the rose hip is known for and therefore is desired in the market is precisely for its high antioxidant capacity. Such to the demonstration here, the antioxidant capacity in the rose hip pulp can be reduced 30 to 40% of its initial antioxidant capacity level, depending of the storage time and the freezing temperature.
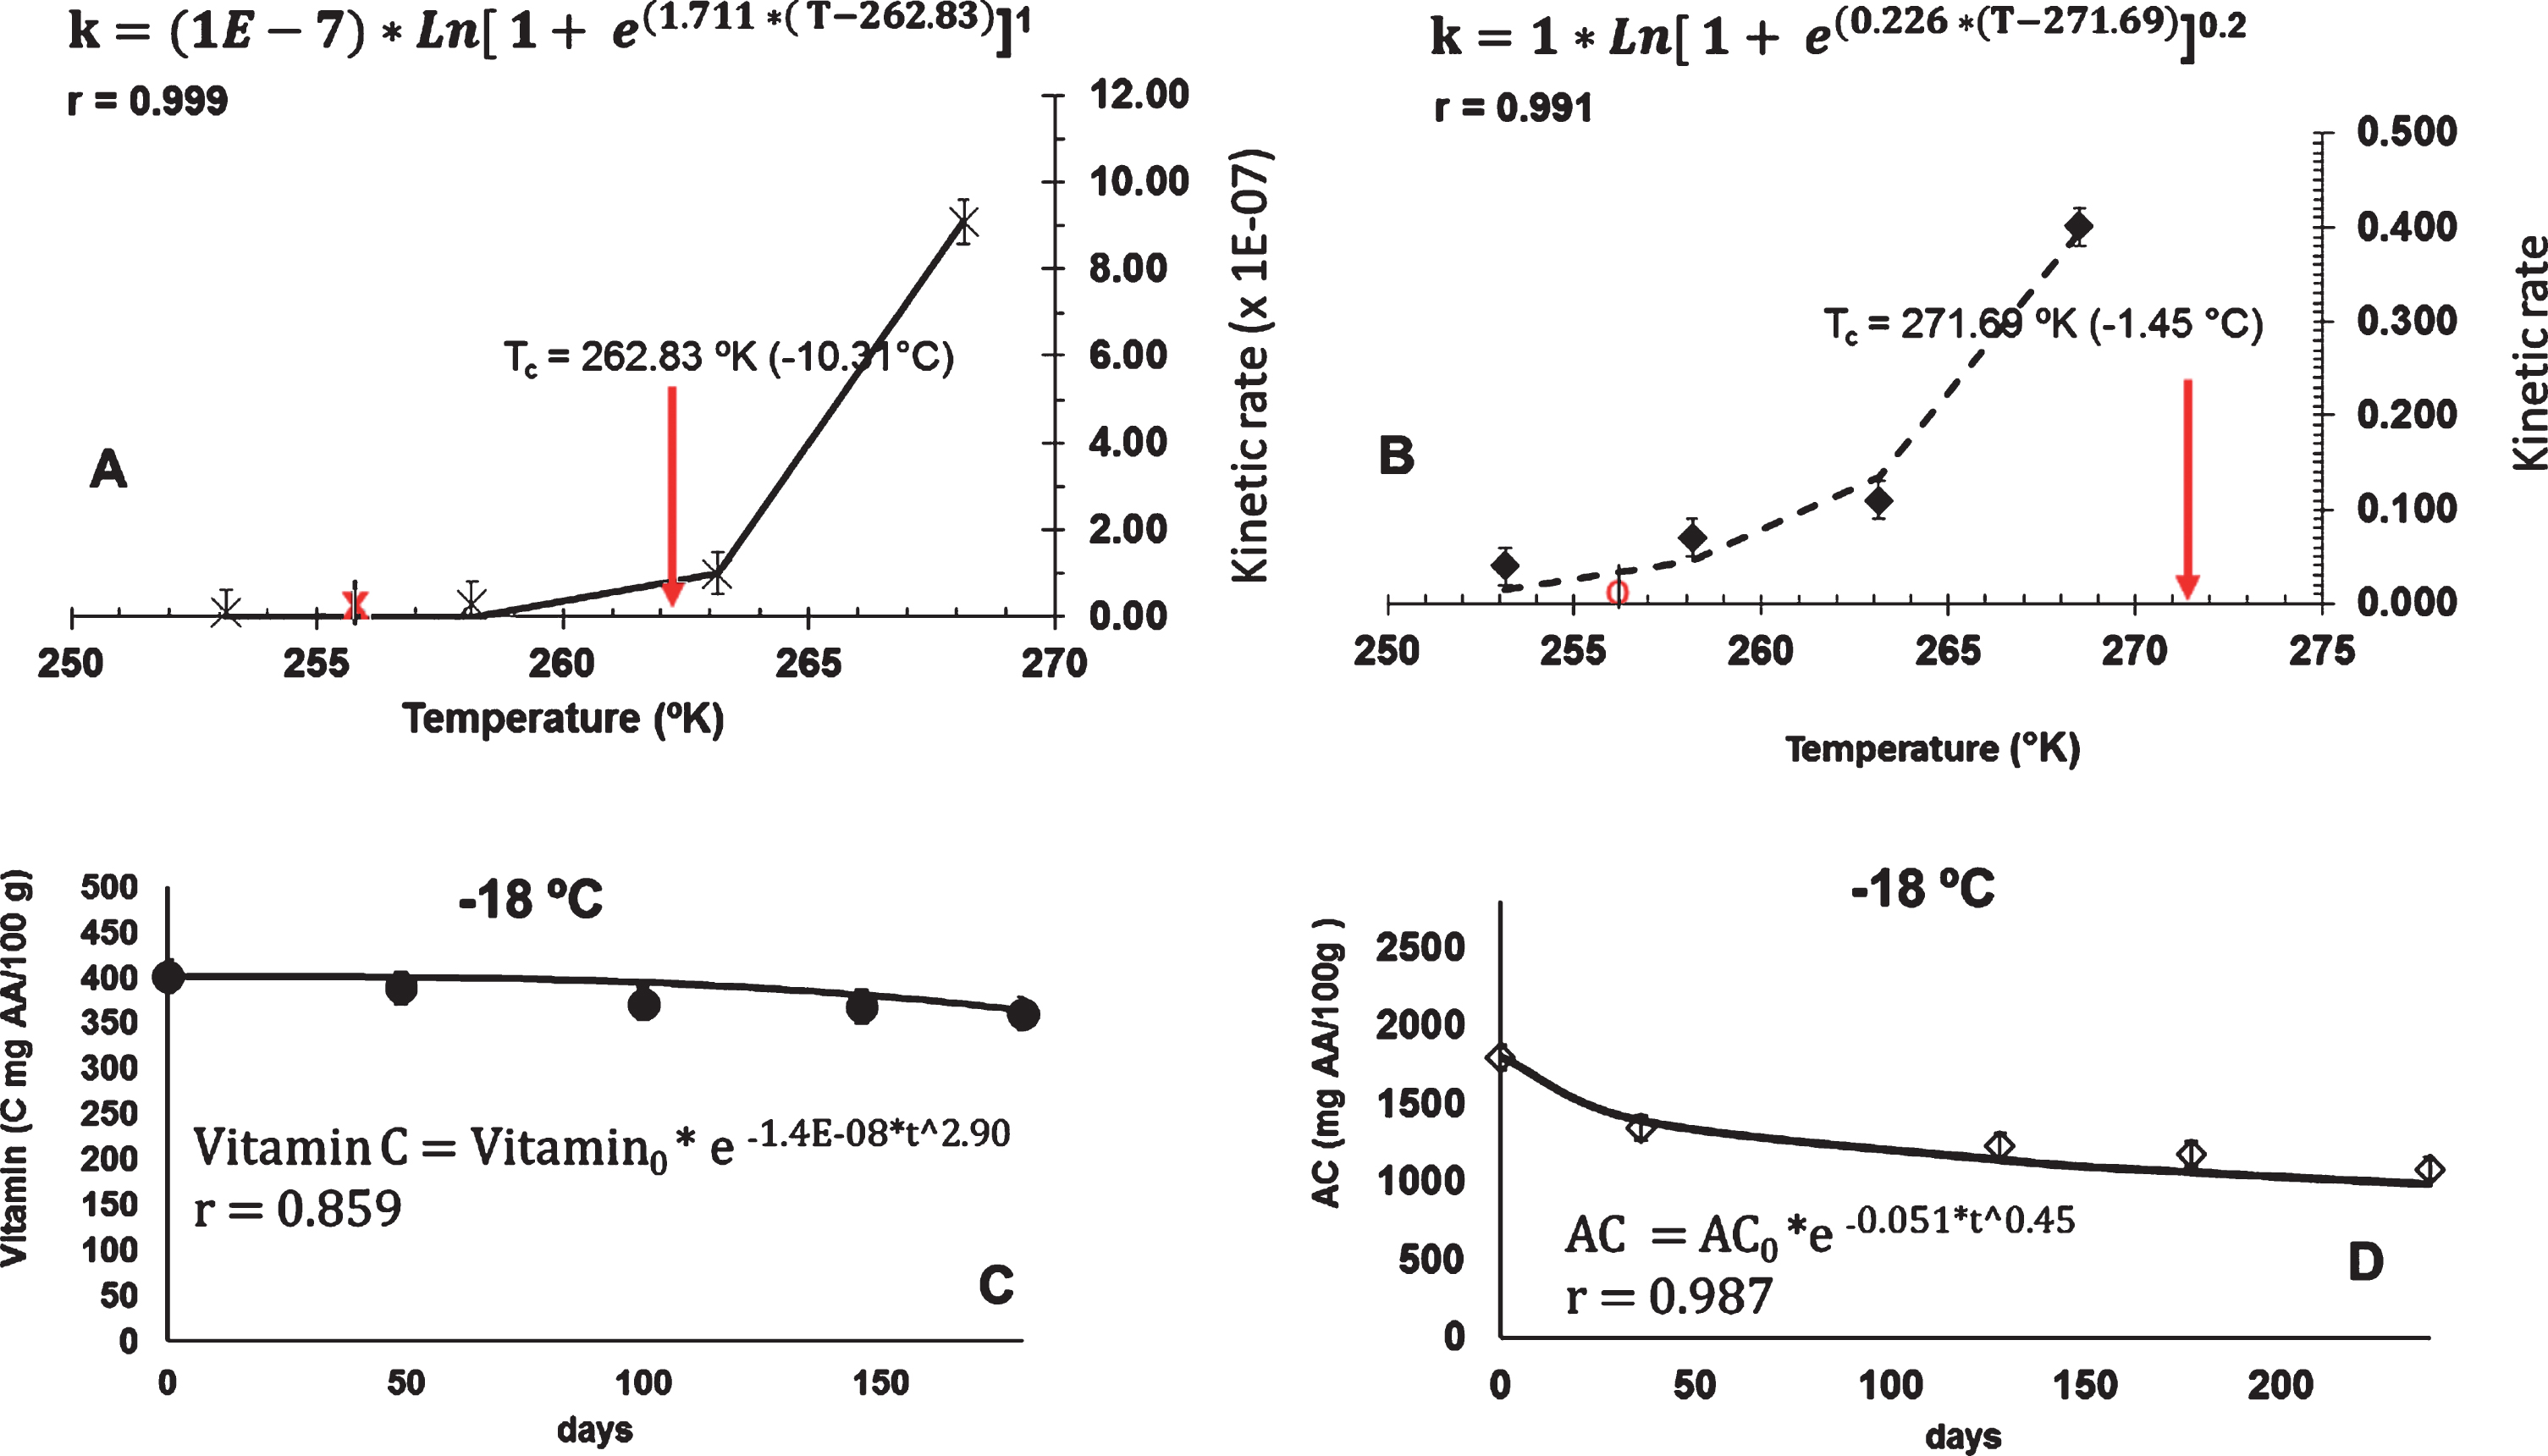
Today, two of the most important components that consumers consider to be relevant when purchasing fruits are the content of vitamin C and the antioxidant property because it is known that these compounds contribute to the improvement of health [31]. In Figure 4 the relationships of the kinetic rate of vitamin C (Fig. A) and the kinetic rate for the antioxidant capacity (Fig. B) with the temperature (using the Equation 2), are shown. The fit had a good Pearson coefficient of correlation (above to 0.99) and gave Tc parameters equal to 262.83 (–10.31°C) for vitamin C and 271.69 (–1.45°C) for antioxidant capacity, respectively. According to Peleg, Normand [23], Tc is a parameter to calculate the temperature above which the degradation rates starts to speed up. These values thus obtained are only a mathematical prediction and must be validated taking into account different points of view; depending of the quality parameters and their importance for the fruit pulp nutritional quality (e.g., ascorbic acid, phenols or antioxidant capacity). In this study, shelf life was focused on the antioxidant capacity. According the Figure 4, rose hip pulp should be stored below the temperature of –10.31°C to reduce the degradations of vitamin C; or, below –1.45°C to reduce the degradations in the antioxidant capacity during the elapsed time of the experiment (arrows in the Figures).
Fig.4
(A–B), the relationships of the kinetic rate of vitamin C and the kinetic rate for the antioxidant capacity, with the temperature; showing their Tc parameters, respectively. (C–D), the kinetics, the fitted Weibull model for vitamin C, and antioxidant capacity in rose hip pulp storage, at –18°C, respectively.
In Fig. 5 the kinetic of ω3 and ω6 in the samples of rose hip pulp stored at –5°C are shown. Only the kinetic at this frozen temperature could be fit into the Weibull model. Data at other storage temperatures remained constant over time. Levels of ω3 and ω6 in rose hip pulp storage at –5°C decreased between 45.01 g/100g fat to 6.47 g/100, and according to the 21.45 to 3.77 g/100 g fat, respectively. Espinoza, Valencia [3] reported values of ω3 and ω6 between 75 – 44 g/100 g fat and 31.4 – 27.5 g/100 g fat for fresh rose hip. Degradation rates of ω3 and ω6 was only evidenced at –5°C, being –0.442 g/100 g of fat per day and – 0.166 g/100 g of fat per day, respectively. According to these results, the rose hip pulp should be stored below the –5°C to assess good levels of ω3 and ω6 for at least until 6 months of frozen storage.
Fig.5
Kinetic of ω3 and ω6 in rose hip pulp stored at –5°C.
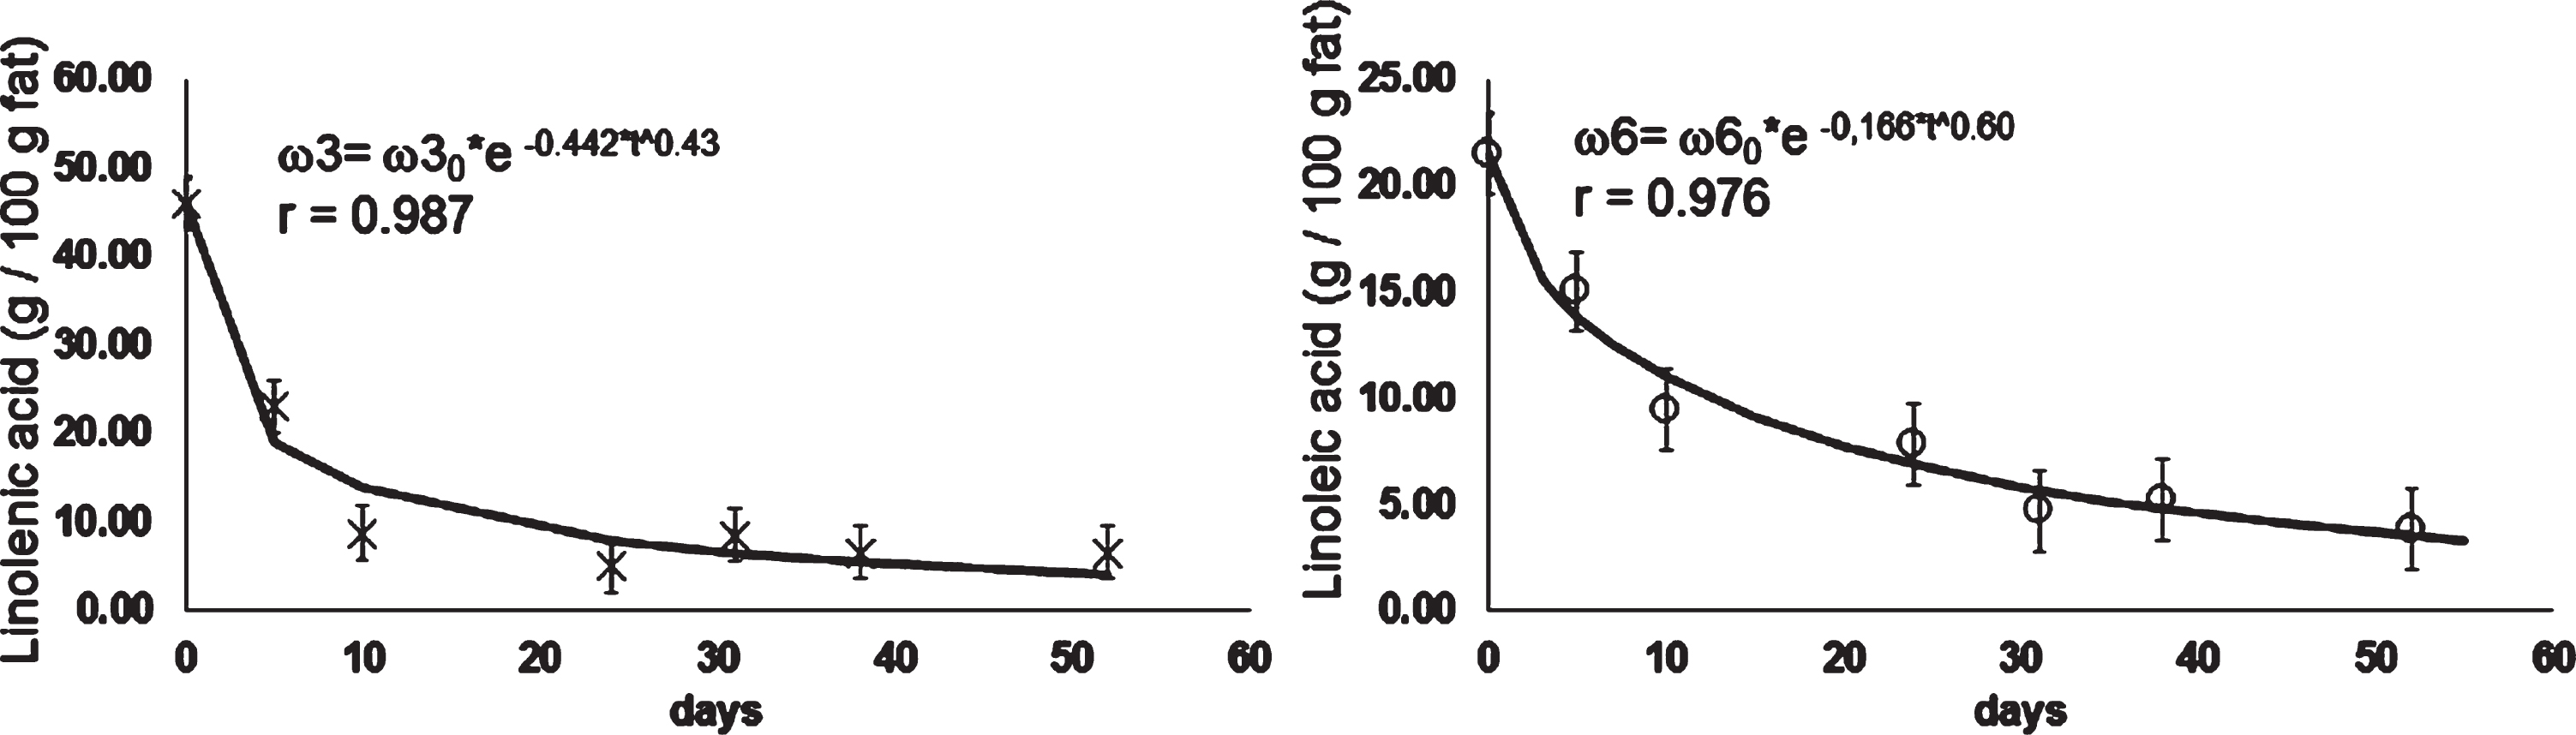
Figure 6 (Fig. A), shows the kinetic of the color L* (brightness), a* (redness) and b* (yellowness) only at –5°C. The tendency of the color parameters was very similar to the four temperatures used in the frozen storage, and no significant changes were detected, as compared to their initial brightness value. The brightness value (L*) was calculated like averages value of 44.8±2.5 units; redness value (a*) in 61.9±3 units; and yellowness (b*) in 25.89±3 units.
Fig.6
(A), kinetic of the color L*, a* and b* at –5°C. (B–D), kinetics of soluble solid, pH, and viscosity of rose hip pulp at –5°C, –10°C, –15°C and –20°C, respectively.
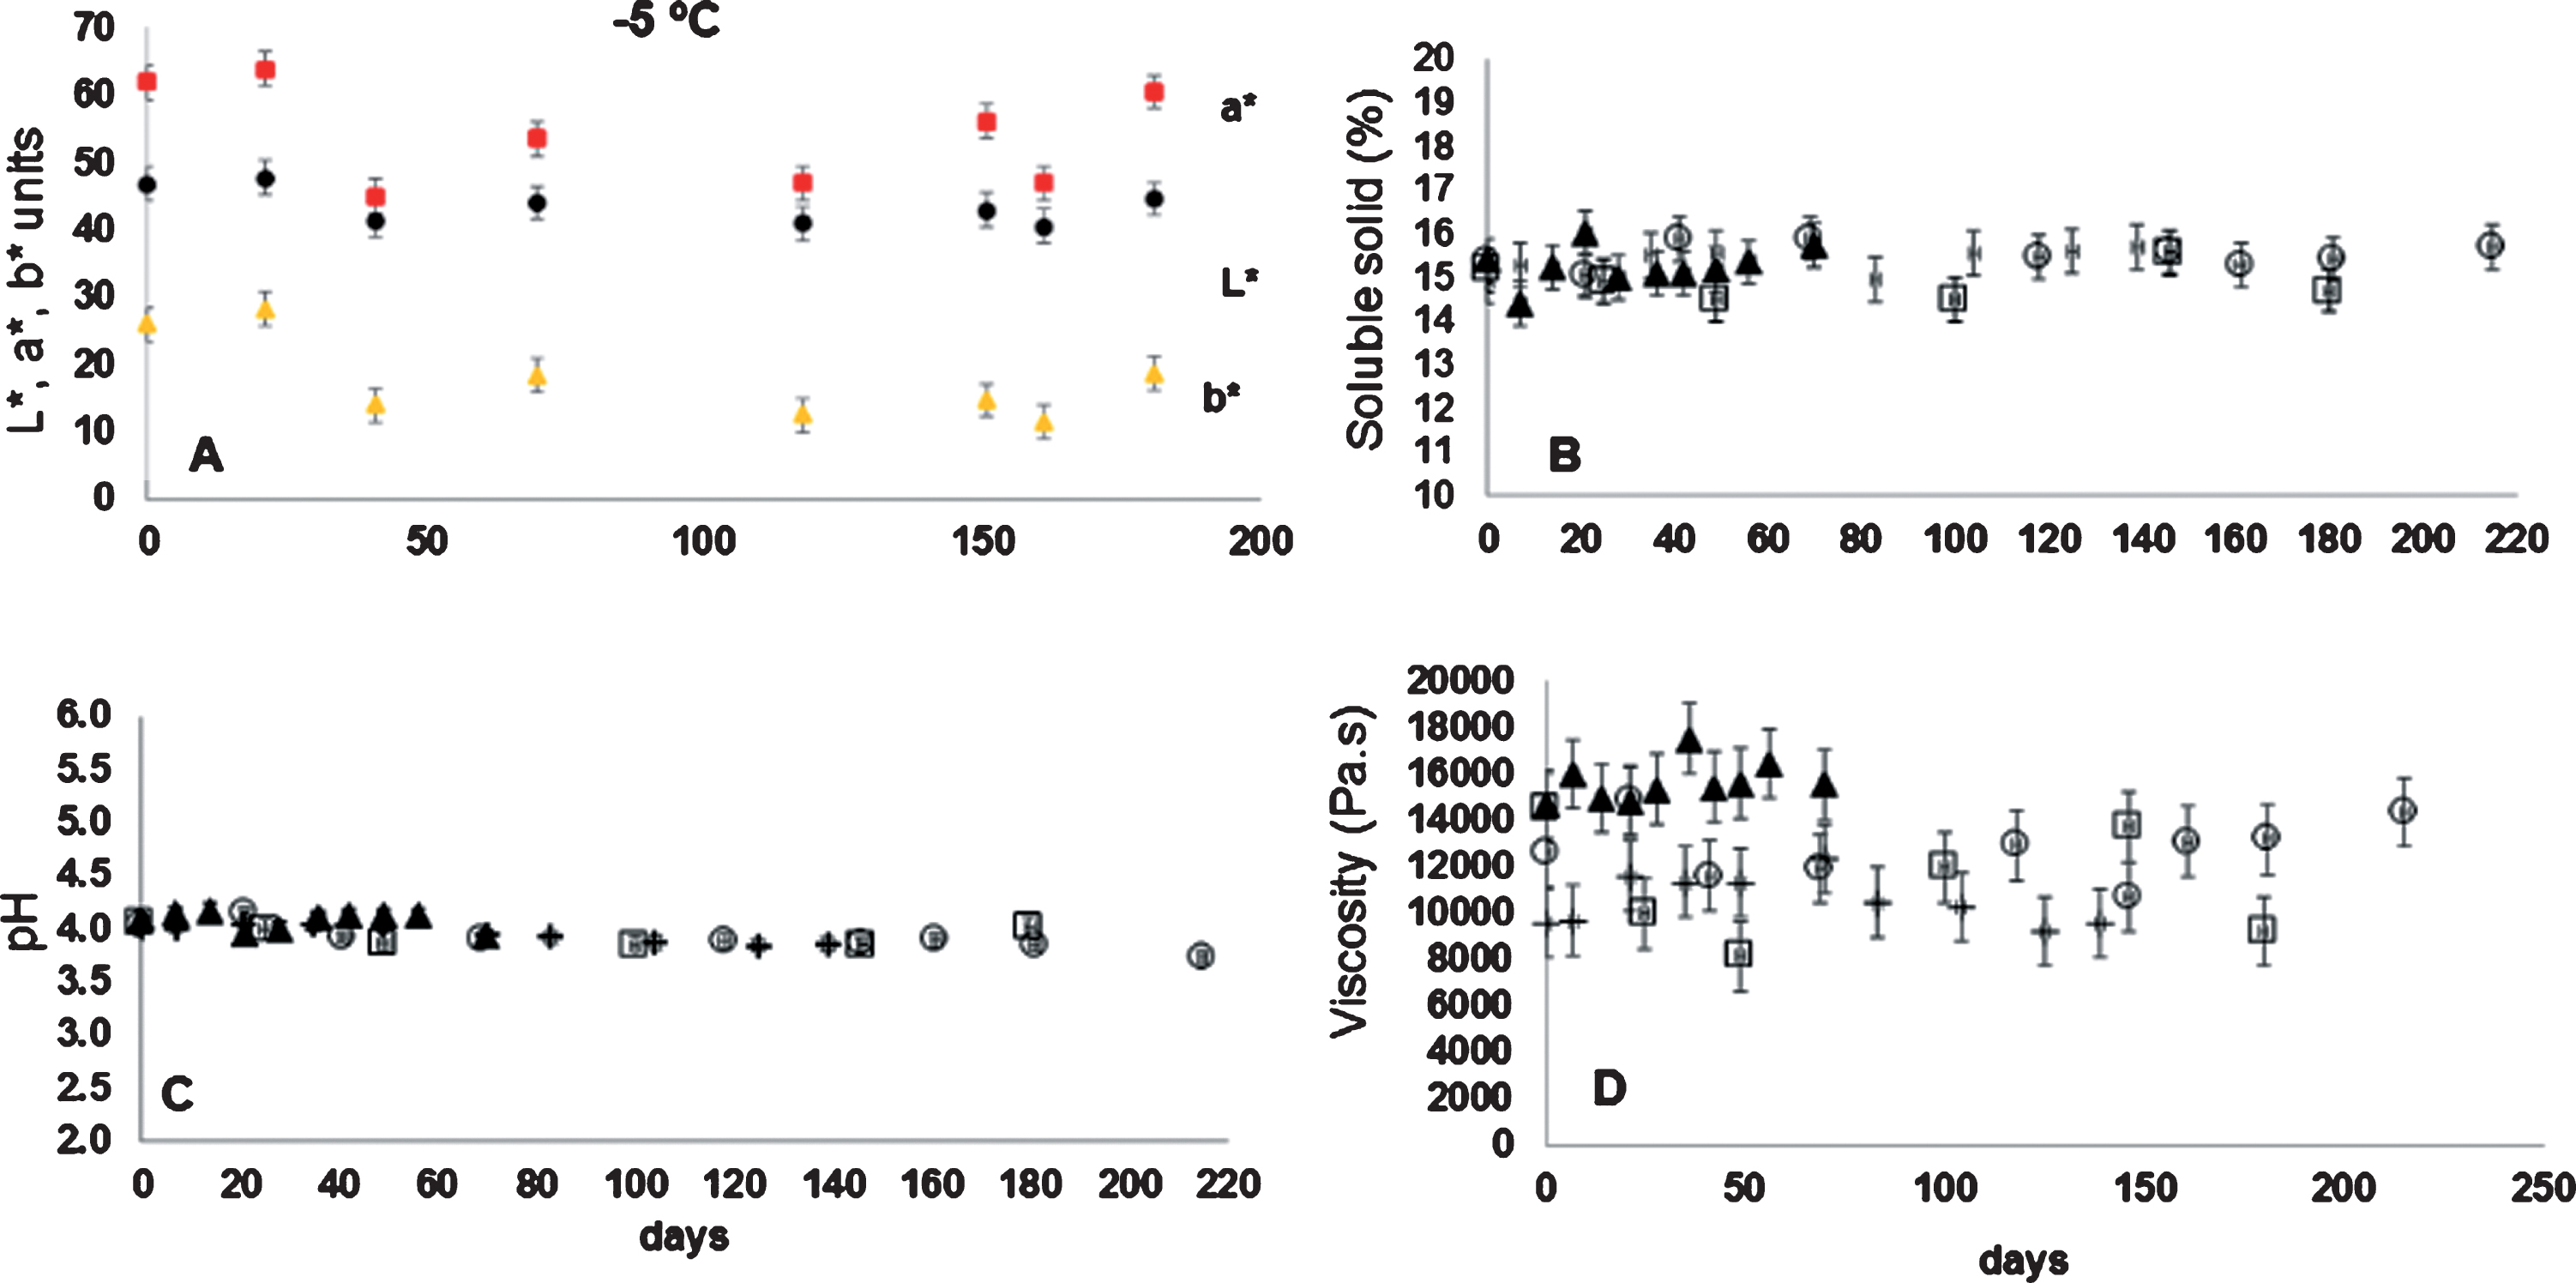
In Fig. 6, the kinetics of soluble solids (Fig. B), pH (Fig. C), and viscosity (Fig. D) of rose hip pulp monitored during frozen storage at temperatures of –5°C, –10°C, –15°C and –20°C, respectively are shown. Soluble solid, pH, and viscosity values were kept constant over time and at all frozen storage temperatures. Soluble solid ranged between 16.03 a 14.50%, where the pH ranged from 4.18 to 3.73 units. Viscosity ranged from 17535 to 8173 Pa-s.
In Fig. 4, kinetics and fit Weibull model for vitamin C (Fig. C) and the antioxidant capacity (Fig. D) in rose hip pulp storage, at –18°C, are shown. Estimated kinetic rates obtained from data of two independent freezing chambers set up at –18°C were calculated as a way to experimentally corroborate the rate values at this temperature which is commonly used in the frozen food industry. According to these results, experimental rate values at –18°C for vitamin C (–0.14E-07±3.1E-07 g/100 g day) and for antioxidant capacity (–0.051±0.02 AA/100 g) had no significant differences (95% of confidence) compared with those estimated from the Equation 2, that is –0.10E-07±3.2E-07 AA/100 g and 0.015±0.02 AA/100 g for vitamin C and antioxidant capacity, respectively (in the whole experiment time).
If we consider that a loss of 30% of vitamin C content is a condition to determine the shelf life of a fruit pulp [28], then the shelf life of rose hip pulp (calculated from the Equations 1 to 2) can be established in 129.09 days at –5°C, 276.4 days at –10°C, 418.7 days at –15°C, 544.5 days at –18°C, and 611.5 days at –20°C. Similarly, if the loss of 50% of the antioxidant capacity of the pulp can be considered as a limit value, the shelf life of the rose hip pulp can be established to be 38.4 days at –5°C, 59.8 days at –10°C, 163.2 days at –15°C, 329.8 days at –18°C, and 565.9 days at –20°C.
4Conclusion
The kinetic of vitamin C content, phenols content, antioxidant capacity, and other quality indexes in rose hip pulp stored at four temperatures (–5°C, –10°C, –15°C and –20°C), were monitored and successfully fit the Weibull model. Despite the differences in the n values, the degradation of vitamin C in rose hip pulp during frozen storage was lower than that of the antioxidant capacity at the same storage temperature. Kinetics rate for vitamin C and antioxidant capacity, calculated from the Weibull model, satisfactorily correlated with the frozen storage temperature using the log-logistic model. No significant differences were detected between the predicted and experimental rates at –18°C for vitamin C and for antioxidant capacity, respectively. Because rose hip is mainly demanded by consumers for its great antioxidant potential, and considering an accepted loss in this capacity of 50% in storage, then the shelf life of rose hip pulp could be established in 329.8 days at –18°C.
Conflict of interest
The authors have no conflict of interest to report.
Acknowledgments
This research was supported by the project FONDECYT-Chile N°1160717.
References
[1] | Reddy CVK , Sreeramulu D , Raghunath M , Antioxidant activity of fresh and dry fruits commonly consumed in India. Food Research International. (2010) ;43: (1):285–288. |
[2] | Chen SJ , et al., Anti-prediabetic effect of rose hip (Rosa canina) extract in spontaneously diabetic Torii rats. Journal of the Science of Food and Agriculture. (2017) ;97: (12):3923–3928. |
[3] | Espinoza T , et al., Physical and chemical properties importance of Rose hip (R. canina, R. rubiginosa): a review. Scientia Agropecuaria. (2016) ;7: (1):67–78. |
[4] | Nagatomo A , et al., Evaluation of genotoxicity and subchronic toxicity of standardized rose hip extract. Human & Experimental Toxicology. (2018) ;37: (7):725–741. |
[5] | Alp S , et al., Bioactive Content of Rose Hips of Different Wildly Grown Rosa dumalis Genotypes. Notulae Botanicae Horti Agrobotanici Cluj-Napoca. (2016) ;44: (2):472–476. |
[6] | Gehrcke M , et al., Enhanced photostability, radical scavenging and antitumor activity of indole-3-carbinol-loaded rose hip oil nanocapsules. Materials Science & Engineering C-Materials for Biological Applications. (2017) ;74: :279–286. |
[7] | Ilyasoglu H , Characterization of Rosehip (Rosa Canina L.) Seed and Seed Oil. International Journal of Food Properties. (2014) ;17: (7):1591–1598. |
[8] | Marmol I , et al., Therapeutic Applications of Rose Hips from Different Rosa Species. International Journal of Molecular Sciences. (2017) ;18: (6). |
[9] | Nadpal JD , et al., Phytochemical composition and in vitro functional properties of three wild rose hips and their traditional preserves. Food Chemistry. (2018) ;241: :290–300. |
[10] | Sagdic O , et al., Bioactive and rheological properties of rose hip marmalade. Journal of Food Science and Technology-Mysore. (2015) ;52: (10):6465–6474. |
[11] | Stanila A , et al., Extraction and Characterization of Phenolic Compounds from Rose Hip (Rosa canina L.) Using Liquid Chromatography Coupled with Electrospray Ionization – Mass Spectrometry. Notulae Botanicae Horti Agrobotanici Cluj-Napoca. (2015) ;43: (2):349–354. |
[12] | Turek K , Domagala J , Wszolek M , FATTY ACID PROFILE AND OXIDATION TESTS OF FAT EXTRACTED FROM YOGURT USING ROSE HIP SEED OIL. Acta Scientiarum Polonorum-Technologia Alimentaria. (2018) ;17: (1):51–58. |
[13] | Cavalera M , et al., Rose hip supplementation increases energy expenditure and induces browning of white adipose tissue. Nutrition & Metabolism. (2016) ;13: . |
[14] | Hoffmann JF , et al., Stability of bioactive compounds in butiá (Butia odorata) fruit pulp and nectar. Food Chemistry. (2017) ;237: :638–644. |
[15] | Sebastiany E , et al., LOSS OF VITAMIN C DURING THE STORAGE OF WEST INDIAN CHERRY FROZEN PULP. Boletim Do Centro De Pesquisa De Processamento De Alimentos. (2009) ;27: (2):281–288. |
[16] | De Souza Schmidt Goncalves AE , Lajolo FM , Genovese MI , Chemical Composition and Antioxidant/Antidiabetic Potential of Brazilian Native Fruits and Commercial Frozen Pulps. Journal of Agricultural and Food Chemistry. (2010) ;58: (8):4666–4674. |
[17] | Koczka A , et al., Total Polyphenol Content and Antioxidant Capacity of Rosehips of Some Rosa Species. Medicines. (2018) ;5: (3):1–10. |
[18] | Quevedo R , et al., Correlation of the fractal enzymatic browning rate with the temperature in mushroom, pear and apple slices. Lwt-Food Science and Technology. (2016) ;65: :406–413. |
[19] | Fujita A , et al., Impact of spouted bed drying on bioactive compounds, antimicrobial and antioxidant activities of commercial frozen pulp of camu-camu (Myrciaria dubia Mc. Vaugh). Food Research International. (2013) ;54: (1):495–500. |
[20] | Van de Velde F , et al., Quantitative comparison of phytochemical profile, antioxidant, and anti-inflammatory properties of blackberry fruits adapted to Argentina. Journal of Food Composition and Analysis. (2016) ;47: :82–91. |
[21] | Bastias JM , et al., Determining the effect of different cooking methods on the nutritional composition of salmon (Salmo salar) and chilean jack mackerel (Trachurus murphyi) fillets. Plos One. (2017) ;12: (7). |
[22] | Quevedo R , et al., Differences Between the Order Model and the Weibull Model in the Modeling of the Enzymatic Browning. Food and Bioprocess Technology. (2016) ;9: (11):1961–1967. |
[23] | Peleg M , Normand M , Corradini M , The Arrhenius Equation revisited. Critical Review Food Science and Nutrition. (2012) ;52: (9):830–851. |
[24] | Peleg M , et al., Non-Arrhenius and non-WLF kinetics in food systems. Journal of the Science of Food and Agriculture. (2002) ;82: (12):1346–1355. |
[25] | Valente A , et al., Development of an orange juice in-house reference material and its application to guarantee the quality of vitamin C determination in fruits, juices and fruit pulps. Food Chemistry. (2014) ;154: :71–77. |
[26] | Gouvea RF , et al., Effect of enzymatic treatment on the rheological behavior and vitamin C content of Spondias tuberosa (umbu) pulp. Journal of Food Science and Technology-Mysore. (2017) ;54: (7):2176–2180. |
[27] | Schlueter AK , Johnston CS , Vitamin C: Overview and Update. Journal of Evidence-Based Complementary & Alternative Medicine. (2011) ;16: (1):49–57. |
[28] | Dermesonlouoglou EK , Giannakourou M , Taoukis PS , Kinetic study of the effect of the osmotic dehydration pre-treatment with alternative osmotic solutes to the shelf life of frozen strawberry. Food and Bioproducts Processing. (2016) ;99: :212–221. |
[29] | Guerrero J , et al., Antioxidant capacity, anthocyanins, and total phenols of Wild and cultivated berries in chile. Chilean Journal of Agricultural Research. (2010) ;70: (4):537–544. |
[30] | Hassimotto NMA , Genovese MI , Lajolo FM , Antioxidant capacity of Brazilian fruit, vegetables and commercially-frozen fruit pulps. Journal of Food Composition and Analysis. (2009) ;22: (5):394–396. |
[31] | Patel S , Rose hip as an underutilized functional food: Evidence-based review. Trends in Food Science & Technology. (2017) ;63: :29–38. |
[32] | Csepregi K , et al., Postharvest UV-A and UV-B treatments may cause a transient decrease in grape berry skin flavonol-glycoside contents and total antioxidant capacities. Phytochemistry Letters. (2019) ;31: :63–68. |


