
Changes in fruit maturity indices and growth pattern along the harvest season in seedless barberry under different altitude conditions
Abstract
BACKGROUND:
Barberry fruit is an important source of anthocyanin, and strongly uses for Zereshk Poloee, a delicious diet in Iran.
OBJECTIVE:
We are trying to find how fruit quality of barberry is affected under different locations and if sooner harvesting may be possible, which encouraged us to do these studies.
METHODS:
The present study was conducted in three different locations (Marvak, Marak and Amirabad with 2079, 1648 and 1480 m altitude) around Birjand, Iran. Fruit sampling was done 66, 98, 122, 155 days after full bloom (DAFB) and also in economical harvesting (EH) date.
RESULTS:
The results showed that berry number, fruit fresh weight (FW) and dry weight (DW), juice weight and volume, pH, total acidity (TA), total soluble solids (TSS), maturity index, anthocyanin and total phenols significantly changed with advancement of growing season under different climatic conditions. Interactive effect of sampling time×location indicated the highest pH in Marak and Amirabad and the highest TSS and TSS/TA ratio in Amirabad in EH, and the highest phenols in Marak in 155 DAFB and EH. The highest anthocyanin content accumulated in Marvak, exactly in EH. Using changes in FW, DW and volume of fruit, a double-sigmoidal curve observed for barberry fruit growth.
CONCLUSION:
Regarding to obtained data and specially anthocyanin accumulation, we propose regions with higher altitude for seedless barberry cultivation and production because of earlier harvest with more qualified fruit.
1Introduction
Nowadays, seedless barberry (Berberis vulgaris L.) has received much attention because of its high level of medicinal properties. This is a medicinal shrub, dicotyledonous and perennial [1, 2], which is cultivated as a domestic plant in south Khorasan province of Iran, since more than 200 years ago. Seedless barberry is an important source of anthocyanin pigments [3]. There are some factors affecting fruit growth and development including cultivar, climate conditions and maturity degrees. Maturity level is an important factor affecting fruit quality [4, 5]. Among climatic factors, temperature is very important and significantly affects some aspects of plant growth and development [6]. It was showed that altitude has significant effects on fruit quality of mandarins [7] and ‘pineapple’ guava [8]. There is some evidence about positive effects of cool temperatures on increase of total soluble solids in barberry [9], anthocyanin accumulation in grapevine [10, 11] and improvement of surface color in pomegranate fruit [12]. The average night-temperature is more closely correlated to amount of pigments in fruits, compared with the average day-temperature. Anthocyanin biosynthesis has different patterns including a) accumulation in both skin and flesh, b) accumulation in only skin and c) accumulation in skin as responding to light stimulus [13]. About barberry fruit, and based on findings by Rezvani Moghaddama et al. [3] and Maraki et al. [14], it seems that accumulation of anthocyanin begins with fruit growth stopping (in September), and continues to harvesting time. Harvest time also significantly influences fruit quality parameters. Wang et al. [15] found that immature raspberry fruit has lower TSS and anthocyanin, higher total acidity (TA) and phenols, compared to mature fruits. Rezvani Moghaddama et al. [3] observed that late harvesting lead to more TSS, anthocyanin and pH values in barberry fruit. In pomegranate fruit, results showed that late harvesting resulted to higher fruit weight, juice volume, TSS and anthocyanin content, however, phenols and TA decreased [12]. Personal experiences showed that fruit quality of barberry in some location is higher than others that also lead to earlier harvesting, however, no data was found in this regard. Moreover, there is no report about effects of altitude levels on growth and quality of barberry fruit. In addition, no data was observed on fruit growth curve of barberry. So, the main aims of this experiment were 1) to evaluate the changes in fruit quality during growth season, under different altitude conditions and 2) to determine fruit growth curve of barberry.
2Material and methods
2.1Plant selection, heat unit measurement and sampling times
This experiment was conducted on 20-years old seedless barberry (Berberis vulgaris L.) trees, in different commercial plantations (Tables 1 and 2) of south Khorasan, Iran, during 2015 and 2016 growing seasons. Study was done on 189 uniform trees (150±20 cm height), planted in 3-4 m×2-3 m space. All conventional farm management, pruning, irrigation, and fertilization and manuring were done as needed. Just one-year data presented here, because of high volume of data and also similar trend in both years. Planting soil was deep and loamy. Full bloom and fruit set were recorded during growing season (Table 3). Heat units calculated using temperature data from nearest weather station and data logger (Extech Instruments, Model RHT20, Humidity and Temperature Data logger, USA), based on Wein [16] (1997) as followed:
Table 1
Characteristics of different locations in this experiment
| Location | Latitude | Altitude (m) | Mean Temperature (°C) | Soil | |||
| Yearly | Day | Night | pH | EC (dS/m) | |||
| Marvak | 33°7.5’N | 2079 | 20.49 | 23.87 | 16.94 | 8.17 | 17.62 |
| Marak | 32°58.09’N | 1648 | 23.34 | 31.97 | 14.69 | 7.50 | 16.70 |
| Amirabad | 32°56’N | 1480 | 25.01 | 30.54 | 22.82 | 7.80 | 16.72 |
Altitude represents rising of each location above the sea level. Mean temperatures obtained from data logger and the nearest weather station.
Table 2
Temperature related parameters (Monthly, day, night, and difference between day and night mean temperatures) of different locations in this experiment in 2016
| Location | Mean T | Month | ||||||
| Apr. | May | Jun. | Jul. | Aug. | Sep. | Oct. | ||
| Marvak | Monthly | 21.10 | 20.70 | 22.80 | 25.00 | 20.20 | 20.90 | 12.70 |
| Marak | 15.40 | 19.50 | 26.65 | 28.20 | 27.70 | 24.00 | 21.90 | |
| Amirabad | 16.85 | 21.25 | 28.15 | 29.80 | 29.80 | 26.20 | 23.00 | |
| Marvak | Day | 25.88 | 24.24 | 26.46 | 28.68 | 22.76 | 23.83 | 15.21 |
| Marak | 22.80 | 27.50 | 35.60 | 36.50 | 36.30 | 34.10 | 31.00 | |
| Amirabad | 25.66 | 34.12 | 36.09 | 34.62 | 32.97 | 27.79 | 22.50 | |
| Marvak | Night | 14.58 | 17.63 | 19.33 | 21.44 | 17.34 | 17.81 | 10.46 |
| Marak | 8.00 | 11.50 | 17.70 | 19.80 | 19.20 | 13.90 | 12.70 | |
| Amirabad | 15.77 | 22.38 | 28.33 | 27.56 | 22.52 | 24.26 | 18.90 | |
| Marvak | Day & night | 11.30 | 6.61 | 7.13 | 7.24 | 5.42 | 6.02 | 4.75 |
| Marak | difference | 14.80 | 16.00 | 17.90 | 16.70 | 17.10 | 20.20 | 18.30 |
| Amirabad | 9.89 | 11.74 | 11.09 | 10.79 | 10.45 | 17.50 | 18.30 | |
Mean T represents mean temperature; Difference represents any difference between day and night temperatures calculating as followed: day-night; difference of day and night temperature calculated via subtraction of night from date temperature.
Table 3
Accumulated heat units (growing degree hours) in each location during the growing season and each harvest date
| Location | Full bloom | Fruit set time | Days after full bloom | Accumulative heat unit (GDH) |
| 66 | 613.0 | |||
| 98 | 988.3 | |||
| Marvak | 8-May-2016 | 19-May-2016 | 122 | 1177.7 |
| 155 | 1426.7 | |||
| 168 (E.H.) | 1438.0 | |||
| 66 | 1011.6 | |||
| 98 | 1507.8 | |||
| Marak | 19-April-2016 | 3-May-2016 | 122 | 1889.0 |
| 155 | 2234.8 | |||
| 186 (E.H.) | 2287.5 | |||
| 66 | 1183.0 | |||
| 98 | 1828.5 | |||
| Amirabad | 13-April-2016 | 25-April-2016 | 122 | 2314.7 |
| 155 | 2767.8 | |||
| 191 (E.H.) | 2808.4 |
GDH: growing degree hours, E. H.: Economical harvesting time.
T base was the threshold temperature where plant growth started. Regarding to experiments conducted with Maraki et al. [14] and our findings in different locations, Tbase for barberry fruit was 11 °C. Cumulative heat units calculated via adding all heat units. Fruit sampling were done on 66, 98, 122 and 158 days after full bloom (DAFB) and also in economical harvest for each region (E.H.;168 DAFB for Marvak, 186 DAFB for Marak, 191 DAFB for Amirabad), to monitor different fruit characteristics. Five shoots on each tree were chosen.
2.2Measurement of fruit characteristics
Hand-picked fruits transported to Horticultural Lab, University of Birjand, Iran, for more concise evaluations. Many samples of 100 berries were prepared and used for assessments. Berry number (BN) in each cluster, fruit fresh weight (FW), fruit dry weight (DW), fruit volume (FV), chlorophylls a, b and carotenoid were evaluated on 66, 98, 122, 158 DAFB and also in economical harvest. Juice weight and volume, total soluble solids (TSS), total acidity (TA) and their ration (maturity index or TSS/TA juice pH, anthocyanin concentration and total phenol evaluated just on 122 and 158 DAFB and on economical harvesting time in each location. FW and DW assessed with a concise balance with 0.0001 accuracy, FV with method of replacing water, Chlorophyll a and b and carotenoid calculated using method of Arnon [17]. Juice obtained from 100 berries applied for volume and weight. TSS estimated with hand-refractometer (Extech, RF10)., TA determined based on citric acid using method of Williams [18]. pH evaluated with digital pH meter (Mettler Toledo, Switzerland). Determination of spectroscopy-based anthocyanin was performed based on the pH difference. The method consists of two buffer systems including potassium chloride and sodium acetate. A 0.025 M solution of potassium chloride buffer with pH = 1 was produced using HCl. A 0.4 M solution of sodium acetate buffer with pH = 4.5 was produced using acetic acid. Anthocyanin content was estimated as pelargonidin 3-glucoside at 510 nm, and data showed as mg/100 g FW [19]. Estimating total phenol, one g of pulp powder was dissolved in 10 ml of 70% (v/v) aqueous methanol (Merck KGaA, Darmstadt, Germany), shaked for 2 h at room temperature, and centrifuged at 4,000×g for 10 min. Consequently, the supernatant was separated from the solid particles. Total phenols (TPC) was estimated using Folin-Ciocalteau’s (FC) assay with some modifications [20]. A volume of 450μl of distilled water was added to 50μl of prepared extract. Then 250μl of 1 N FC reagent (FC, Merck KGaA, Darmstadt, Germany) was added, vortex-mixed and left to stand for 5 min. Next, 1.25 ml of Na2CO3.10H2O (20% , Merck KGaA, Darmstadt, Germany) was added to the mixture and incubated for 40 min under dark conditions in room temperature. Finally, the absorbance was measured at 725 nm using a spectrophotometer (BIOSPEC 1601, SHIMADZU, TOKYO, JAPAN). A calibration curve was prepared using different concentrations of gallic acid (Merck KGaA, Darmstadt, Germany) and results were expressed as mg gallic acid/ 100 g DW [20].
2.3Determination of fruit growth pattern
Fruit growth pattern was evaluated during full bloom to economical harvesting. The date of full bloom was considered to be when 80% of the flowers of the tree were opened (Table 3). Fruit samples were taken several times during growth season, started 66 days after full bloom (DAFB) and repeated in dates 32, 56, 92, 102 and E.H (date 102 in Marvak, date 120 in Marak and date 125 in Amirabad), to determine the growth. First fruit collection was performed based on Table 3, when measurable fruit formation occurred. Fruit FW, DW and volume, juice weight and volume, TSS and TA were evaluated on 500 berries based on methods showed above.
2.4Experimental design and data analysis
The experiment was conducted as factorial (3×5) based on complete block design, with 3 different locations and 5 different harvesting (sampling) times. Three replications, with 21 trees in each, was used (63 trees for each location). Statistical analysis of data was performed using ANOVA to determine statistical differences at P < 0.05 and LSD was used for mean comparison. All statistical analyses were performed using SAS version 9.1. Regression analysis was done using excel software.
3Results and discussion
3.1Evaluation of the effects of sampling date and location on growth and quality
The full bloom (FB) time was different for studied locations and earlier FB observed in Amirabad, followed by Marak and Marvak. Earlier fruit set obtained in Amirabad (12 DAFB), followed by Marak (14 DAFB) and Marvak (11 DAFB). The season length (from full bloom to economical harvest) ranged from 168 days in Marvak to 191 days in Amirabad. Moreover, different heat unit (HU) accumulated in each location and the highest and lowest HU observed in Amirabad and Marvak, respectively (Table 3).
Simple effect of location and sampling time were not significant on chlorophyll a, b and carotenoid contents (data not shown). Results (Table 4) expressed significant reduction in berry number per bunch (BN) about 6.57% in two-final harvesting times, compared with first sampling (66 DAFB). Berry number is related to the number of any meristems formed previously, and many factors such as fruitlets abscission may be effective. The highest BN observed with Marvak (by 12.36% more than Amirabad), which may be related to higher ovule longevity and better fruit setting. As season progressed, an increasing trend observed in fruit FW, fruit DW and fruit volume (FV) that was in agreement with Arena and Curvetto [21] and Rezvani Moghaddam et al. [3] on barberry, and may be resulted from photosynthetic activities, assimilate transport into fruits, biomass accumulation within berries, and fruit growth and development. Regression analysis indicated an exponential increment for FW, DW and FV in all locations, as more heat unit accumulated (Figs. 1–3). Although approximately 3.5 times increase in FW obtained between dates 66 and E.H., however, not significant changes observed in fruit FW since date 155 onward. The highest values for fruit FW and DW observed in Marak (5.03 g FW) and Amirabad (1.43 g DW), respectively. FW differences between Marvak (lower FW) and Marak (higher FW) was 102% , and DW between Marvak (lower DW) and Amirabad (higher DW) was 53.76% . From date 66 to 155, a significant increase observed in FW/DW, however, a reducing trend indicated then after. The highest FW/DW obtained in Marak (4.30), compared with others (Table 4) that may be related to more juice content or lower biomass accumulation within berries. Fruit volume significantly increased from date 66 to E.H. and the highest volume observed in Marvak, compared with other locations (Table 4). Sugiura et al. [22] and Candir et al. [23] on persimmon found that cool night is responsible for more fruit growth and development. However, based on regression analysis (Figs. 1–3), we suggest the effectiveness of cumulative heat unit on barberry fruit growth and development. Interaction between location and harvesting time on chlorophyll a, b and carotenoid content of fruits, BN, FW and DW of fruit, were not significant (data not shown).
Fig.1
Changes of fruit FW based on heat unit accumulation.
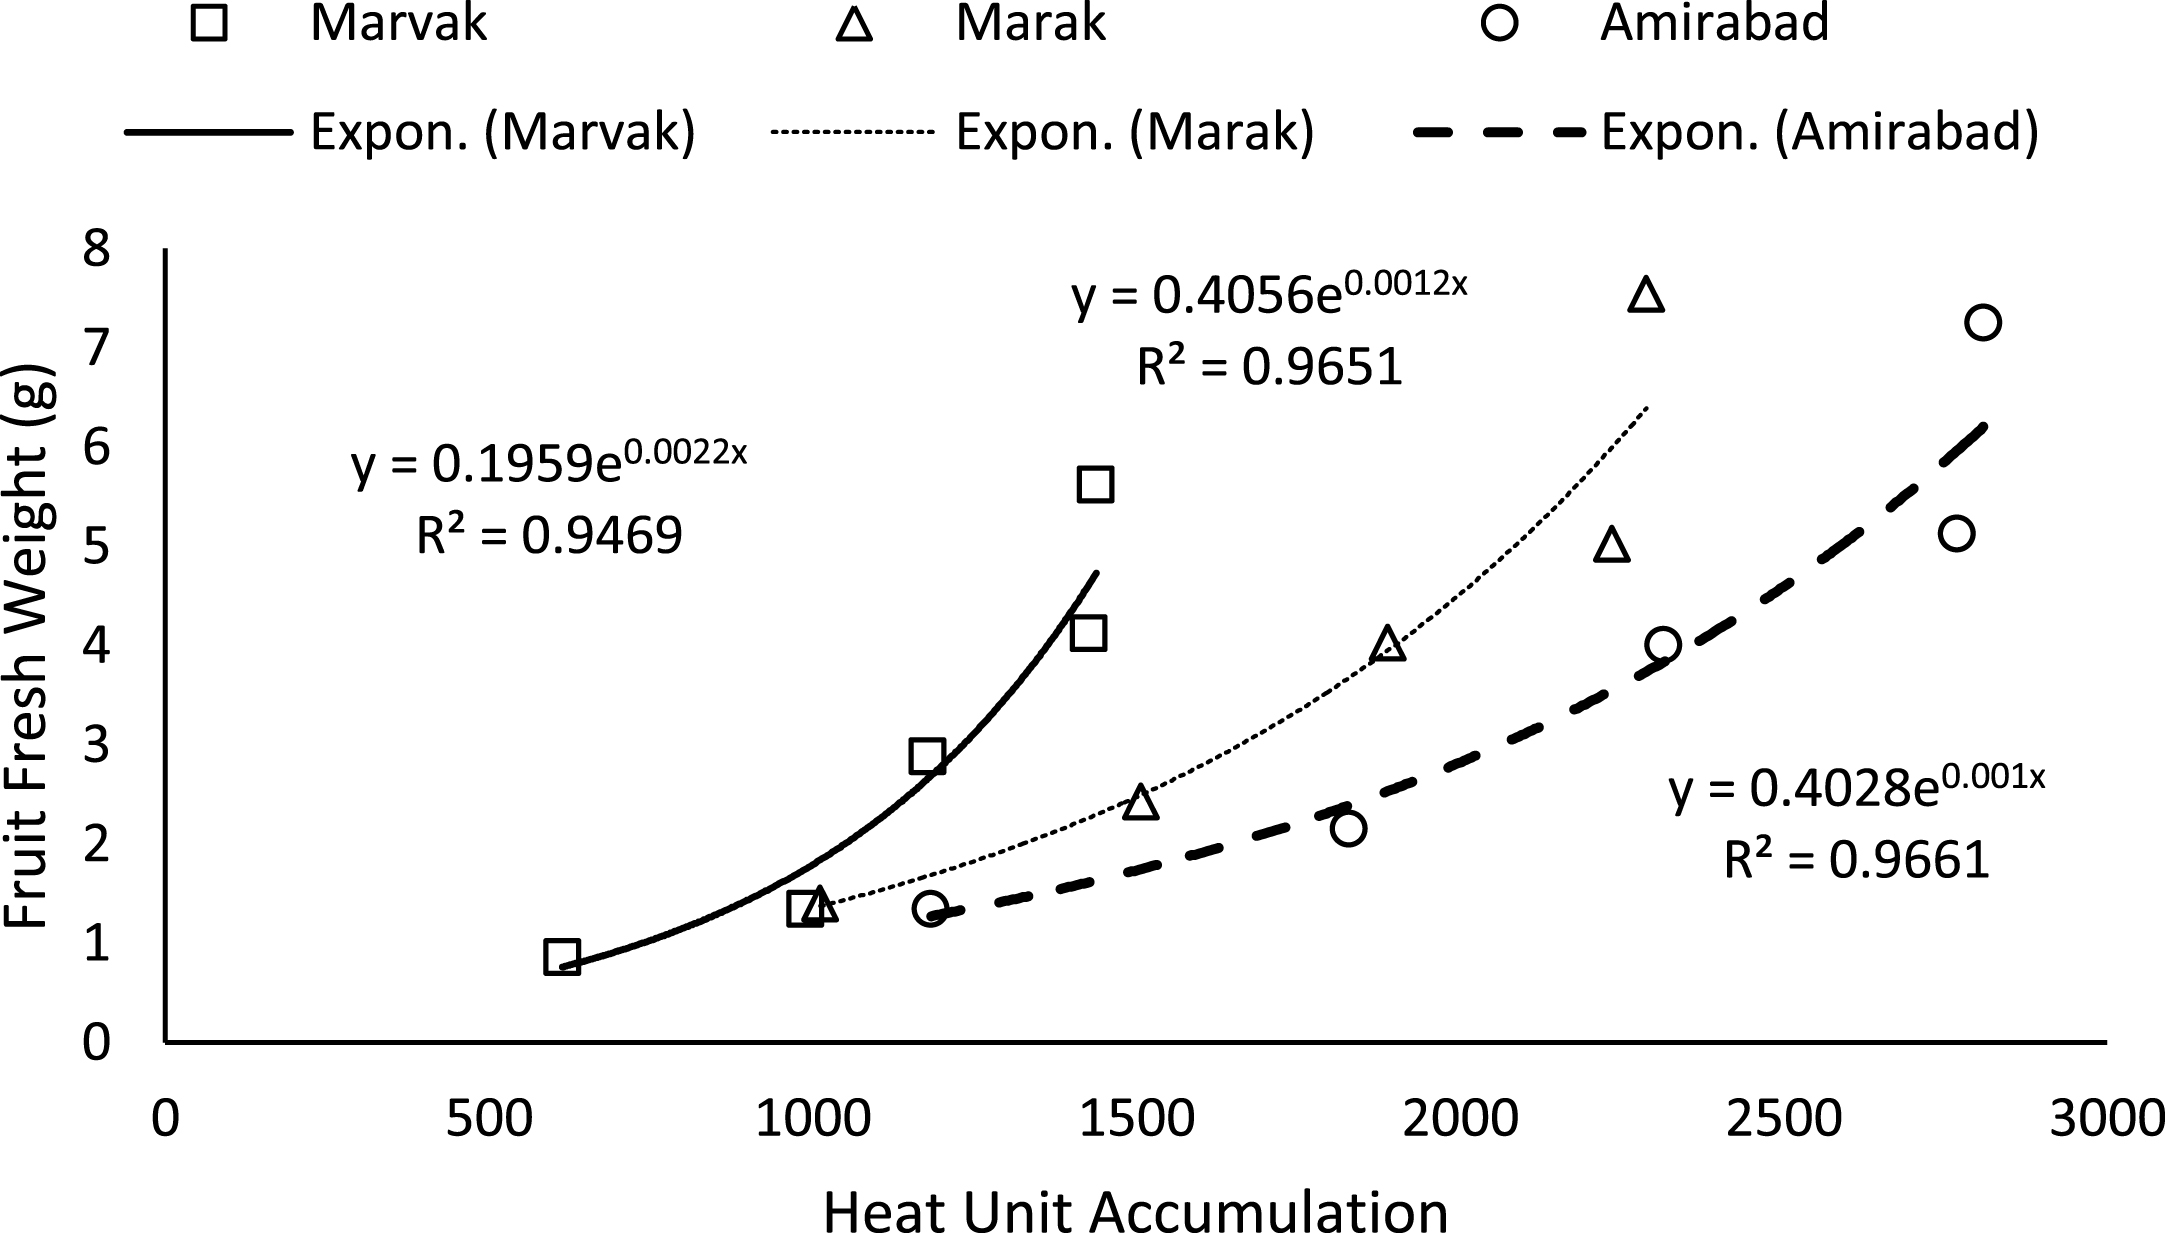
Fig.2
Changes of fruit FD based on heat unit accumulation.
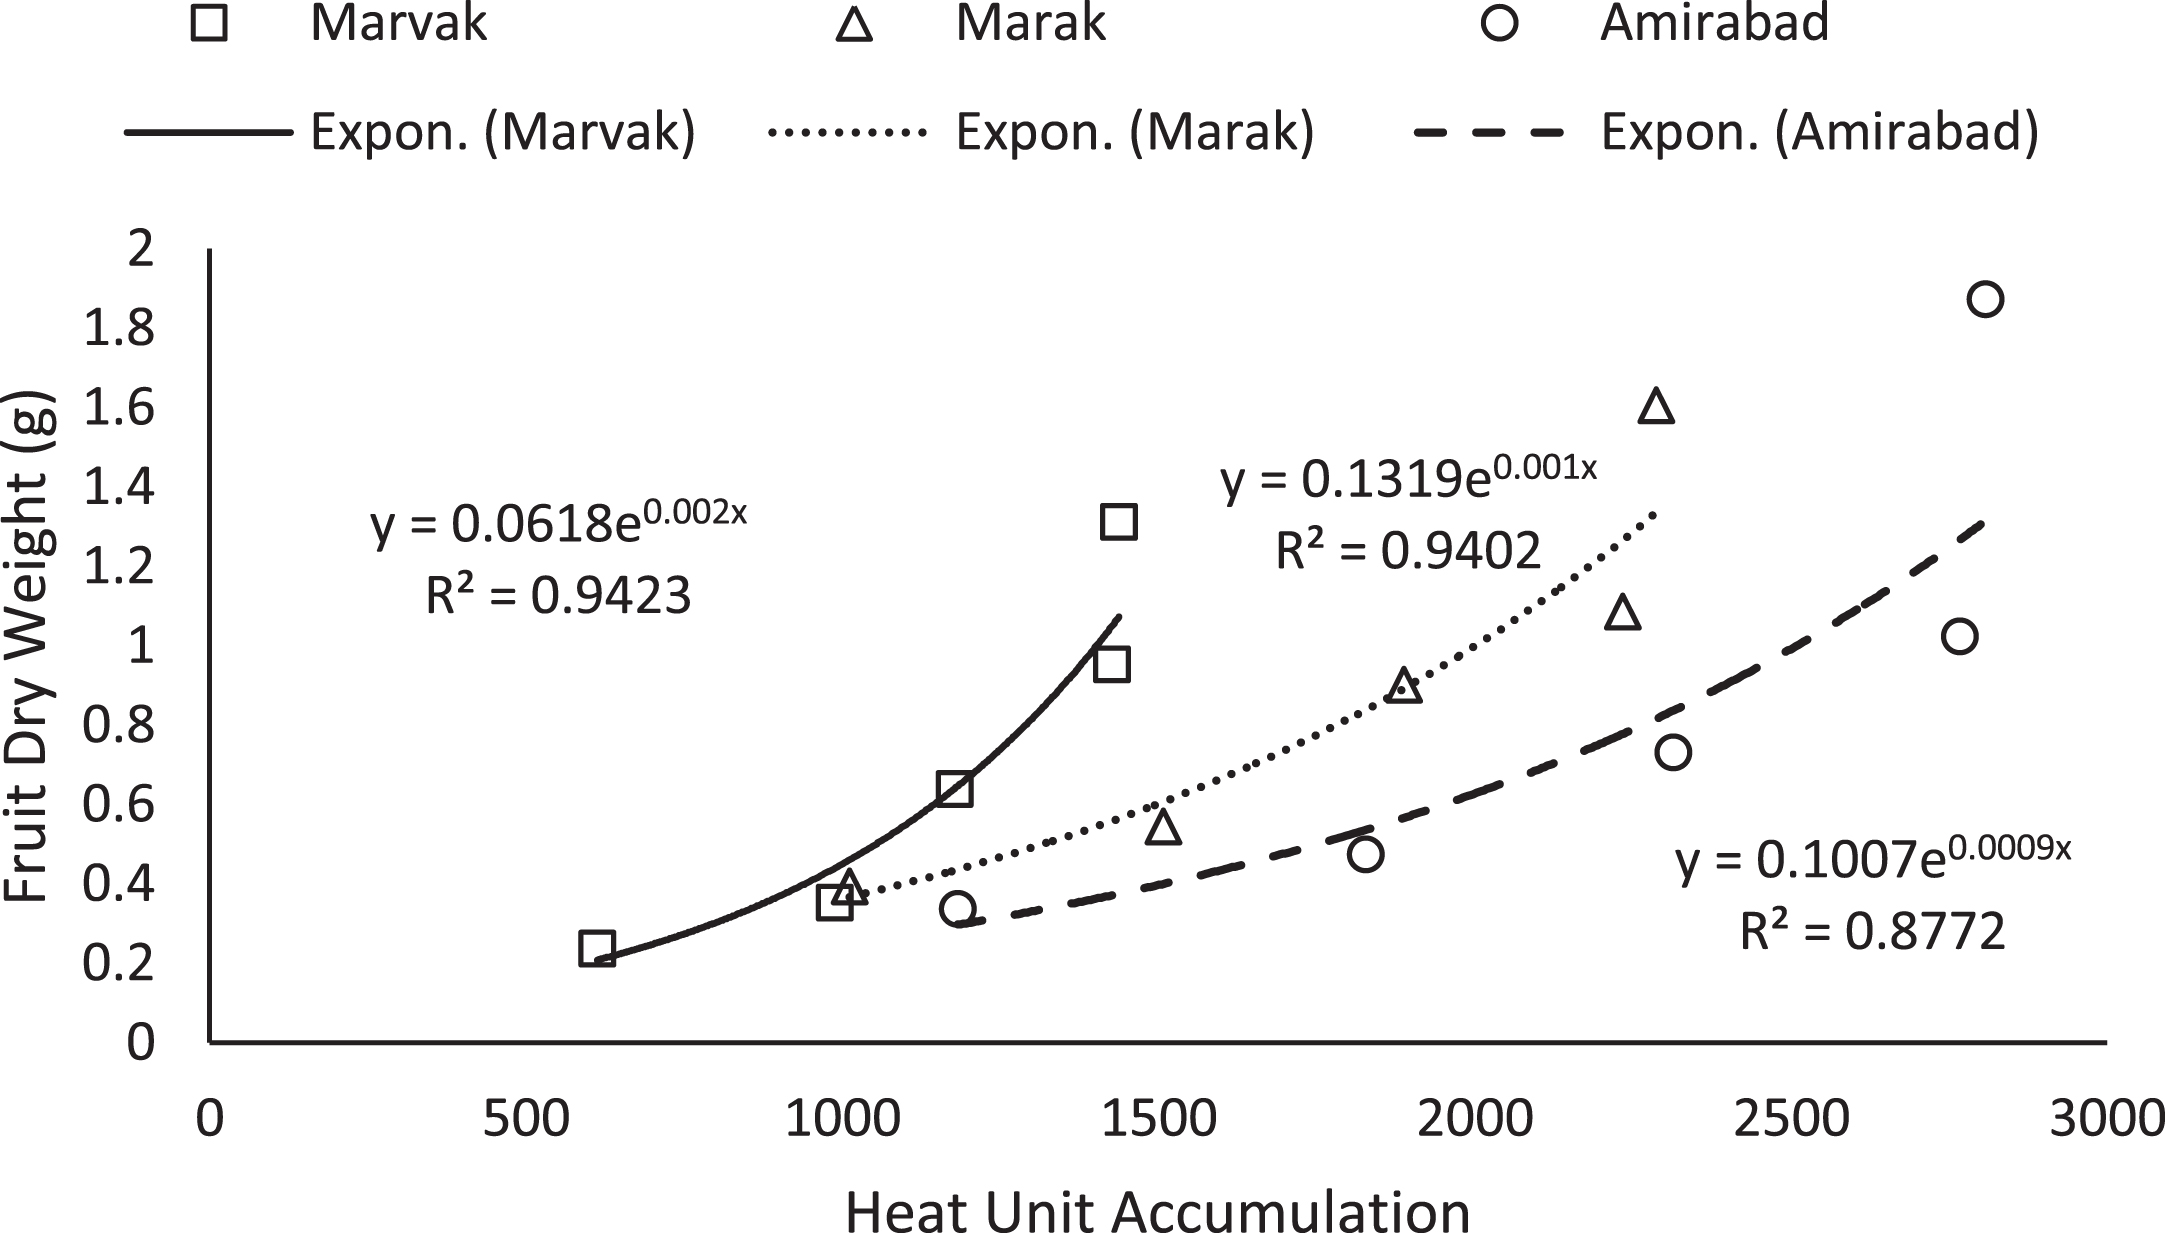
Fig.3
Changes of Fruit volume based on heat unit accumulation.
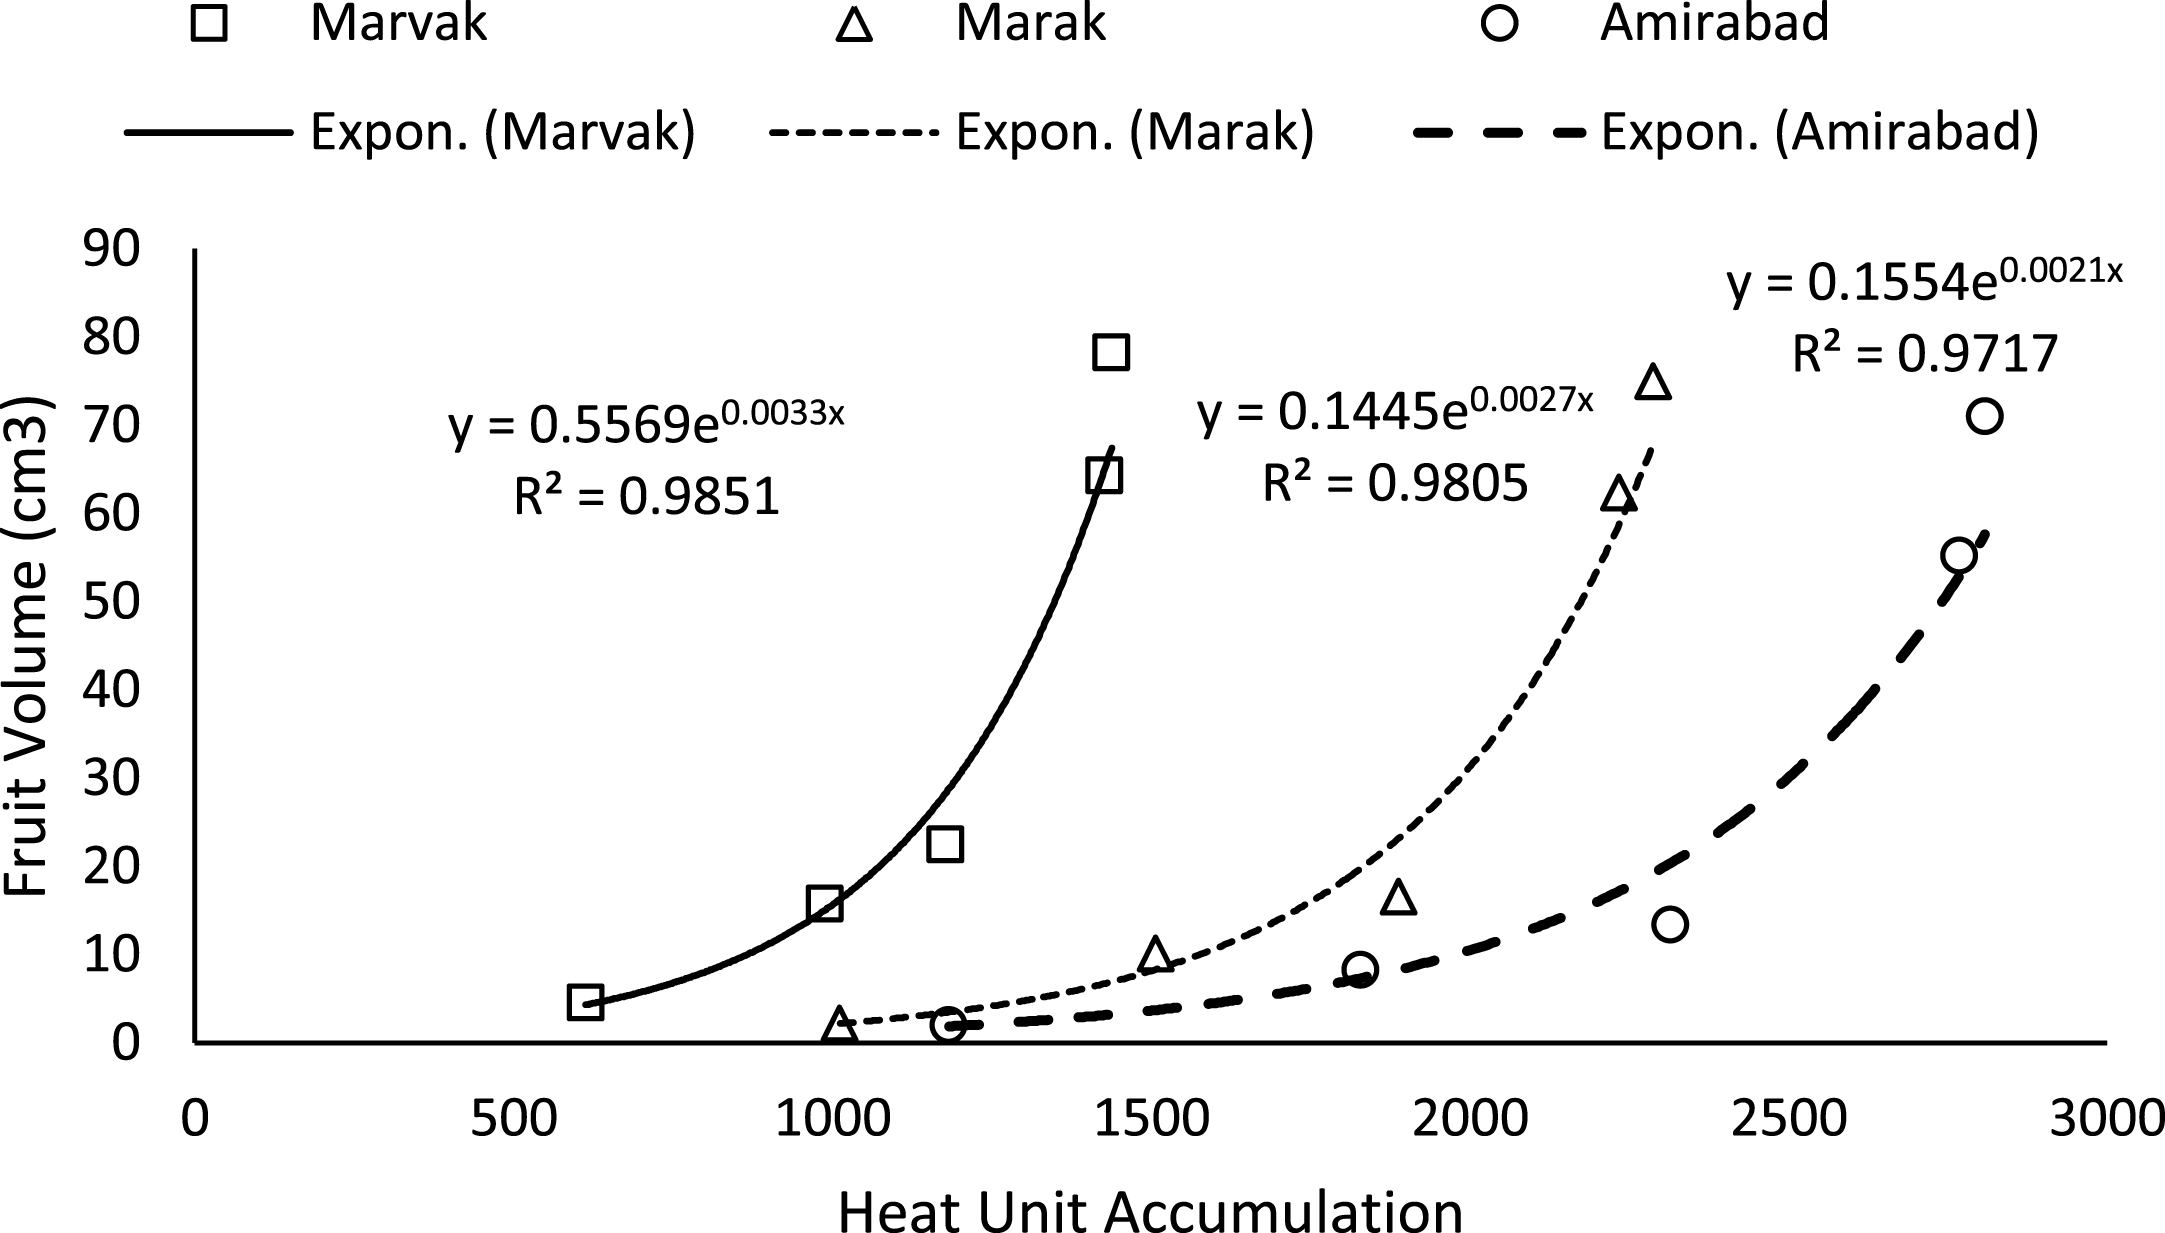
Table 4
Changes in berry number, fruit weight and volume of barberry under different locations and during growing season
| Variable | Berry Number Per Bunch | Fruit F.W. of 100 fruits (g) | Fruit D. W. of 100 fruits (g) | F. W./D. W. ratio | Fruit V. of 100 fruits (ml) |
| Sampling Time (DAFB) | |||||
| 66 | 27.83a | 1.20b | 0.32d | 3.75c | 8.67e |
| 98 | 29.00a | 1.98b | 0.46c | 4.30b | 34.06d |
| 122 | 28.83a | 3.64a | 0.76c | 4.79a | 52.39c |
| 155 | 26.08b | 4.93a | 1.07b | 4.61a | 181.86b |
| Economical H. | 26.00b | 5.39a | 1.46a | 3.69c | 224.22a |
| Location | |||||
| Marvak | 29.69a | 2.49c | 0.93c | 2.68b | 37.05a |
| Marak | 27.38b | 5.03a | 1.17b | 4.30a | 33.24b |
| Amirabad | 26.02b | 4.35b | 1.43a | 3.04b | 29.95b |
DAFB: days after full bloom in which 50% flowers are open; Economical H: economical harvesting in each location; F. W.: fresh weight; D. W.: dry weight; Fruit V.: fruit volume. Mean values in each column followed by the same letter are not significantly different by the LSD (P < 0.05).
Earlier harvesting could be done, because of no significant change of juice volume and density between dates 155 and E.H. On the other hand, juice weight (JW) significantly increased with season progression (by 94.10% between 122 and E.H) and the highest JW observed on E.H. which may be related to solid accumulation within berries. Regarding to locations, the highest juice weight (by 69.68% higher than Marvak) and volume (by 66.02% higher than Marvak) observed in Amirabad, followed by Marak (by 28.57% juice weight and by 26.69% juice volume higher than Marvak) and Marvak (Table 5).
Table 5
Changes in juice related characteristics of barberry under different locations and during growing season
| Variable | Juice weight of 100 fruits (g) | Juice Volume of 100 fruits (ml) | Juice density of 100 fruits (mg/ml) |
| sampling time (DAFB) | |||
| 122 | 6.78c | 7.38b | 0.9115b |
| 155 | 12.11b | 11.29a | 1.0707a |
| Economical Harvest | 13.16a | 12.08a | 1.0903a |
| Location | |||
| Marvak | 8.05c | 7.83c | 1.0137a |
| Marak | 10.35b | 9.92b | 1.0182a |
| Amirabad | 13.66a | 13.00a | 1.0406a |
DAFB: days after full bloom in which 50% flowers are open. Mean values in each column followed by the same letter are not significantly different by the LSD (P < 0.05).
As season progressed, an elevating trend observed in pH (by 18.93%), TSS (by 46.24%) and TSS/TA (by 741.28%) that was in agreement with Rezvani Moghaddam et al. [3] on barberry. TA significantly decreased with season progression (by 86%) that was in agreement with Candir et al. [23] on persimmon, Rezvani Moghaddam et al. [3] on barberry and Kulkarni and Aradhya [24] on pomegranate fruit (Table 6). On date 122, an acceptable taste with approximately 15% TSS and 0.5% TA observed that was in agreement with Rezvani Moghaddam et al. [3] on barberry, however, better quality (higher TSS and lower TA) obtained as season progressed (E.H.). Biale [25] on evaluation of some tropical and subtropical fruits suggested that any increases in TSS attributed to starch hydrolysis into simple sugars. These components are produced from hydrolyzing sucrose to glucose and fructose [21]. Reduction of TA was coincided with TSS increment that was in agreement with Kulkarni and Aradhya [24] on pomegranate fruit. Yoon et al. [26, 27] on apple and cherry found that there was a positive correlation between acid phosphatase activity and the TSS/TA ratio. The highest juice pH observed in Marak and Amirabad, and the highest TA obtained in Marvak and Marak. The highest TSS and TSS/TA (by 43.75% higher than Marvak and by 73.32% higher than Marak) indicated in Amirabad. Regarding to data presented in Table 2, it seems that TA significantly affected by night temperatures (R2 = 0.62) and cool nights may be the cause of higher TA in Marvak and Marak, compared with Amirabad, which was in agreement with findings of Kozai et al. [28] on passion fruit.
Table 6
Changes in pH, total acidity (TA) and Total soluble solids (TSS) of barberry under different locations and during growing season
| Variable | pH | TA (%) | TSS (%) | TSS/TA ratio |
| sampling time (DAFB) | ||||
| 122 | 2.622c | 0.5050a | 15.83c | 37.3c |
| 155 | 2.984b | 0.2177b | 20.25b | 120.0b |
| Economical H. | 3.166a | 0.0756c | 23.15a | 313.8a |
| Location | ||||
| Marvak | 2.873b | 0.3330a | 20.40b | 144.2b |
| Marak | 2.925a | 0.3072a | 17.43c | 119.6b |
| Amirabad | 2.973a | 0.1582b | 21.39a | 207.3a |
DAFB: days after full bloom in which 50% flowers are open; Economical H: economical harvesting in each location. Mean values in each column followed by the same letter are not significantly different by the LSD (P < 0.05).
Interaction between location and harvest time showed significant influence on pH, TA, TSS and TSS/TA (Table 7). The highest juice pH obtained in Marak and Amirabad on date E.H. (date 186 and 191, respectively), which resulted to sourest berries in Marvak (by 4% more than Marak and by 4.3% more than Amirabad). This results were in agreement with findings of Chandra and Todaria [29], Arena and Curvetto [21] and Rezvani Moghadam et al. [3]. Disregard to location, the lowest TA showed in final harvesting (date 168 and 186 for Marvak and Marak, respectively, and date 155 and 191for Amirabad). It is clear that produced fruits in Marvak and Marak are less acidy on E.H., however reducing acidity started earlier in Amirabad (since date 155). The highest TSS observed in Marvak (24.45%) and Amirabad (24.55%) and the lowest rate indicated in Marak (20.45%) that may be related to late accumulation of soluble solids in fruits. On the other hand, the highest TSS/TA ratio observed in Amirabad on date 191, followed with Marvak (on date 168) and Marak (on date 186). TSS/TA ratio can be used as harvest index for human consumption, and the best index observed in Amirabad at later harvest (Table 7).
Table 7
Interactive effect of sampling time×location on pH, total acidity (TA) and total soluble solids (TSS) of Barberry fruit
| Variable | pH | TA (%) | TSS (%) | TSS/TA | |
| Location | Sampling Time (DAFB) | ||||
| Marvak | 122 | 2.630d | 0.7030a | 16.70d | 24.3e |
| 155 | 2.910c | 0.2145d | 20.05c | 99.7d | |
| E.H. | 3.080b | 0.0815e | 24.45a | 308.6b | |
| Marak | 122 | 2.542e | 0.5197b | 13.90e | 26.8e |
| 155 | 3.028b | 0.3260c | 17.95d | 55.2d | |
| E.H. | 3.205a | 0.0758e | 20.45c | 276.7b | |
| Amirabad | 122 | 2.693d | 0.2923c | 16.87d | 60.7d |
| 155 | 3.015b | 0.1128e | 22.75b | 205.2c | |
| E.H. | 3.213a | 0.0695e | 24.55a | 356.1a |
DAFB: days after full bloom in which 50% flowers are open; E. H.: economical harvesting in each location. Mean values in each column followed by the same letter are not significantly different by the LSD (P < 0.05).
Both anthocyanin and phenol contents (Table 8) significantly increased between dates 122 and 155, indicating that barberry fruits may be ready to harvest during this period that was in agreement with Rezvani Moghaddam et al. [3] on barberry. Anthocyanin accumulation in E.H. was 49.2 times more than date 122 (Table 8). Arena and Curvetto [21] stated that allocation of carbon into biomass is responsible of fruit growth and development. Regarding to significant changes in FW before date 122 (Table 4) and also significant changes occurred in anthocyanin since after, we suggest allocation of carbon into biosynthesis and production of secondary metabolites. The highest anthocyanin content obtained in Marvak, followed with Marak and Amirabad (by 144% and 163.10% higher than Marak and Amirabad, respectively). Koshita et al. [30] and Choi et al. [31] stated that low temperatures induce anthocyanin synthesis in various plants, although in cold temperatures, it is light dependent and in the absence of light, low temperatures prevent anthocyanin biosynthesis. Saure [32] and Marais et al. [33] found that low autumnal temperatures promote anthocyanin biosynthesis. As data showed in Table 2, cool autumnal (October) temperatures obtained in Marvak (Mean temperature of 12.70 °C). Compared to the average day temperature, average night temperature is more closely correlated to amount of fruit pigments (Table 2) in Marvak (R2 = 0.93). Recent research works demonstrated that low temperatures (15°C) increase anthocyanin content in grape berry skin synergistically with light, which important on the expression of related genes [34]. Recently, crosstalk between a sugar-induced gene and an ABA signaling gene has been reported [35]. Koshita et al. [30] found that ABA level of grapevine fruit under lower night-time temperature is two times higher than higher night-time condition. Here, an increasing trend observed with TSS and anthocyanin in Marvak, which may be related to cool night temperature and was in agreement with Hunter et al. [36] in grapevine. Total phenol content increased by 26.67% since date 122 to 155. The increment of this variable was disagreement with Kulkarni and Aradhya [24] on pomegranate and with Bashir and Abu-Goukh [37] on guava fruit. The highest phenols observed in Marak (by approximately 67% more than others), followed with Amirabad and Marvak. We think that cool night and high day-night differences in Marak (R2 = 0.87) may be responsible for more accumulation of phenols within berries (Table 8).
Table 8
Changes in anthocyanin and phenols of barberry fruit under different locations and during growing season
| Variable | Anthocyanin (mg/l) | Phenol (mg galic acid/100 g dry weight) |
| Sampling Time (DAFB) | ||
| 122 | 5.00b | 74.46b |
| 155 | 240.00a | 95.50a |
| Economical Harvest | 251.00a | 92.92a |
| Location | ||
| Marvak | 271.00a | 71.41b |
| Marak | 111.00b | 119.68a |
| Amirabad | 103.00b | 71.80b |
DAFB: days after full bloom in which 50% flowers are open. Mean values in each column followed by the same letter are not significantly different by the LSD (P < 0.05).
Interaction between location and harvest time showed the highest anthocyanin in Marvak on the final harvest, however, this variable increased with time. The highest phenol observed in Marak on dates 155 and 186 (Table 9). Some phenols are substrates for enzymatic browning. A reduction in the phenol content accompanied with fruit development, may reduce the incidence of enzymatic browning [24]. A decrease in phenol also coincided with an increase in anthocyanin pigments (Table 9).
Table 9
Interactive effect of sampling time×location on anthocyanin and phenols of Barberry fruit
| Anthocyanin (mg/100 g FW) | Phenol (mg Gallic acid/100 g DW) | |||||
| Sampling Time (DAFB) | 122 | 155 | E. H. | 122 | 155 | E. H. |
| Location | ||||||
| Marvak | 16.00c | 345.00b | 485.00a | 73.17b | 72.08b | 68.97c |
| Marak | 6.00c | 110.00c | 217.00b | 75.80b | 142.44a | 140.80a |
| Amirabad | 4.00c | 264.00b | 281.00b | 74.41b | 71.99b | 69.00c |
DAFB: days after full bloom in which 50% flowers are open; E. H.: economical harvesting in each location. Mean values in each column followed by the same letter are not significantly different by the LSD (P < 0.05).
3.2Fruit growth curve
Fruit growth pattern (Figs. 4–8) studied with using fruit fresh weight (FW), fruit dry weight (DW) and fruit volume (FV). Fruit FW in all three locations initially increased slowly up to 98 DAFB and then became faster for a period of time, up to 122 (first rise), then the rate of growth continued slowly (up to 155) and again increased (up to E.H., second rise) (Fig. 4). A similar trend observed for fruit DW (Fig. 5). Both FW and DW indicated double-sigmoid growth pattern. Evaluation of DW vs. FW showed an increasing trend for this ratio, which observed faster increase of DW in final growth of barberry fruit (Fig. 6). Fruit volume also showed double-sigmoidal growth pattern (Fig. 7). During 66 to 98 DAFB a slow growth and then first rise observed, followed by a steady state during 98 to 122 DAFB. Second rise was much faster (between dates 98 to 155) and finally, slowly increase in growth was reached (Fig. 7). In all locations, two rise were observed in FW, DW and FV that was in agreement with Coombe [38] and Worrell et al. [39, 40], who stated that some stone fruits (peach, plum, apricot) and non-stony fruits (grape, fig, currant, soursop, bread fruit) have double-sigmoidal growth curves. In double-sigmoidal tri-phasic growth, there are two periods of rapid growth increase that are separated by a period of slow or suspended growth, similar to findings presented here.
Fig.4
Changes in barberry fresh weight during growth season. Data represent means±SE.
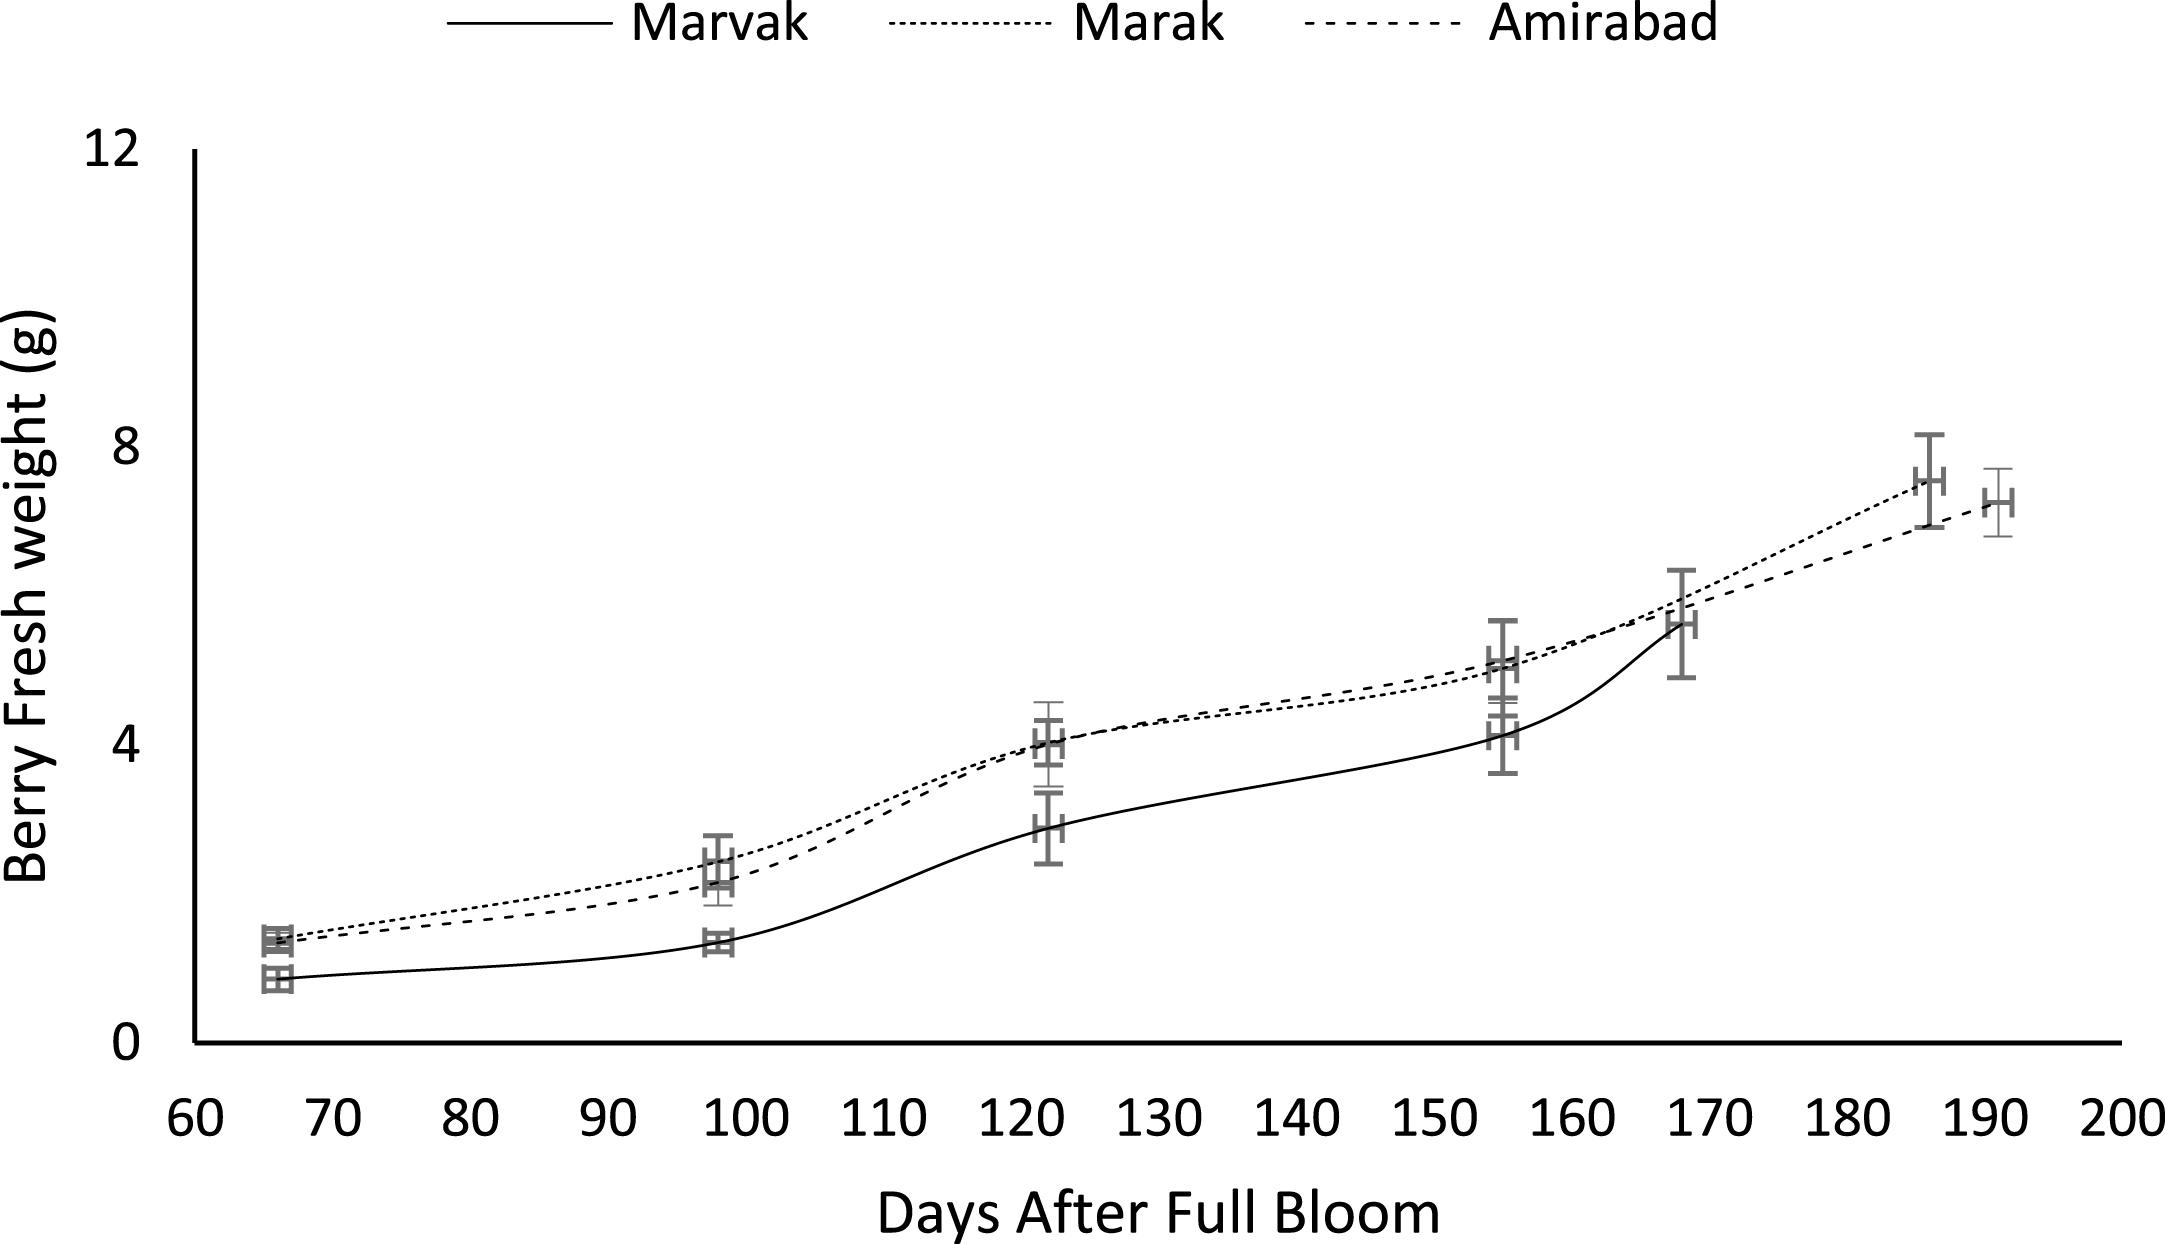
Fig.5
Changes in barberry dry weight during growth season. Data represent means±SE.
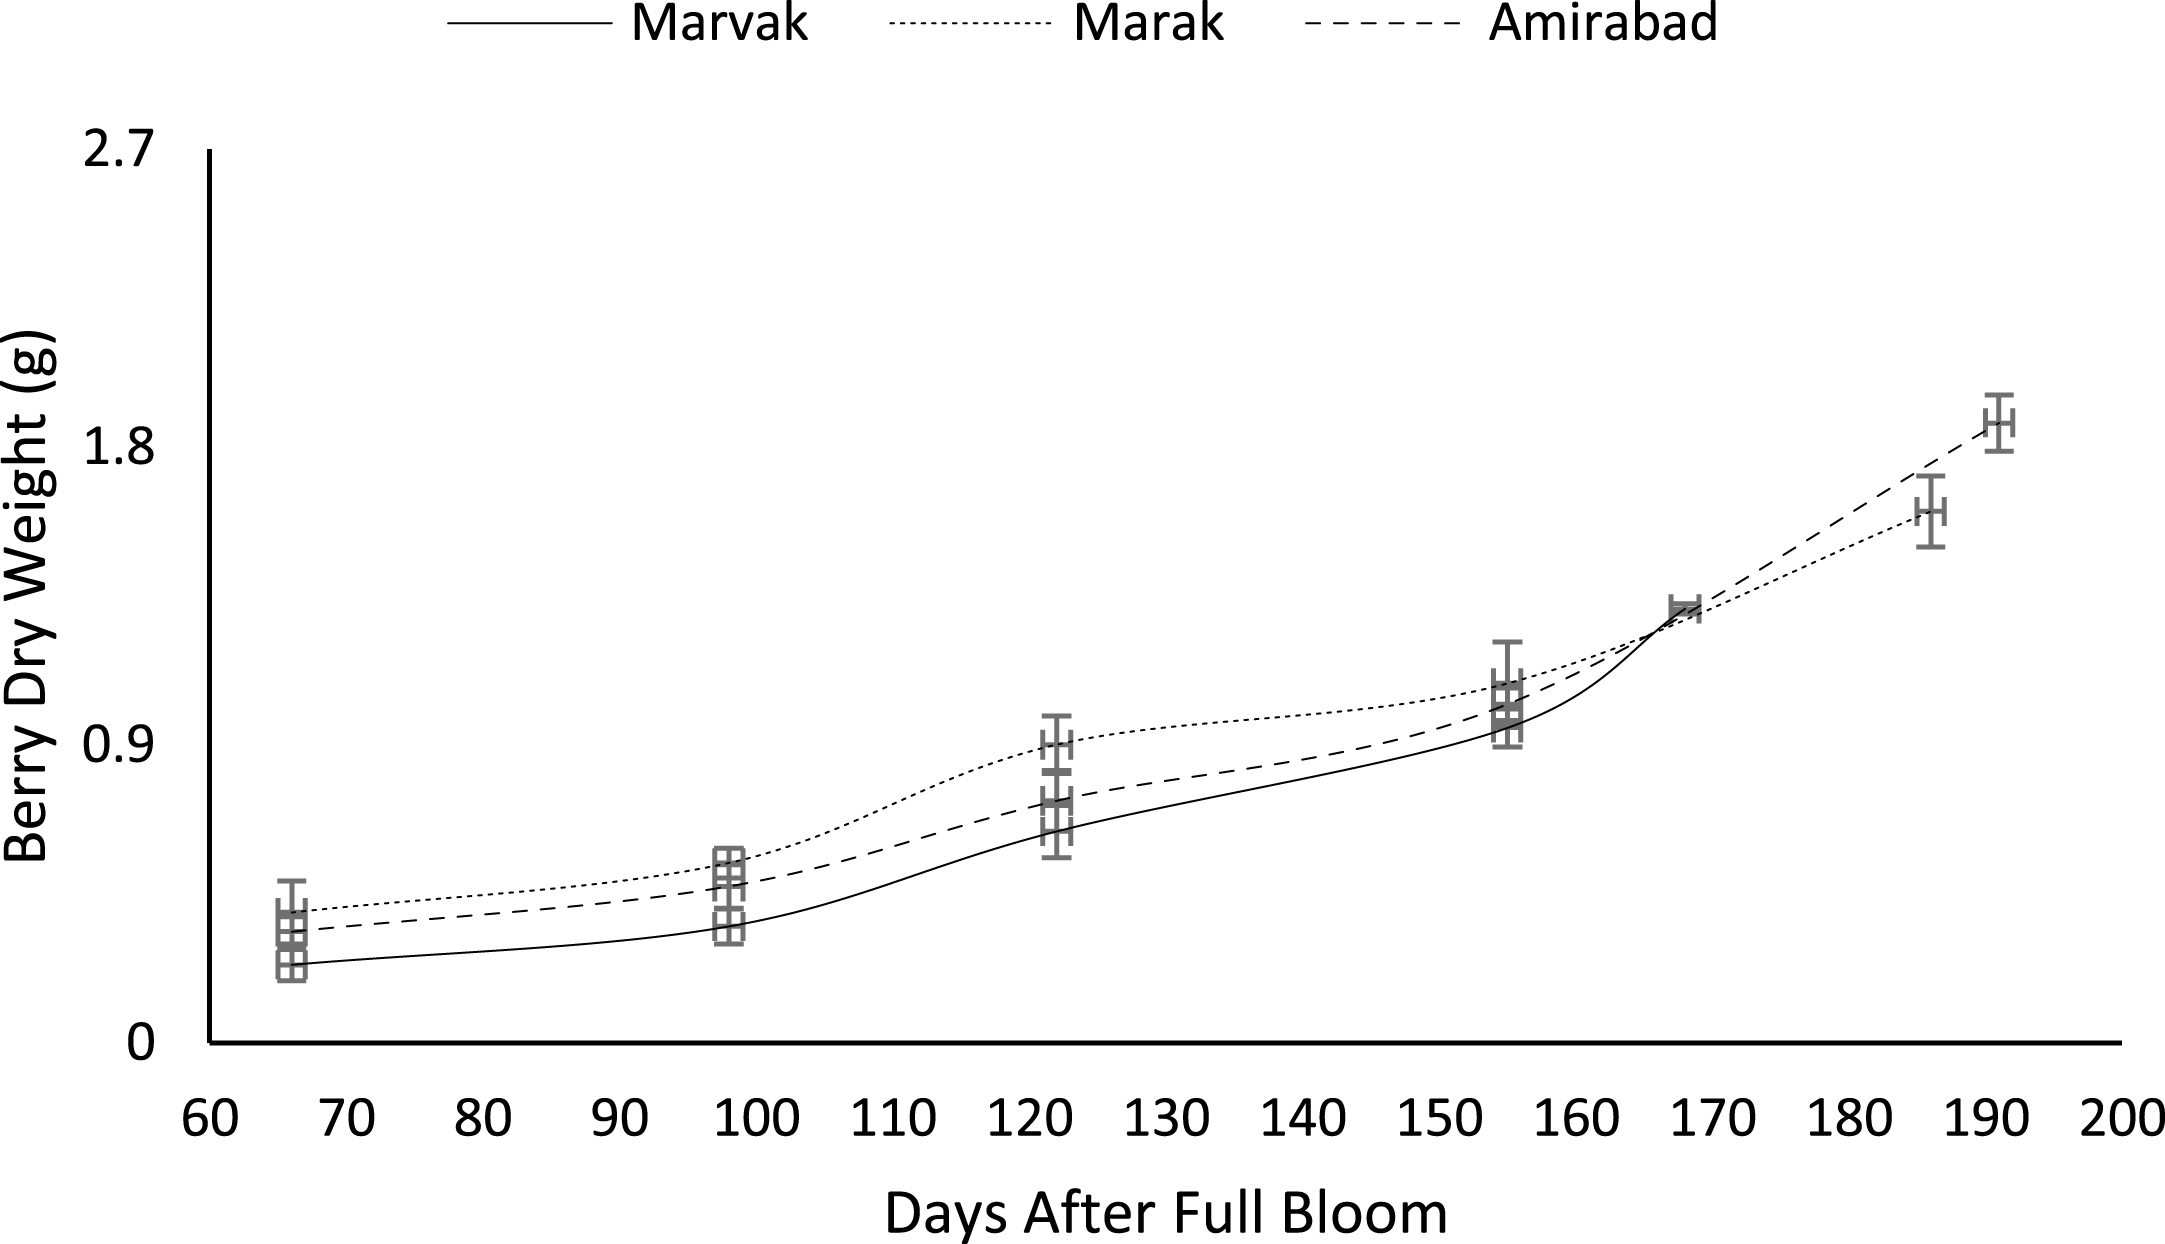
Fig.6
Changes in dry weight during vs. fresh weight of fruit.
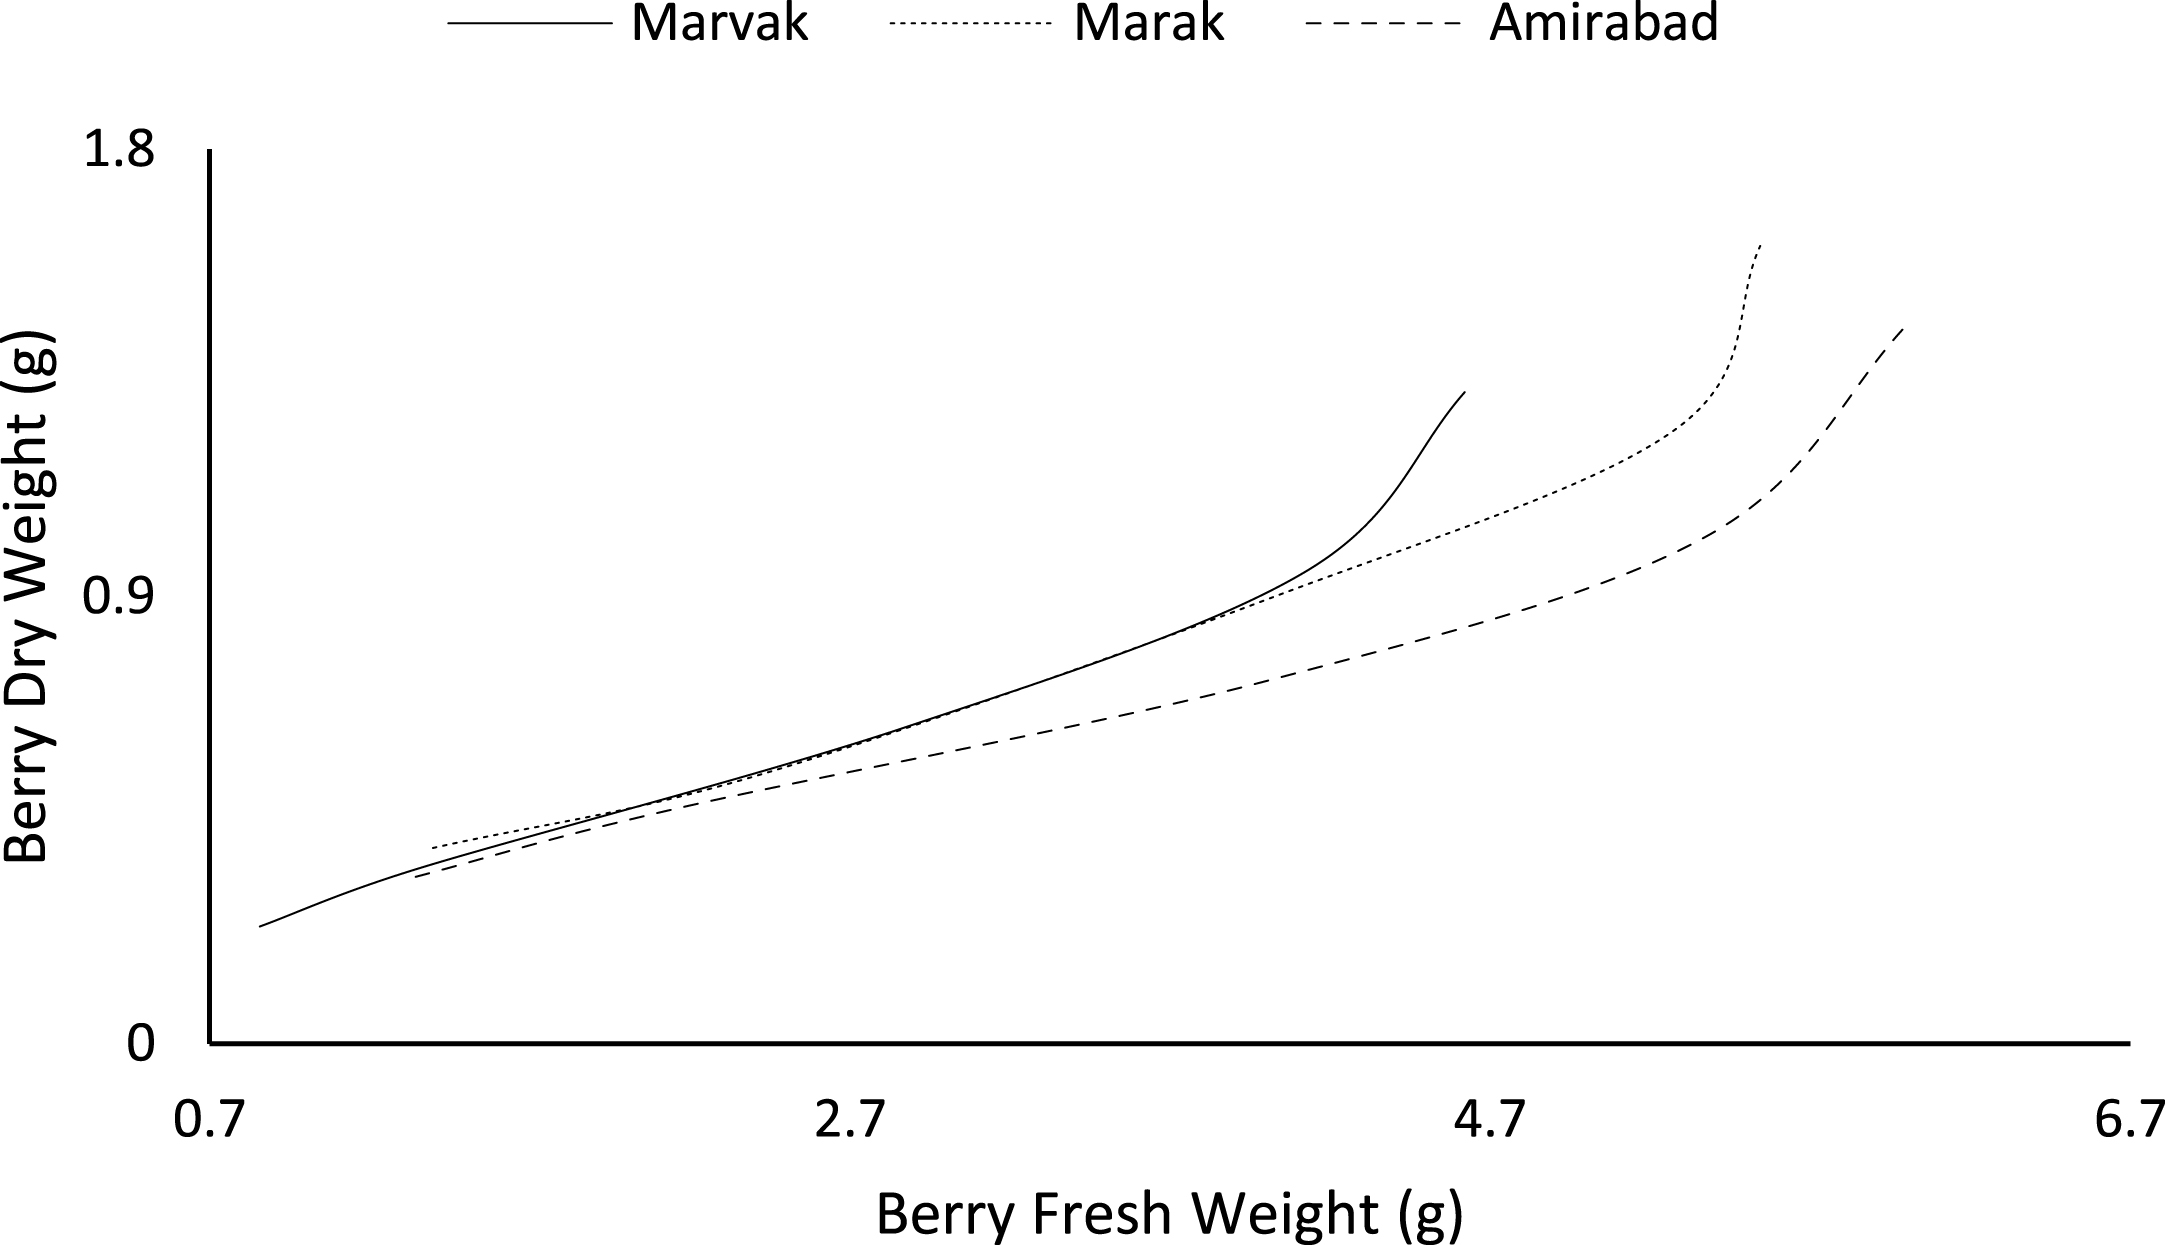
Fig.7
Changes in barberry volume during growth season. Data represent means±SE.
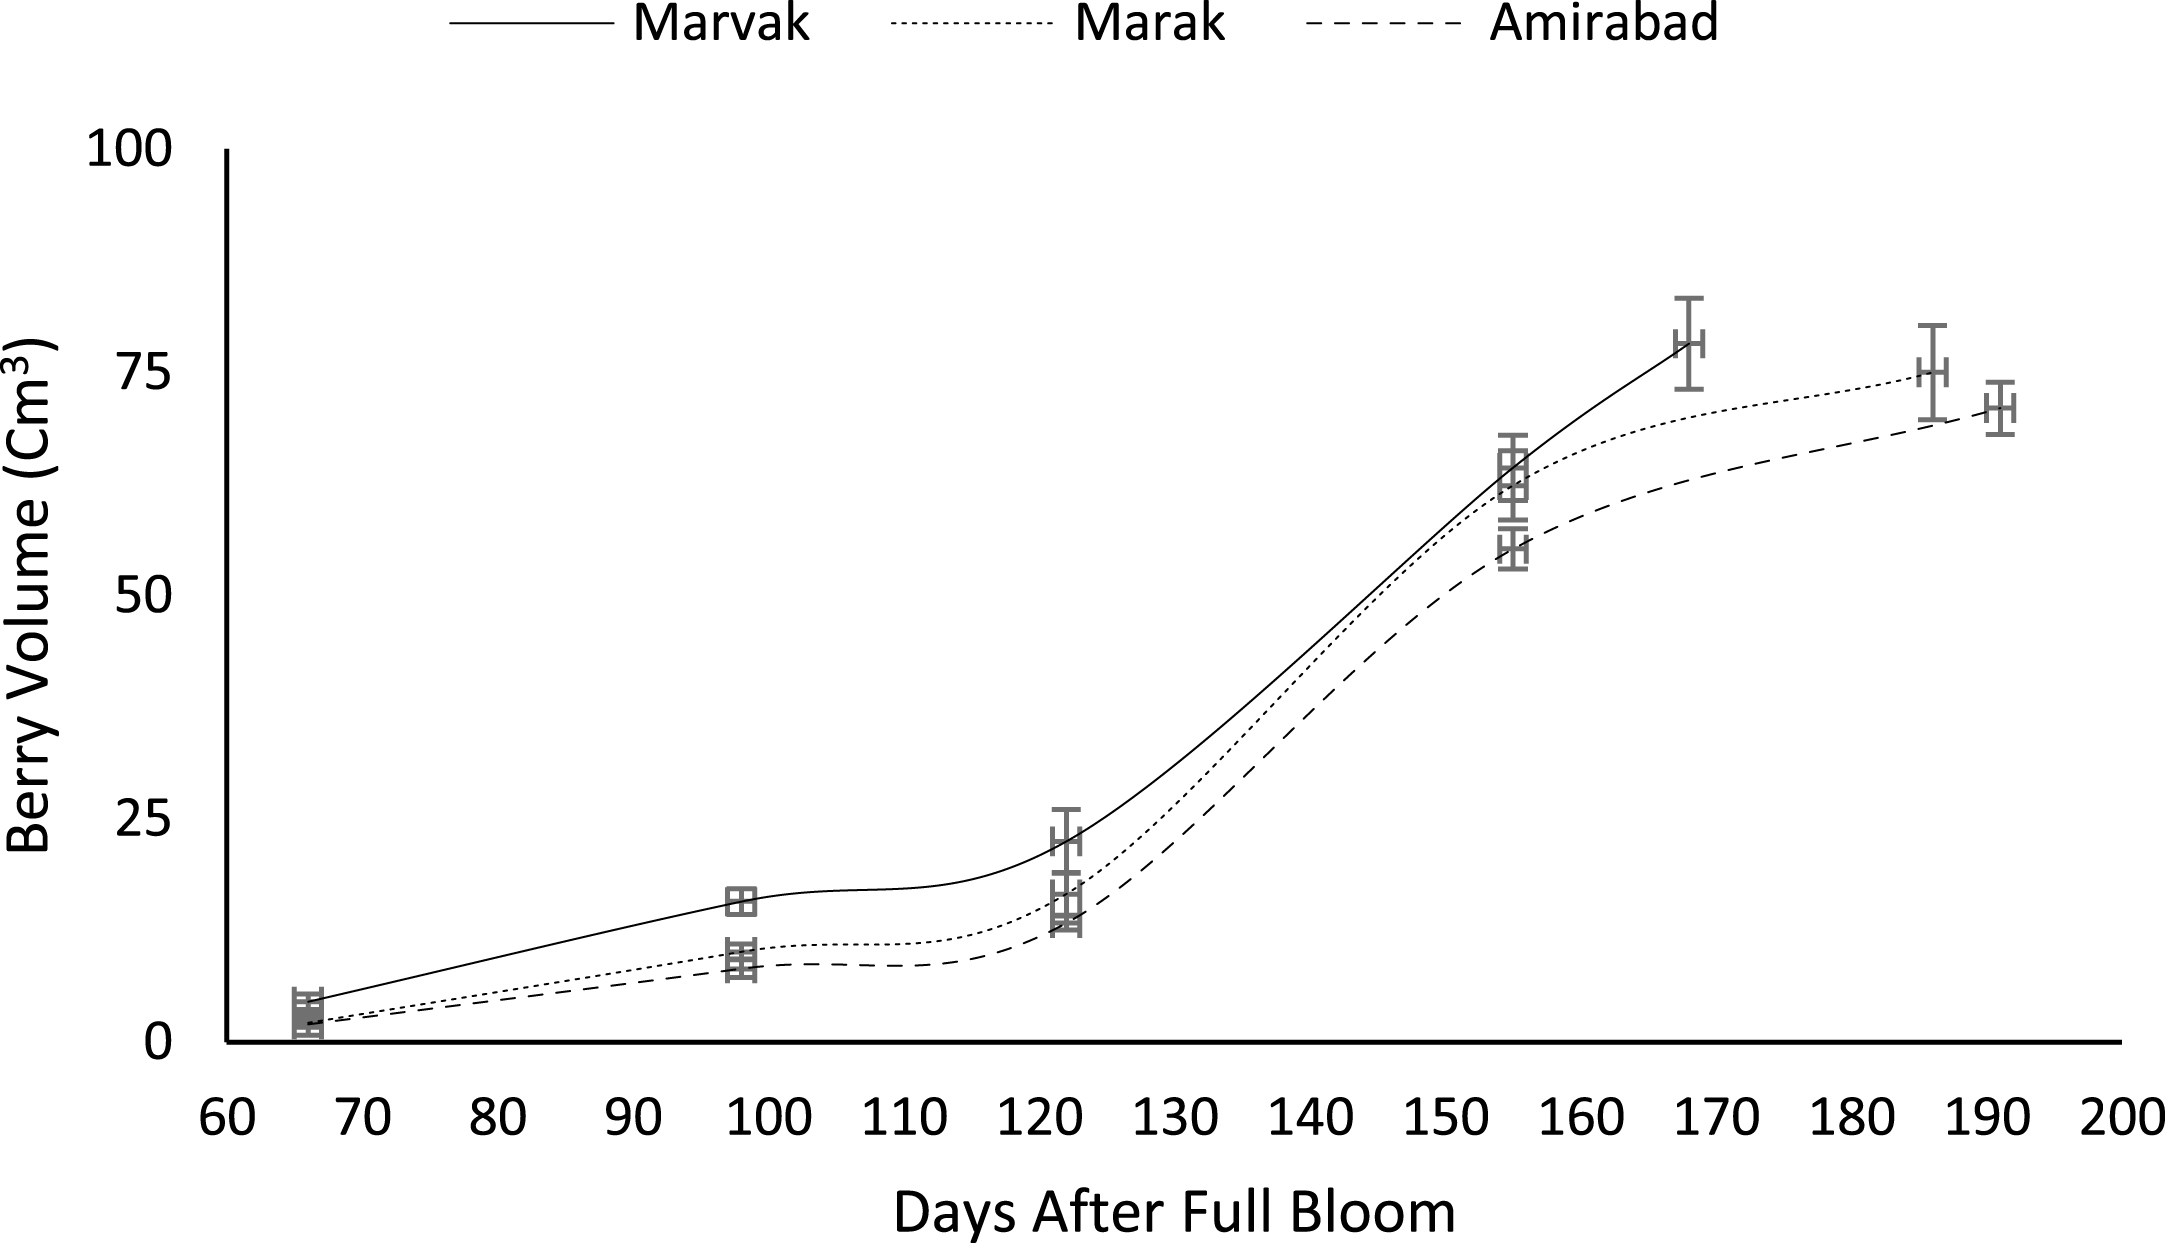
Fig.8
Changes in barberry juice weight during growth season. Data represent means±SE.
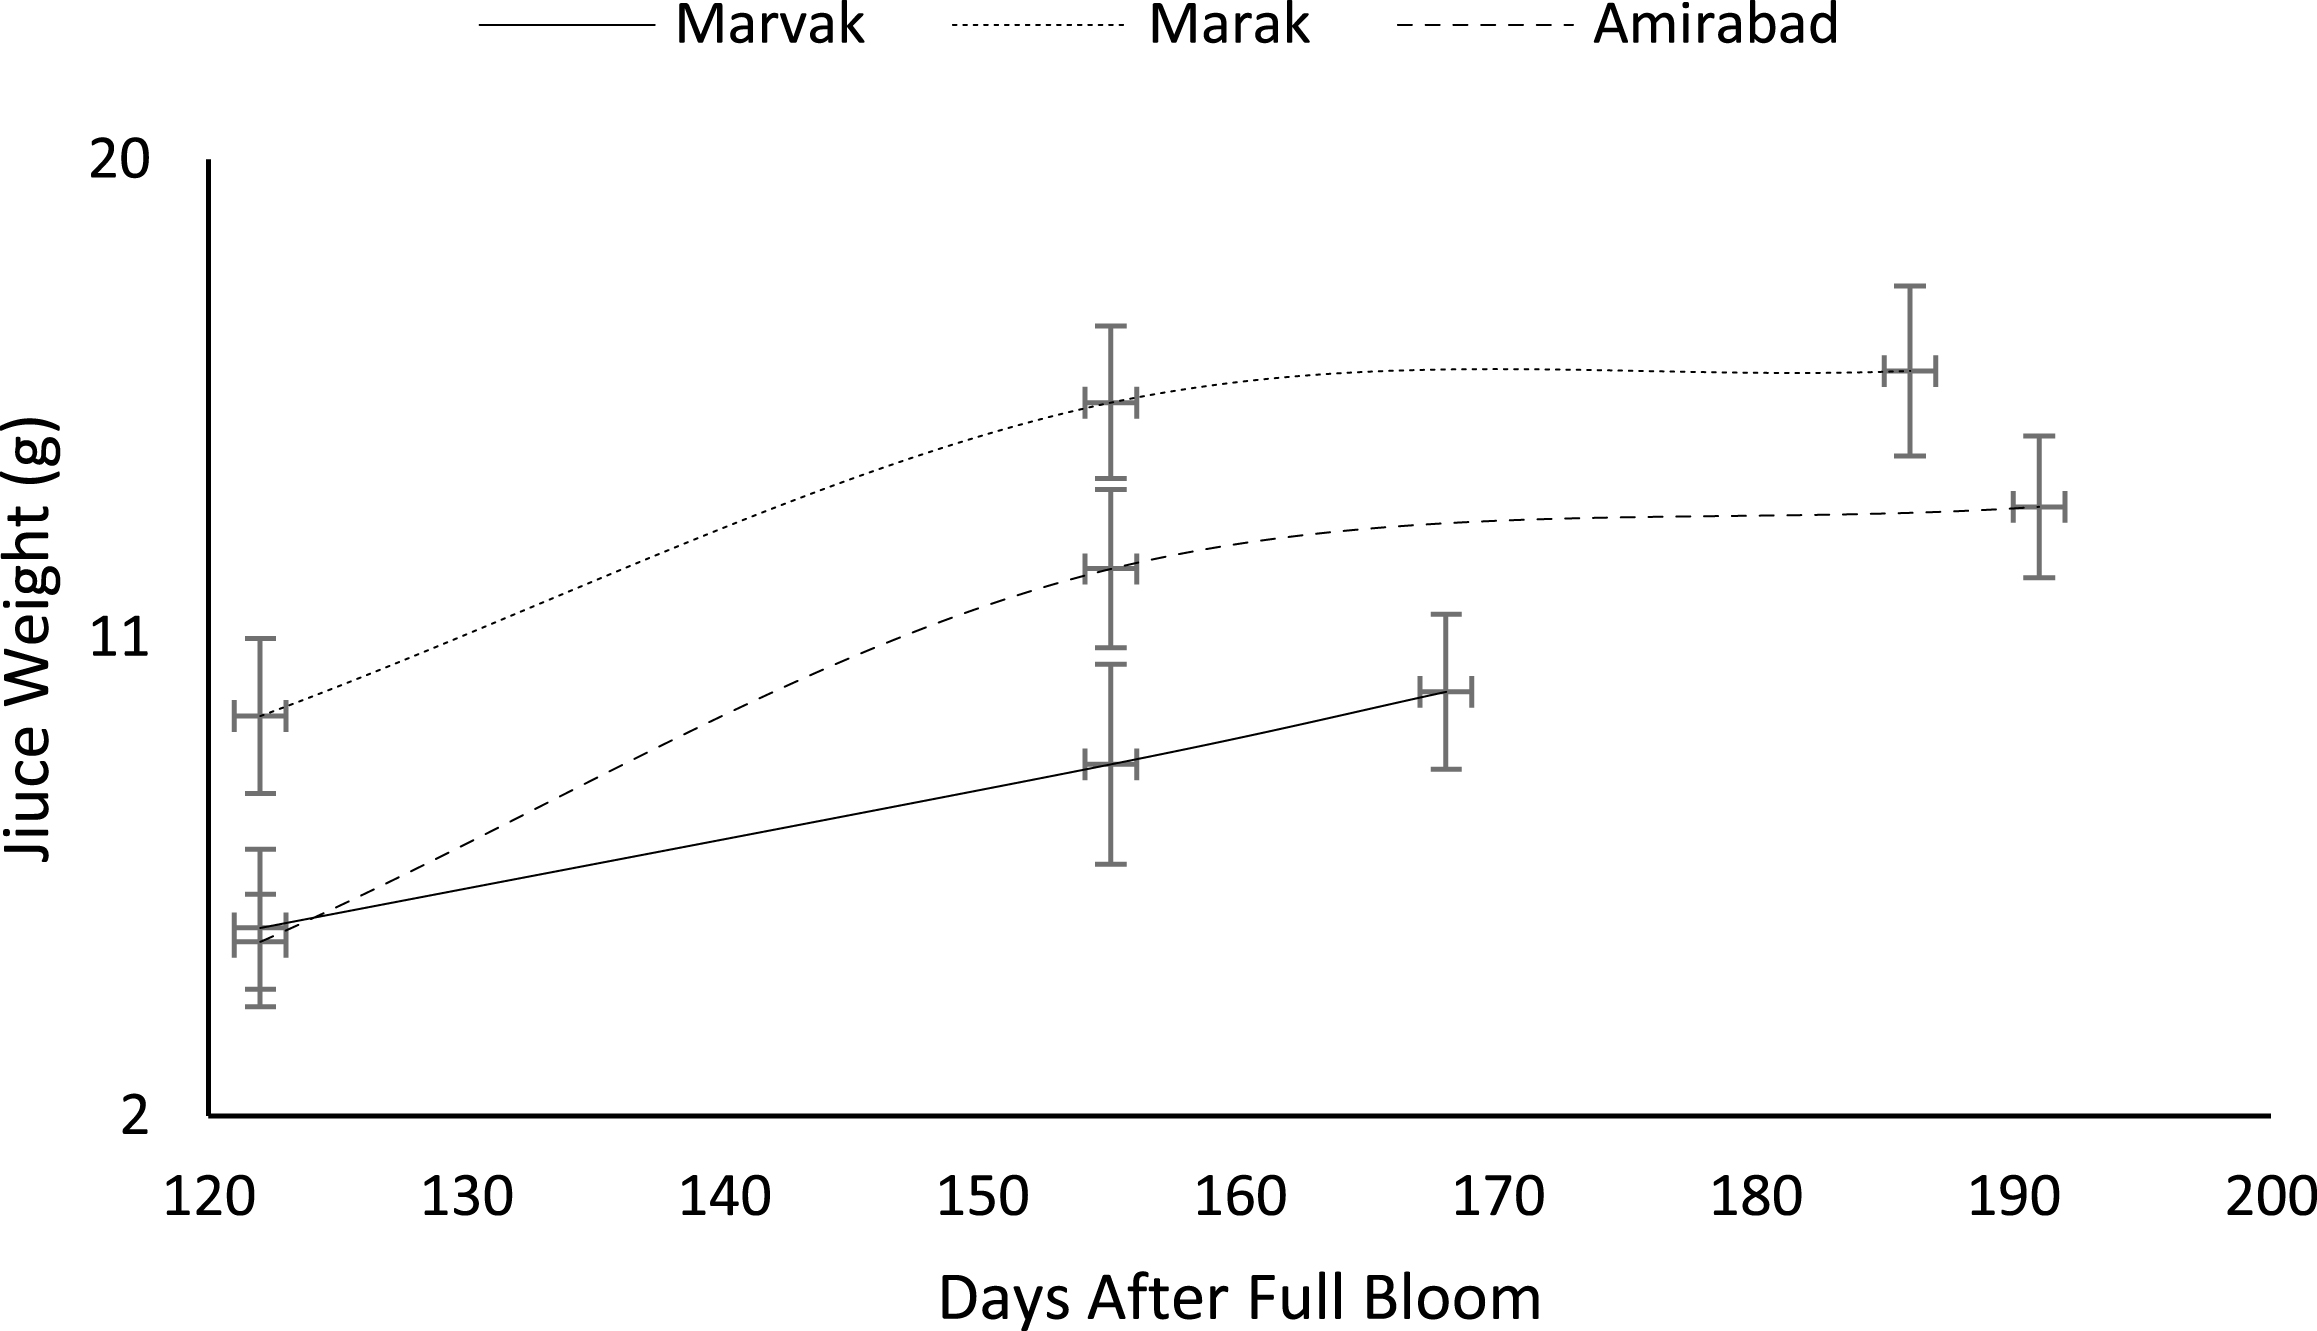
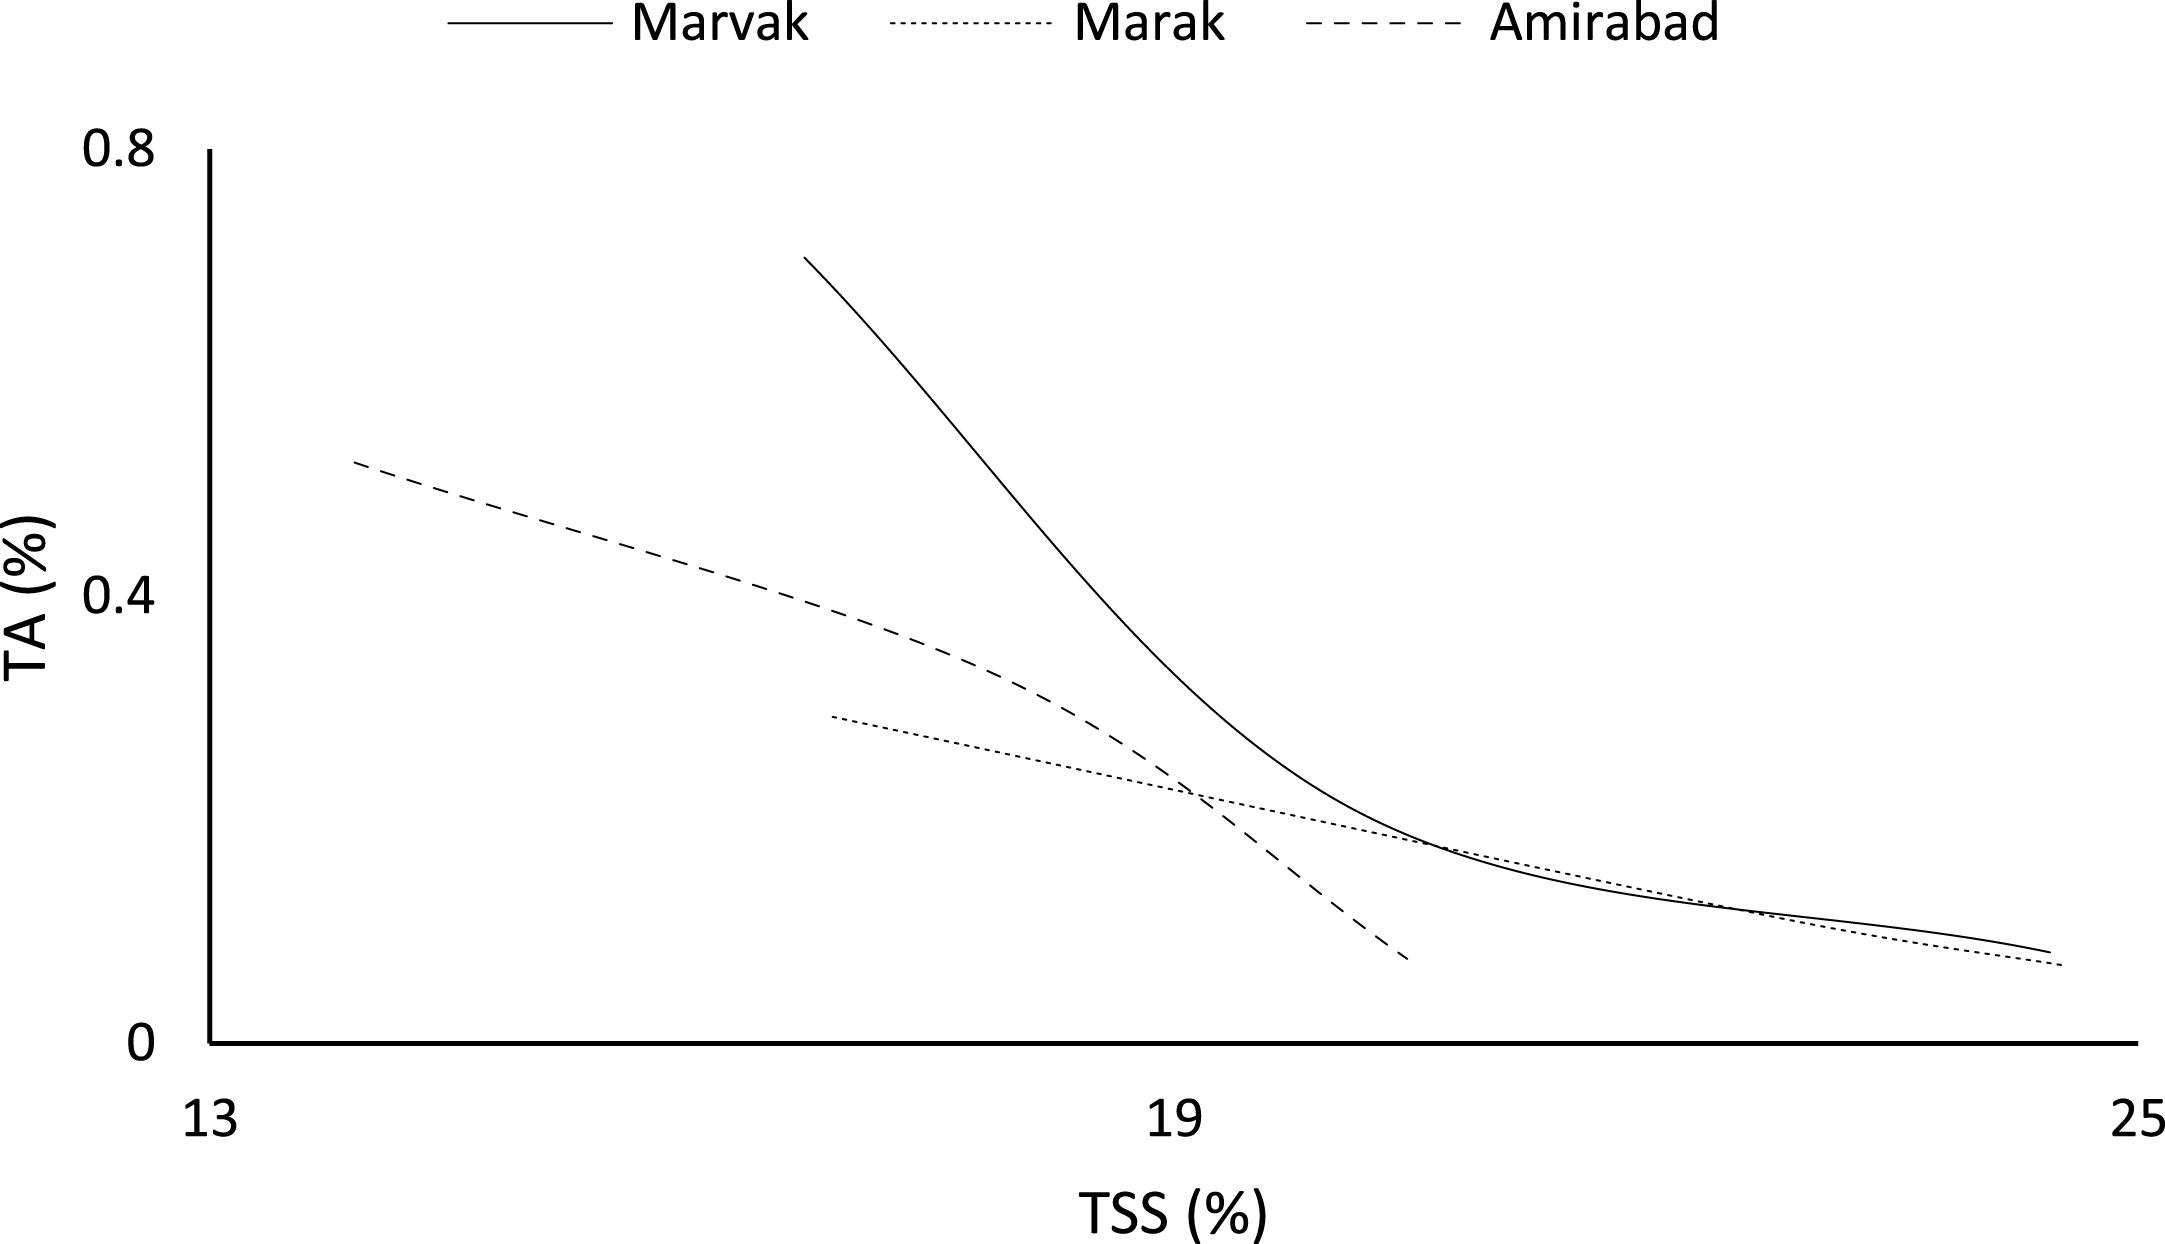
Certain biochemical measurements provide indices for changes in fruit growth and development, including pH, acidity, sugar and starch, relative density as sucrose gradient, and fatty acid content in fruit, seed, or embryo and NAD-dependent sorbitol dehydrogenase [41–43]. Extractable juice obtained 122 DAFB onward. Juice weight and volume increased in all locations during 122 to 155 DAFB, however, with the exception of Marak and Amirabad (Figs. 8 and 9). About TSS (Fig. 10), a similar trend observed for both Marak and Amirabad that initially increased from date 122 to 155. Figure 11 showed fast reduction of TA in all location during date 122 to 155. Evaluation of TA vs. TSS also showed a reducing manner for TA, as TSS increased (Fig. 12).
Fig.9
Changes in barberry juice volume during growth season. Data represent means±SE.
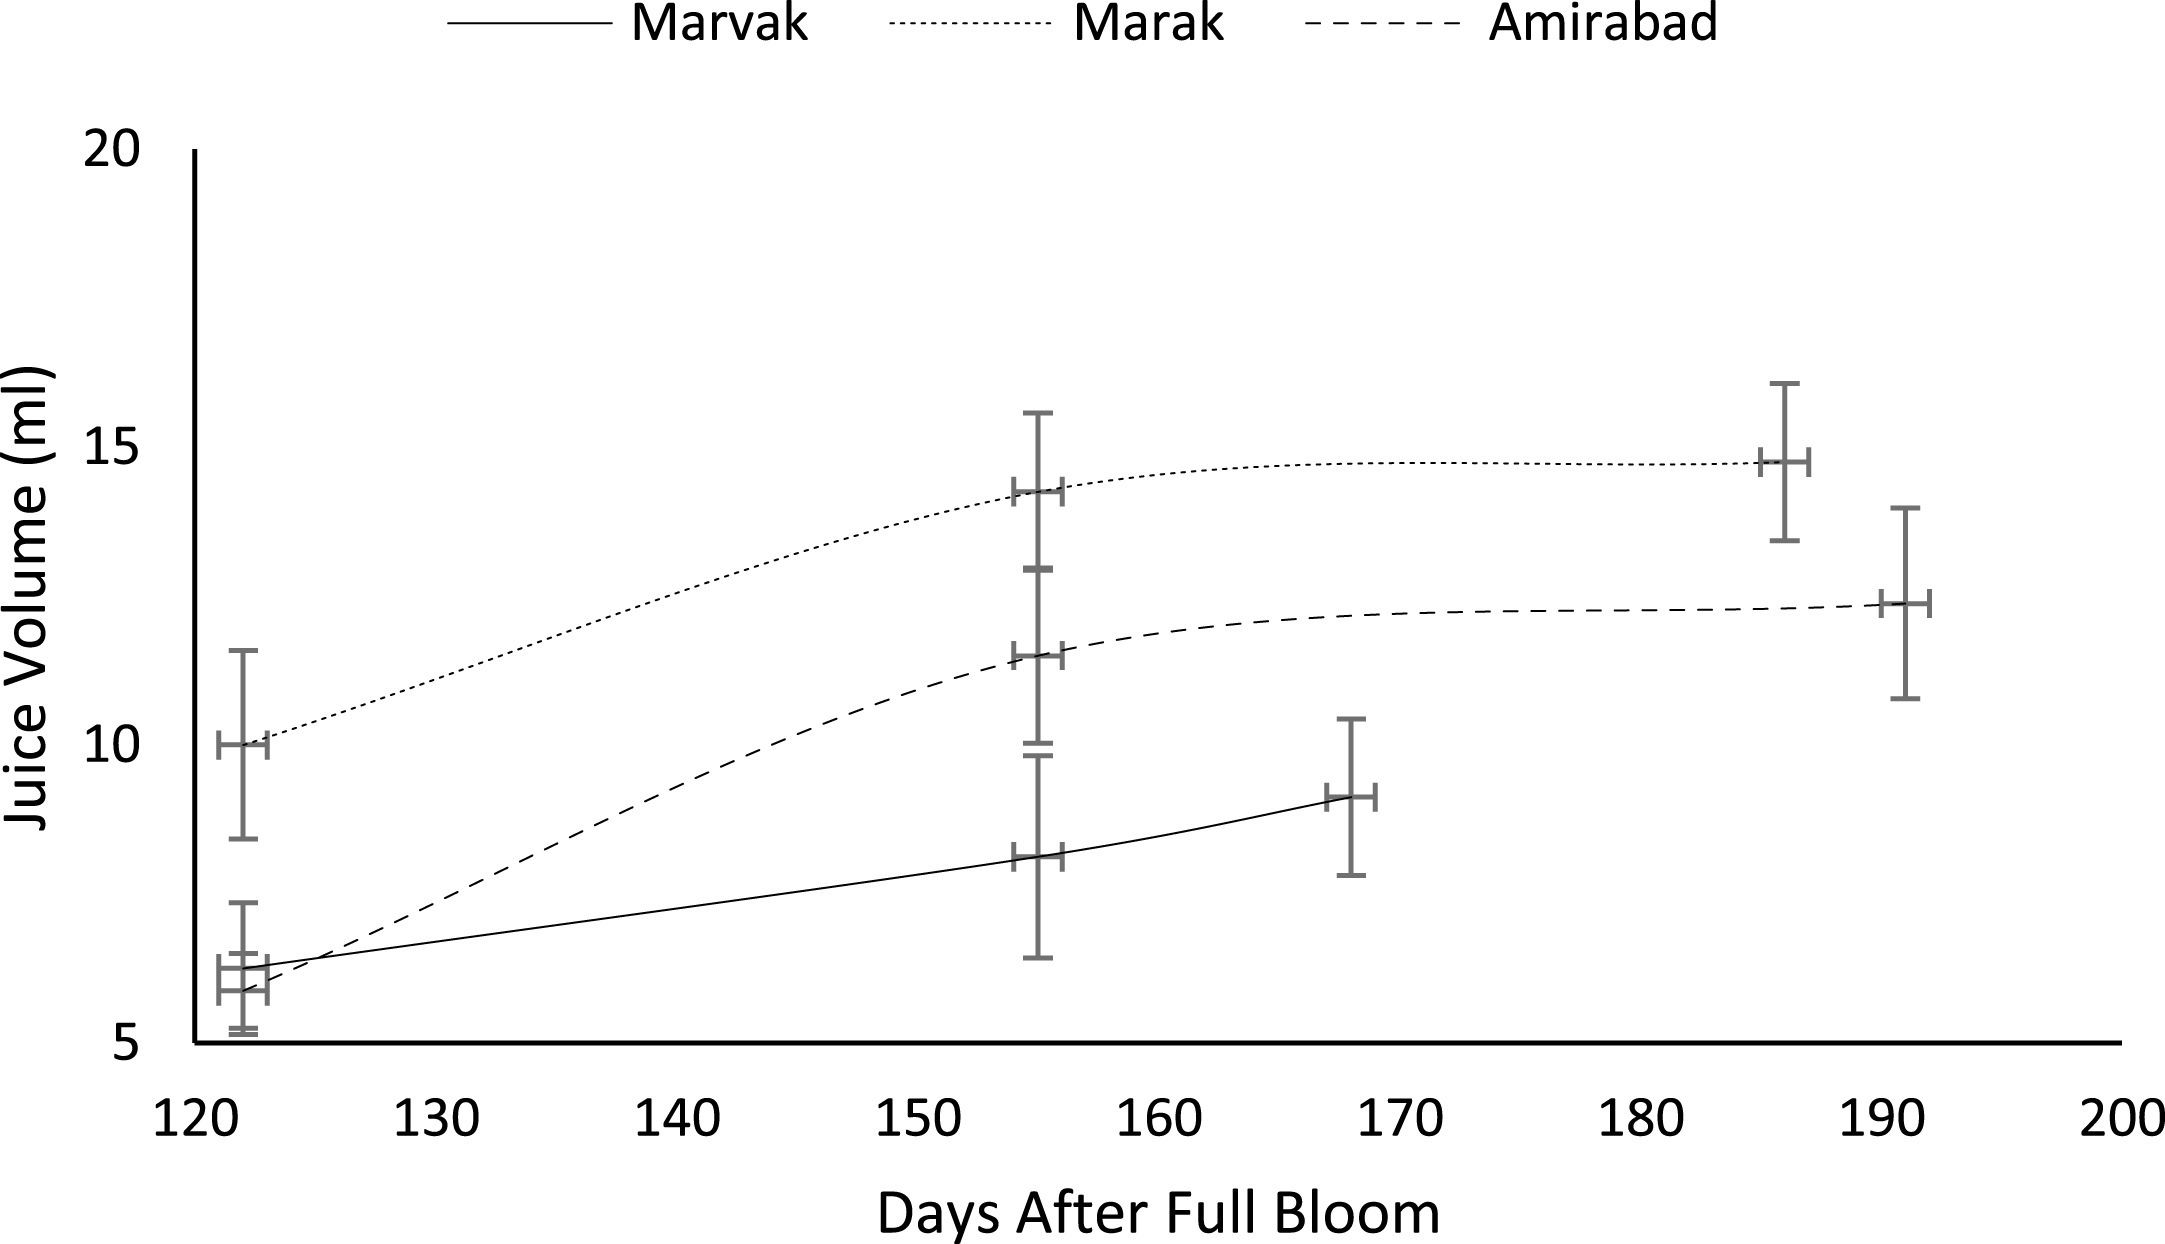
Fig.10
Changes in barberry TSS during growth season. Data represent means±SE.
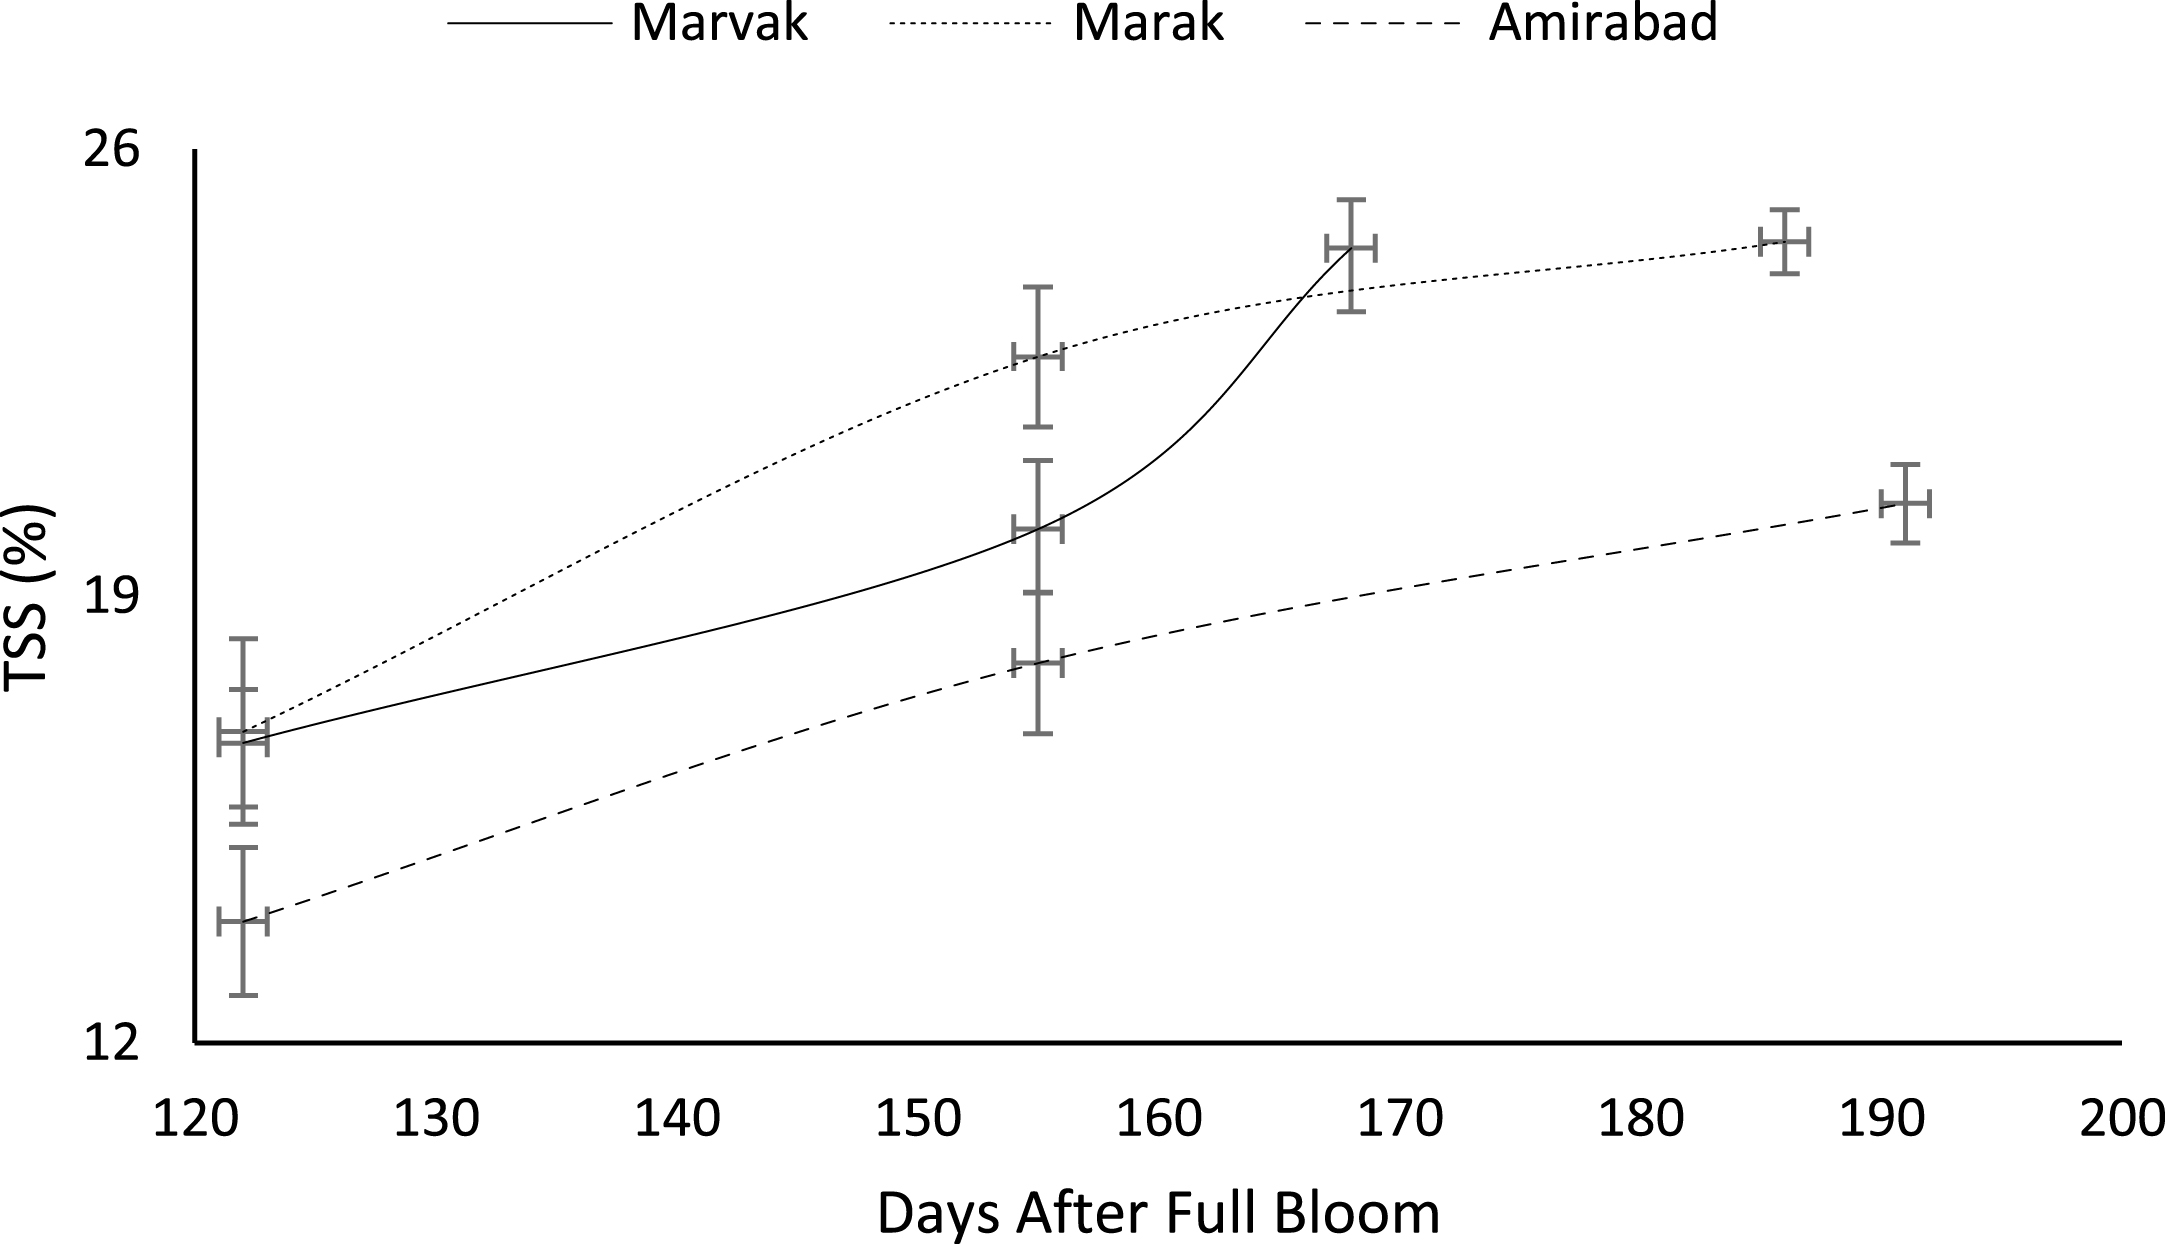
Fig.11
Changes in barberry TA during growth season. Data represent means±SE.
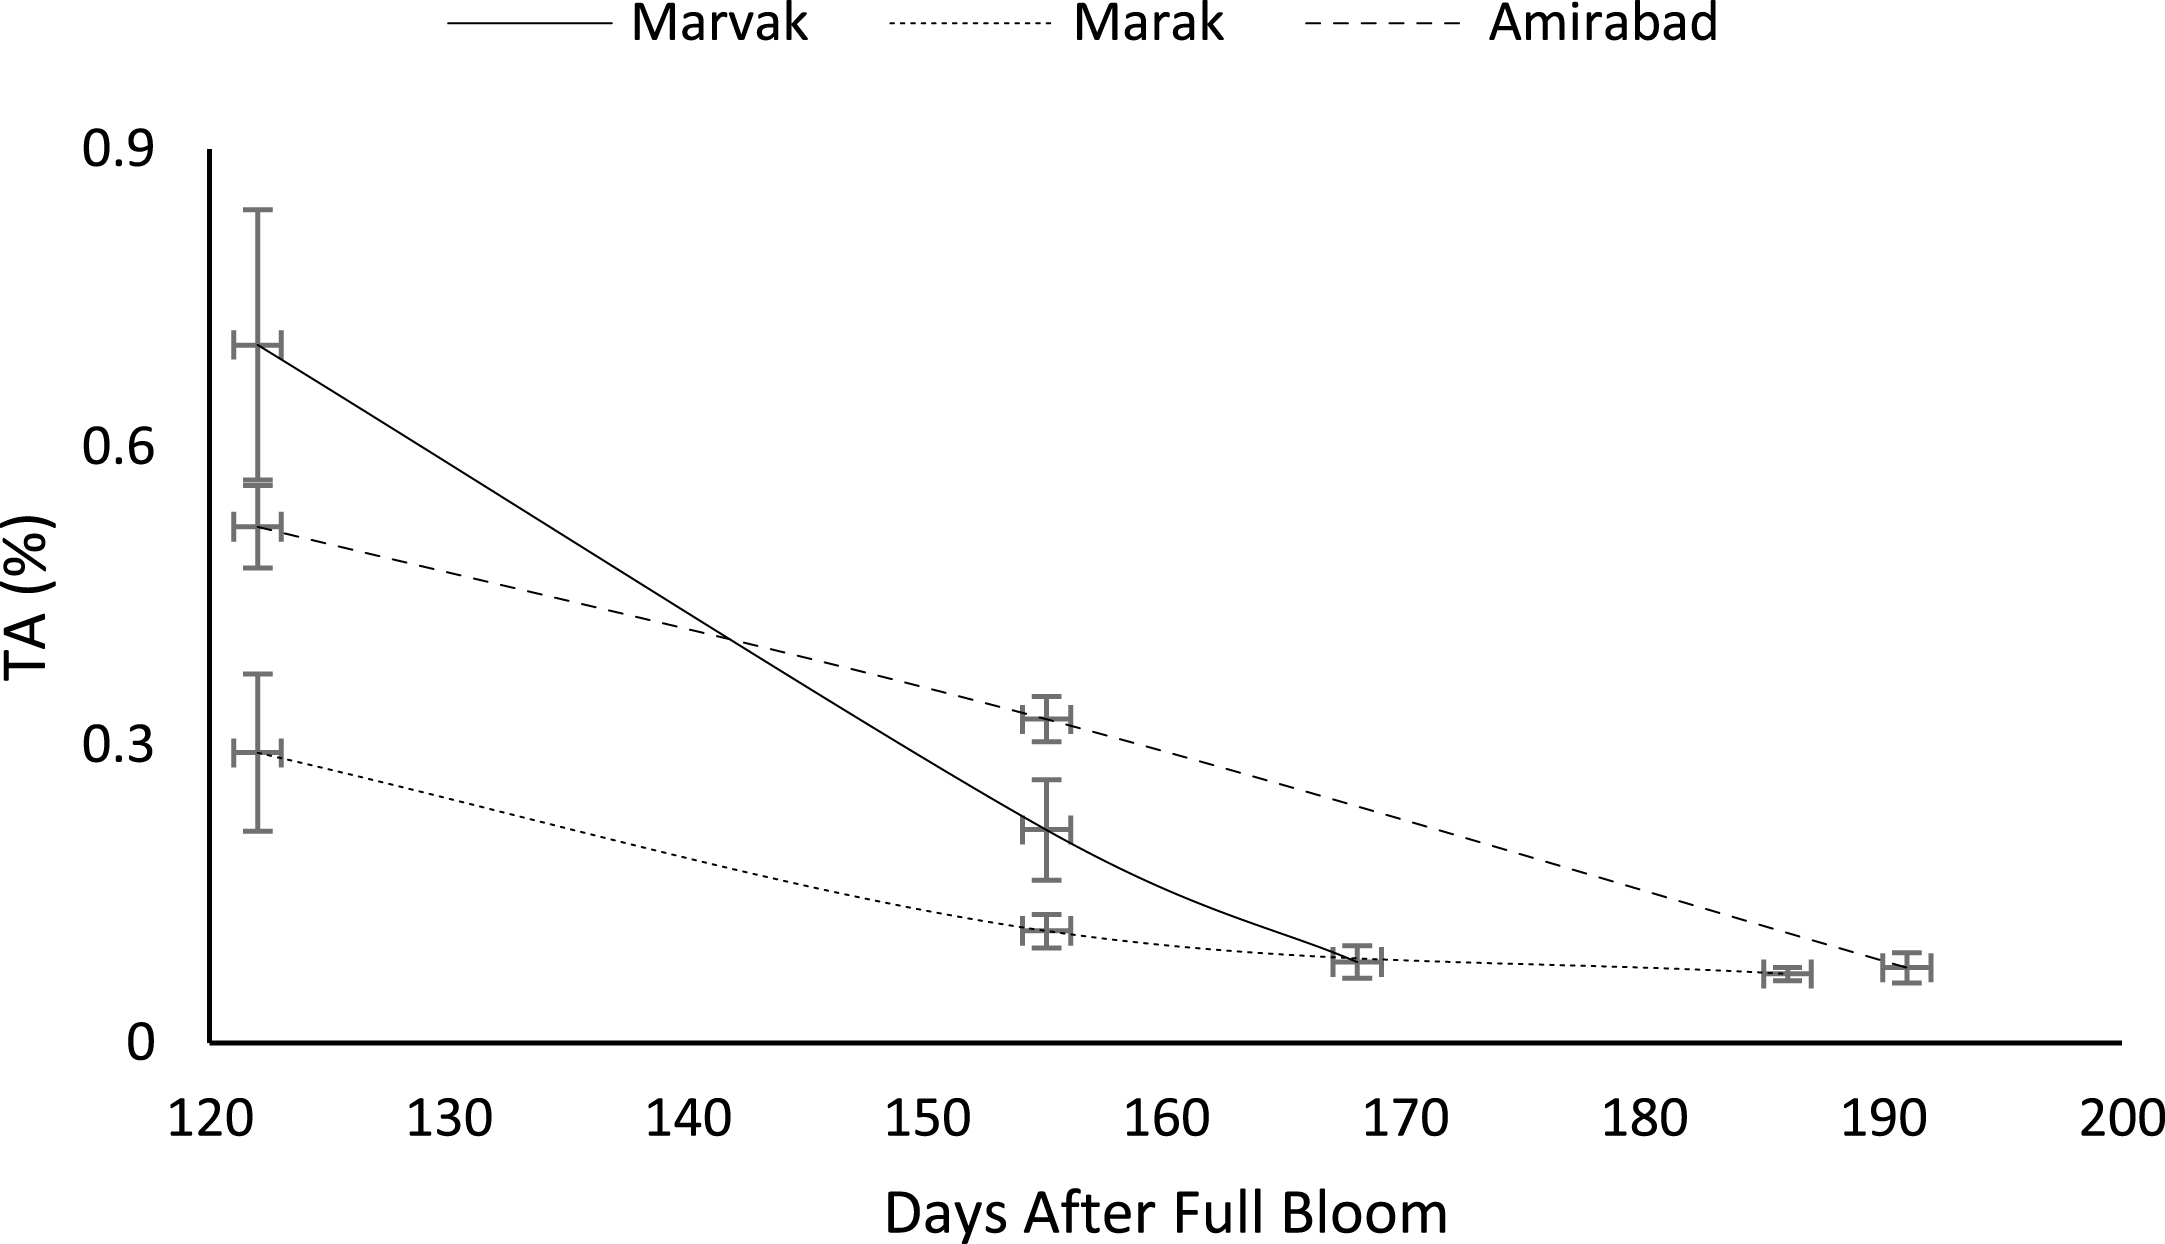
Fig.12
Changes in TA vs. TSS of fruit during growth season.
4Conclusion
The study revealed that fruit maturity and improvement of quality may be dependent to the altitude, harvesting date and conditions created by altitude. Harvesting date was different in each location and earlier harvest obtained as altitude increased (in Marvak with higher altitude). Heat unit accumulation exponentially affected all aspects of fruit growth. We found a differences of 23 days in harvest time among different locations, which is very important from economical aspects. Altitude also improved fruit quality characters and more anthocyanin accumulated in berries produced in Marvak. Regarding to growth pattern studies, a double-sigmoidal growth pattern observed for barberry fruit. From the above observations, high qualified barberry fruit production and earlier harvest may be obtained if cultivation be done at altitudes higher than 2000 m from sea level.
Conflict of interest
None to report.
References
[1] | Ebadi A , Rezaei M , Fatahi R . Mechanism of seedlessness in Iranian seedless barberry (Berberis vulgaris L. var. asperma). Sci Hortic. (2010) ;125: :486–93. |
[2] | Shamsa F , Ahmadiani A , Khosrokhavar R . Antihistaminic and anticholinergic activity of barberry fruit (Berberis vulgaris) in the guinea-pig ileum. J Ethnopharm. (1999) ;64: (2):161–6. |
[3] | Rezvani Moghaddam P , Fallahi J , Aghhavani Shajari M , Nassiri Mahallati M . Effects of harvest date, harvest time, and post-harvest management on quantitative and qualitative traits in seedless barberry (Berberis vulgaris L.). 2013. Indust Crops Prod. (2013) ;42: :30–6. |
[4] | Özkan M . Degradation of anthocyanins in sour cherry and pomegranate juices by hydrogen peroxide in the presence of added ascorbic acid. Food Chem. (2002) ;78: (4):499–504. |
[5] | Rajasekar D , Akoh CC , Martino KG , MacLean DD . Physico-chemical characteristics of juice extracted by blender and mechanical press from pomegranate cultivars grown in Georgia. Food Chem. (2012) ;133: (4):1383–93. |
[6] | Sage RF , Kubien DS . The temperature response of C3 and C4 photosynthesis. Plant Cell Environ. (2007) ;30: (9):1086–106. |
[7] | Rokaya PR , Baral DR , Gautam DM , Shrestha AK , Paudyal KP . Effect of Altitude and Maturity Stages on Quality Attributes of Mandarin (Citrus reticulata Blanco). Amer J Plant Sci. (2016) ;7: (06):958. |
[8] | Parra-Coronado A , Fischer G , Camacho-Tamayo JH . Development and quality of pineapple guava fruit in two locations with different altitudes in Cundinamarca, Colom. Brag. (2015) ;74: (3):359–66. |
[9] | Alemardan A , Asadi W , Rezaei M , Tabrizi L , Mohammadi S . Cultivation of Iranian seedless barberry (Berberis integerrima ‘Bidaneh’): A medicinal shrub. Indust Crops Prod. (2013) ;50: :276–87. |
[10] | Tarara JM , Lee J , Spayd SE , Scagel CF . Berry temperature and solar radiation alter acylation, proportion, and concentration of anthocyanin in Merlot grapes. Amer J Enol Vitic. (2008) ;59: (3):235–47. |
[11] | Mori K , Goto-Yamamoto N , Kitayama M , Hashizume K . Loss of anthocyanins in red-wine grape under high temperature. J Exp Bot. (2007) ;58: (8):1935–45. |
[12] | Borochov-Neori H , Judeinstein S , Harari M , Bar-Ya’akov I , Patil BS , Lurie S , et al. Climate effects on anthocyanin accumulation and composition in the pomegranate (Punica granatum L.) fruit arils. J Agric Food Chem. (2011) ;59: (10):5325–34. |
[13] | Jaakola L . New insights into the regulation of anthocyanin biosynthesis in fruits. Trends Plant Sci. (2013) ;18: (9):477–83. |
[14] | Maraki Z , Moradinezhad F , Khayyat M . Study of the physical and chemical properties of seedless barberry fruit (Berberis vulgaris L.): A medicinal plant during development and ripening. MSc.. (2014) ; Thesis, in Persian. |
[15] | Wang SY , Chen CT , Wang CY . The influence of light and maturity on fruit quality and flavonoid content of red raspberries. Food Chem. (2009) ;112: (3):676–84. |
[16] | Wein HC . The physiology of vegetable crops. CAB International, Wallingford, UK, (1997) . |
[17] | Arnon AN . Method of extraction of chlorophyll in the plants. Agron J. (1967) ;23: :112–21. |
[18] | Williams S , Horwitz W . Official methods of analysis of the Association of Official Analytical Chemists. (1984) . |
[19] | Swain T . Analytical methods for flavonoids. In: Goodwin T. W. editor, The chemistry and biochemistry of plant pigments. Academic Press, , London, U.K; (1965) . 543–544. |
[20] | Makkar HP , Blümmel M , Borowy NK , Becker K . Gravimetric determination of tannins and their correlations with chemical and protein precipitation methods. J Sci Food and Agric. (1993) ;61: :161–5. |
[21] | Arena ME , Curvetto N . Berberis buxifolia fruiting: Kinetic growth behavior and evolution of chemical properties during the fruiting period and different growing seasons. Sci Hortic. (2008) ;118: (2):120–7. |
[22] | Sugiura A , Zheng GH , Yonemori K . Growth and ripening of persimmon fruit at controlled temperatures during growth stage III. HortSci. (1991) ;26: (5):574–6. |
[23] | Candir EE , Ozdemir AE , Kaplankiran M , Toplu C . Physico-chemical changes during growth of persimmon fruits in the East Mediterranean climate region. Sci Hortic. (2009) ;121: (1):42–8. |
[24] | Kulkarni AP , Aradhya SM . Chemical changes and antioxidant activity in pomegranate arils during fruit development. Food Chem. (2005) ;93: (2):319–24. |
[25] | Biale JB . The postharvest biochemistry of tropical and subtropical fruits. Adv Food Res. (1961) ;10: :293–354. |
[26] | Yoon KY , Woodams EE , Hang YD . Relationship of acid phosphatase activity and Brix/acid ratio in apples. LWT-Food Sci Tech. (2005) ;38: (2):181–3. |
[27] | Yoon KY , Woodams EE , Hang YD . Relationship of acid phosphatase activity and Brix/acid ratio in cherries. LWT-Food Sci Tech. (2006) ;39: (3):316–20. |
[28] | Kozai N , Kataoka I , Kondo T , Amemiya S , Higuchi H , Ogata T , Yonemoto Y . Effect of night temperature regime on fruit quality of ‘Summer Queen’passion fruit (Passiflora edulis×P. edulis f. flavicarpa) harvested in winter. Jap J Tropic Agric. (2007) ;51: (2):70–2. |
[29] | Chandra P , Todaria NP . Maturation and ripening of three Berberis species from different altitudes. Sci Hortic. (1983) ;19: (1-2):91–5. |
[30] | Koshita Y , Asakura T , Fukuda H , Tsuchida Y . Nighttime temperature treatment of fruit clusters of ‘Aki Queen’grapes during maturation and its effect on the skin color and abscisic acid content. VITIS-J Grapevine Res. (2007) ;46: (4):208. |
[31] | Choi S , Kwon YR , Hossain MA , Hong SW , Lee BH , Lee H . A mutation in ELA1, an age-dependent negative regulator of PAP1/MYB75, causes UV-and cold stress-tolerance in Arabidopsis thaliana seedlings. Plant Sci. (2009) ;176: (5):678–86. |
[32] | Saure MC . External control of anthocyanin formation in apple. Sci Hortic. (1990) ;42: (3):181–218. |
[33] | Marais E , Jacobs G , Holcroft DM . Postharvest irradiation enhances anthocyanin synthesis in apples but not in pears. HortSci. (2001) ;36: (4):738–40. |
[34] | Azuma A , Yakushiji H , Koshita Y , Kobayashi S . Flavonoid biosynthesis-related genes in grape skin are differentially regulated by temperature and light conditions. Planta. (2012) ;236: (4):1067–80. |
[35] | Çakir B , Agasse A , Gaillard C , Saumonneau A , Delrot S , Atanassova R . A grape ASR protein involved in sugar and abscisic acid signaling. Plant Cell. (2003) ;15: (9):2165–80. |
[36] | Hunter JJ , De Villiers OT , Watts JE . The effect of partial defoliation on quality characteristics of Vitis vinifera L. CV. Cabernet Sauvignon grapes. II. Skin color, skin sugar, and wine quality. Amer J Enol Vitic. (1991) ;42: (1):13–18. |
[37] | Bashir HA , Abu-Goukh AB . Compositional changes during guava fruit ripening. Food Chem. (2003) ;80: (4):557–63. |
[38] | Coombe BG . The development of fleshy fruits. Ann Rev Plant Physiol. (1976) ;27: (1):207–28. |
[39] | Worrell DB , Sean CM , Huber DJ . Growth, maturation and ripening of soursop (Annona muricata L.) fruit. Sci Hortic. (1994) ;57: (1-2):7–15. |
[40] | Worrell DB , Carrington CS , Huber DJ . Growth, maturation and ripening of breadfruit, Artocarpus altilis (Park.) Fosb. Sci Hortic. (1998) ;76: (1):17–28. |
[41] | Watada AE , Herner RC , Kader AA , Romani RJ , Staby GL . Terminology for the description of developmental stages of horticultural crops. HortSci. (1984) ;19: (1):20–21. |
[42] | Janick J , Velho CC , Whipkey A . Developmental changes in seeds of loblolly pine. Journal of the Amer Soc Hortic Sci. (1991) ;116: (2):297–301. |
[43] | Yamaguchi H , Kanayama Y , Soejima J , Yamaki S . Changes in the amounts of the NAD-dependent sorbitol dehydrogenase and its involvement in the development of apple fruit. J Amer Soc Hortic Sci. (1996) ;121: (5):848–52. |


