
Dielectric properties of berries in the microwave range at variable temperature
Abstract
BACKGROUND:
Dielectric properties (DPs) are relevant parameters for microwave applications, such as sensors and heating for drying, mold control or disinfestation. DPs of berries are necessary in order to develop processes involving microwaves, reported with high potential for berries preservation.
OBJECTIVE:
To analyze the DPs in the microwave range and physicochemical properties of raspberry, strawberry and blackberry.
METHODS:
DPs were measured from 0.5 to 25 GHz at 20, 40 and 60°C using the open-ended coaxial probe method. Several physicochemical properties and biocompounds contents were determined.
RESULTS:
Dielectric constant increased with increasing temperature, and decreasing with increasing frequency. Loss factor decreased with increasing temperature, and from 1.5 to 25 GHz, losses increased with increasing frequency. All berries had similar DP values, and microwaves had deeper penetration into strawberry (3.5 cm) than blackberry and raspberry samples (2.7 cm).
CONCLUSIONS:
Dielectric properties values are useful for further applications of microwaves for these berries, such as sensing, disinfestation, avoiding decay or drying.
1Introduction
Dielectric properties (DPs) are important parameters involved in the complex permittivity, ɛ, one relevant physical property of materials. DPs refer to both real and imaginary parts of the permittivity, known as dielectric constant (ɛ′) and dielectric loss factor (ɛ″), respectively. The equation for complex permittivity is [1]:
(1)
where j is the imaginary unit, being
Physically, ɛ′ is related to the ability of the material to store energy, while ɛ″ is related to electromagnetic energy into heat, increasing the temperature of the material. Both ɛ′ and ɛ″ are affected by diverse factors: a) associated with the nature of the material, mainly composition, and b) related to the conditions of the application of the electromagentic energy, such as frequency [2]. Additionally, temperature and physical state of the material have effect on the DPs of the materials [3].
Early, dielectric properties were studied for ceramic and dielectric materials, mainly in the electronics and communications fields. However, with the introduction of microwave ovens in 1960 and the potential application at industrial level of microwave treatments, dielectric properties of foods and biological products became valuable for agricultural products and foods [4]. There are numerous reports of these properties for different kind of foods, including fruits, vegetables, bread, nuts, coffee, meat, seafoods, milk, dairy products, eggs and purees [2], as well as for legumes [5, 6] and cereals [7, 8]. The objective of knowing the DPs is to predict the behavior of these foods when subjected to microwave heating for disinfestation, mold control, drying [2, 6], pasteurization or sterilization [9]. In addition, the knowledge of DPs is useful to relate them to other important characteristics in the materials, such as moisture content and density [5, 7].
There are few reports of DPs for strawberry. Nelson et al. [10] measured strawberry with an open-ended coaxial probe with ɛ′ values of 73 at 915 MHz, and 71 for 2450 MHz, and ɛ″=14 for both frequencies at room temperature. Funebo and Ohlsson [11] measured the dielectric properties of strawberry at 2800 MHz, using a perturbation cavity, finding values of ɛ′=73 and ɛ″=15 for the berries with 10.1 kgwater/gdry solids (or 91% of moisture content, w.b.) at 20°C. The potential of microwaves usage for strawberry drying [12–14], to avoid decay in fresh strawberries [15] and for continuous microwave pasteurization of strawberry puree [16] has been reported. Thus, it is important to know the DPs of other kind of berries in order to develop effective treatments based on microwave energy.
In Mexico, the region known as “El Bajío” in Guanajuato, is distinguished in the country for the production of berries, especially, strawberries. Traditionally, strawberry is symbol of Irapuato (a city located in the region). Strawberries are commercialized fresh, and in diverse derivatives, such as jams, dried fruits, and crystallized fruits. The state of Guanajuato is an incipient exporter of blackberries and raspberries, with a growing market. The objective of this work was to analyze the DPs in the microwave range and physicochemical properties of raspberry, strawberry and blackberry produced in “El Bajío” (Guanajuato, Mexico).
2Materials and methods
2.1Berries
Blackberries (Rubus adenotrichus Schltdl.) cv. ‘Thornfree’, raspberries (Rubus idaeus L.) cv. ‘Heritage’, and strawberries (Fragaria × ananassa) cv. ‘Camino Real’ fruits were harvested in the region “El Bajío”, Guanajuato, Mexico. Berries, free of mechanical defects and similar sizes, were acquired directly from the orchards in March 2016 and transported to the laboratory.
2.2Physicochemical properties and biocompounds content determination
Several physicochemical properties were determined in 50 g of berries; the sample was transformed in puree in an electrical blender. Moisture content was determined by weight difference in oven at 100°C during 20 h. pH was measured with pHmeter (Hanna Instruments, HI 9321, Italia), previously calibrated with buffers 7 and 4, by direct immersion of the electrode in the puree. Titratable acidity was calculated by titration with 0.1 N NaOH solution till pH = 8.2 (followed with the cited pHmeter), an expressed as percentage of citric acid [17]. Total soluble solids (TSS), expressed in ºBx, were measured with digital refractometer (Hanna Instruments, HI 96801, Romania), previously calibrated with distilled water.
Important biocomponents were determined for each berry. Total phenolic compounds were determined by the Folin-Ciocalteu reagent using gallic acid as a standard [18]. The content of total flavonoids was measured with reagent AlCl3 in methanol, using quercetin as a standard [19]. The anthocyanin content was determined by pH differential method using sodium borate buffer at pH 1.0 and pH 4.5 [20].
2.3Dielectric properties measurements and calculations
For measurement of dielectric properties, a vector network analyzer, VNA (Keysight Technologies, N9918A FieldFox) and an open-ended-coaxial probe kit (85070E, Agilent Technologies, California) were employed. For warming up and stabilization, the VNA was turned on 1 h before the measurements. Calibration with air, short, and distilled water was conducted at 25°C. The error of the system after calibration has been estimated about 5% [21]. Berries were pureed in an electrical blender, and 200 mL of sample were taken for measurements in a glass beaker (5 cm diameter), avoiding air bubbles to prevent errors. Temperature was held at 20°C, maintaining the beaker in a bath water at this temperature. With the immersed probe, ten measurements were acquired by the software, which took less than 1 min, considered a fast test. Subsequently, the sample was heated with an electrical resistance to 40°C and new measurements were obtained. Finally, sample was heated to 60°C and the DPs were measured.
With the measured properties, the penetration depth, dp (m) was calculated as
(2)
where c is the speed of the light in free space (3×10⁸ m/s), and f is the frequency (Hz). dp is the distance within the material at which the power density has decayed to 1/e (about 37%) from the value observed in the surface of the material [3]. The dp of berries was calculated for frequencies of 915, 2450 and 5800 MHz, which are the allocated values by the FCC (Federal Communications Commision of US) for industrial, scienctific and medical purposes [22].
2.4Statistical analysis
Results were analyzed through analysis of variance (ANOVA) and Tukey’s pairwise comparisons, in order to identify if there were significant differences between data. Analyses were performed with the software Minitab 17 (Minitab Inc., Palo Alto, CA). In all statistical analyses, the probability level (p-value) p = 0.05 was considered to establish significant difference among the results for the studied berries when they are compared. For p > 0.05, no significant differences were considered, and for p < 0.05 the groups were indicated as different.
3Results
3.1Physicochemical properties and biocompounds contents in berries
Table 1 shows the physicochemical characterization and the concentration of the studied biocompounds in berries. Berries have moisture content between 88.15 and 90.5% (wet basis), and pH were between 3.2 and 3.6, without significant differences among them (p > 0.05). Titratable acidity was lower for blackberry and strawberry samples, ranging between 1.02 and 1.06% of citric acid, in comparison with the acidity of the raspberries, with 1.4% of citric acid (p < 0.05). Lower TSS were measured in the strawberry samples (p < 0.05), with 8ºBx, while blackberry and raspberry samples had 8.4–8.7ºBx. There was different content of biocompounds in the studied berries (p < 0.05): the highest phenolic content was observed in strawberries (85.44 mg of gallic acid equivalents/g fresh berry), while blackberries were the richest berries in flavonoids (16.99 mg quercetin/100 g fresh berry) and anthocyanin content (11.59 mg cyanidin 3-glucoside equvalents/100 g fresh berry).
Table 1
Physicochemical properties and concentration of biocompounds for strawberry, raspberry and blackberry from “El Bajío” region (Guanajuato, Mexico)
| Property/biocompound | Blackberry | Raspberry | Strawberry |
| Moisture content (%w.b.) | 88.15±1.32a | 88.57±0.72a | 90.50±0.84a |
| pH | 3.21±0.07a | 3.60±0.28a | 3.37±0.10a |
| Titratable acidity (%citric acid) | 1.06±0.09a | 1.40±0.02b | 1.02±0.02a |
| Total soluble solids (ºBx) | 8.45±0.21a | 8.7±0.07a | 8.00±0.14b |
| Phenolic compounds content (mg gallic acid equivalent/g fresh berry) | 34.16±0.72a | 38.09±0.07b | 85.44±3.01c |
| Total flavonoids content (mg quercetin/100 g fresh berry) | 16.99±5.43a | 6.32±0.03b | 8.09±0.15c |
| Anthocyanin content (mg cyanidin 3-glucoside equivalent/100 g fresh berry) | 11.59±3.15a | 1.50±0.01b | 2.55±0.05c |
Means followed by the same letter are not significantly different among berries, according to Tukey’s test (p < 0.05).
3.2Dielectric constant
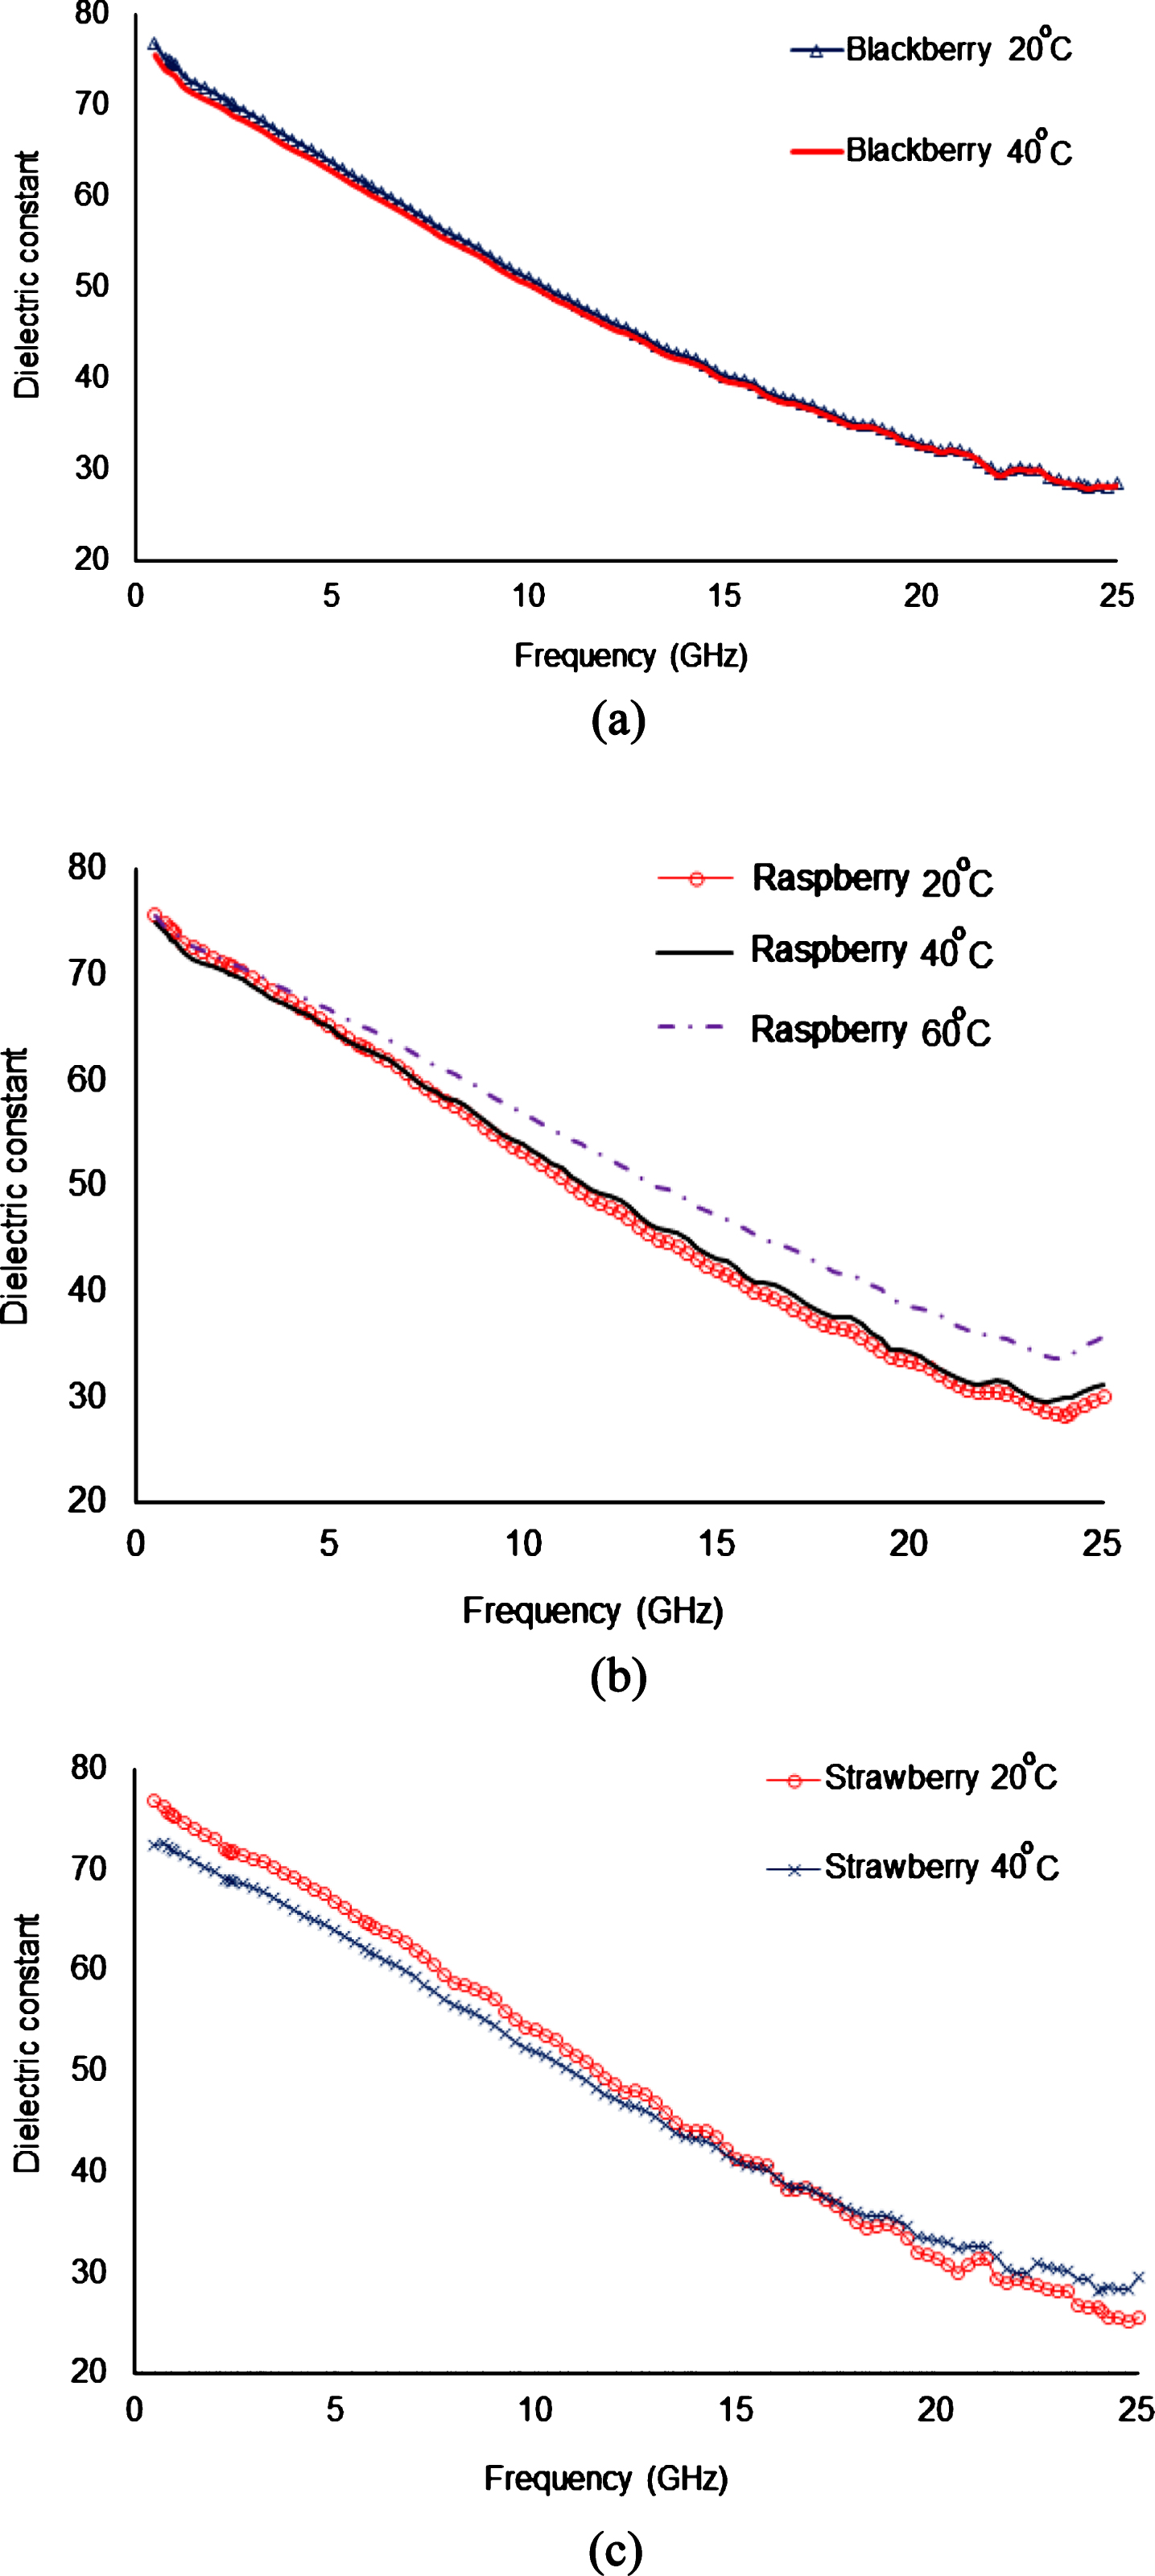
Figure 1 shows the dielectric constant for the berries, which decreased with increasing frequency. At 0.5 GHz, ɛ′ values for all berries were around 77 diminishing to 28 at 25 GHz. With respect to temperature, no significant difference was observed between ɛ′ values at 20 and 40°C for blackberries and raspberries (p > 0.05), as it is shown in Fig. 1a and 1b. In the case of strawberries (Fig. 1), higher values for dielectric constant were found at the temperature of 20°C, at frequencies under 8 GHz (p < 0.05) in comparison with those measured at 40°C. The dielectric constant had higher values at 60°C only for raspberries (p < 0.05), shown in Fig. 1a.
Fig. 1
Dielectric constant of a) blackberry, b) raspberry and c) strawberry from “El Bajío” region (Guanajuato, Mexico).
3.3Dielectric loss factor
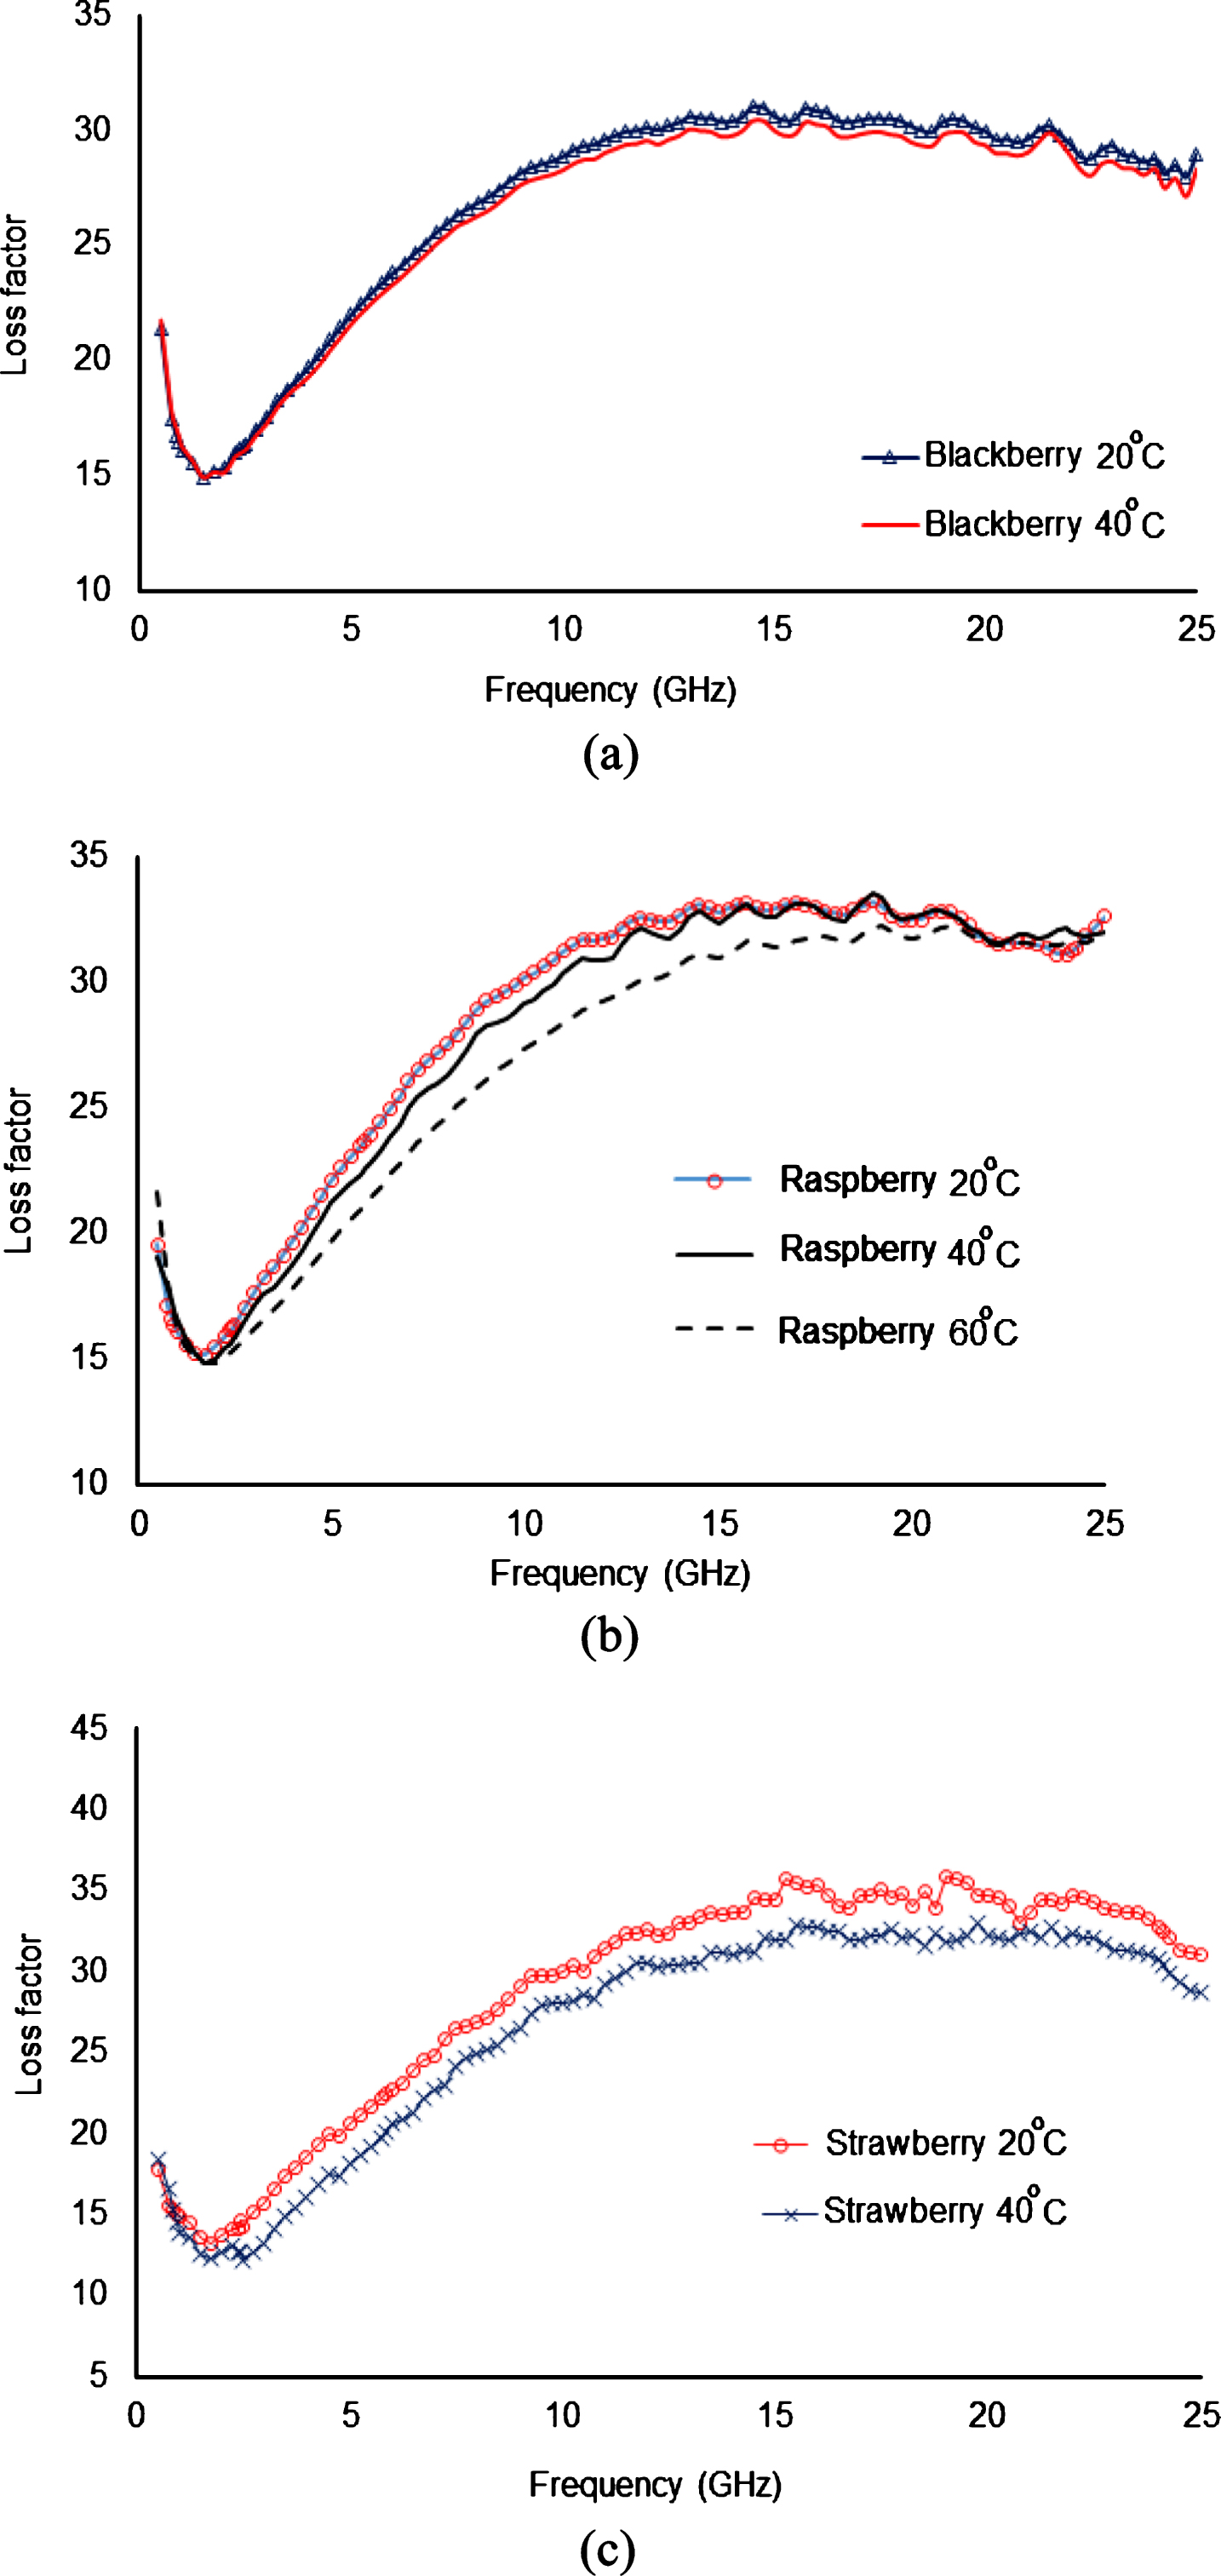
The loss factor of the studied berries decreased from 0.5 to 2 GHz and then, increased with increasing frequency (Fig. 2). The loss factor was not affected by the temperature in the range from 0.5 to 2 GHz for the three studied berries (p > 0.05), but it decreased with increasing temperature from 5 to 20 GHz for all the samples (p < 0.05). Values for ɛ″ at 5 GHz are around 17.5–18.5 and increased to more than 31 at 20 GHz for the raspberries (Fig. 2b). Lower ɛ″ were observed for blackberry samples at these frequencies (Fig. 2a).
Fig. 2
Dielectric loss factor of a) blackberry, b) raspberry and c) strawberry from “El Bajío” region (Guanajuato, Mexico).
3.4Penetration depth
The calculated penetration depth values (cm) for berries at different temperatures are presented in Table 2. Penetration depth fell down with increasing frequency. There was no effect of the temperature on d p for berries in the studied range (p > 0.05). d p values for blackberry and strawberry (2.7–2.56 cm) were lower (p < 0.05) than the exhibited for strawberry at same frequency and temperature (3.14–3.56 cm).
Table 2
Dielectric properties (ɛ′ and ɛ″) and penetration depth (dp) of berries at 20, 40 and 60°C at allocated frequencies by the Federal Communication Commission (FCC, USA)
| Temperature (°C) | Dielectric property/dp (cm) | Frequency (MHz) | ||
| 915 | 2450 | 5800 | ||
| Blackberry | ||||
| 20 | ɛ′ | 74.69 | 70.15 | 61.37 |
| ɛ″ | 16.42 | 16.26 | 23.59 | |
| dp | 2.7 | 1.01 | 0.27 | |
| 40 | ɛ′ | 73.44 | 69.02 | 60.46 |
| ɛ″ | 16.63 | 16.06 | 23.13 | |
| dp | 2.64 | 1.018 | 0.27 | |
| 60 | ɛ′ | 67.51 | 63.81 | 57.41 |
| ɛ″ | 16.47 | 13.85 | 19.08 | |
| dp | 2.56 | 1.34 | 0.32 | |
| Raspberry | ||||
| 20 | ɛ′ | 74.36 | 70.86 | 63.18 |
| ɛ″ | 16.39 | 16.28 | 23.73 | |
| dp | 2.70 | 1.02 | 0.28 | |
| 40 | ɛ′ | 73.49 | 70.11 | 63.03 |
| ɛ″ | 16.90 | 15.78 | 22.59 | |
| dp | 2.59 | 1.04 | 0.29 | |
| 60 | ɛ′ | 74.13 | 71.21 | 65.14 |
| ɛ″ | 16.75 | 15.39 | 21.22 | |
| dp | 2.63 | 1.07 | 0.31 | |
| Strawberry | ||||
| 20 | ɛ′ | 72.02 | 68.71 | 61.66 |
| ɛ″ | 12.19 | 12.90 | 21.35 | |
| dp | 3.56 | 1.26 | 0.30 | |
| 40 | ɛ′ | 85.01 | 81.68 | 74.31 |
| ɛ″ | 14.80 | 15.80 | 24.80 | |
| dp | 3.14 | 1.12 | 0.28 | |
| 60 | ɛ′ | 72.09 | 70.49 | 66.90 |
| ɛ″ | 13.07 | 11.23 | 16.05 | |
| dp | 3.21 | 1.46 | 0.42 | |
4Discussion
Moisture content of the three studied berries ranged between 88.15 and 90.50% (w.b.), being similar to the values reported by Funebo and Ohlsson [11] for strawberries (91% w.b.), Golding et al. [23] for raspberry after 2 days of storage (86.83% w.b., without treatment) and Acosta-Montoya et al. [24] for blackberries (85.1% for a maturity stage grade 3). Small differences may be due to variety and maturity stage. Also, the USDA [25] reports moisture content values from 85 to 90% for these berries. The quality of the studied raspberry fruits is similar that the reported by Golding et al. [23], who reported values of 9.8ºBx, 1.58% citric acid, and 240 mg anthocyanins/kg fresh berry for raspberries cv. ‘Maravilla’ from Australia. For blackberries from Costa Rica, Acosta-Montoya et al. [24] reported 5–7.7ºBx for TSS (lower than the analyzed in our study), and 1.03–8.3 mg cyanidin 3-glucoside equivalents/g (higher than the studied samples from Guanajuato, Mexico). Villa-Rojas et al. analyzed strawberries from Puebla, Mexico, and found 7.80ºBx (very similar to our data) and 0.66% of titratable acidity (lower than strawberries studied in this work). Differences are due to the variety, maturity stages and origin of the berries.
Strawberries from “El Bajío” region, at 915 MHz and 20°C, had ɛ′=72.02 and ɛ″=12.19, values close to the early reports of Nelson et al. [10] (ɛ′=73 and ɛ″=14), and by Fubeno and Ohlsson [11], with values of ɛ′=73 and ɛ″=15.
Dielectric constant at 2.45 GHz and 20°C was similar for blackberry and strawberry (p > 0.05), with values between 68.68 and 69.86. These values were significantly lower than the raspberries measurements, with an average of ɛ′=71 (p < 0.05). This result is related to higher titratable acidity in the raspberries. Decreasing of ɛ′ with respect to increasing frequency has been reported for other fruits, such as apples, cherries and oranges [27], mango [28], guava fruit, prickly pear and mamey sapote [21]. The behavior of ɛ′ for strawberries (decreasing with increasing temperature) was also observed in bananas measured at 2450 MHz by Sipahioglu and Barringer [29], with higher decreasing at higher temperatures, from 60 to 130°C.
The “U” shape for dielectric loss factor when plotted versus frequency, was also reported for other fruits (guava fruit, prickly pear and mamey sapote [21]), and explained by Ryynänen [3], due to the influence of conductivity losses at low frequencies, but increasing ɛ″ at higher frequencies due to dipolar relaxations. Loss factor at 915 MHz from 20 to 60°C for blackberries were from 16.42 to 16.63, raspberries 16.39 to 16.90, and strawberries from 12.19 to 14.80. These berries’ values were higher than the reported for apples (8.5–10) [27] and prickly pears (8.2 to 10.8) [21], similar than mangoes (13.8 to 17.5) [28], but lower than cherries (16.4–20.4) and oranges (16.5 to 18.4) [27]. At 2450 MHz and 60°C, the ɛ″ values of berries were from 11.23 to 15.39, being higher than the reported for apples at same frequency and temperature, with values of 7 [29]. The results are related with higher moisture content of the berries (88 to 90%, w.b.) in comparison with the moisture content of the measured apples (84.89%).
At 915 MHz, the penetration depth was about 2.5 and 3.6 cm, with a good penetration of the microwaves into the berries, taking account the small size of these fruits. With the dp falling with increasing frequency, the effect of microwaves at 5800 MHz would be only on the surface of the berries, as the penetration reach only 0.27–0.42 cm inside the product.
The penetration depth calculated for berries at 915 MHz at 20°C (2.7 cm for blackberry and raspberry, and 3.56 cm for strawberry) is very similar to the reported by cherry at same frequency and temperature, with a dp value of 2.8 cm [27]. Both berries and cherries are red fruits highly appreciated for their sensory characteristics.
These penetration depth results show that 915 and 2450 MHz frequencies are useful for microwave-based disinfestation and drying processes. For example, at 2450 MHz, a drying bed should not be higher than 1 cm for berries, in order to assure the penetration of the waves and provoke the evaporation of the moisture in the berries. Another case would be the continuous microwave pasteurization of berries’ purees at 915 MHz; the holding tube could be 5.2 cm of internal diameter to have effective microwave penetration and subsequent heating in blackberries and raspberries. Even a 6.28 cm diameter tube could be used for strawberry purees, as its penetration depth was deeper. Other applications, such as avoiding decay promoted by molds, could be carried out, as molds grow in the surface of the berries and the microwaves will easy penetrate the surface of the berries at high temperatures (40–60°C) in order to inactivate the microorganism.
The presented dielectric properties and penetration depth values for berries from “El Bajío” contribute to the characterization of these emblematic crops in the region of Guanajuato, Mexico. Also, the results are important to develop new processes based on microwaves, which will enhance and preserve the valuable characteristics of these fruits.
Conflict of interest
The authors have no conflict of interest to report.
Acknowledgments
The authors want to thank Secretaria de Innovación, Ciencia y Educación Superior del Estado de Guanajuato (Mexico) for the financial support of the project “Caracterización dieléctrica y fisicoquímica de frutos rojos del Bajío”, Convenio 100/2016 UG.
References
[1] | Risman P.O. . Terminology and notation of microwave power and electromagnetic energy. Journal of Microwave Power and Electromagnetic Energy. (1991) ;26: :243–50. |
[2] | Sosa-Morales M.E. , Valerio-Junco L. , García H.S. , López-Malo A. . Dielectric properties of foods: Reported data in the 21st Century and their potential applications. LWT- Food Science and Technology. (2010) ;43: :1169–79. |
[3] | Ryynänen S. . The electromagnetic properties of foods materials: A review of the basic principles. Journal of Food Engineering. (1995) ;26: :409–29. |
[4] | Içier F. , Baysal T. . Dielectric properties of food materials- Measurement techniques. Critical Reviews in Food Science and Nutrition. (2004) ;44: :473–8. |
[5] | Berbert P.A. , Queiroz D.M. , Melo E.C. . Dielectric properties of common bean. Biosystems Engineering. (2002) ;83: :449–62. |
[6] | Guo W. , Wang S. , Tiwari G. , Johnson J.A. , Tang J. . Temperature and moisture dependent dielectric properties of legumes associated with dielectric heating. LWT –Food Science and Technology. (2010) ;43: :193–201. |
[7] | Nelson S.O. , Trabelsi S. . Models for the microwave dielectric properties of grain and seed. Transactions of the ASABE. (2011) ;54: :549–53. |
[8] | Torrealba-Meléndez R. , Sosa-Morales M.E. , Olvera-Cervantes J.L. , Corona-Chávez A. . Dielectric properties of cereals at frequencies useful for processes with microwave heating. Journal of Food Science and Technology. (2015) ;52: :8403–9. |
[9] | Tang J. . Unlocking potentials of microwaves for food safety and quality. Journal of Food Science. (2015) ;80: :E1776–93. |
[10] | Nelson S.O. , Forbus W.R. Jr , Lawrence K. . Microwave permittivities of fresh fruits and vegetables from 0.2 to 20GHz. Transactions of the ASAE. (1994) ;37: :183–9. |
[11] | Funebo T. , Ohlsson T. . Dielectric properties of fruits and vegetables as a function of temperature and moisture content. Journal of Microwave Power and Electromagnetic Energy. (1999) ;34: :42–54. |
[12] | Piotrowski D. , Lenart A. , Wardzynski A. . Influence of osmotic dehydration on microwave-convective drying of frozen strawberries. Journal of Food Engineering. (2004) ;65: :519–25. |
[13] | Contreras C. , Martín-Esparza M.E. , Chiralt A. , Martínez-Navarrete N. . Influence of microwave application on convective drying: Effects on drying kinetics, and optical and mechanical properties of apple and strawberry. Journal of Food Engineering. (2008) ;88: :55–64. |
[14] | Wojdyło A. , Figiel A. , Oszmiański J. . Effect of drying methods with the application of vacuum microwaves on the bioactive compounds, color, and antioxidant activity of strawberry fruits. Journal of Agricultural and Food Chemistry. (2009) ;57: :1337–43. |
[15] | Villa-Rojas R. , López-Malo A. , Sosa-Morales M.E. . Hot water bath treatments assisted by microwave energy to delay postharvest ripening and decay in strawberries (Fragaria × ananassa). Journal of the Science of Food and Agriculture. (2011) ;91: :2265–70. |
[16] | Marszałek K. , Woźniak Ł. , Skapska S. , Mitek M. . A comparative study of the quality of strawberry purée preserved by continuous microwave heating and conventional thermal pasteurization during long-term cold storage. Food and Bioprocess Technology. (2016) ;9: :1100–12. |
[17] | AOAC, Official Methods of Analysis. Association of Official Analytical Chemists, Washington, DC, (1996) . |
[18] | Slinkard K. , Singleton V.L. . Total phenol analysis: Automation and comparison with manual methods. American Journal of Enology and Viticulture. (1977) ;28: :49–55. |
[19] | Arvouet-Grand A. , Vennat B. , Pourrat A. , Legret P. . Standardization d’une extrait de propolis et identification des principaux constituents. Journal de Pharmacie de Belgique. (1994) ;49: :462–8. |
[20] | Cheng G.W. , Breen P.J. . Activity of phenylalanine ammonia-lyase (PAL) and concentrations of anthocyanins and phenolics in developing strawberry fruit. Journal of the American Society for Horticultural Science. (1991) ;116: :865–9. |
[21] | Kaur T.K. , Olvera-Cervantes J.L. , Corona-Chávez A. , Rojas-Laguna R. , Sosa-Morales M.E. . Dielectric properties of guava, mamey sapote, prickly pears and nopal in the microwave range. International Journal of Food Properties. (2017) ); In Press. |
[22] | USDA (Unites States Department of Agriculture). Kinetics of microbial inactivation for alternative food processing technologies. Microwave and radio frequency processing http://www.fda.gov/Food/FoodScienceResearch/SafePracticesforFoodProcesses/ucm50.htm. (2015) . |
[23] | Golding J.B. , Blades B.L. , Satyan S. , Jessup A.J. , Spohr L.J. , Harris A.M. , Davies J.B. . Low dose gamma irradiation does not affect the quality, proximate or nutritional profile of ‘Brigitta’ blueberry and ‘Maravilla’ raspberry fruit. Postharvest Biology and Technology. (2014) ;96: :49–52. |
[24] | Acosta-Montoya O. , Vaillant F. , Cozzano S. , Mertz C. , Pérez A.M. . Phenolic content and antioxidant capacity of tropical highland blackberry (Rubus adenotrichus Schltdl.) during three edible maturity stages. Food Chemistry. (2010) ;119: :1497–501. |
[25] | USDA. United states Department of Agriculture. Agricultural Research Service. National Nutrient Database for Standar Reference Release 28. Available at: https://ndb.nal.usda.gov/ndb/search Accessed May 2, 2017. |
[26] | Villa-Rojas R. , Sosa-Morales M.E. , López-Malo A. , Tang J. . Thermal inactivation of Botrytis cinerea conidia in synthetic medium and strawberry puree. International Journal of Food Microbiology. (2012) ;155: :269–72. |
[27] | Wang S. , Tang J. , Johnson J.A. , Mitcham E. , Hansen J.D. , Hallman G. , Drake S.R. , Wang Y. . Dielectric properties of fruits and insect pests as related to radio frequency and microwave treatments. Biosystems Engineering. (2003) ;85: :201–12. |
[28] | Sosa-Morales M.E. , Tiwari G. , Wang S. , Tang J. , García H.S. , López-Malo A. . Dielectric heating as a potential post-harvest treatment of disinfesting mangoes I: Relation between dielectric properties and ripening. Biosystems Engineering. (2009) ;103: :297–303. |
[29] | Sipahioglu O. , Barringer S.A. . Dielectric properties of vegetables and fruits as a function of temperature, ash and moisture content. Journal of Food Science. (2003) ;68: :234–239. |


