
Variability in phenolics, flavonoids and antioxidants in Seabuckthorn (Hippophae rhamnoides L.) seed from nine trans-Himalayan natural population
Abstract
BACKGROUND:
Seabuckthorn (SBT) has recently gained worldwide attention for its medicinal and nutritional potential. Many of the claims associated with SBT are related to its phenolics and antioxidants.
OBJECTIVE:
The work aimed at studying the variability and genotypic effects on total phenolic content (TPC), total flavonoid content (TFC) and total antioxidant capacity (TAC) in seed.
METHOD:
Seed extracts of nine natural population of SBT (122 plants) were studied for TPC, TFC and TAC content.
RESULTS:
SBT seed were found to be rich in TPC ranging from 32 to 208 mg gallic acid equivalent/g DW. Flavonoid content ranged from 8 to 38 mg quercetin equivalent/g of DW. The free radical-scavenging activity in terms of inhibitory concentration (IC50) ranged from 0.3 to 9.2 mg/ml and ferric reducing antioxidant potential (FRAP) from 11 to 97 mmol Fe (II)/g.
CONCLUSION:
A variation of 1–6.5 fold in TPC, 1–4.7 fold variation in TFC, 1–8.8 fold in ferric reducing antioxidant potential and, 1–30.6 folds in IC50 by 2,2-Diphenyl-1-picrylhydrazyl (DPPH) assay among the examined seeds across nine populations underlines the important role played by genetic background and the geographical location for determining the health promoting compounds.
1Introduction
Seabuckthorn (Hippophae rhamnoides L., Elaeagnaceae) is an ecologically and economically important plant and is native to Europe and Asia. The species is widely used in traditional Chinese medicine since the Tang Dynasty, going back more than 1000 years [1]. There are over a hundred popular Seabuckthorn (SBT)-based formulations in various pharmacopoeias of Sowa Rigpa (Tibetan medicine) [2]. SBT has recently gained worldwide attention mainly for its medicinal and nutritional potential [1] and it is currently domesticated in several parts of the world [3].
Total phenolic content (TPC), total flavonoid content (TFC) and total antioxidant capacity (TAC) of various parts of SBT has been extensively studied. The seed contain much higher antioxidant and phenolics as compare to leaf, stem and pulp [4–6]. However, quantification of the health-promoting compounds in seed has been studied either in elite selections or within a limited number of samples. TPC and TAC depend on specific plant genotype and interaction of cultivation condition [7]. Although the importance of genotype in determining TPC and TAC in selected fruits has been demonstrated [7–11], the effect has not been deeply investigated in SBT. Previous studies [12, 13] reported genotypic effect and variability in antioxidant activity of fleshy part of SBT berries in wild genotypes and natural populations. However, studies involving SBT seed in large population have not been reported, which is required for selection of genotypes for breeding and large scale cultivation for use of seed for nutraceutical purpose. Therefore, the objective of the present study was to investigate variability and genotypic effect on TPC, TFC and TAC in SBT seed from 122 plants representing nine natural populations.
2Materials and methods
2.1Sample collection and chemicals
Ripe berries were harvested in October 2014 from nine natural populations of Hippophae rhamnoides L. comprising 122 mature female plants sampled randomly across the major distribution site from Indian trans-Himalaya. A voucher specimen has been deposited in the herbarium of Department of Medicinal and Aromatic Plants, DIHAR, Leh, India. The altitude of collection sites ranged from 3154 to 3794 m a.s.l. (Table 1). Samples were collected with fruiting twigs and 2000 to 3000 g ripe berries were removed manually from each plant and pooled to constitute a single sample. Seeds were separated manually, shade dried and grind to fine powder with mortar and pestle. Solvents and Folin-Ciocalteu reagent were purchased from Merck, Germany; 1,1-diphenyl-2-picrylhydrazyl radical (DPPH), 2,4,6-tripyridyl-s-triazine (TPTZ), gallic acid, quercetin and ferrous sulfate hexahydrate were purchased from Sigma-Aldrich, USA. All other chemicals were of analytical grade.
Table 1
Locations of nine natural populations of H. rhamnoides L. from Indian trans-Himalaya
| Sampling Locations | Population ID | Latitude (N) | Longitude (E) | Altitude (m) ASL | Sample size (no. of samples) |
| Phey | PHY | 34°08′0.1″ | 77°27′0.8″ | 3154±9 | 15 |
| Choglamsar | CHG | 34°06′0.1″ | 77°35′0.4″ | 3176±6 | 15 |
| Shey | SHY | 34°04′0.0″ | 77°37′0.9″ | 3201±11 | 17 |
| Stakna | STN | 34°00′0.7″ | 77°40′0.5″ | 3236±3 | 10 |
| Chuchot | CHU | 34°05′0.5″ | 77°35′0.9″ | 3240±6 | 11 |
| DIHAR | DIH | 34°08′0.2″ | 77°34′0.3″ | 3340±9 | 11 |
| Stakmo | STM | 34°06′0.2″ | 77°41′0.2″ | 3584±4 | 10 |
| Pheyang | PHG | 34°11′0.5″ | 77°30′0.0″ | 3588±28 | 22 |
| Horzey | HOR | 34°11′0.9″ | 77°36′0.0″ | 3794±15 | 11 |
2.2Preparation of extract
Shade dried powdered samples were subjected to two cycles of extraction with methanol followed by two cycles of extraction with acetone. Each sample (20 to 40 mg) was extracted for 15 min with 1.5 ml methanol in a 2 ml micro centrifuge tube and vortexed at room temperature. The sample was centrifuged at 5600 g for 10 min and the supernatant was recovered. The residue was mixed with 1.5 ml of acetone and the process was repeated as described above. TPC, TFC and TAC were measured directly in the methanolic and acetone extracts and the values were combined mathematically. The first extraction cycle with methanol extracted over 90% of TPC, TAC and TFC; and the second extraction cycle with acetone contributed only 2% of TPC and TAC, and 7% TFC yield in SBT seed extracts.
2.3Determination of total phenolic content
The Folin-Ciocalteu reagent assay was used to determine the TPC [14]. An aliquot of the samples (30 μl) was introduced into 96 well micro-plate followed by 150 μl Folin-Ciocalteu reagent, which was previously diluted with distilled water (1 : 10) and 120 μl sodium carbonate (75 g/l). The micro-plates were vortexed, covered with parafilm and allowed to stand for 30 min in ELISA reader. Absorbance at 765 nm was recorded in a micro-plate reader (SpectroMax M2 e, Molecular Devices, Sunnyvale, CA, United States). TPC was expressed in gallic acid equivalents (GAE mg/g). The calibration equation for gallic acid was y = 0.005×–0.0018 (R2 = 0.988) where y is the absorbance at 765 nm and x is the concentration of gallic acid in mg/l.
2.4Determination of total flavonoid content
Estimation of total flavonoid content was carried out using the method previously described [15]. Briefly, to 100 μl of sample, 100 μl of 2% AlCl3 solution was added. The content was incubated for 1 h at room temperature and absorbance measured at 420 nm. TFC was expressed as quercetin equivalent (QE) using the following equation based on calibration curve y = 0.014×–0.172 (R2 = 0.982) where y is absorbance at 420 nm and x is the concentration of quercetin mg/l. TFC was expressed as mg QE/g DW.
2.5Determination of antioxidant capacity
Ferric reducing antioxidant potential (FRAP) assay was conducted using the method previously described [16] with minor modifications [9]. A total of 7.5 μl of extract and 22.5 μl of distilled water were added to 225 μl of freshly prepared FRAP reagent (10 parts of 300 mmol/l sodium acetate buffer at pH 3.6, one part of 10 mmol/l TPTZ solution and one part of 20 mmol/l FeCl3.6H2O) and the reaction mixture was incubated for 30 min. The increase in absorbance was measured at 593 nm. The calibration equation for FeSO4.7H2O was y = 0.010×–0.011 (R2 = 0.996) where y is the absorbance at 593 nm and x is the concentration of FeSO4.7H2O in mM. FRAP value was expressed as mmol Fe(II)/g DW. Free radical scavenging method by DPPH developed by Brand-Williams et al. [17] was followed with minor modification [9]. A 0.1 mmol/l solution of DPPH in methanol was prepared and 300 μl of the solution was treated with 15 μl of pooled methanolic and acetone samples. A control was treated with 15 μl of solvent instead of the extract. The mixture was left to stand at room temperature for 30 min before the decrease in absorbance at 517 nm was recorded. Antioxidant value was expressed as IC50, the amount of sample extracted into 1 ml solution necessary to decrease by 50% the initial DPPH concentration. IC50 was derived from the % disappearance vs. concentration plot (concentration means mg of SBT seed on DW basis extracted into 1 ml solution).
2.6Statistical analysis
All the experiments were performed in triplicate. Box plot analyses were done with XLSTAT software. Influence of populations on the studied parameters was performed in General Linear Model (GLM). Two-tailed Pearson correlation was done using SPSS 22.0 version for Windows. Significant variation in TPC, TFC and TAC between plants within a population was considered as genotypic effect.
3Results and discussion
3.1Total phenolic content
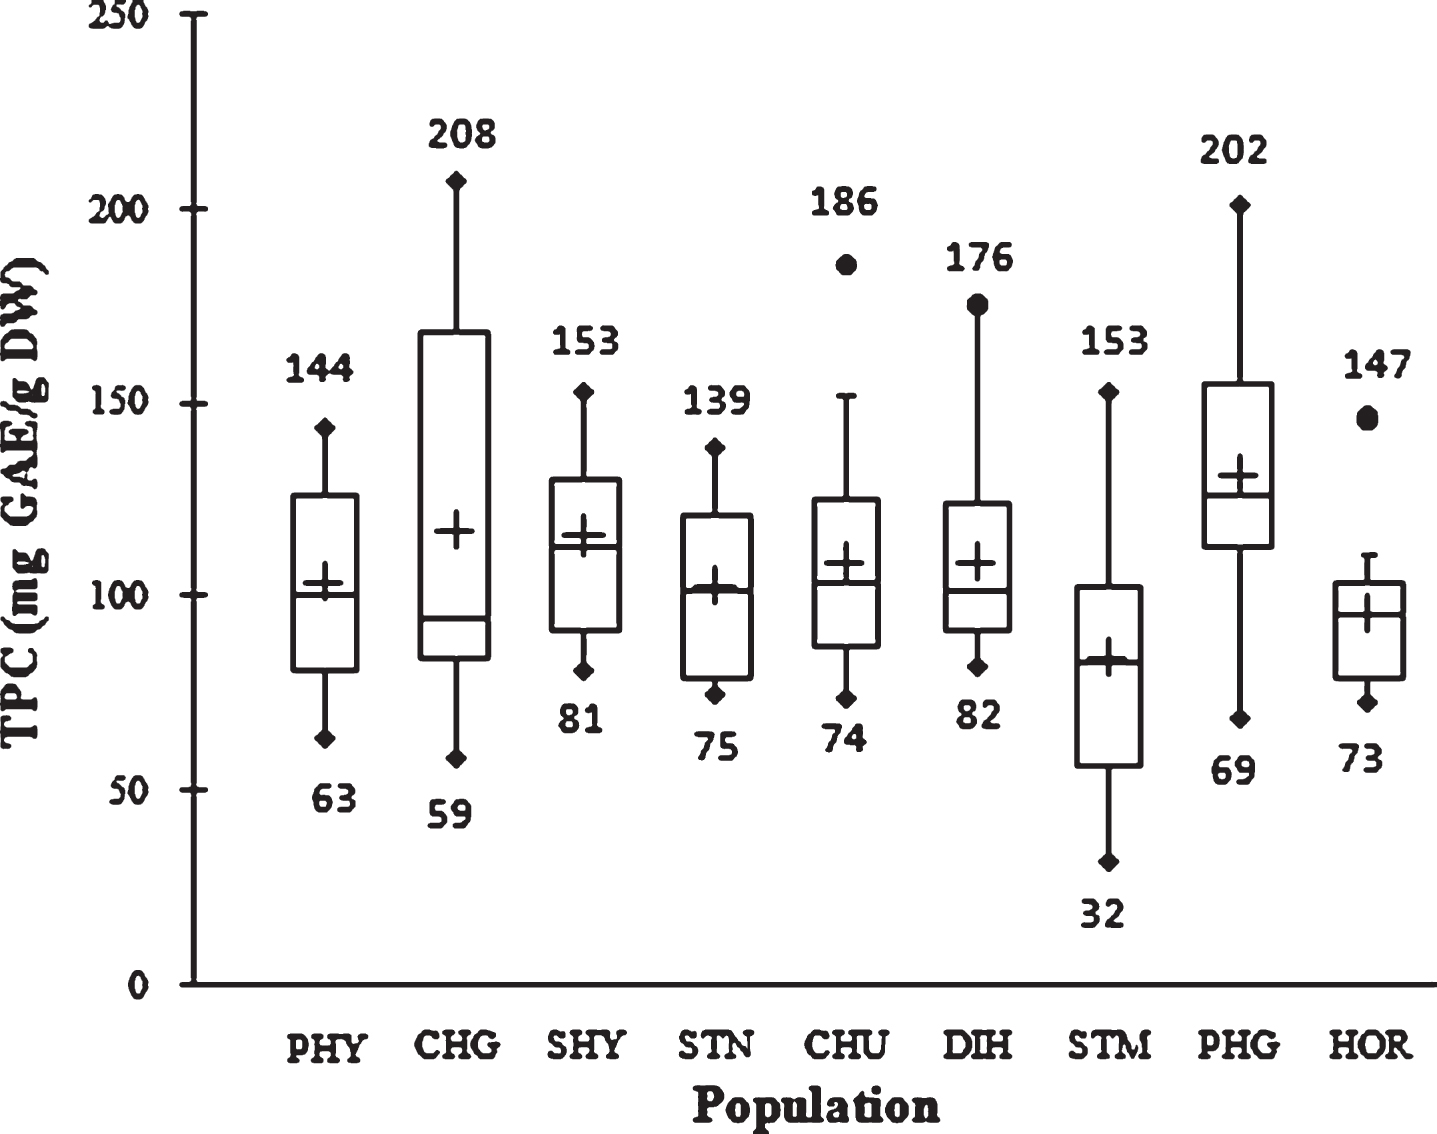
TPC in nine natural SBT populations is presented in Fig. 1. TPC in the first cycle of extraction with methanol showed significantly higher value than the second extraction cycle with acetone. The mean TPC value of 108.3±33.2 mg GAE/g DW was observed in the first extraction cycle while the value was 2.6±1.7 mg GAE/g DW in the second extraction cycle with acetone. At population level, the highest TPC (131.9±33.1 mg GAE/g DW) was observed in PHG while the lowest was observed in STM population (84.2±33.9 mg GAE/g DW). The overall mean TPC was 110.8±33.3 mg GAE/g DW. TPC in SBT ranged from 32 to 208 mg GAE/g between individuals in the studied population. Therefore, a variation of 1–6.5 folds in TPC was observed. Variability within and among populations is presented in Fig. 1. The TPC data mostly distributed at upper quartile among the population. In comparison, dry hazelnut, walnut and pistachios with seed coat contain 425, 589 and 461 mg GAE/100 g, respectively [18].
Fig.1
Box plot distribution of TPC in nine natural SBT populations. The plot represents the minimum and maximum value (whiskers), the first and third quartile (box), the median (midline), first outliers (small black hollow round) and cross (second outliers). Plus mark represent mean value (n = 3).
3.2Total flavonoid content
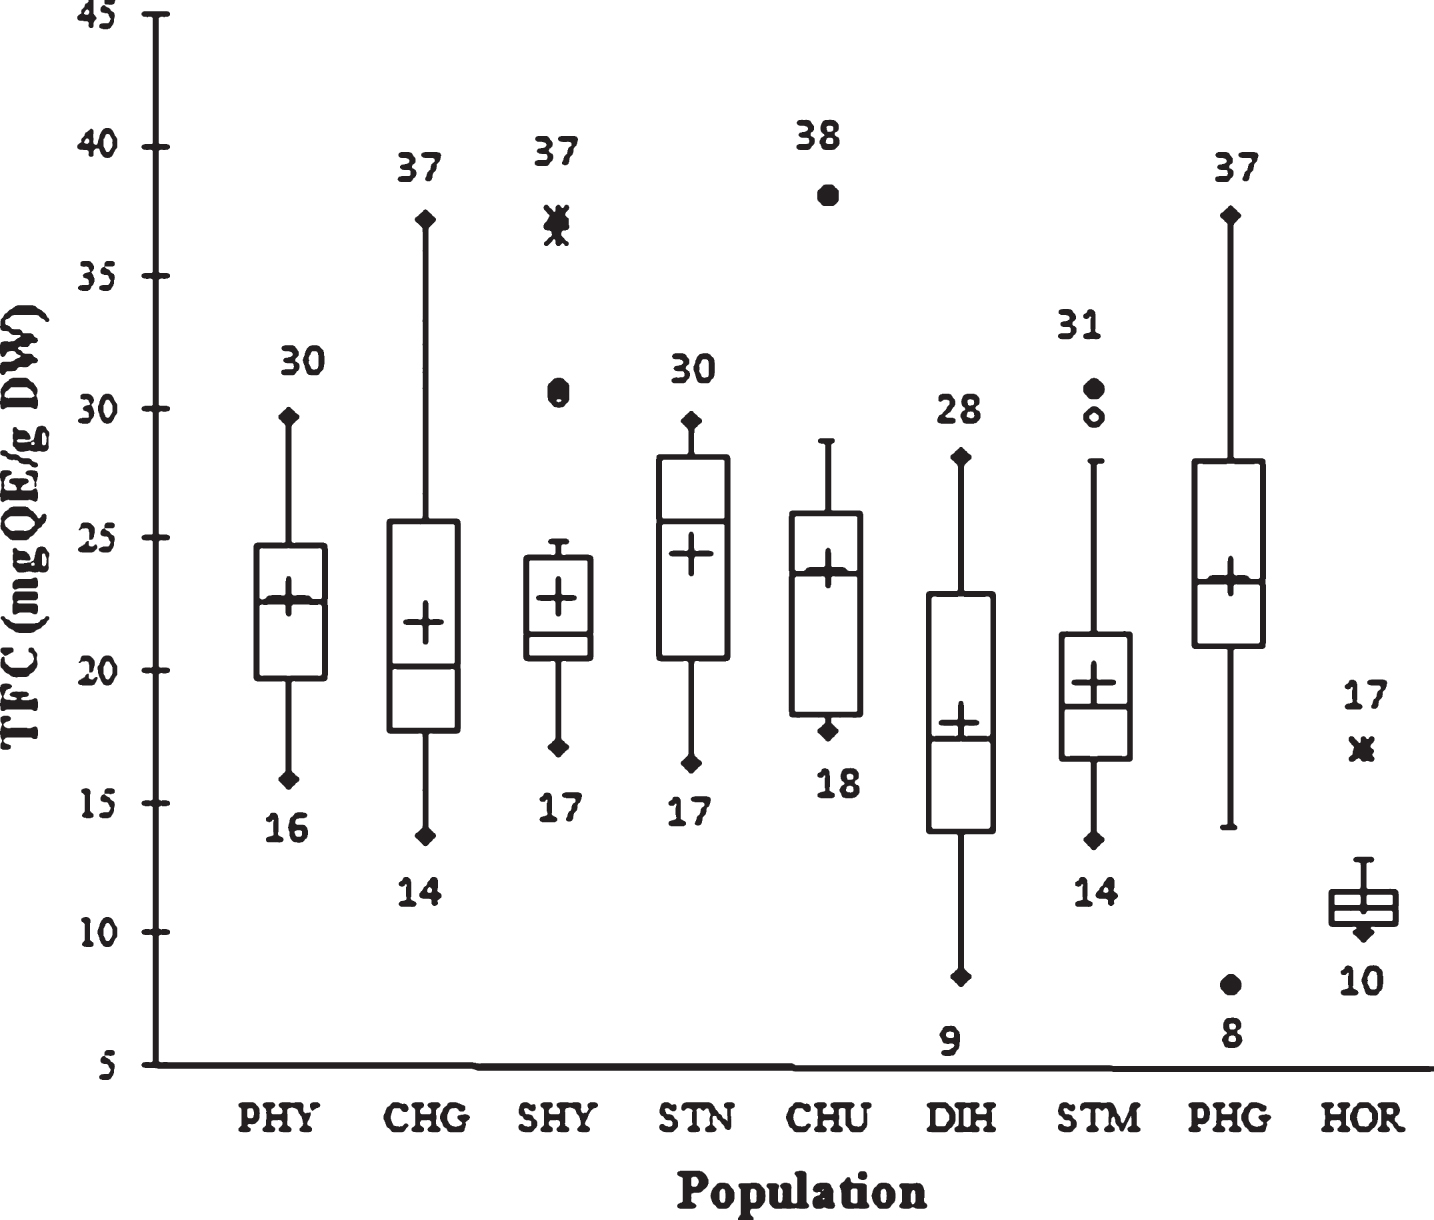
The flavonoid content in SBT seed ranged from 8 to 38 mg QE/g DW. The mean TFC value in the first cycle of extraction with methanol was 19.9±6.2 mg QE/g, whereas the value was 1.5±0.3 mg QE/g in the second cycle of extraction with acetone. The overall mean TFC was 21.4±6.2 mg QE/g DW. Hence, 1–4.7 fold variation was observed. Variability in TFC is presented in Fig. 2. In comparison, Nassourou et al [19] reported that cowpea (Vigna unguiculata L.) seed coat contains 3.6–4.5 mg rutin equivalent total flavonoids per gram dry weight.
Fig.2
Box plot distribution of TFC in nine natural SBT populations. The plot represents the minimum and maximum value (whiskers), the first and third quartile (box), the median (midline), first outliers (small black hollow round) and cross (second outliers). Plus mark represent mean value (n = 3).
3.3Antioxidant activity by FRAP method
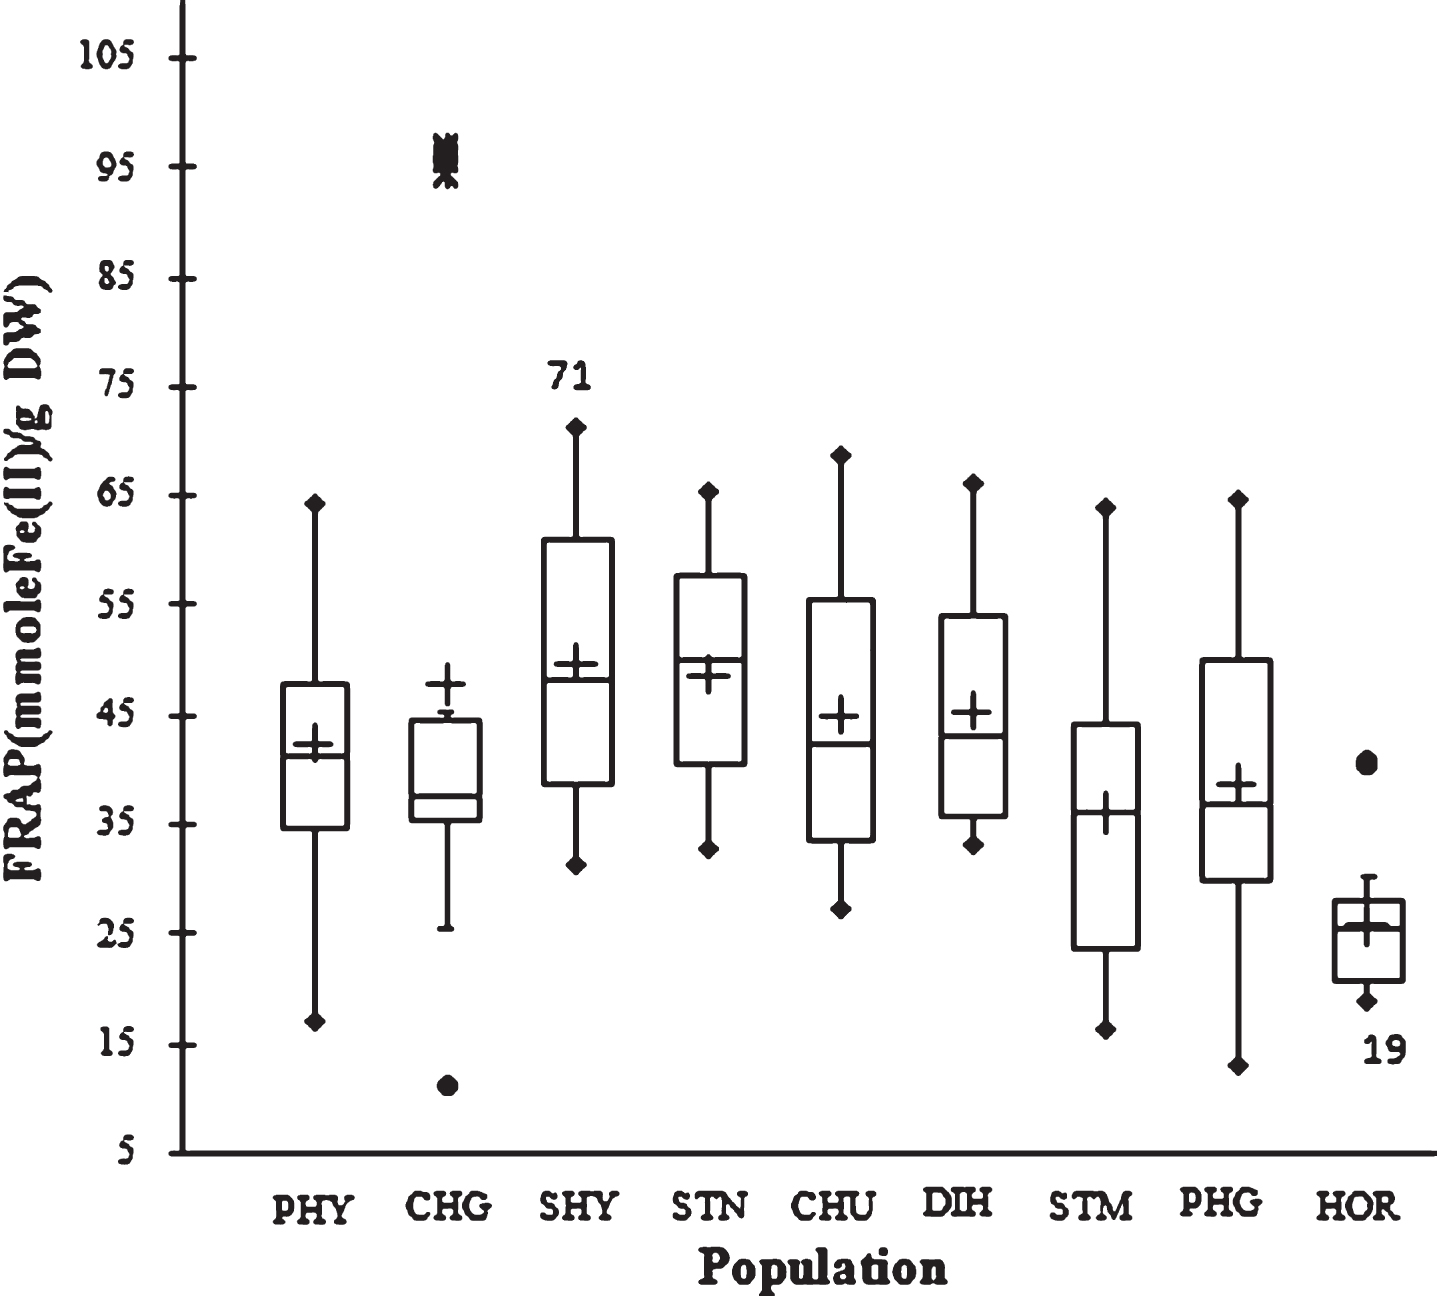
The ability of the seed extracts to reduce ferric ions was determined using the FRAP. It was observed that the first extraction solvent extracted significantly higher antioxidants in the sample. The mean FRAP value of 41.3±15.3 mmol Fe(II)/g was observed in the first extraction cycle while the value was 1.0±0.3 mmol Fe(II)/g in the second extraction cycle with acetone. Higher ferric reducing antioxidant potential with methanol suggests that SBT seed contains significantly higher hydrophilic than lipophilic antioxidants. However, the opposite was reported in apricot kernel [9].
At population level, the highest value was 49.6±11.7 mmol Fe(II)/g (SHY) while the lowest was 25.7±5.8 mmol Fe(II)/g (HOR). The ferric reducing activity ranged from 11 to 97 mmol Fe(II)/g between genotypes. The difference in FRAP value between the genotypes showing the highest and lowest value was 1–8.8 folds, which underlines the importance of the genetic background for determining ferric reducing antioxidant potential of SBT seed (Fig. 3).
Fig.3
Box plot distribution of FRAP in nine natural SBT populations. The plot represents the minimum and maximum value (whiskers), the first and third quartile (box), the median (midline), first outliers (small black hollow round) and cross (second outliers). Plus mark represent mean value (n = 3).
3.4Antioxidant activity by the DPPH method
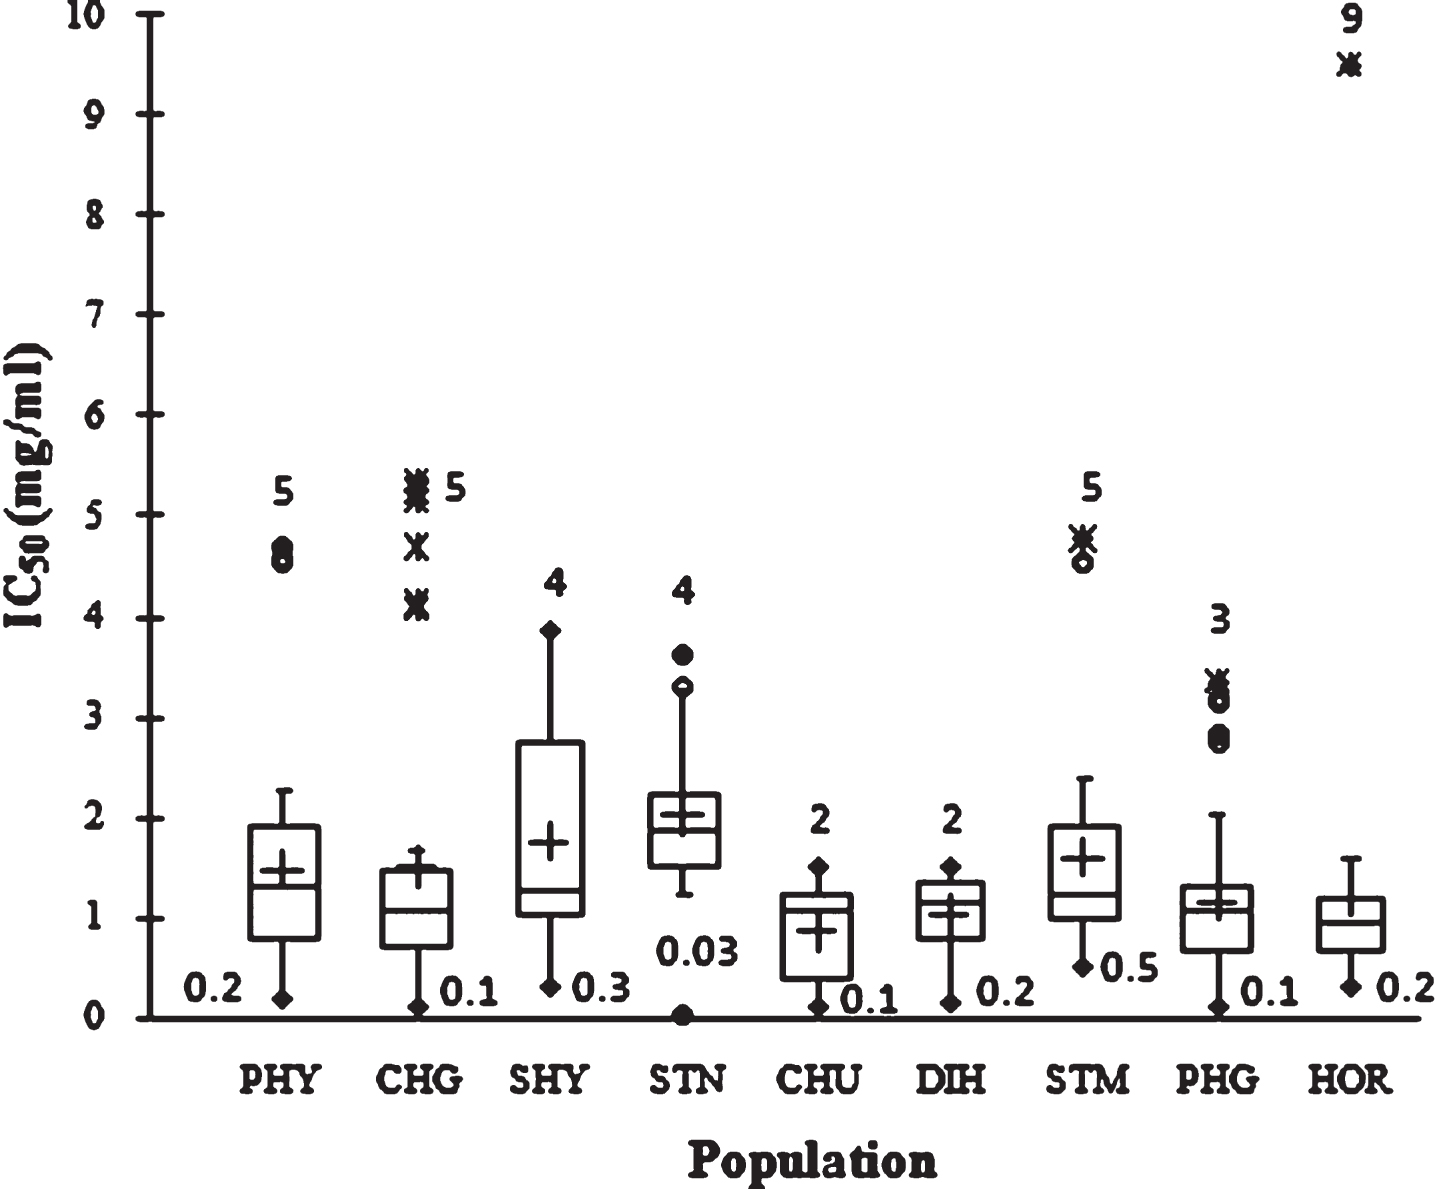
Figure 4 showed the free radical-scavenging activity values measured using DPPH in terms of IC50 (mg/ml extract) of the examined SBT seed. A large range of IC50 value was observed, from 0.3 to 9.2 mg/ml. Large variability within populations was observed. The 1–30.6 fold variation in IC50 values highlighted unexploited variability among the SBT genotypes from trans-Himalayan region. At population level the mean IC50 values was 1.4±1.1 mg/ml and the highest and lowest free radical scavenging activity was 0.86±0.46 mg/ml in CHU and 2.0±0.8 mg/ml in STK, respectively. The order of population in terms of TAC by the two different antioxidant assays was different which could be due to the presence of compounds having different affinity to react with DPPH and FRAP. Similar results have been reported earlier in SBT berry [13].
Fig.4
Box plot distribution IC50 in nine natural SBT populations. The plot represents the minimum and maximum value (whiskers), the first and third quartile (box), the median (midline), first outliers (small black hollow round) and cross (second outliers). Plus mark represent mean value (n = 3).
Significant difference was observed between individual plants within a population in the nine natural populations in terms of TPC, TFC and TAC. This underlines the importance of genetic background for determining health promoting compounds in SBT. Variables such as soil nutrient status, weather conditions and geographical locations have been minimized within a population in the present study, which otherwise may account for variation in the TPC, TFC and TAC. Significant variation between plants within a population could be because SBT is a wind pollinated out-cross species and therefore high genetic variation is expected in natural population. It has been previously demonstrated that the effect of genotype is stronger than that of cultivation conditions for TPC and TAC in strawberry [20]. Significant variation was observed between the nine natural populations in terms of TPC, TFC and TAC, which could be due to environmental factors. Collectively, our data suggest that large variation in health promoting compounds is attributed to both genotype and environmentalfactors.
3.5Correlation analysis
Table 2 displayed the correlation between TPC, TFC, TAC and seed weight. TPC was significantly correlated with TFC (0.267), FRAP (0.402) and IC50 (–0.294). TFC showed significant correlation with FRAP (0.175). DPPH value in terms of IC50 showed significant relation with FRAP (–0.161). However, none of the correlations were highly significant. No significant correlation was observed between seed weight and health promoting content. Similarly, we did not find highly significant correlations between TPC, TAC and TFC with altitudinal gradient. Several studies focused on the relationship between the antioxidant activity and TPC of plant materials showed different relations. The study by Ercisli et al. [12] found no significant correlation between antioxidant capacity and phenolic content in SBT whereas the opposite was found by Capocasa et al. [18] in strawberry. Similarly, Scalzo et al. [7] found no correlation between antioxidant capacity and phenolic content whereas the opposite was found by Connor et al. [21]. In apricot seed, no correlation was found between TPC and IC50 value, and between values obtained from FRAP and DPPH assays [9].
Table 2
Pearson correlation between TPC, TFC, FRAP, IC50, seed weight and altitude
| Variables | TPC | TFC | FRAP | DPPH | Seed Wt | Altitude |
| TPC | 1 | 0.267** | 0.402** | –0.294** | –0.008 | 0.002 |
| TFC | 1 | 0.175** | –0.074 | –0.041 | –0.209** | |
| FRAP | 1 | –0.161** | –0.055 | –0.353** | ||
| DPPH | 1 | 0.003 | –0.133* | |||
| Seed Wt | 1 | –0.063 | ||||
| Altitude | 1 |
**Correlation is significant at the 0.01 level (2-tailed). *Correlation is significant at the 0.05 level (2-tailed). TPC: total phenolic content. TFC: total flavonoid content. FRAP: Ferric reducing antioxidant potential. IC50 : inhibitory concentration, the amount of sample into 1 ml solution necessary to decrease by 50% initial DPPH concentration.
4Conclusions
The influence of plant genetic background on TPC, TFC and TAC in SBT seed was demonstrated. Significant variation was found within and between the nine natural populations, which underline the role of both genetic background and environmental factors for determining the health promoting compounds in SBT seed. Many fold variation in TPC (1–6.5), TFC (1–4.7), ferric reducing activity (1–8.8), and free radical scavenging activity (1–30.6) was observed within the 122 studied plants. First extraction cycle with methanol extracted 98% TPC and TAC, and 93% TFC and remaining were extracted with second extraction cycle with acetone. Therefore, methanol may be considered as a preferred extracting solvent for quantitative measurement of TPC, TAC and TFC in SBT seed. Results obtained in this study demonstrated the need for selection of genotypes for large scale SBT cultivation for use of seed for nutraceutical purpose.
Conflict of interest
There is no conflict of interest associated with this publication.
Acknowledgments
The study was supported by Defence Research and Development Organisation (DRDO), Ministry of Defence, Government of India. DD, PD and SA are grateful to DRDO for providing Research Fellowship. Thanks to Divisional Forest Officer, Leh for granting the permission to survey and collect natural SBT population.
References
[1] | Geetha S , Gupta A . Medicinal and therapeutic potential of Sea buckthorn (Hippophae rhamnoides L.) J Ethnopharmacol. (2011) ;138: :268–78. |
[2] | Stobdan T , Targais K , Lamo D , Srivastava RB . Judicious use of natural resources: A case study of traditional uses of Seabuckthorn (Hippophae rhamnoides L.) in trans-Himalayan Ladakh, India. Natl Acad Sci Lett. (2013) ;36: :609–13. |
[3] | Li TSC . Taxonomy, natural distribution and botany. In: Li TSC. , Beveridge T. (Eds.). Sea buckthorn (Hippophae rhamnoides L.): Production and Utilization. USA; (2003) . pp. 329–56. |
[4] | Sharma UK , Sharma K , Sharma N , Sharma A , Singh HP , Sinha AK . Microwave-assisted efficient extraction of different parts of Hippophae rhamnoides for the comparative evaluation of antioxidant activity and quantification of its phenolic constituents by reverse-phase high-performance liquid chromatography (RP-HPLC). J Agric Food Chem. (2008) ;56: :374–9. |
[5] | Korekar G , Stobdan T , Chaurasia OP , Singh SB . Phenolic content and antioxidant capacity of various solvent extracts from seabuckthorn (Hippophae rhamnoides L.) fruit pulp, seeds, leaves and stem bark Acta Aliment Hung. (2011) ;40: :449–58. |
[6] | Michel T , Destandau E , Floch GL , Lucchesi ME , Elfakir C . Antimicrobial, antioxidant and phytochemical investigations of sea buckthorn (Hippophae rhamnoides L.) leaf, stem, root and seed. Food Chem. (2012) ;131: :754–60. |
[7] | Scalzo J , Politi A , Pellegrini N , Mezzetti B , Battino M . Plant genotype affects total antioxidant capacity and phenolic contents in fruit. Nutrition. (2005) ;21: :207–13. |
[8] | Connor AM , Luby JJ , Tong CBS . Genotypic and environmental variation in antioxidant activity, total phenolic content, and anthocyanin content among blueberry cultivars. J Am Soc Hortic Sci. (2002) ;127: :89–97. |
[9] | Korekar G , Stobdan T , Arora R , Yadav A , Singh SB . Antioxidant capacity and phenolic content of apricot (Prunus armeniaca L.) kernel as a function of genotype. Plant Food Hum Nutr. (2011) ;66: :376–83. |
[10] | Leccese A , Bartolini S , Viti R . From genotype to apricot fruit quality: The antioxidant properties contribution. Plant Food Hum Nutr. (2012) ;67: :317–25. |
[11] | Bajpai PK , Warghat AR , Dhar P , Kant A , Srivastava RB , Stobdan T . Variability and relationship of fruit color and sampling location with antioxidant capacities and bioactive content in Morus alba L. fruit from trans-Himalaya, India. LWT-Food Sci Technol. (2014) ;59: :981–8. |
[12] | Ercisli S , Orhan E , Ozdemir O , Sengul M . The genotypic effects on the chemical composition and antioxidant activity of sea buckthorn (Hippophae rhamnoides L.) berries grown in Turkey. Sci Hort. (2007) ;115: :27–33. |
[13] | Korekar G , Dolkar P , Singh H , Srivastava RB , Stobdan T . Variability and the genotypic effect on antioxidant activity, total phenolics, carotenoids and ascorbic acid content in seventeen natural population of seabuckthorn (Hippophae rhamnoides L.) from trans-Himalaya. LWT-Food Sci Technol. (2014) ;55: :157–62. |
[14] | Singleton VL , Rossi JA . Colorimetry of total phenolics with phosphomolybdic-phosphotungstic acid reagents. Am J Enol Vitic. (1965) ;16: :144–58. |
[15] | Ordon AA L , Gomez JD , Vattuone MA , Isla MI . Antioxidant activity of Sechium edule (Jacq.) swart extracts. Food Chem. (2006) ;97: :452–8. |
[16] | Ikram EHK , Eng KH , Jalil AMM , Ismail A , Idris S , Azlan A , et al . Antioxidant capacity and total phenolic content of Malaysian underutilized fruits. J Food Compos Anal. (2009) ;22: :388–93. |
[17] | Brand-Williams W , Cuvelier ME , Berset C . Use of a free radical method to evaluate antioxidant activity. LWT. (1995) ;28: :25–30. |
[18] | Arcan I , Yemeniciov ğlu A . Antioxidant activity and phenolic content of fresh and dry nuts with or without the seed coat. J Food Compos Anal. (2009) ;22: :184–8. |
[19] | Nassourou MA , Njintang YN , Noubissié TJP , Nguimbou RM , Bell JM . Genetics of seed flavonoid content and antioxidant activity in cowpea (Vigna unguiculata L. Walp). The Crop J. (2016) ;4: :391–7. |
[20] | Capocasa F , Scalzo J , Mezzetti B , Battino M ((2008) ) Combining quality and antioxidant attributes in the strawberry: The role of genotype. Food Chem 111: :872–8. |
[21] | Connor AM , Finn CE , Alspach PA . Genotypic and environmental variation in antioxidant activity and total phenolic content among blackberry and hybridberry cultivars. J Amer Soc Hort Sci. (2005) ;130: :527–33. |


