
Bioactive compound profile and antioxidant activity of fruits from six goji cultivars cultivated in Switzerland
Abstract
BACKGROUND:
Goji berries, traditionally used in Chinese medicine, are nowadays gaining popularity in the Western world. The efforts are made to establish their cultivation in Europe. Goji berries might derive from two closely related species: Lycium barbarum and Lycium chinense, however, plant species is rarely stated by commercial suppliers.
OBJECTIVE:
The aim of this study was to evaluate the antioxidant activity and the bioactive compounds profile of fruits from six goji berries cultivars cultivated in Switzerland and to provide their genetic characterisation.
METHODS:
Goji fruits were cultivated at the experimental field of the Agroscope Research Center in Wallis, Switzerland. The genetic characterization was carried out by amplifying and sequencing two nuclear genes and one chloroplastic gene. The comparison with L. barbarum and L. chinense obtained from the Conservatory and Botanical Garden of Geneva (CBGG) was made. The profile of carotenoids and polyphenols was analysed using an HPLC-DAD. The antioxidant capacity was determined by ORAC and TEAC assays.
RESULTS:
DNA sequencing and phylogenetics confirmed that all the cultivars belonged to the Lycium genus. ‘Tibet’, ‘Red Life’, ‘Sweet Lifeberry’, ‘Big Lifeberry’ seemed to be closely related to a L. barbarum, whereas ‘Number One’ segregated closer to L. chinense. The individual Saxon, appeared genetically different from all other cultivars and the L. barbarum and L. chinense individuals from CBGG. Zeaxanthin esters were the predominant carotenoid in all six cultivars. ’Number One’ had the highest content of phenolic compounds such as rutin and ferulic, chlorogenic, caffeic and p-coumaric acid.
CONCLUSIONS:
The study confirmed the importance of combining the quantification of bioactive compounds with genetic characterisation in the analysis of goji species. The dissimilarity of ‘Number One’ and Saxon from four remaining cultivars investigated in this study was evident from the DNA sequencing and Principal Component Analysis of chemical results.
1Introduction
Goji berries, also known as wolfberries, have been used in the traditional Chinese medicine for thousands of years as anti-hypertension and anti-fatigue agents [1, 2]. Moreover, they are believed to protect hepatic function and to be an effective remedy for the treatment of eye problems, skin rashes and diabetes [3, 4]. The orange-red ovoid berry type fruits are harvested in late summer or early autumn. Usually the sun-dried fruits are commercialised. The traditional consumption of berries recommended by Chinese medicine involves infusion or wine prepared from dried fruits. They can be also used as additive to soup, steamed rice, meat or vegetable dishes [1]. In the Western world goji berries are usually consumed dried as a snack, or as a yoghurt and cereal bar ingredient [2]. Fresh goji berries are also processed into juice [5].
Fruits known under the name of goji berries or wolfberries might derive from two closely related species: Lycium barbarum and Lycium chinense [2]. The origin of L. barbarum plant is not clear but probably can be situated between south-eastern Europe and southwestern Asia. The species has naturalised in Europe and Asia and is widely cultivated in China, mainly in Ningxia and Tianjin Shi provinces. L. chinense is native to China, Taiwan and Japan, widely cultivated in Asia, and naturalised in Europe, eastern United States and Korea [6]. In Europe, only L. barbarum is claimed to be cultivated, but confusions with L. chinense or L. europaeum cannot be excluded. Most of the recommendations for the medicinal use of fruits are congruent for both species, however, L. barbarum is considered more valuable and has a higher price on the market. Due to the price differences adulteration is quite common. The morphological similarity of the two species makes their differentiation by consumer impossible. The distinction is possible only based on molecular techniques [7]. Most of the goji berries present on the world market are grown in the Ningxia Hui region in north-central China and the Xinjiang Uyghur Region in western China [2]. The rapidly growing interest of the consumers from Western countries in functional properties of goji berries, their increasing consumption as well as alarming reports on the pesticides content in fruits originating from China brought about the attempt of their cultivation in Europe [8]. Literature reports the cultivation of goji berries in Romania [9], Bulgaria [10] and Italy [11]. Plants bearing goji berries are commercially available also from plant suppliers in Switzerland. In most of the cases they are claimed to be L. barbarum species, however, the information about their origin arescarce.
The biological activities of goji berries were attributed to the content of bioactive compounds: polysaccharides, carotenoids and polyphenolic compounds. Polysaccharides are estimated to constitute 5–8% of dried fruits, and both their structure and activities were profoundly studied [1, 4, 5]. Potential health benefits of goji berry polysaccharides have been recently reviewed by Jin et al. [12].
Carotenoids are lipid soluble tetraterpenoid compounds and might be classified as carotenes and xantophylls. Xanthophylls can be present in plants in their free form or in a more stable fatty acid esterified form. Carotenoids with more than seven conjugated double bonds absorb light in the visible region in the wavelength range of 400–500 nm [13]. Those compounds are intensively yellow, orange or red and contribute to the external and internal coloration of fruits [14]. Goji berries have a high carotenoid content, representing 0.03–0.5% of the dried fruit [15]. The consumption of carotenoids has been associated with a number of health benefits. β-carotene, α-carotene and cryptoxanthin are major precursors of vitamin A, which can prevent serious eye disease and retarded tooth and bone development [1, 16]. Moreover, carotenoids can act as free radical scavengers and therefore protect cell membrane from damage [13]. The role of lutein and zeaxanthin in protecting against age-related macular degeneration and vision loss has been established [17]. Eleven free carotenoids and seven esterified carotenoids were identified in goji berries [18]. The predominant carotenoid was zeaxanthin dipalmitate followed by cryptoxanthin monopalmitate and zeaxanthin monopalmitate. It was reported that zeaxanthin dipalmitate from wolfberry is well absorbed by humans [19]. Numerous studies showed that goji zeaxanthin exerts antihepatotoxic effects [20, 21] and might prevent cataract and macular degeneration, caused by excessive sun exposure or other oxidative processes [22–25]. These actions are attributed mainly to the capacity to quench singlet oxygen and interact with free radicals [13]. Polyphenolic compounds identified in goji berries up to now include quercetin and kaempferol glycosides, scopeletin as well as phenolic acids i.e. chlorogenic, ferulic, p-coumaric acid and their derivatives [26–28]. Recently, the composition of antioxidant compounds in L. barbarum has been complemented by the identification of some monomers and dimers of phenolic amides containing N-feruloyl tyramine units that have been termed lyciumamides [29, 30]. The flavonoid fraction isolated from goji berries was proved to exhibit anti-inflammatory and anti-angiogenic effect in the experiments using human umbilical vein endothelial cells [31]. It demonstrated the potential role of goji berries in the prevention of atherosclerosis.
Apart from the above mentioned compounds, goji fruits contain 2-O-β-D-glucopyranosyl-L-ascorbic acid (2-β-gAA) [32], which also contributes to their biological activity. This compound is extremely interesting for its high stability and the antioxidant activity similar to vitamin C [33]. The content of 2-β-gAA in dry fruits of Lycium species accounts to 0.5% [32]. However, there is no data on its content if fresh fruits.
The genotype, geographical origin, cultivation conditions, ripeness stage, storage time and conditions affect the composition and biological properties of plant [27, 34]. The importance of genetic origin for full characteristic of fruits was pointed out in numerous studies. The antioxidant capacity of fruits such as strawberries, peaches, apricots and apples was strongly affected by genotype [35]. It was shown that the genetic amendments could significantly influence the composition of phytochemicals and bioactivity of strawberries [36]. The large majority of the studies on bioactive composition and biological activity of goji berries were carried out on dry fruits, usually with very scarce information about their origin. The objective of this study was to profile bioactive compounds of five goji berry cultivars and one local individual cultivated in Switzerland and to characterise their genetics. To our knowledge, this study is the first approach to identify the genetic origin of goji individuals cultivated in Europe. Analysis of differences in cultivars in respect to the content of bioactives and the antioxidant activity was performed using a principal component analysis (PCA) and a cluster analysis (CA).
2Materials and methods
2.1Reagents
Hexane and ethanol absolute were purchased from Cochimy (Martigny, Switzerland). 6-hydroxy-2,5,7,8-tetramethylchroman-2-carboxylic acid (Trolox) was obtained from Acros Organics (Geel, Belgium). HPLC grade acetone, sucrose, Folin & Ciocalteu’s phenol reagent (FCR), 2,2’-azino-bis(3-ethylbenzothiazoline-6-sulphonic acid) diammonium salt (ABTS), 2,2-diphenyl-1-picrylhydrazyl radical (DPPH•), ascorbic acid, chlorogenic acid, caffeic acid, p-coumaric acid, ferulic acid, rutin, zeaxanthin and its esters were acquired from Sigma-Aldrich (Buchs, Switzerland). Acetonitrile of HPLC grade was purchased from Lab-Scan (Gliwice, Poland) whereas formic acid, fructose and glucose from Merck (Zug, Switzerland). All other reagents used were of analytical grade. Deionised water was obtained using Milli-Q purification system (Millipore AG, Zug, Switzerland).
2.2Plant material
Fruits of five goji berry cultivars (‘Big Lifeberry’, ‘Number One’, ‘Red Life’, ‘Sweet Lifeberry’ and ‘Tibet’) and one single individual growing locally in Saxon, Wallis, Switzerland, called Saxon hereafter, were analysed in this study. The origin of Saxon individual is not well known, but most likely it was cultivated in Saxon several decades ago and now it can be found in bushes close to the village. It is most likely subspontaneous plant [37]. Plants of the five cultivars were acquired from nurseries in Switzerland, where they are sold as L. barbarum species. The plants were not developed in Switzerland but originated from imported material. ‘Red Life’ and ‘Number One’ were obtained from Häberli Fruchtpflanzen (Neukirch-Egnach, Switzerland), whereas ‘Big Lifeberry’, ‘Sweet Lifeberry’ and ‘Tibet’ were obtained from Hauenstein Rafz (Rafz, Switzerland). The plants were cultivated at the experimental fields of Agroscope Research Centre in Conthey (Wallis, Switzerland, N 46°12′07″, E 7°18′01″, altitude 480 m) on glacial alluvium soil with significant limestone content. Fertilizers were applied once a week by fertigation with the following composition: 60 kg/ha of N, 30 kg/ha P2O5, 90 kg/ha K2O, 15 kg/ha Mg. Pest management was carried out by wettable sulfur every two weeks between May and August. Four plots were planted for each of the cultivar (eight plants per plot). These plots were randomly assigned within each replicate to account for field variability. The ripe berries, according to the berry colour and their easy detachability from the plant, were manually harvested in September 2014. The berries were harvested from whole plant, no sunny or shade side distinction, and on the whole plant, no top or bottom distinction. The yields were 0.5–1.0 kg/plant. All berries were harvested approximately at the same ripening stage, but not at the same date. The fruits were immediately frozen at –18°C and stored until analysis. Defrosted berries of each cultivar were ground using a Büchi Mixer B-400 (Büchi, Essen, Germany) and subjected to extraction of secondary metabolites. The leaves were sampled and dried in silica gel for genetic analysis. Small leaves (ca. 1 cm long) were taken from the upper part of the shoots at berry maturity. The reference samples of L. chinense Mill. and L. barbarum L. were obtained from the Conservatory and Botanical Garden of Geneva (CBGG, Switzerland).
2.3Genetic characterization
Total nucleic acids were extracted from silica gel-dried leaves collected in the field using a modified the cetyltrimethylammonium bromide (CTAB) method [38] without any additional treatment of the leaf material. Genomic DNA quality was checked and assayed with a Nanodrop ND-1000 spectrophotometer (WITEC AG, Switzerland). PCR amplifications were carried out for the chloroplast trnL-trnF intergenic spacer with the specific primers pair Tab C and Tab F [39]. Ribosomal DNA sequences were amplified with the plant specific primers pairs 28KJ and 28C for the 26S ribosomal RNA gene [40] and 17SE and 26SE for the internal transcribed spacer region [41].
PCR reactions were conducted in 50 μl final volume containing 50 ng DNA, using 1.25 u of MyTaq™ HS DNA Polymerase (Bioline, UK) in 1x MyTaq™ Reaction Buffer. Cycling programs were built as follows: initial denaturation for 1 min at 95°C, 35 cycles consisting of 15 s at 95°C, 15 s at the appropriate melting temperature and 10 s at 72°C. The program terminated by a final extension step of 1 min at 72°C. Melting temperatures were 59°C for Tab C/Tab F, 56°C for 28KJ/28 C, and 52°C for 17SE/26SE. PCR products were checked for quality by gel electrophoresis and then purified with the Wizard® SV Gel and PCR Clean-up system (Promega AG, Switzerland) and submitted to Sanger sequencing. Sequences were aligned with the BioEdit v. 7.0.9 sequence alignment editor. Lycium sequences were registered in GenBank NCBI [42] under the GenBank accessions KU323935 to KU323958. Outgroup sequences for the same genes were collected from the Solanum lycopersicum SL2.50 genome (GenBank accession AEKE00000000) and Nicotiana tomentosiformis genome (GenBank accession ASAG00000000). These two species were chosen as outgroups since they both belong to the Solanaceae family. Phylogenetic inference was based on a multigene dataset (rnL-trnF intergenic spacer, ITS and 26S) of Lycium species. Sequence alignment was constructed using Bioedit 7.1.9 [43]. Phylogeny was generated using maximum likelihood (ML). The best-fitting nucleotide substitution model was selected via the Akaike information criterion (AIC) as implemented in the PhyML-SMS online execution program (http://www.atgc-montpellier.fr/phyml-sms/). The Generalized Time-Reversible model, with gamma-distributed among-site rate heterogeneity and invariant sites (GTR+G+I), was recovered as most appropriate. ML analysis was inferred using PhyML online execution platform [44] applying model suggested by PhyML-SMS. Node support was quantified with 1000 rapid bootstrap replicates. Genetic distances calculated with PhyML were visualized in a tree produced with the drawing software FigTree v1.4.2 [45].
2.4Total soluble solids (TSS), mono- and disaccharide and 2-O-β-D-glucopyranosyl-L-ascorbic acid (2-β-gAA) content
Total soluble solids (TSS) were determined using a handhold refractometer ERMA (Tokyo, Japan) and expressed as ° Brix. The extraction of sugars and 2-β-gAA from goji berries was performed based on Toyoda-Onoet al. with some modifications [32]. Briefly, 2 g of goji berries was extracted with 10 ml of deionised water during 20 min with ultrasonic sonication (working frequency 35 khz, VWR, Dietikon, Switzerland). The extract was centrifuged at 3000 g for 5 min, the supernatant was collected whereas the residue was reextracted twice more with 5 ml of water. The aliquots were combined and the volume was adjusted to 25 ml. The obtained extracts were filtered (0.45 μm nylon filter) and 5 μL of the sample was injected onto an amino column (Aminex HPX-87 H Ion exclusion, 300×7.8 mm i.d., particle size 5 μm, Bio-Rad, Hercules, CA, USA) equipped with a precolumn and coupled to an Agilent 1220 Infinity series liquid chromatograph (Agilent Technologies, Santa Clara, CA, USA). The chromatograph comprised of an autoinjector, a binary pump, a column counterpart, an UV-DAD detector and a refractive index detector. The mobile phase was composed of 5 mmol/L sulfuric acid and was delivered in an isocratic mode at a constant flow rate of 0.5 mL/min [46]. The column temperature was set to 40°C. The detection of 2-β-gAA was made at 254 nm and a calibration curve based on ascorbic acid in the concentration range of 10–500 μg/mL was prepared. The quantification of 2-β-gAA was performed using conversion factor [47]. The detection of sugars was performed with the refractive index detector. The calibration curves for glucose, fructose and sucrose were prepared.
2.5Profile of carotenoids
Carotenoids were extracted from goji berries using the method described by Karioti et al. [48]. During whole extraction process the samples were protected from light and the temperature did not exceed ambient temperature. Portions of 2-3 g of fruit were weighed and before the extraction of carotenoids, the water soluble substances were extracted and discarded. The residue was extracted with hexane:aceton solvent mixture (50:50; v:v) containing 0.1% BHT in the ultrasonic bath for 10 min in order to obtain carotenoids. The mixture was centrifuged at 4 °C during 10 min and the supernatant transferred to the volumetric flask. Extraction was repeated twice more and supernatants combined. The volume was adjusted to 25 ml. The extraction was carried out in triplicate. Samples were filtered through a 0.45 μm PTFE syringe filter (EXAPURETM) into HPLC vials and stored at –20°C until analysed. An Agilent 1220 Infinity series liquid chromatograph (Agilent Technologies, Santa Clara, CA, USA) comprised of an autoinjector, a binary pump, a column counterpart and an UV-DAD detector. A 5 μl-sample was injected onto a Luna 5 μ C18(2) column (250×4.6 mm, Phenomenex, Torrance, CA, USA). The gradient separation of acetone as solvent A and methanol as solvent B was as followed: from 40% of A at 0 min, to 55% at 5 min, 75% at 15 min, 75% at 28 min and back to 40% at 30 min. The flow rate was set at 1 ml/min. The column was re-equilibrated between injections for 2 min with the initial conditions. The detection was performed at 450 nm. Standards of zeaxanthin, zeaxanthin monopalmitate and zeaxanthin dipalmitate were used to perform external calibration.
2.6Profile of phenolic compounds
The extraction of phenolic compounds and their chromatographic separation was performed according to Lu et al. [27] with some modifications. Briefly, samples of 2 g of ground berries were weighed and extracted with 15 ml of methanol in ultrasonic bath at room temperature for 20 min. The supernatant was collected and the residue extracted twice more. The supernatants were combined, concentrated (Laborota 4011, Heidolph Instruments, Switzerland) and adjusted to 1 ml. The extract was stored at –18°C until analysed. The extraction was performed in triplicates. Samples were filtered through 0.45 μm nylon syringe filters (EXAPURETM, Switzerland) and subjected to reversed phase chromatographic separation. The above described Agilent chromatographic system was employed. 25 μL of goji berry extract was injected onto a Luna C18 column (5 μm; 4.6 mm×250 mm; Phenomenex) protected with a guard column (C18, 5 μm, 4 mm×2.0 mm, Phenomenex). The mobile phase was delivered at a constant flow rate of 0.8 mL/min in a gradient mode. Mobile phase A consisted of 0.1% aqueous formic acid and mobile phase B of 0.1% formic acid in acetonitrile. The following gradient was employed: starting from 2% of B at 0 min up to 12% of B at 10 min, then isocratic separation until 15 min, and linear increase of B to 60% at 40 min, then back to the initial conditions and equilibrated for 10 min. Chromatographic peaks were identified by comparison of retention times and UV spectra with those obtained for the standards. Calibration curves were used for quantification of p-coumaric acid, ferulic acid, chlorogenic acid, caffeic acid and rutin.
2.7Antioxidant capacity
The extracts were prepared as it was described in 2.6 Profile of phenolic compounds however, the concentration step was not applied and the volume of the extract was adjusted to 25 ml.
2.7.1Determination of total phenolic content (TPC)
The TPC was determined using the Folin-Ciocalteu reagent according to a method of Singleton et al. [49] with modifications proposed by Horszwald and Andlauer [50]. For the analysis, 25 μl of standard solutions and methanolic extracts were pipetted into a 96 well microplate (Nunc, ThermoScientific, Waltham, US) in triplicate. Methanol was used as a blank. The plate was placed in an Infinite M200 Pro microplate reader (Tecan, Switzerland) Folin-Ciocalteu reagent (1:15 v/v, in water) was added by the first injector (Infinite M200 Pro). After 10 min of incubation, 25 μl of 5% sodium carbonate solution was added by the second injector. The absorbance was measured at λ=755 nm after 20 min. A calibration curve was prepared using solutions of gallic acid. The results were expressed in mg of gallic acid equivalents (GAE) per g of dry weight (dw).
2.7.2Trolox equivalent antioxidant capacity (TEAC)
TEAC was assessed as the scavenging activity against ABTS•+ according to Re et al. [51] with the modifications of Horszwald and Andlauer [50]. The antioxidants present in the sample scavenge ABTS radical resulting in decrease of blue colour. Briefly, ABTS•+ solution was prepared by reacting ABTS diammonium salt at a concentration of 7 mM with 2.45 mM potassium persulfate at room temperature for 16 h. The obtained stock solution was diluted with ethanol at the ratio 1:50. A volume of 290 μl of the resulting solution was injected (Infinite M200 Pro) into the 96-well plate containing 20 μl of goji extract, blank or Trolox solutions. The absorbance was measured after 6 min at the wavelength λ=734 nm. The calibration curve was plotted as a function of the percentage of ABTS radical scavenging activity versus concentration of Trolox. The results were expressed in mmol Trolox eq. (TE) per g dw.
2.7.3Oxygen radical absorbance capacity (ORAC)
The assay is based on the measuring sample ability to inhibit peroxyl radical (AAPH) induced oxidation of fluorescence probe. It was performed as previously reported [50]. Briefly, samples were diluted to the appropriate concentration with 75 mM phosphate saline buffer at pH 7.4. A 96 well black plate (FluoroNunc, ThermoScientific) was filled with 50 μL of berry samples, Trolox solution or blanks. The plate was placed in the plate reader. Fluorescein (50 μL at a concentration of 260 nM) and AAPH (100 μL at a concentration of 0.2 M) was injected. Fluorescence intensity was measured with excitation at 485 nm and emission at 520 nm every 2 min during 2 h. Fluorescence intensity was normalised and the area under the kinetic curve (AUC) was calculated. The net AUC corresponding to a sample was calculated as follows:
(1)
The ORAC values were calculated based on the standard curve plotted for Trolox and were expressed in mmol of TE per g dw.
2.8Statistical analysis
Results are presented as mean±standard deviation from the triplicate analysis of fruits from 4 different plots for each cultivar. Analysis of variance one way ANOVA and post-hoc Tukey-Kramer test were conducted to verify whether the results differ significantly. The differences were considered significant at p < 0.05 level. Principal component analysis (PCA) was performed on the chemical analysis data with following variables: 2-O-β-D-glucopyranosyl-L-ascorbic acid content, zeaxanthin content, zeaxanthin monopalmitate content, zeaxanthin dipalmitate content, fructose content, glucose content, sucrose content, total soluble solids content, ORAC value, TEAC value, TPC value, ferulic acid content, coumaric acid content, rutin content, chlorogenic acid content, caffeic acid content, dry weight. Cluster analysis (CA) was applied to establish the relationships between the samples in the data set and produce a tree diagram. All the statistical analyses were performed using Rsoftware [52].
3Results and discussion
Plants bearing goji berries are commercially available in Switzerland, however the information on the plant species, origin and even age are rarely provided by nurseries. In view of the new cultivation being established the importance of the genetic characterisation of different species as well as their phytochemical profile cannot be neglected.
3.1Genetic characterization
DNA sequencing and phylogenetics confirmed that all the cultivars belonged to the Lycium genus. As shown on the inference tree resulting from the concatenation of 3 genes (Fig. 1), most of them (‘Tibet’, ‘Red Life’, ‘Sweet Lifeberry’, ‘Big Lifeberry’) seemed to be closely related to a Lycium barbarum individual grown at the CBGG. Additionally, ‘Tibet’ and ‘Red Life’ are genetically very similar and the origin of the material should be investigated. The cultivar ‘Number One’ segregated closer with an individual of Lycium chinense grown at the CBGG. The individual Saxon, domesticated from a local undescribed Lycium species in Wallis, is genetically different from all cultivars and the L. barbarum and L. chinense individuals from CBGG. It could represent a hybrid form. All the sequences produced here are the first DNA sequences available for these cultivars.
3.2TSS, mono- and disaccharide content and 2-β-gAA content
The Brix value reflects the total soluble solid content in fruits. Both TSS value and sugar content are important indicators of sensorial quality of fruits. For the fruits analysed TSS amounted to values from 11.9 for ‘Tibet’ and 12.9 for ‘Red Life’ to more than twice higher values for ‘Number One’ cultivar (Table 1). The values as low as those obtained for fruits of ‘Tibet’ and ‘Red Life’ were reported by Donno et al. for the Lycium species of unknown origin [11]. On the other hand the analysis of total soluble substances in fruits of four different Lycium species (eight cultivars) showed the highest values for L. barbarum Ningji No. 1 amounting to 19.3% [53]. Considering sugar content of goji berries from different cultivars: fructose and glucose were the dominant saccharides, whereas the content of sucrose was very low (Table 1). The content of fructose and glucose varied widely between cultivars and ranged from 41.5 to 232.2 mg/g dw and from 19.2 to 239.6 mg/g dw, respectively. It is in accordance with the previously published results showing that sucrose accounts for a small percentage of all sugars content in fruits while glucose and fructose are present in approximately equal amounts [54]. The values of sum of glucose, fructose and sucrose allowed placing the cultivars analysed in the following order: ‘Tibet’ < ‘Red Life’ < ‘Big Lifeberry’ ≈ ‘Sweet Lifeberry’ < Saxon < ‘Number One’. The highest content of soluble solids for ‘Number One’ was reflected in the high content of both hexoses in fruits of this cultivar, around 230 mg/g dw of each. For ‘Tibet’ and ‘Red Life’ lowest content of sugars was noted, more than four times lower comparing to ‘Number One’. Apart from Saxon and ‘Number One’ the sugar content noted in our study was significantly lower than those reported in the literature. Fructose content in fresh fruits from Ningqi No.1 and Jingqi No1 cultivars of L. barbarum ranged from around 200 to 300 mg/g dw whereas for L. chinense it did not exceed 150 mg/g dw [54]. Similar values were reported by Montesano [55] for 16 samples of dried fruits commercially available in Italy. The fructose content ranged from 154.20 to 259.13 mg/g and the glucose content from 152.92 to 284.60 mg/g, while the sucrose content was about ten times lower (13.75–36.43 mg/g). In the view of the above mentioned discrepancies of the sugar content it cannot be ruled out that the fruits of ‘Tibet’ and ‘Red Life’ cultivars were harvested before they reached the optimum ripening stage. Their ripening and optimal harvesting time should be investigated in the separate study. On the other hand, ‘Number One’ cultivar as well as Saxon subspontaneous species merit further attention due to their potential high gustative quality.
The content of 2-β-gAA in fruits of six goji cultivars was evaluated (Table 1). The highest content was noted for ‘Number One’ and Saxon reaching 2.79 mg and 2.43 mg per g dw, respectively. The lowest values were obtained for ‘Red Life’, and ‘Tibet’ and they did not exceed 0.4 mg/g dw. The literature data on the content of 2-β-gAA is very scarce and restricted to dried goji berries. The values between 5 and 7.4 mg/g dw were reported [32, 47]. The results showed that the content of ascorbic acid increases during fruit ripening, which might be related to higher levels of glucose serving as precursor for ascorbic acid synthesis [56]. Those results find confirmation in our study. The content of 2-β-gAA was the highest in the berries of cultivars with the highest sugars content.
3.3Profile of carotenoids
The studies on identification and quantification of carotenoids in goji berries were mostly performed after saponification of the samples in order to simplify the analysis [57, 58]. In the present study, the identification of carotenoids in the non-saponified extracts was performed based on their retention time in comparison with the standard compounds (Fig. 2). The results of carotenoid quantification show large variation in carotenoid content between cultivars. Zeaxanthin dipalmitate was a predominant carotenoid for most of the samples. The content of zeaxanthin dipalmitate ranged from 0.666 to 3.162 mg/g dw. Only in the case of Saxon and ‘Sweet Lifeberry’ zeaxanthin monopalmitate was the predominant carotenoid. The content of zeaxanthin dipalmitate was the highest in ‘Big Lifeberry’ and the lowest for ‘Sweet Lifeberry’. The content of zeaxanthin monopalmitate ranged from 0.299 to 2.037 mg/g dw, with the lowest value noted for ‘Number One’ and the highest values for ‘Red Life’ and Saxon. Small amounts of non-esterified zeaxanthin were also detected but their content did not exceed 0.020 mg/g dw. The total carotenoid content was calculated by summing up the content of individual carotenoids. When the sum of all forms of zeaxanthin is compared the six different cultivars can be ordered as followed ‘Red Life’ > ’Big Lifeberry’ > Saxon≥’Tibet’ > ’Number One’ > ‘Sweet Lifeberry’. Literature data indicate that in the course of maturation of fruits the content of chlorophylls decreases and the content of carotenoids increases as it was reported for acerola fruits [59], mango peel [60] and rose hips [61], among others. Also the rate of esterification changes with the fruit ripening. Esterification helps to increase attracting power by the overaccumulation of xanthophylls, making them more lipophilic and more readily integrated into the lipid-rich plastoglobules [62]. It can lead to partially and completely esterified carotenoids. Hornero-Mendez & Minguez-Mosquera found out that in almost ripe pepper fruits the totally esterified fraction was a dominant one whereas later in the fully ripe stage there was an increase in partially esterified (monoesters) fraction and a consequent decrease in the totally esterified fraction [62].
The results of carotenoids analysis of thirty distinct samples of dried goji berries originating mainly from Ningxia region, but also other regions of China has been published recently [58]. The samples were subjected to saponification before analysis. The content of individual carotenoids varied widely between individual goji samples i.e. zeaxanthin content ranged from 0.55 to 1523 μg/g and lutein content ranged from 1.95 to 18.7 μg/g. The highest content of zeaxanthin was noted for samples from Ningxia region and amounted to more than 1000 μg/g. For the unsaponified samples, Inbaraj et al. found a content of zeaxanthin dipalmitate of 1143.7 μg/g dw, β-cryptoxanthin monopalmitate of 165.8 μg/g dw and zeaxanthin monopalmitate of 86.0 μg/g dw in goji berries [18]. The values reported are rather lower than those obtained in the present study for the cultivars grown in Switzerland. The differences obtained might by caused by the number of factors such as genotype, growing and storage conditions, but also by the fact that in our study fresh fruits were analysed. Drying process of goji berries is usually carried out in sun and might result in loss of carotenoids [63]. The content of zeaxanthin dipalmitate in fresh fruits was reported for nine Lycium species including L. barbarum and chinense. It varied widely and ranged from 0.11 to 2.6 mg/g dw. Four species namely, L. barbarum L., L. chinense Mill, L. truncatum Y.C. Wang, and L. dasystemum Pojark var. rubricaulium A.M. The results published very recently for fresh fruits of different genotypes of L. barbarum and L. chinense revealed much higher values of zeaxanthin content in the saponified extract [53] ranging from 3076 to 9306 μg/g fresh weight (fw). The presence of lutein, β-cryptoxanthin, neoxanthin and β-carotene were also reported in the above mentioned study, however at much lower level than zeaxanthin.
3.4Profile of phenolic compounds
Four phenolic acids and rutin were identified in fruits of most of the cultivars analysed (Fig. 3). Only ‘Tibet’ cultivar was deprived of p-coumaric and caffeic acids. Rutin and ferulic acid were most dominant in all samples and their content ranged from 8 to 58 μg/g dw and from 12.5 to 55 μg/g dw, respectively. The content of all compounds identified was the highest in the case of ‘Number One’ and the lowest for ‘Tibet’. The results obtained are consisted with the literature data. Rutin content in fruits of cultivated L. barbarum in China was higher than that of wild varieties and amounted to 0.73–1.38 vs 0.09–0.22 mg/g, respectively [64]. Wu et al. reported the presence of chlorogenic acid, caffeoyl quinic acid, caffeic acid, p-coumaric acid, quercetin-diglucoside, rutin, and kaempferol-O-rutinoside in L. barbarum fruits [31]. The authors found that rutin was the major flavonoid with the content of 63 μg/g dw whereas the predominant phenolic acid was p-coumaric acid with the content of 61 μg/g. In the ethanolic extract of leaves from both L. barbarum and L. chinense, cultivated in Romania chlorogenic acid and rutin were the predominant compounds [9]. Analysis of phenolics content in fresh fruits performed by Donno et al. resulted in very similar content for all four phenolic acids: chlorogenic, caffeic, ferulic and coumaric acids ranging between 111 and 126 mg/100 g fw. Rutin was not detected, but the 116.27 mg/100 g fw of hyperoside, similar amount of catechin and quite double amount of epicatechin [11].
3.5Antioxidant capacity
The antioxidant capacity was analysed on the ethanolic extracts of berries, therefore the contribution of non-polar carotenoids to their antioxidant capacity of berries was not taken into account. As in the case of individual phenolic compounds, ‘Tibet’ cultivar was characterised by the lowest TPC, TEAC and ORAC values whereas the highest values were noted for ‘Number One’ (Table 2). The TPC for different cultivars ranged from 0.71–2.94 mg GAE/g dw. For different goji genotypes from China, the TPC levels were much higher and ranged from 26.9 to 73.4 mg GAE/g fw [53]. Different value was reported for goji berries cultivated in Italy - 268.35 mg GAE/100 g fw [11]. As the TEAC values are concerned ‘Number One’ was more than twice higher than ‘Tibet’, Saxon, ‘Red Life’ and ‘Big Lifeberry’ were not significantly different from each other and amounted to more than 10 μmol TE/g dw. When the approximate fresh vs dry matter calculation is taken into account similar range of TEAC as for Saxon, ‘Red Life’ and ‘Big Lifeberry’ was reported by Donno et al. [11]. The values of ORAC for six cultivars ranged from 8.63 to 43.39 μmol TE/g dw. Again, results obtained for ‘Number One’ and Saxon were the highest and did not differ significantly. The ORAC values for the other cultivars was in the following order ‘Sweet Lifeberry’ > ‘Big Lifeberry’ > ‘Red Life’ > ‘Tibet’.
3.6Statistical comparison
PCA analysis was carried out in order to visualise the dissimilarities between the samples based on the results of the chemical analyses (Fig. 4). The horizontal axis (Dimension 1) explains 71.86% of the inertia, while the vertical axis represents (Dimension 2) 11.47%, for a total of 83.33%. The sum of variability percentages is high and thus, the representation can be considered as reliable. Regarding the variables with the greatest impact on the formation of axes, Dim 1 is explained mainly by the variables: TPC, phenolic compounds content, ORAC and TEAC as well as sugars and TSS. It appears that the Dim 2 is mainly explained by the dw content (Fig. 4A). Close variables are positively, while opposite variables are negatively correlated. Thus the 2-β-gAA content is positively correlated to TSS. And it is not surprising that ORAC score is positively correlated withTPC.
‘Number One’, Saxon and ‘Sweet Lifeberry’ cultivars are well represented in the right part of the Individual factor map (Fig. 4B), due to their high antioxidant capacity, high value of TSS and content of sugars and 2-β-gAA. The cultivars with lower content of dw are placed in the upper part of the graph, while that with highest percentage of dw are found in the lower part. Finally, the cultivars richest in carotenoids (‘Big Lifeberry’, ‘Red Life’ and ‘Tibet’) are localised on the left side of the Individuals factor map. PCA analysis depicted large variability between ‘Tibet’ and ‘Number One’ cultivars.
CA analysis allowed segregating the goji cultivars into clusters based on the results of chemical analysis (Fig. 5). ‘Big Lifeberry’, ‘Red Life’ and ‘Tibet’ represent a first cluster, which differs from the other, composed of ‘Sweet Lifeberry’, ‘Number One’ and Saxon. ‘Sweet Lifeberry’ diverges from ‘Number One’ and Saxon. These two latter cultivars are therefore closer to each other than they are to ‘Sweet Lifeberry’. Similarly, the second branch diverges into one arm including ‘Tibet’ and the other including ‘Big Lifeberry’ and ‘Red Life’. Based on the height difference it can be concluded that the dissimilarities between ‘Number One’/Saxon and ‘Sweet Lifeberry’ are larger than between ‘Big Lifeberry’/‘Red Life’ and ‘Tibet’.
Based on DNA sequencing, four cultivars such as ‘Sweet Lifeberry’, ‘Big Lifeberry’, ‘Red Life’ and ‘Tibet’ were recognized as similar and closely related to the reference sample of L. barbarum. Also based on chemical analysis similarity of ‘Big Lifeberry’, ‘Red Life’ and ‘Tibet’ was confirmed, whereas ‘Sweet Lifeberry’ seems to stand out from others. It might results from their very low carotenoids content and quite high antioxidant capacity comparing to three other cultivars related to L. barbarum. ‘Number One’, available on the market as L. barbarum cultivar, was recognised as the only species related to L. chinense. Also in chemical analysis it clearly stands out from all other cultivars, due to its high antioxidant activity, and high content of polar compounds with relatively low content of carotenoids. It was well illustrated by PCA (Fig. 4B). Interestingly, Saxon – a subspontaneous species, which seems to be a hybrid form, was relatively high in both polar and non-polar bioactivecompounds.
Zhang et al. reported for eight genotypes of L. barbarum, L. chinense, L. yunnanense and L. ruthenicum that the analysis of bioactive compounds allowed differentiation between those species [53]. The authors indicated that L. barbarum cultivars were more active and richer in bioactive compounds than other Lycium species. However, within four L. barbarum cultivars large differences were noted, especially for carotenoids content. At the same time, two L. chinense cultivars analysed and can be placed in between of L. barbarum samples in terms of content of bioactive compounds analysed [53].
4Conclusions
The study carried out confirmed the importance of combining the quantification of bioactive compounds with genetic characterisation for the complete analysis of goji species. Within six cultivars analysed, ‘Number One’ and Saxon were unveiled as the richest in polar bioactive compounds such as phenolic compounds, sugars and 2-β-gAA. Those compounds contributed to the high antioxidant capacity of these two species. Interestingly, contrary to ‘Number One’, Saxon is also relatively rich in carotenoids, especially zeaxanthin monopalmitate. The dissimilarity of ‘Number One’ and Saxon from four remaining cultivars investigated in this study was also evident from the DNA sequencing.
Acknowledgments
The study was financially supported by the QualFood project in the frame of the HealthFood – Thematic Research Programme of University of Applied Sciences and Arts Western Switzerland. We are grateful for technical support of Isabelle Héritier.
References
[1] | Amagase H , Farnsworth NR . A review of botanical characteristics, phytochemistry, clinical relevance in efficacy and safety of Lycium barbarum fruit (Goji). Food Res Int. (2011) ;44: :1702–17. |
[2] | Potterat O . Goji (Lycium barbarum and L. chinense): Phytochemistry, pharmacology and safety in the perspective of traditional uses and recent popularity. Planta Med. (2010) ;76: :7–19. |
[3] | Yu M-S , Ho Y-S , So K-F , Yuen W-H , Chang R . Cytoprotective effects of Lycium barbarum against reducing stress on endoplasmic reticulum. Int J Mol Med. (2006) . Available from http://www.spandidos-publications.com/10.3892/ijmm.17.6.1157 |
[4] | Zhu J , Liu W , Yu J , Zou S , Wang J , Yao W , et al. Characterization and hypoglycemic effect of a polysaccharide extracted from the fruit of Lycium barbarum L. Carbohydr Polym. (2013) ;98: :8–16. |
[5] | Gao Z , Ali Z , Khan IA . Glycerogalactolipids from the fruit of Lycium barbarum. Phytochemistry. (2008) ;69: :2856–61. |
[6] | Lim TK . Edible Medicinal And Non-Medicinal Plants. Springer International Publishing. (2013) . |
[7] | Sze SC-W , Song J-X , Wong RN-S , Feng Y-B , Ng T-B , Tong Y , et al. Application of SCAR (sequence characterized amplified region) analysis to authenticate Lycium barbarum (wolfberry) and its adulterants. Biotechnol Appl Biochem. (2008) ;51: :15. |
[8] | Hacker K , Bauer N , Schüle E , Wieland M , Scherbaum E . Goji Berries – A Natural Fruit? Pesticide Residues in Dried Goji Berries. Chem. Veterinäruntersuchungsamt Stuttg. (2010) ; |
[9] | Mocan A , Vlase L , Vodnar D , Bischin C , Hanganu D , Gheldiu A-M , et al. Polyphenolic content, antioxidant and antimicrobial activities of Lycium barbarum L. and Lycium chinense Mill. Leaves molecules. (2014) ;19: :10056–73. |
[10] | Dzhugalov H , Lichev V , Yordanov A , Kaymakaov P , Dimitrova V , Kutoranov G , et al. First results of testing goji berry (Lycium barbarum L.) in Plovdiv region, Bulgaria. Sci Pap-Ser B Hortic. (2015) )47–50. |
[11] | Donno D , Beccaro GL , Mellano MG , Cerutti AK , Bounous G . Goji berry fruit (Lycium s): Antioxidant compound fingerprint and bioactivity evaluation. J Funct Foods. (2015) ;18: :1070–85. |
[12] | Jin M , Huang Q , Zhao K , Shang P . Biological activities and potential health benefit effects of polysaccharides isolated from Lycium barbarum L. Int J Biol Macromol. (2013) ;54: :16–23. |
[13] | Britton G . Structure and properties of carotenoids in relation to function. FASEB J. (1995) ;9: :1551–8. |
[14] | Alquezar B , Rodrigo MJ , Zacarías L . Regulation of carotenoid biosynthesis during fruit maturation in the red-fleshed orange mutant Cara Cara. Phytochemistry. (2008) ;69: :1997–2007. |
[15] | Peng Y , Ma C , Li Y , Leung KS-Y , Jiang Z-H , Zhao Z . Quantification of zeaxanthin dipalmitate and total carotenoids in Lycium fruits (Fructus Lycii). Plant Foods Hum Nutr. (2005) ;60: :161–4. |
[16] | Weber D , Grune T . The contribution of β-carotene to vitamin A supply of humans. Mol Nutr Food Res. (2012) ;56: :251–8. |
[17] | Landrum JT , Bone RA . Lutein, zeaxanthin, and the macular pigment. Arch Biochem Biophys. (2001) ;385: :28–40. |
[18] | Inbaraj BS , Lu H , Hung CF , Wu WB , Lin CL , Chen BH . Determination of carotenoids and their esters in fruits of Lycium barbarum Linnaeus by HPLC-DAD-APCI-MS. J Pharm Biomed Anal. (2008) ;47: :812–8. |
[19] | Breithaupt DE , Weller P , Wolters M , Hahn A . Comparison of plasma responses in human subjects after the ingestion of 3R,3R′-zeaxanthin dipalmitate from wolfberry (Lycium barbarum) and non-esterified 3R,3R′-zeaxanthin using chiral high-performance liquid chromatography. Br J Nutr. (2004) ;91: :707–13. |
[20] | Kim HP , Lee EJ , Kim YC , Kim J , Kim HK , Park J-H , et al. Zeaxanthin dipalmitate from Lycium chinense fruit reduces experimentally induced hepatic fibrosis in rats. Biol Pharm Bull. (2002) ;25: :390–2. |
[21] | Kim SY , Kim HP , Huh H , Kim YC . Antihepatotoxic zeaxanthins from the fruits of Lycium chinense. Arch Pharm Res 20: :529–32. |
[22] | Bian Q , Gao S , Zhou J , Qin J , Taylor A , Johnson EJ , et al. Lutein and zeaxanthin supplementation reduces photooxidative damage and modulates the expression of inflammation-related genes in retinal pigment epithelial cells. Free Radic Biol Med. (2012) ;53: :1298–307. |
[23] | Cheng CY , Chung WY , Szeto YT , Benzie IFF . Fasting plasma zeaxanthin response to Fructus barbarum L. (wolfberry; Kei Tze) in a food-based human supplementation trial. Br J Nutr. (2005) ;93: :123–30. |
[24] | Ma L , Lin X-M . Effects of lutein and zeaxanthin on aspects of eye health. J Sci Food Agric. (2010) ;90: :2–12. |
[25] | Tang L , Zhang Y , Jiang Y , Willard L , Ortiz E , Wark L , et al. Dietary wolfberry ameliorates retinal structure abnormalities in db/db mice at the early stage of diabetes. Exp Biol Med. (2011) ;236: :1051–63. |
[26] | Bondia-Pons I , Savolainen O , Törrönen R , Martinez JA , Poutanen K , Hanhineva K . Metabolic profiling of Goji berry extracts for discrimination of geographical origin by non-targeted liquid chromatography coupled to quadrupole time-of-flight mass spectrometry. Food Res Int. (2014) ;63: :132–8. |
[27] | Lu W , Jiang Q , Shi H , Niu Y , Gao B , Yu L (Lucy) . Partial Least-Squares-Discriminant analysis differentiating chinese wolfberries by UPLC-MS and Flow Injection Mass Spectrometric (FIMS) fingerprints. J Agric Food Chem. (2014) ;62: :9073–80. |
[28] | Qian J . The efficiency of flavonoids in polar extracts of Lycium chinense Mill fruits as free radical scavenger. Food Chem. (2004) ;87: :283–8. |
[29] | Forino M , Tartaglione L , Dell’Aversano C , Ciminiello P . NMR-based identification of the phenolic profile of fruits of Lycium barbarum (goji berries). Isolation and structural determination of a novel N-feruloyl tyramine dimer as the most abundant antioxidant polyphenol of goji berries. Food Chem. (2016) ;194: :1254–9. |
[30] | Gao K , Ma D , Cheng Y , Tian X , Lu Y , Du X , et al. Three new dimers and two monomers of phenolic amides from the fruits of Lycium barbarum and their antioxidant activities. J Agric Food Chem. (2015) ;63: :1067–75. |
[31] | Wu W-B , Hung D-K , Chang F-W , Ong E-T , Chen B-H . Anti-inflammatory and anti-angiogenic effects of flavonoids isolated from Lycium barbarum Linnaeus on human umbilical vein endothelial cells. Food Funct. (2012) ;3: :1068–81. |
[32] | Toyoda-Ono Y , Maeda M , Nakao M , Yoshimura M , Sugiura-Tomimori N , Fukami H . 2-O-(β-d-Glucopyranosyl)ascorbic acid, a novel ascorbic acid analogue isolated from Lycium Fruit. J Agric Food Chem. (2004) ;52: :2092–6. |
[33] | Toyada-ono Y , Maeda M , Nakao M , Yoshimura M , Sugiura-tomimori N , Fukami H , et al. A novel vitamin C analog, 2-O-(β-D-Glucopyranosyl)ascorbic acid: Examination of enzymatic synthesis and biological activity. J Biosci Bioeng. (2005) ;99: :361–5. |
[34] | Skrovankova S , Sumczynski D , Mlcek J , Jurikova T , Sochor J . Bioactive compounds and antioxidant activity in different types of berries. Int J Mol Sci. (2015) ;16: :24673–706. |
[35] | Scalzo J , Politi A , Pellegrini N , Mezzetti B , Battino M . Plant genotype affects total antioxidant capacity and phenolic contents in fruit. Nutrition. (2005) ;21: :207–13. |
[36] | Alvarez-Suarez JM , Mazzoni L , Forbes-Hernandez TY , Gasparrini M , Sabbadini S , Giampieri F . The effects of pre-harvest and post-harvest factors on the nutritional quality of strawberry fruits: A review. J Berry Res. (2014) ;4: :1–10. |
[37] | Jaccard H . Catalogue de la flore valaisanne [Internet]. 1895 [cited 2016 Apr 12]. Available from: http://www.biodiversitylibrary.org/bibliography/9799#/summary |
[38] | Lefort F , Douglas GC . Une micro-methode d’extraction d’ADN a partir de feuilles matures de quatre especes d’arbres forestiers Acer, Fraxinus, Prunus et Quercus. Ann For Sci. (1999) ;3: :259–63. |
[39] | Taberlet P , Gielly L , Pautou G , Bouvet J . Universal primers for amplification of three non-coding regions of chloroplast DNA. Plant Mol Biol. (1991) ;17: :1105–9. |
[40] | Cullings KW . Design and testing of a plant-specific PCR primer for ecological and evolutionary studies. Molecular Ecology. (1992) ;1: :233–40. |
[41] | Sun Y , Skinner DZ , Liang GH , Hulbert SH . Phylogenetic analysis of Sorghum and related taxa using internal transcribed spacers of nuclear ribosomal DNA. Theor Appl Genet. (1994) ;89: :26–32. |
[42] | Benson DA , Cavanaugh M , Clark K , Karsch-Mizrachi I , Lipman DJ , Ostell J , et al. GenBank. Nucleic Acids Res. (2013) ;41: :D36–42. |
[43] | Hall T . BioEdit: A user-friendly biological sequence alignment editor and analysis program for Windows 95/98/NT. Nucleic Acids Symp Ser. (1999) ;41: :95–8. |
[44] | Guindon S , Dufayard J-F , Lefort V , Anisimova M , Hordijk W , Gascuel O . New Algorithms and Methods to Estimate Maximum-Likelihood Phylogenies: Assessing the Performance of PhyML 3.0. Syst Biol. (2010) ;59: :307–21. |
[45] | Rambaut A . FigTree Version 1.4.2 [Internet]. 2009 [cited 2015 Mar 8];Available from: http://tree.bio.ed.ac.uk/software/figtree/ |
[46] | Reis BA dos , Kosińska-Cagnazzo A , Schmitt R , Andlauer W . Fermentation of Plant Material - Effect on Sugar Content and Stability of Bioactive Compounds. Pol J Food Nutr Sci. (2014) ;64: :235–41. |
[47] | Tai A , Gohda E . Determination of ascorbic acid and its related compounds in foods and beverages by hydrophilic interaction liquid chromatography. J Chromatogr B. (2007) ;853: :214–20. |
[48] | Karioti A , Bergonzi MC , Vincieri FF , Bilia AR . Validated Method for the Analysis of Goji Berry, a Rich Source of Zeaxanthin Dipalmitate. J. Agric Food Chem. (2014) ;62: :12529–35. |
[49] | Singleton VL , Orthofer R , Lamuela-Raventós RM . [14] Analysis of total phenols and other oxidation substrates and antioxidants by means of Folin-Ciocalteu reagent. In: Methods in Enzymology. Academic Press. (1999) ;152–78. Available from: http://www.sciencedirect.com/science/article/pii/S0076687999990171 |
[50] | Horszwald A , Andlauer W . Characterisation of bioactive compounds in berry juices by traditional photometric and modern microplate methods. J Berry Res. (2011) ;1: :189–99. |
[51] | Re R , Pellegrini N , Proteggente A , Pannala A , Yang M , Rice-Evans C . Antioxidant activity applying an improved ABTS radical cation decolorization assay. Free Radic Biol Med. (1999) ;26: :1231–7. |
[52] | R development Core Team. R: A Language and Environment for Statistical Computing. Vienna Austria R Found. Stat Comput. 2014; Available from: http://www.R-project.org/ |
[53] | Zhang Q , Chen W , Zhao J , Xi W . Functional constituents and antioxidant activities of eight Chinese native goji genotypes. Food Chem. (2016) ;200: :230–6. |
[54] | Zheng G-Q , Zheng Z-Y , Xu X , Hu Z-H . Variation in fruit sugar composition of Lycium barbarum L. and Lycium chinense Mill. of different regions and varieties. Biochem Syst Ecol. (2010) ;38: :275–84. |
[55] | Montesano D , Cossignani L , Giua L , Urbani E , Simonetti MS , Blasi F . A Simple HPLC-ELSD Method for Sugar Analysis in Goji Berry. Journal of Chemistry. (2016) . |
[56] | Wahyuni Y , Ballester A-R , Sudarmonowati E , Bino RJ , Bovy AG . Secondary Metabolites of Capsicum Species and Their Importance in the Human Diet. J Nat Prod. (2013) ;76: :783–93. |
[57] | Wang CC , Chang SC , Inbaraj BS , Chen BH . Isolation of carotenoids, flavonoids and polysaccharides from Lycium barbarum L. and evaluation of antioxidant activity. Food Chem. (2010) ;120: :184–92. |
[58] | Zhao L-Q , Qiu Z-Q , Narasimhamoorthy B , Greaves JA . Development of a rapid, high-throughput method for quantification of zeaxanthin in Chinese wolfberry using HPLC-DAD. Ind Crops Prod. (2013) ;47: :51–7. |
[59] | Lima V . Total phenolic and carotenoid contents in acerola genotypes harvested at three ripening stages. Food Chem. (2005) ;90: :565–8. |
[60] | Ajila CM , Jaganmohan Rao L , Prasada Rao UJS . Characterization of bioactive compounds from raw and ripe Mangifera indica L. peel extracts. Food Chem Toxicol. (2010) ;48: :3406–11. |
[61] | Andersson SC , Rumpunen K , Johansson E , Olsson ME . Carotenoid content and composition in rose hips (Rosa s) during ripening, determination of suitable maturity marker and implications for health promoting food products. Food Chem. (2011) ;128: :689–96. |
[62] | Hornero-Méndez D , Mínguez-Mosquera MI . Xanthophyll Esterification Accompanying Carotenoid Overaccumulation in Chromoplast of Capsicum annuum Ripening Fruits Is a Constitutive Process and Useful for Ripeness Index. J Agric Food Chem. (2000) ;48: :1617–22. |
[63] | Vimala B , Nambisan B , Hariprakash B . Retention of carotenoids in orange-fleshed sweet potato during processing. J Food Sci Technol. (2011) ;48: :520–4. |
[64] | Dong JZ , Lu DY , Wang Y . Analysis of Flavonoids from Leaves of Cultivated Lycium barbarum L. Plant Foods Hum Nutr. (2009) ;64: :199–204. |
Figures and Tables
Fig.1
Maximum likelihood tree topology derived from multigene analysis (rnL-trnF intergenic spacer, ITS and 26S). Bootstrap support values are given at nodes. Bar = 0.0006 substitution positions. Outgroup branches are not shown for reading convenience.
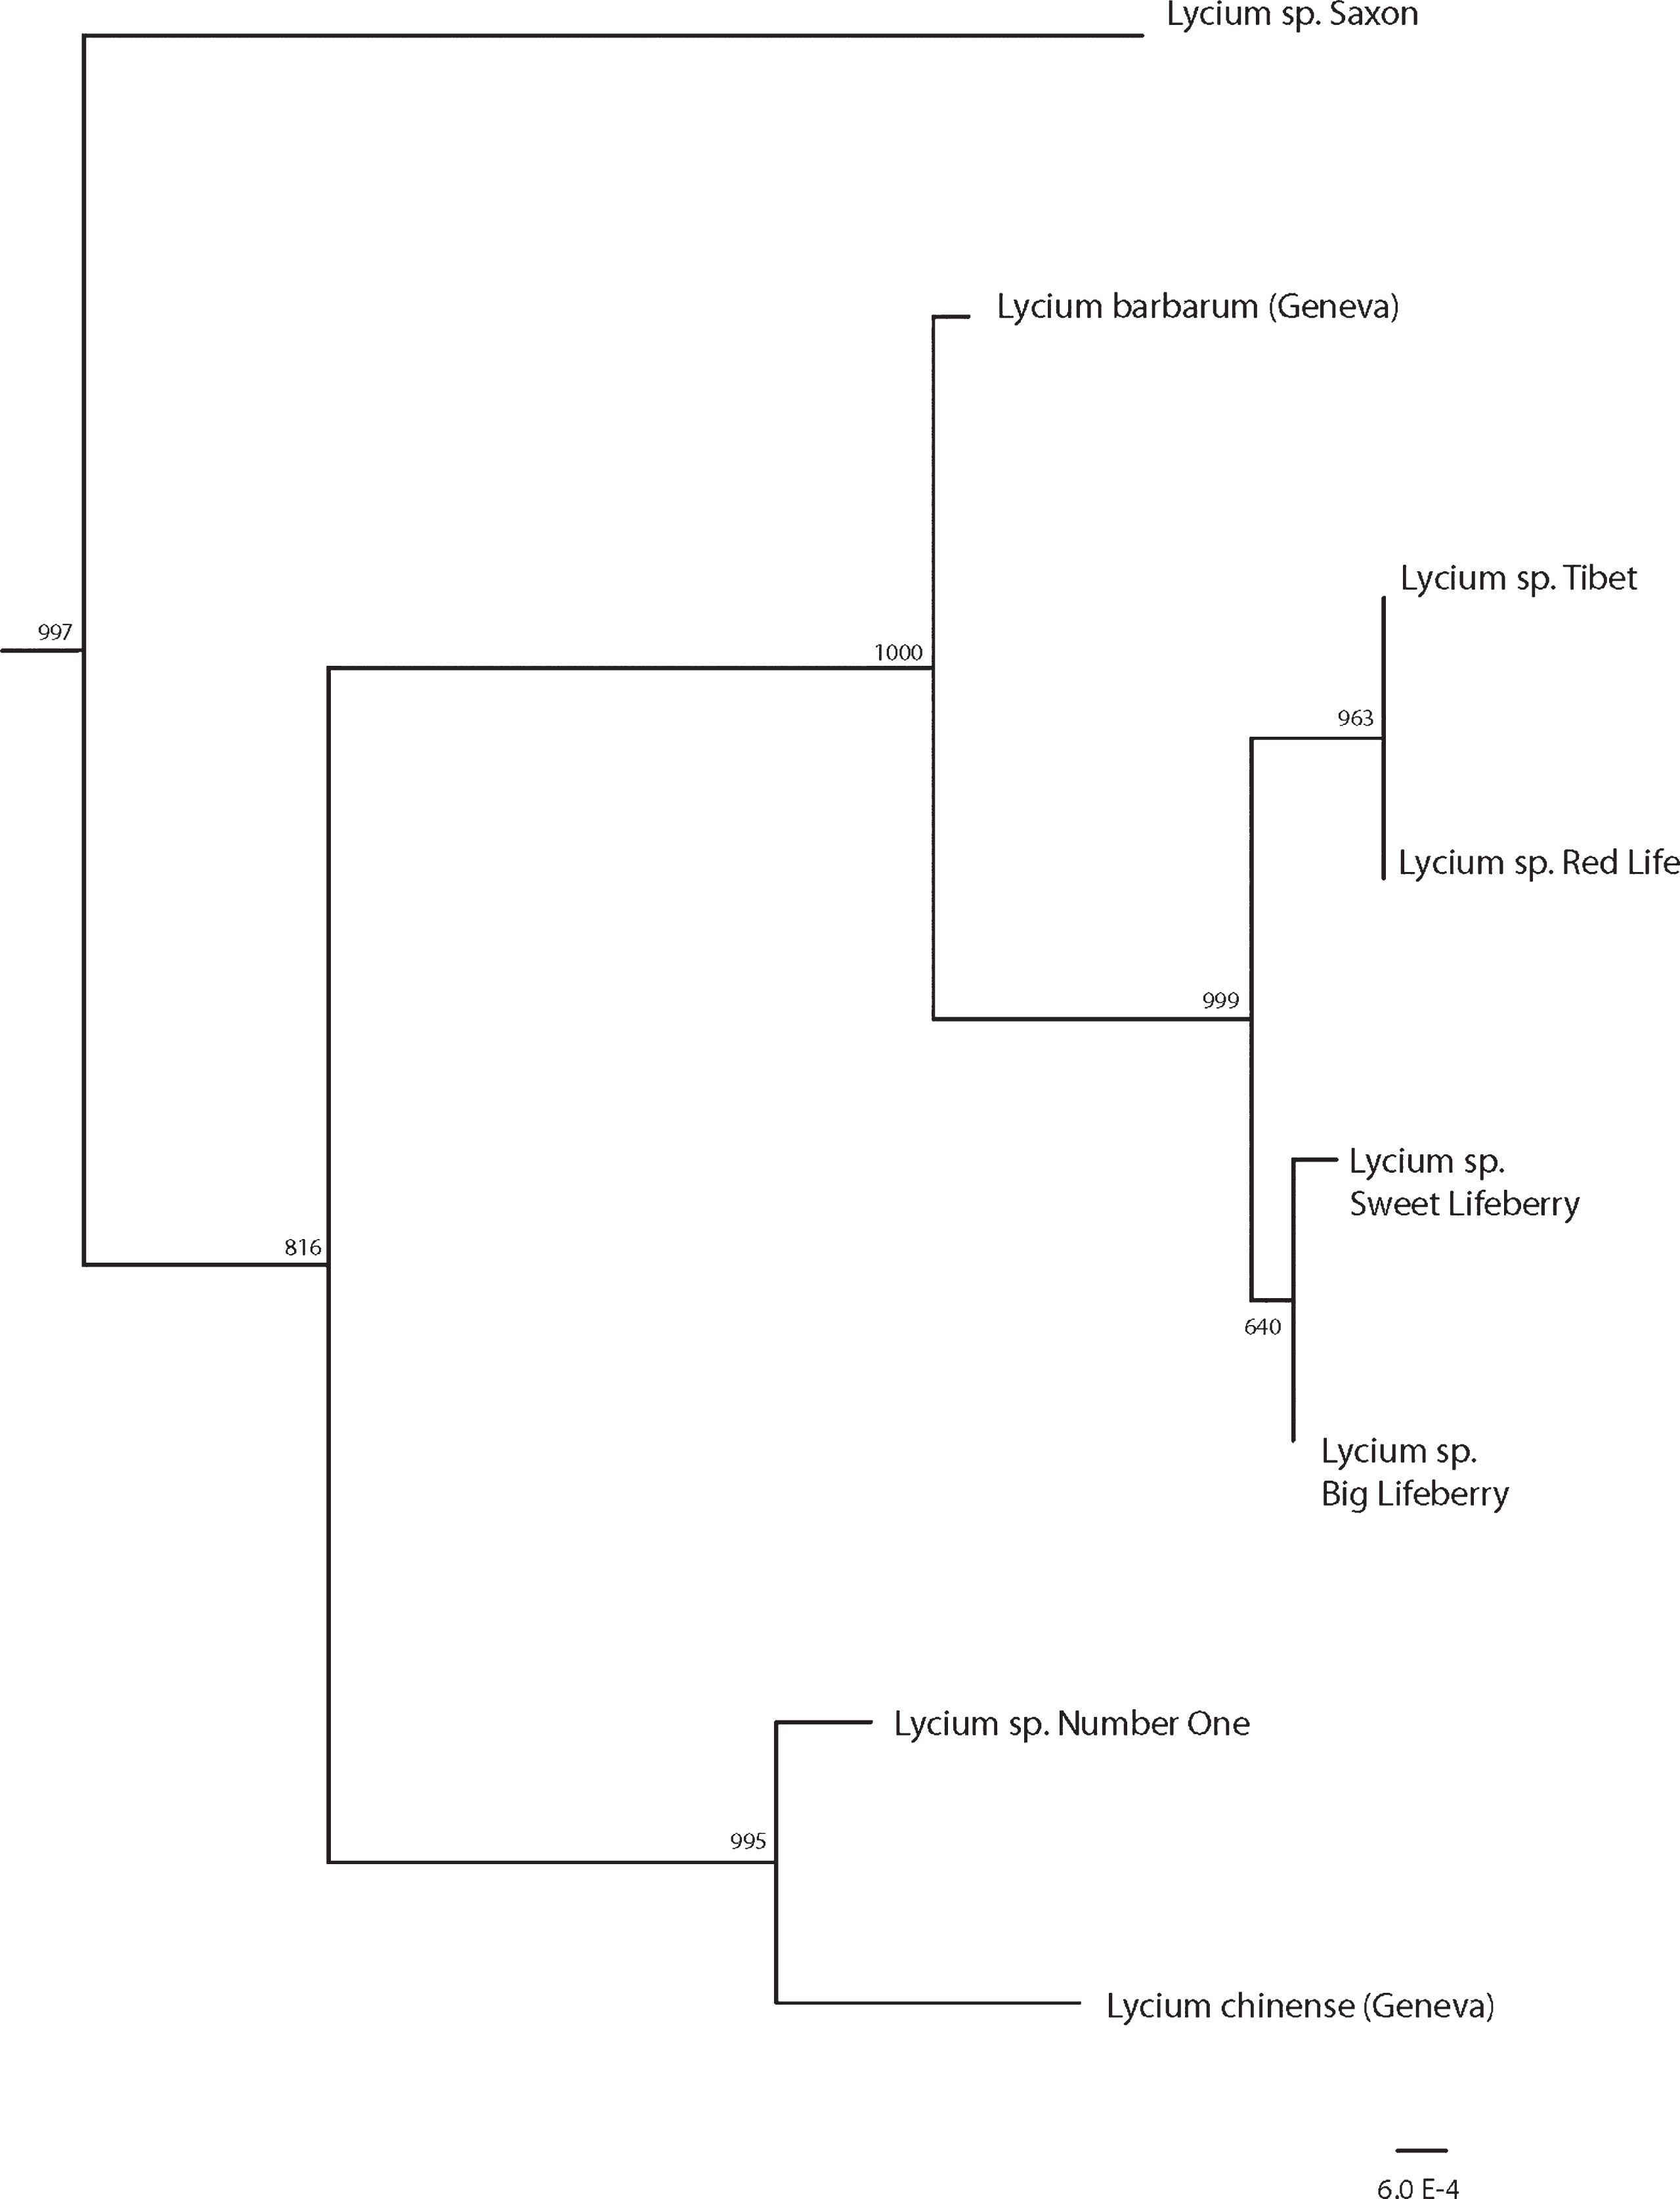
Fig.2
Carotenoids content of goji berries. Each bar represents mean±standard deviation of samples from 4 different plots. Means with different letters are significantly different (p < 0.05). Due to the very low bars representing zeaxanthin content it was given in numbers.
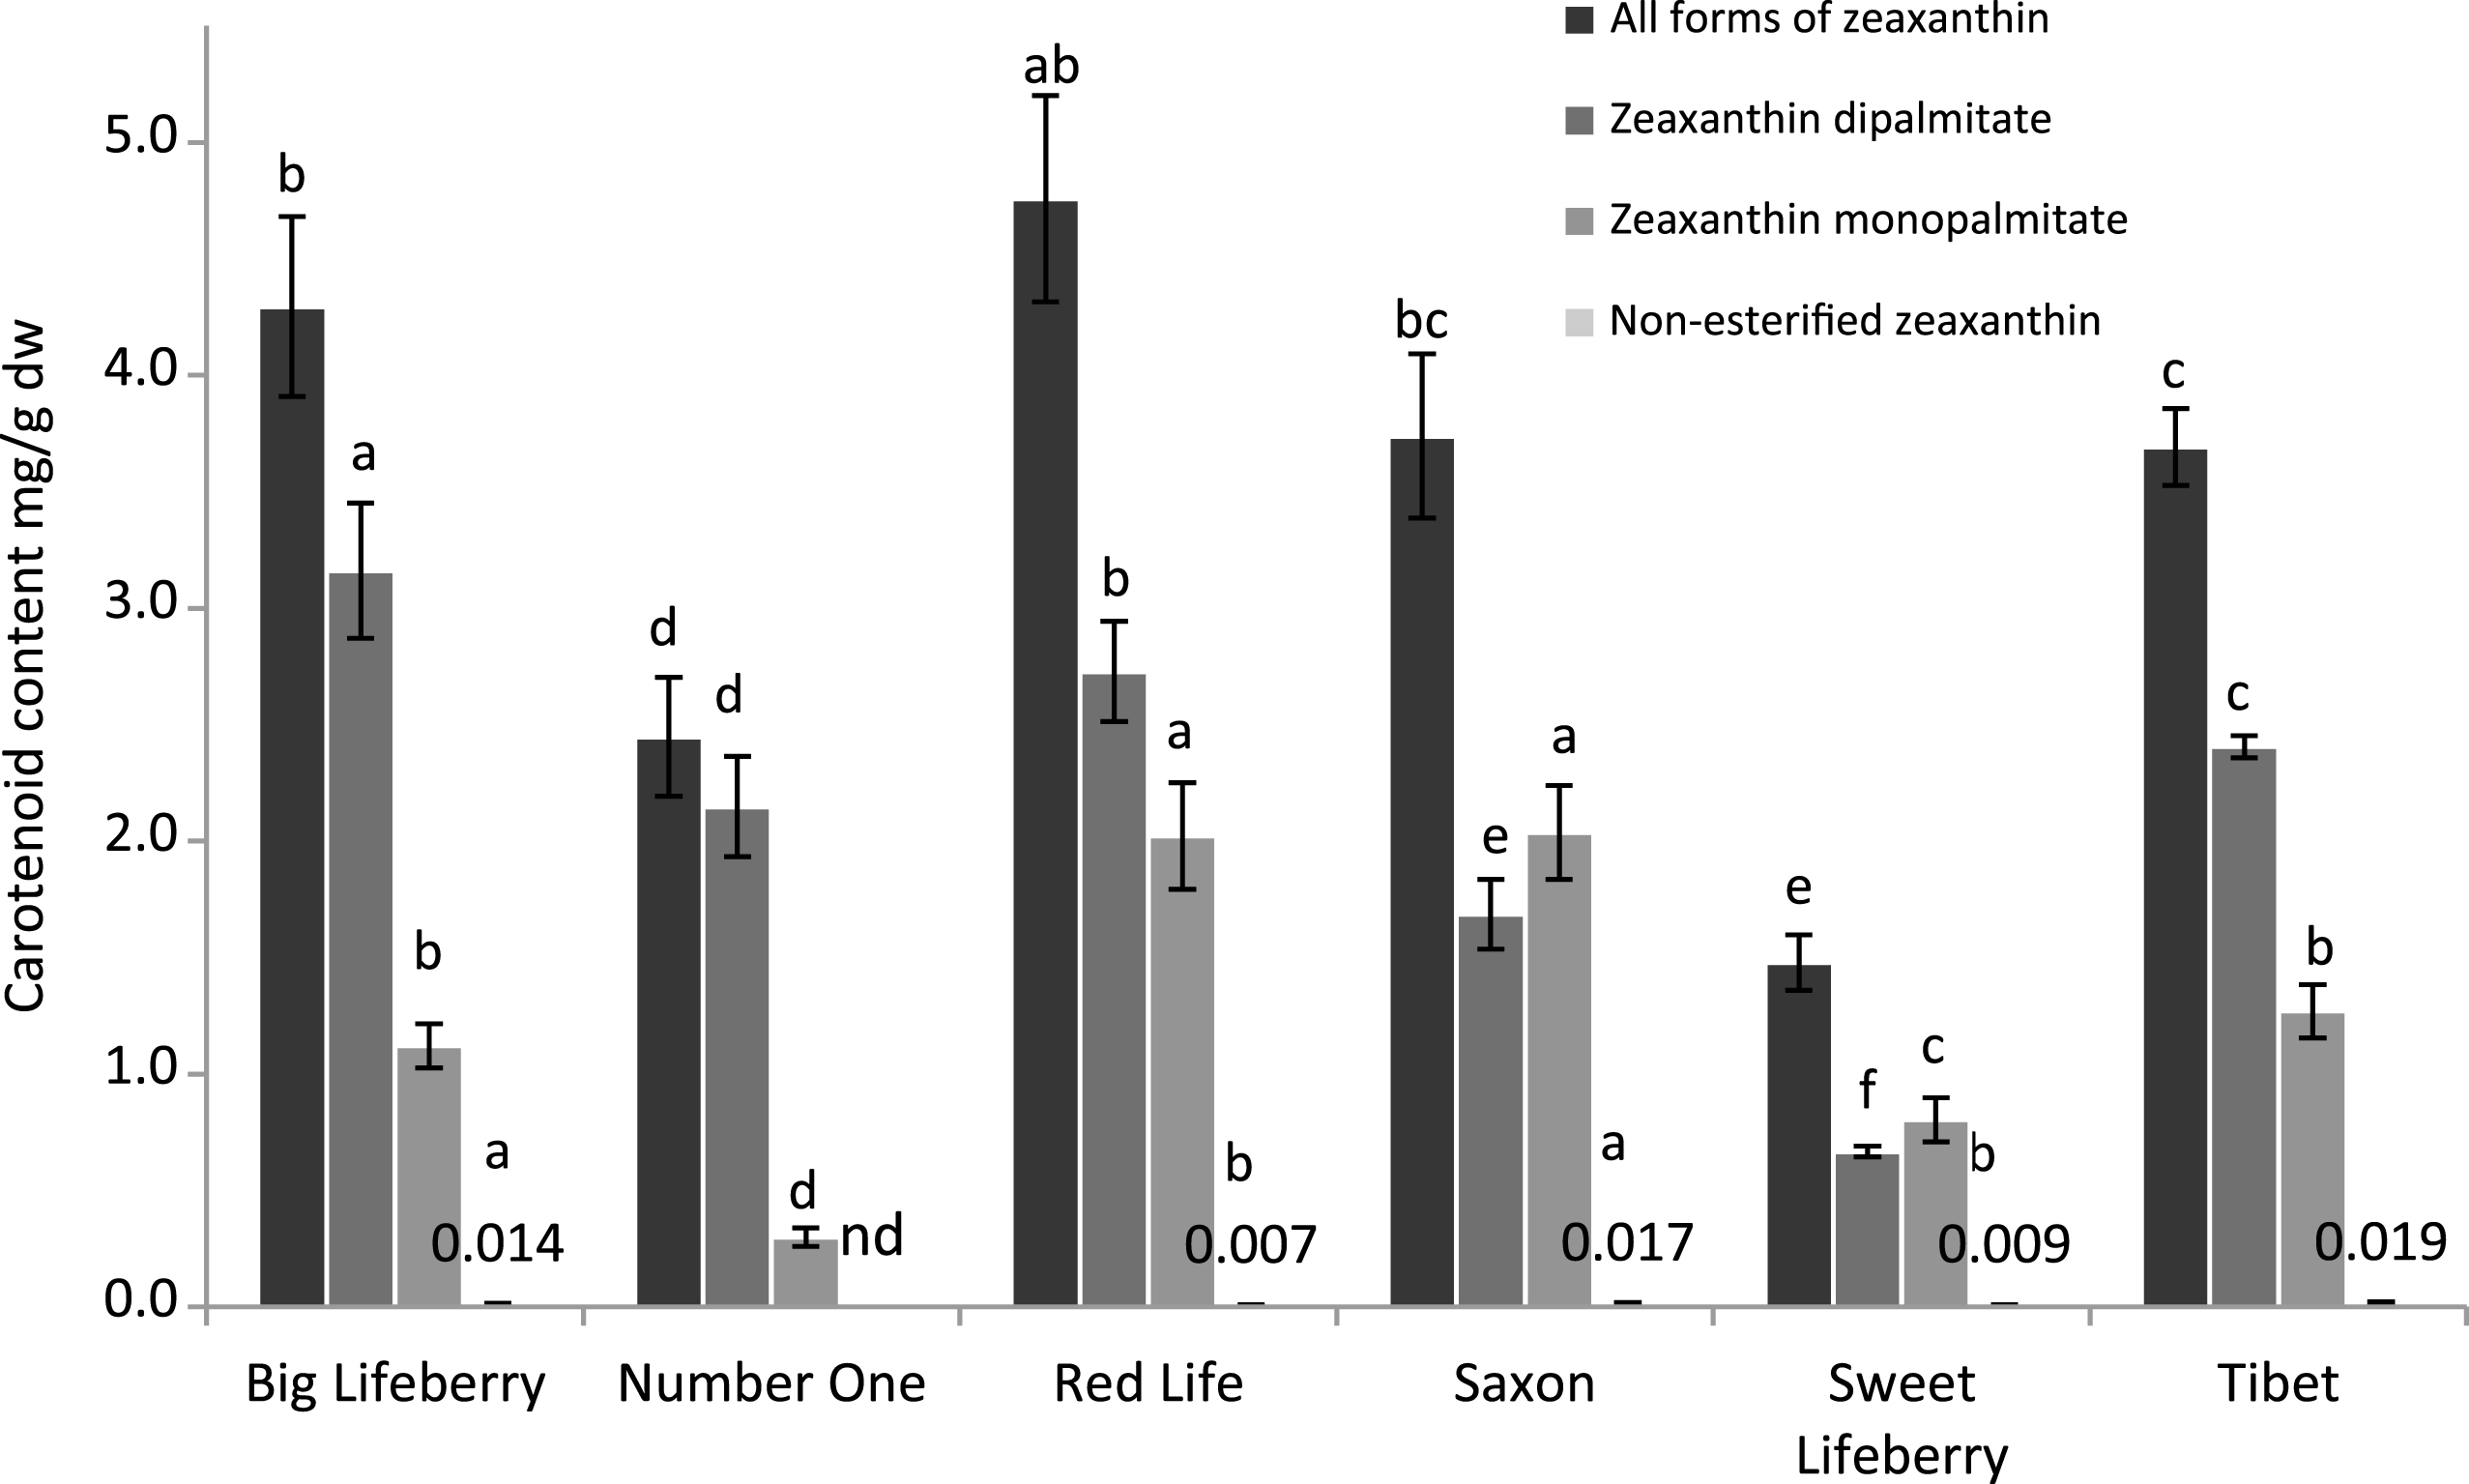
Fig.3
Phenolic compounds content of goji berries. Each bar represents mean±standard deviation of samples from 4 different plots. Means with different letters are significantly different (p < 0.05).
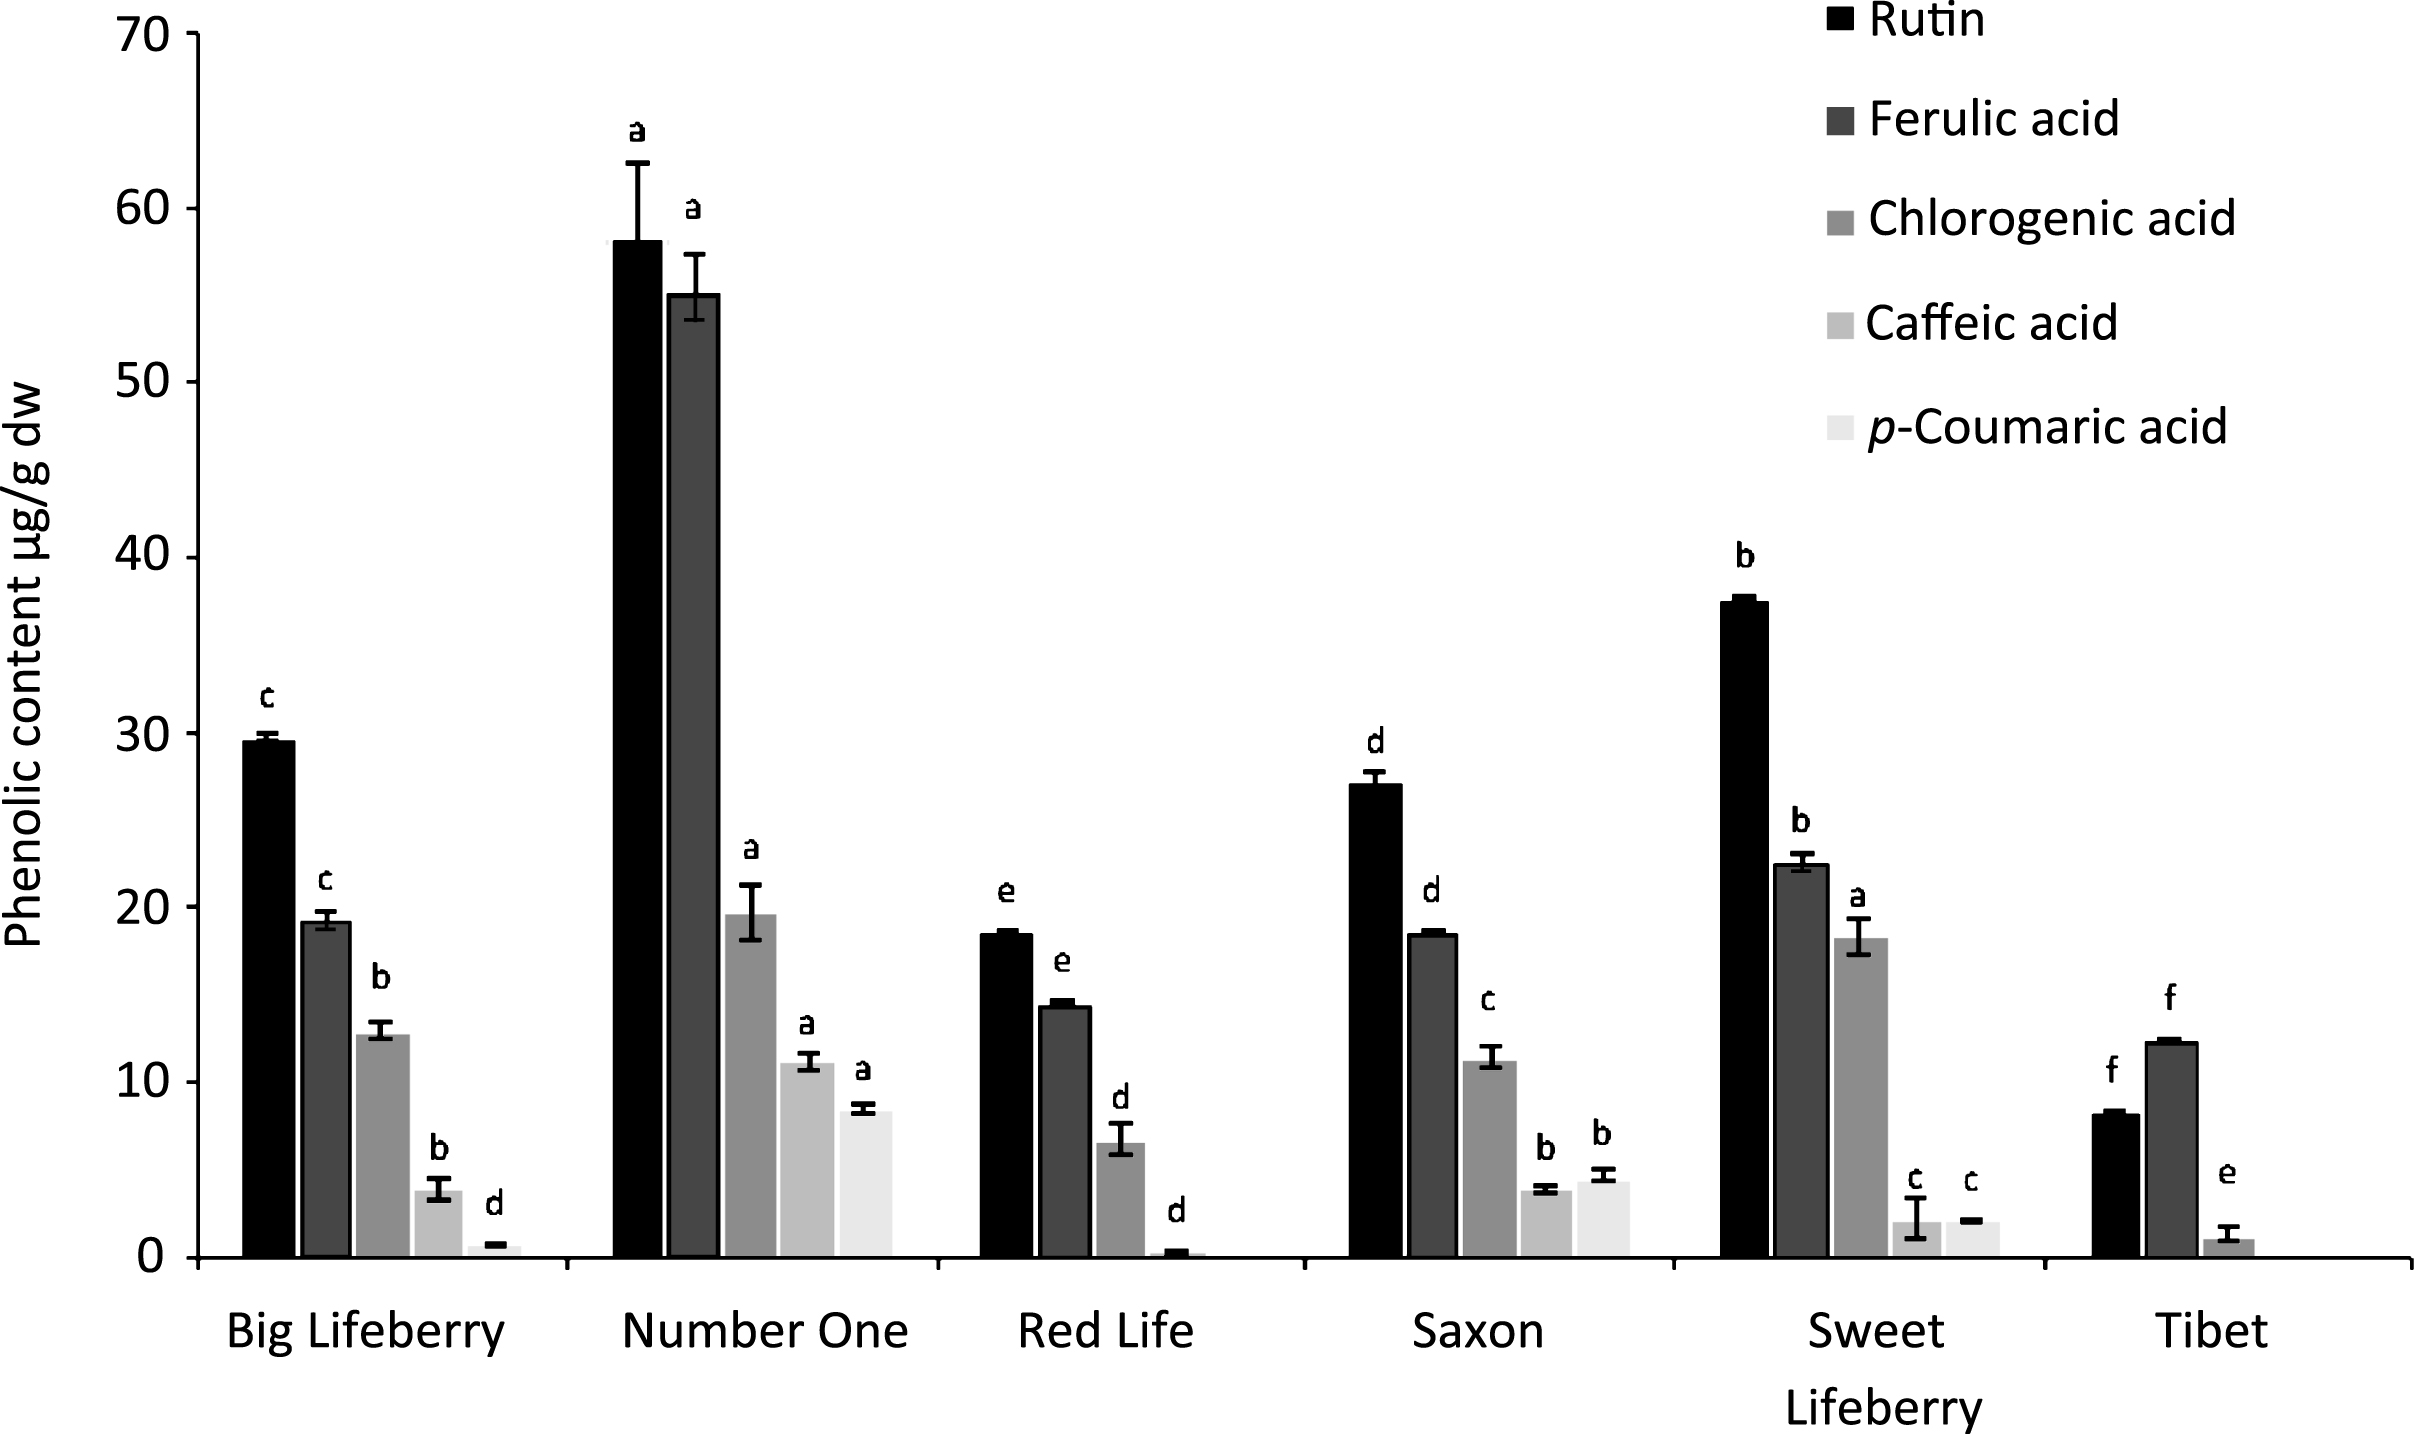
Fig.4
Principal component analysis A: Variable factor map with following variables. a: 2-O-β-D-glucopyranosyl-L-ascorbic acid content, b: zeaxanthin content, c: zeaxanthin monopalmitate content, d: zeaxanthin dipalmitate content, e: fructose content, f: glucose content, g: sucrose content, h: total soluble solids content, i: ORAC value, j: TEAC value, k: TPC value, l: ferulic acid content, m: coumaric acid content, n: rutin content, o: chlorogenic acid content, p: caffeic acid content, q: dry weight; B: Individual factor map with representation of six goji cultivars.
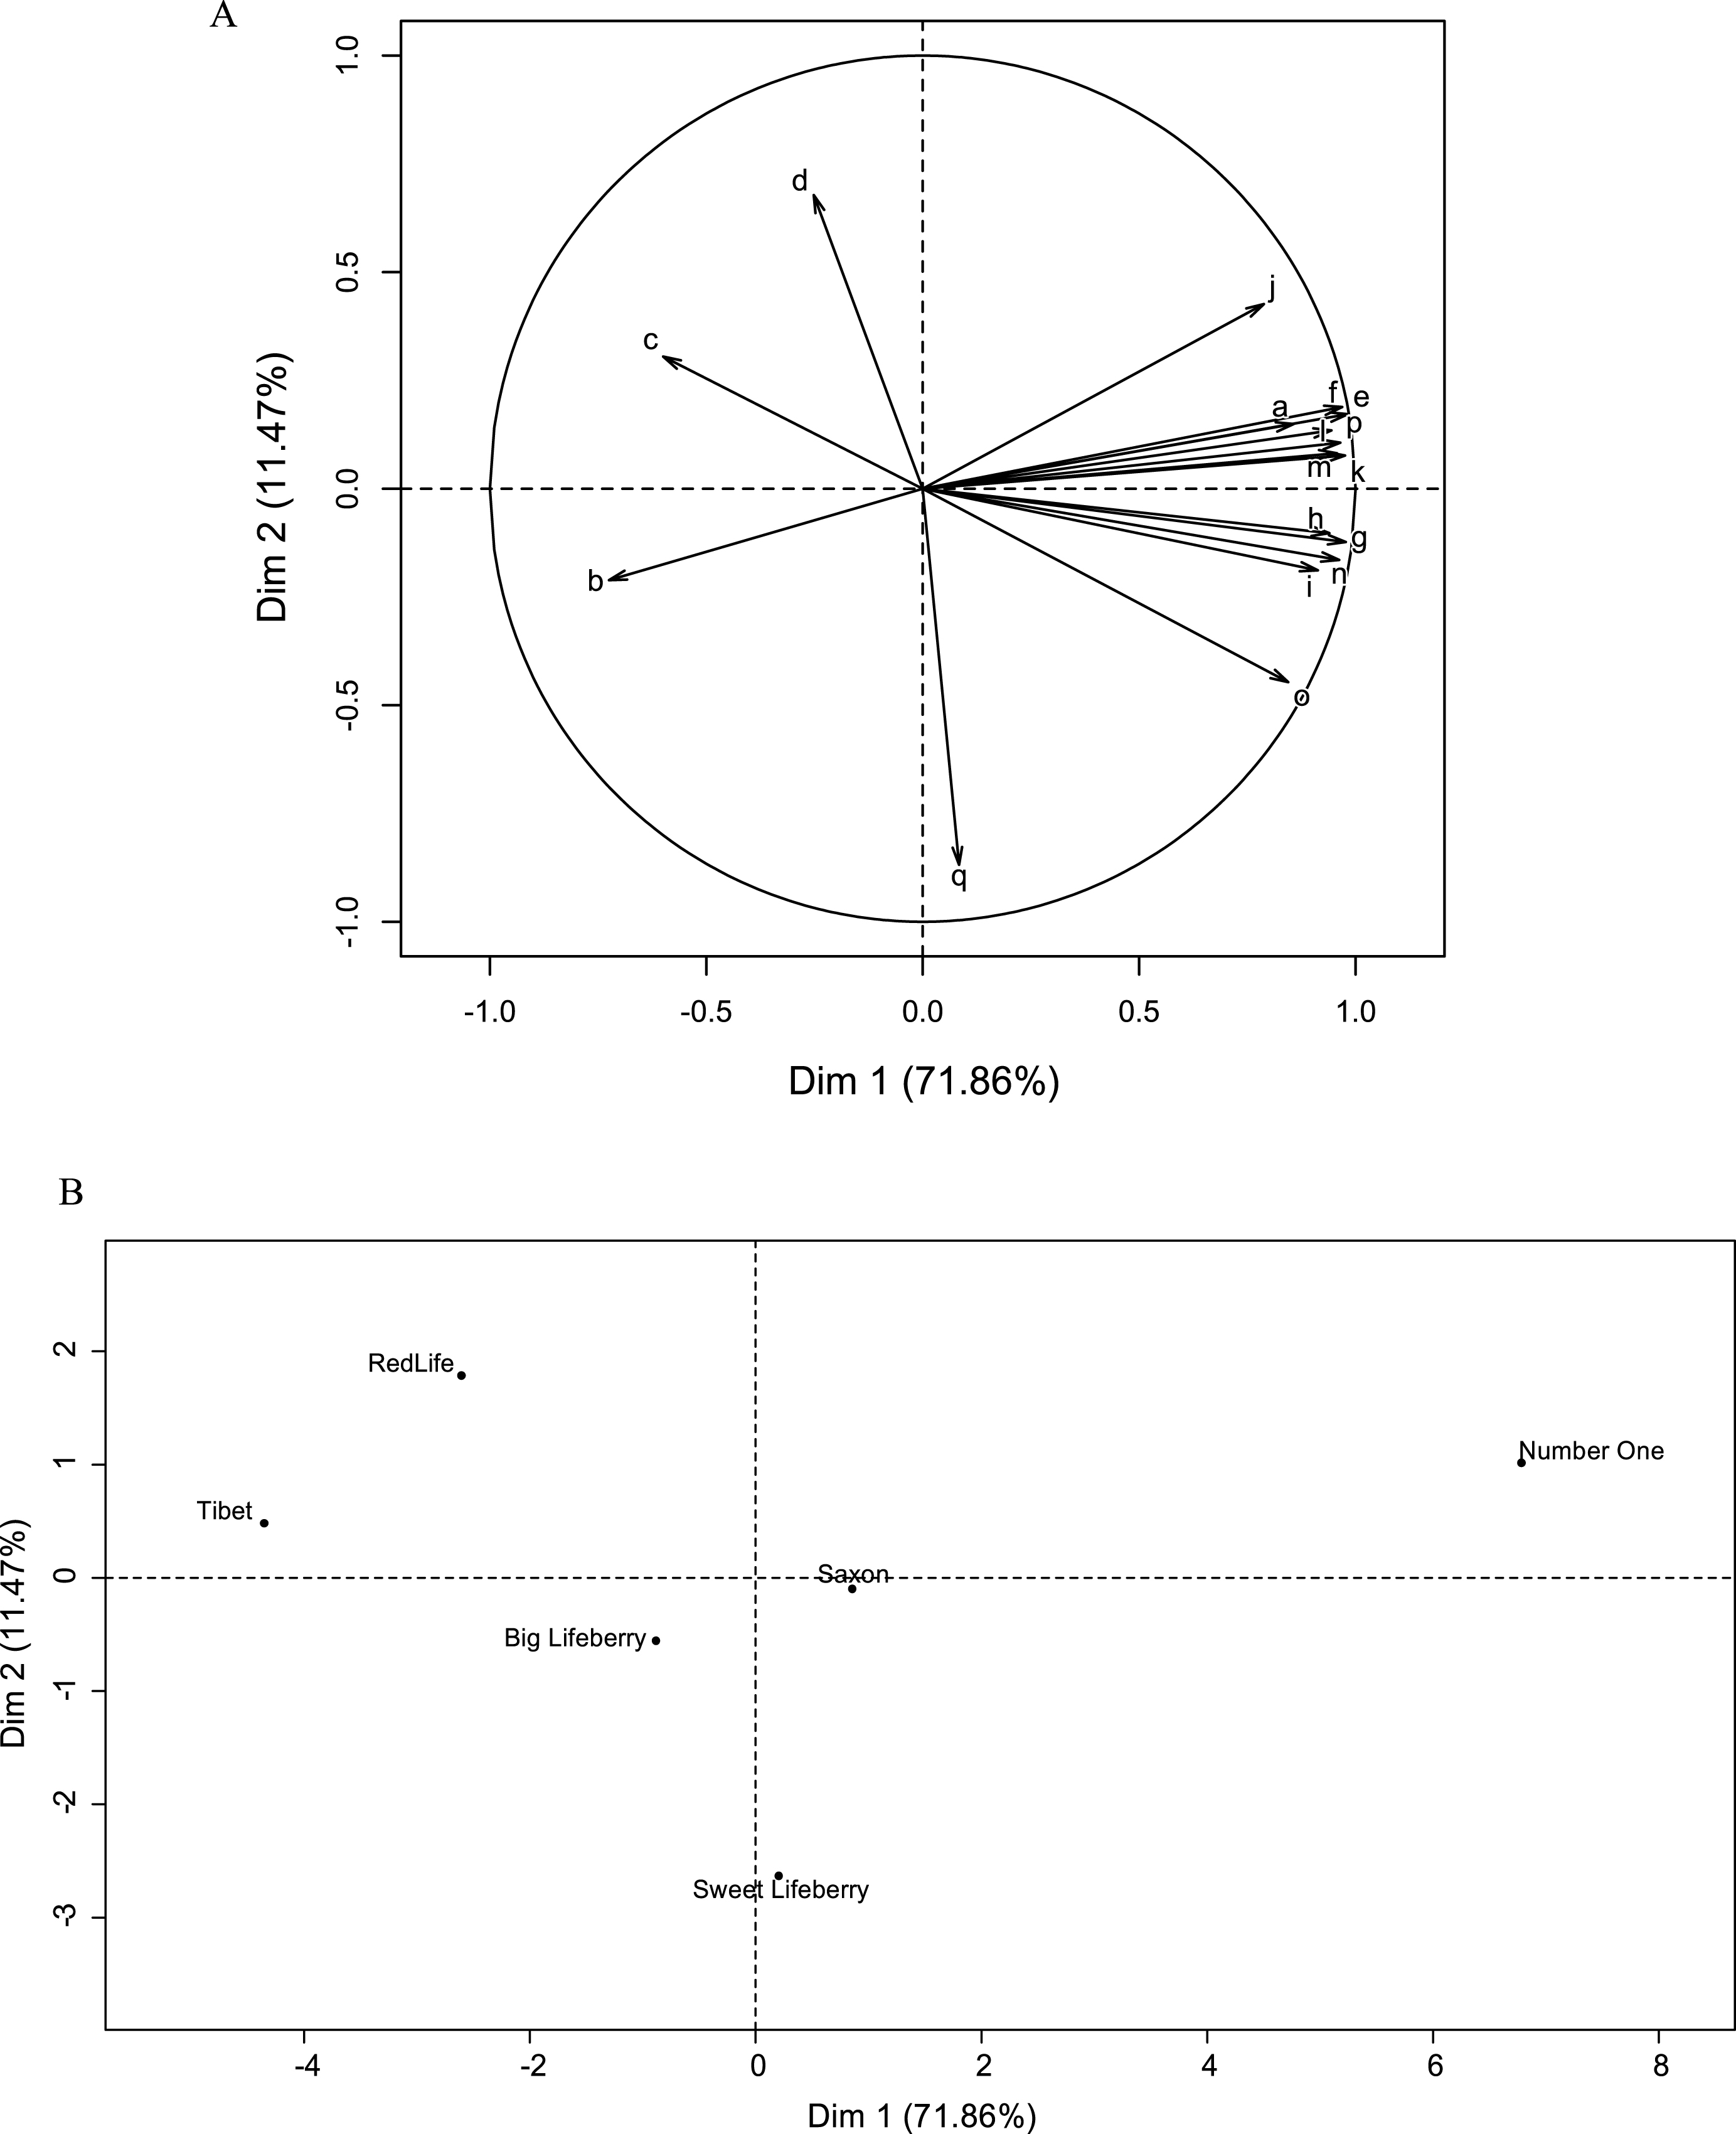
Fig.5
Cluster analysis with dendrogram representation of six goji cultivars.
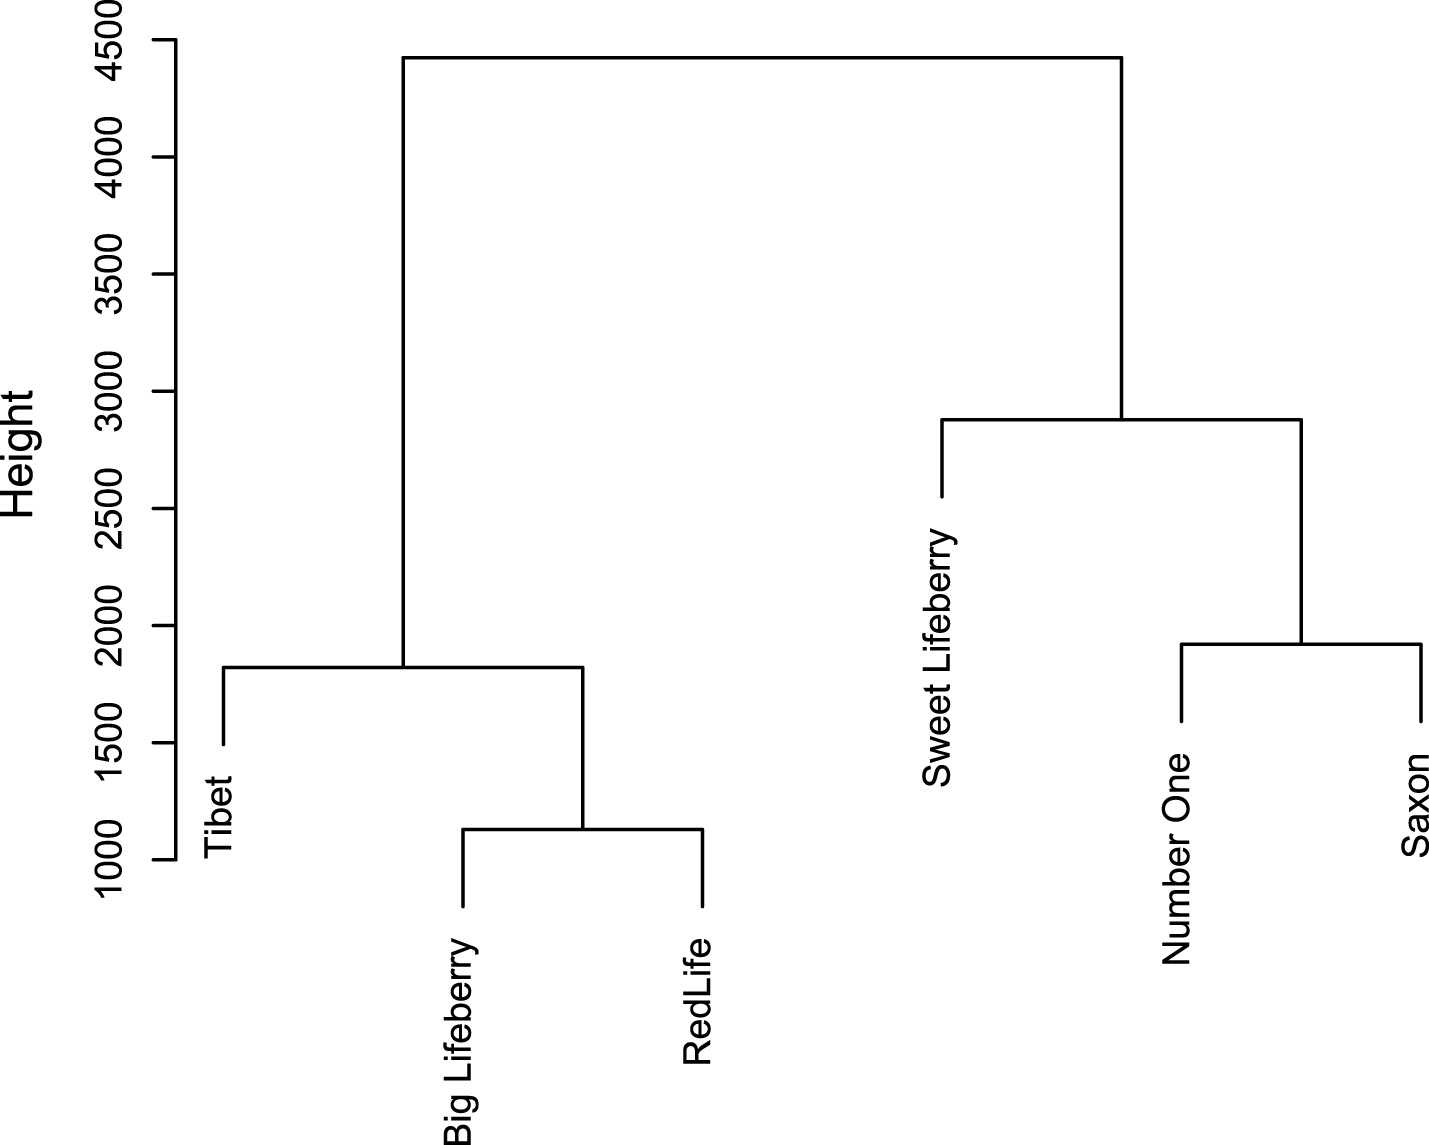
Table 1
Total soluble solids (TSS), saccharides and 2-O-β-D-glucopyranosyl-L-ascorbic acid (2-β-gAA) content of goji berries
| Goji cultivar | TSS | Glucose | Fructose | Sucrose | 2-β-gAA |
| (°Brix) | (mg/g of dw) | (mg/g of dw) | (mg/g of dw) | (mg/g of dw) | |
| Big Lifeberry | 17.7±0.1c | 58.4±2.3d | 90.8±7.7c | 2.9±0.3c | 0.50±0.06d |
| Number One | 24.9±0.1a | 239.6±21.6a | 232.2±20.8a | 7.2±0.4a | 2.79±0.12a |
| Red Life | 12.9±0.1d | 43.8±1.1e | 68.7±5.8d | 0.7±0.1d | 0.39±0.02e |
| Saxon | 21.8±0.0b | 81.9±5.1b | 124.3±10.3b | 2.8±0.4c | 2.43±0.02b |
| Sweet Lifeberry | 17.5±0.1c | 67.2±5.4c | 86.6±4.3c | 3.5±0.4b | 0.73±0.04c |
| Tibet | 11.9±0.1e | 19.2±0.8f | 41.5±3.5e | 0.4±0.0e | 0.35±0.04e |
Data are expressed as means±standard deviation of triplicate sample from 4 different plots. Different letters within the columns represent significant differences between samples (p < 0.05). dw – dry weight.
Table 2
Antioxidant capacities measured as total phenolic content (TPC), Oxygen Radical Absorbance Capacity (ORAC) and Trolox Equivalent Antioxidant Capacity (TEAC) of goji berries
| Goji cultivar | TPC | ORAC | TEAC |
| (mg GAE/g dw) | (μmol TE/g dw) | (μmol TE/g dw) | |
| Big Lifeberry | 1.20±0.11d | 24.74±1.91c | 10.05±0.9b |
| Number One | 2.94±0.23a | 43.39±3.34a | 13.22±1.16a |
| Red Life | 1.11±0.11d | 19.64±1.3d | 10.76±0.95b |
| Saxon | 2.07±0.11b | 38.28±3.27a | 11.63±1.02b |
| Sweet Lifeberry | 1.51±0.15c | 32.01±2.4b | 8.33±0.71c |
| Tibet | 0.71±0.06e | 8.63±0.85e | 6.94±0.6d |
Data are expressed as means±standard deviation of triplicate sample from 4 different plots. Different letters within the columns represent significant differences between samples (p < 0.05). GAE – gallic acid equivalents, TE – Trolox equivalents, dw – dry weight.


