
Listeria monocytogenes survival in the presence of malic acid, lactic acid or blueberry extract
Abstract
BACKGROUND:
Listeria monocytogenes represents high risk for consumers, since it can grow under refrigeration and acidic environments by developing acid tolerance response (ATR).
OBJECTIVE:
The aim of this work was to study the growth and survival of ATR L. monocytogenes strain Scott A in media acidified with malic acid, lactic acid, or blueberry extract.
METHODS:
Bacterial growth was evaluated using tryptic soy broth with yeast extract (TSB+YE) combined with the different acid solutions and incubated at 25°C for 24 h. An optical density system measured growth every 15 minutes for 24 h.
RESULTS:
Complete inhibition of L. monocytogenes occurred in presence of treatments including malic acid pH 2.0 and 3.0; lactic acid pH 2.0, 3.0, and 4.0; and with blueberry extract pH 2.0 in the mixture. No growth was observed in treatments under pH 4.5. Turbidity values of media mixed with blueberry extract at pH 3.0, 4.0, and 5.0 showed no statistical difference at 18 h and growth media had pH of 6.13, 6.53, and 6.78, respectively.
CONCLUSIONS:
Lactic acid was more effective inhibiting bacterial growth compared to malic acid. Blueberry extract was not effective acidifying the final pH of the TSB+YE solutions, therefore L. monocytogenes survived in media acidified with low pH blueberry extract. Treatments with blueberry extract had the least antibacterial effect in this study.
1Introduction
The ability of foodborne pathogenic bacteria to survive under environmental stress, not only inside the host, but also outside in the environment, can lead to an increase in human illnesses. Pathogenic bacteria, including Listeria monocytogenes, which has a high fatality rate of approximately 17%, become a threat in products that are not protected from, or properly treated to reduce contamination [1]. For example, in 2011, human listeriosis cases attributed to consumption of contaminated cantaloupe, resulted in 33 deaths [2]. The U.S. Food and Drug Administration and U.S. Department of Agriculture Food Safety and Inspection Service have established a zero tolerance for L. monocytogenes, meaning no detectable level is permitted in ready to eat foods including minimally processed fresh fruits and vegetables [3, 4]. The pathogen’s infectious dose is assumed to be high for most healthy adults, however in the immunocompromised, pregnant women, the elderly and neonates the minimum dose is unknown and those infected are more likely to die [5].
L. monocytogenes is common in fruits and vegetables grown near soil [6]. Moreover, there is an association of this pathogen with acidic fruits and fruit juice products, including unpasteurized apple juice (pH 3.78) and apple/raspberry juice (pH 3.75), cut and whole strawberries, tomatoes, orange juice and orange slices [7–9].
Since 1973 in the US, five bacterial illness outbreaks have been attributed to berries [8, 10] and most of them were related to strawberries contaminated with Staphylococcus aureus (1985), Salmonella Group B (2003), and enterohemorragic E. coli O26 (2006). In this latter case, blueberries were also associated. Although blueberries are considered low risk for foodborne contamination because of their low pH, they were related to a possible outbreak of listeriosis in Connecticut in 1984 [11]. Furthermore, low pH and bacterial acid tolerance are linked to an increased virulence of pathogens [12, 13].
Over the past several years, consumer interest in minimally processed fruits and vegetables has increased because of their freshness, convenience, and healthy attributes. The U.S. per capita food availability of blueberries increased from 0.26 lbs in 2000 to 1.3 lbs in 2011, and the majority are marketed as fresh and not frozen [14]. Fresh blueberries are minimally processed after harvest, refrigerated, and stored for several days, without washing or treatment to inhibit microbes.
L. monocytogenes represents a high risk for consumers since it can adapt and grow not only under refrigeration conditions (2–4°C), but also in high acidity foods, high salinity foods and intracellularly [15, 16]. Moreover, due to hand harvesting, field packing, and non-composted manure fertilization use, blueberries are vulnerable to bacterial contamination in the field [17]. Blueberries have a pH of approximately 3.7 when fresh and 3.1–3.35 when frozen [18]. There are no published studies on growth and survival of acid tolerant Listeria monocytogenes on blueberries or blueberry extract. The present study’s hypothesis presumes that acid adapted Listeria monocytogenes can survive and grow in acidified media, therefore we evaluated the growth of this pathogen cultured in the presence of organic acids (malic and lactic) and blueberry extracts. Malic acid concentration in fresh highbush blueberries can average 0.18% fresh weight [19]. Although there is no lactic acid content in blueberries, this acid was used in this experiment because of its well-known antimicrobial properties. Survival and growth in acid environments with blueberry extracts were monitored to assess the potential health risk for consumers that rely on low pH of these fruit products for bacteriological safety.
2Materials and methods
2.1Listeria monocytogenes, induction of acid tolerance response
Listeria monocytogenes strain Scott A (Department of Food Science and Technology Culture Collection, Virginia Tech) was propagated in Trypticase Soy Broth (BBL, BD Diagnostics, Sparks, MD, U.S.A.) with 0.6% yeast extract (Acros Organics, Fair Lawn, NJ) (TSB+YE) and incubated for overnight propagation at 37°C. Afterwards the culture was centrifuged at 2000×g for 10 min at 4°C and the pellets were suspended in an equal volume of TSB–YE with pH adjusted to 5.7 for 3 h at 37°C, to induce the acid tolerance response according to Caggia [7]. The media acidification was carried out using lactic acid [7]. Cells were then centrifuged, suspended in TSB-YE and incubated for 18 h at 37°C for further propagation.
After incubation at 37°C, 10 mL of each culture was centrifuged (Sorvall Legend RT+ centrifuge, Thermo Scientific, Braunschweig, Germany) at 2000×g for 10 min at 4°C. After centrifugation, the supernatant was discarded and replaced with 10 mL of 0.1% peptone water. Solutions were vortexed (Fisher Mini-Shaker Model 58, Fisher Scientific, Pittsburgh, PA, U.S.A.) and centrifuged again at 2000×g for 10 min at 4°C. Finally, supernatant was discarded and the remaining pellet was suspended in 10 mL 0.1% peptone water.
2.2Preparation of acids and blueberry solution
Highbush blueberries [Vaccinium corymbosum] were hand harvested from irrigated plots at the Virginia Tech Kentland Research Farm (Blacksburg, VA, U.S.A.) then stored in a cooler (4–8°C) and transported to the Food Science and Technology Building at Virginia Tech. Blueberries were sorted and only fully developed fruits free of visible defects were selected on a visual basis and stored. The measured mean surface pH of fresh blueberries in this study was 3.83 (data not shown). Blueberries were minced in a blender (Hamilton Beach, Glen Allen, VA, U.S.A.) for 30 s, then the sample was passed through a sifter and centrifuged at 9820×g for 15 min retaining just the liquid phase. The pH of the blueberry supernatants (initial pH 3.06) were adjusted to pH 2.0, 3.0, 4.0, or 5.0, using malic acid 95% (Sigma Chemicals, St Louis, MO, U.S.A.) and 3 M NaOH. These mixtures were stored at 0°C to avoid enzyme degradation. Malic acid was chosen because of its presence in blueberries. The pH of lactic acid 95% (Fisher Chemicals, Fair Lawn, NJ, U.S.A.) (pKa 3.85) and malic acid (pKa1 3.40 and pKa2 5.20) solutions (both initial pH 1.2) were fixed to pH 2.0, 3.0, 4.0 and 5.0 using the same acid and/or 3 M NaOH. All samples were sterilized using a 0.45 μm syringe filter (PTFE Puradisc, Whatman Inc., Piscataway, NJ, U.S.A.).
2.3Automated growth curve analysis
The effects of lactic acid, malic acid and the blueberry solutions on the growth of L. monocytogenes strain Scott A, were tested by a Bioscreen C Microbiology Reader (Growth Curves, Piscataway, NJ, U.S.A.), equipped with an incubator and automated turbidimeter to determine optical density (O.D.) between 420–540 nm. Optical density measurement technique can be quicker, more convenient and more precise than other methods to measure growth changes over time. Each well of a sterilized 100 microwell plate (Growth Curves, Piscataway, NJ, U.S.A.) was filled with 125 μl of TSB+YE pH 7.0 as growth liquid medium, 15 μl of pH fixed prepared acid or extract, and 10 μl of bacterial culture (final concentration of approx. 107 CFU/ml). For negative acid controls (uninoculated), wells were filled with 135 μl of growth medium and 15 μl of pH fixed prepared acid or berry solution. For L. monocytogenes controls, wells were filled with 140 μl of growth medium and 10 μl of culture. Negative L. monocytogenes control wells were filled with 150 μl of growth medium. The mean of optical density (O.D.) of the uninoculated control wells were subtracted from the O.D. of the pathogen inoculated wells for each measurement [20], to obtain only turbidity values due to pathogen growth. Samples were labeled A, B, C or D corresponding to the pH 2.0, 3.0, 4.0 or 5.0 solution used in the mixture, respectively (Table 1). Microwell plates were incubated at 25 °C for 24 h, and O.D. was measured every 15 min with 10 sec of shaking before each reading. This incubation temperature was set to challenge bacterial growth under common room temperatures rather than 37 °C which is an ideal temperature for Listeria propagation. Data was generated using EZExperiment software (Growth Curves, Piscataway, NJ, U.S.A.) and exported as a spreadsheet (Microsoft Excel, Seattle, WA, U.S.A.).
2.4Experimental design and statistical analysis
Optical density data were analyzed using the Generalized Linear Model (GLM) procedure of SAS (V. 9.13, Statistical Analysis Systems Institute, Inc. 2006). The randomized complete block factorial design with three replications was utilized to test the treatments and their interactions on microbial growth (BioScreen turbidity). All the tests used four samples for each treatment (malic acid, lactic acid and blueberry extract) and different mixtures (A, B, C or D). If the interactions between treatments were not significant (P > 0.05), the main effects of the treatments were separated by the Least Significant Difference test using the interaction as the error term.
3Results and discussion
Turbidimetry is an established predictive microbiology method used to study bacterial growth based on O.D. measurements, which makes it possible to follow bacterial population growth in real time [20]. Some authors have attempted to derive growth parameters from O.D. measurements and found a linear correlation with viable Listeria monocytogenes plate counts, especially in the exponential growth phase [21, 22]. Although O.D. is not directly equivalent to bacterial counts, it can be translated but requires many calibration curves to beaccurate.
According to Hudson [23], to avoid the error in measuring the time to reach a detectable turbidity, the initial inoculum must be high enough to measure the turbidity. In case turbidity is not measurable, the calculated lag time becomes the period taken for the culture to reach detectable turbidity. In this study, the initial bacterial inoculum concentration was approximately 107 CFU/ml, while the initial O.D. measured in uninoculated medium was 0.125 for malic acid, 0.133 for lactic acid, 0.277 for blueberry extract and 0.143 for the positive control which are values before background correction.
Growth curves of L. monocytogenes in TSB+YE varied among acid treatments (Fig. 1). Malic A, Malic B, Lactic A, Lactic B, Lactic C and Berries A treatments were not included in this graph since they completely inhibited pathogen growth. Pathogen survival and growth in acid treatments Malic D, Lactic D, Berries B, Berries C and Berries D was considerable and included distinct lag, exponential and stationary phases, but were inferior when compared to the L. monocytogenes positive control (Control).
Despite published reports indicating that the minimum pH for growth in laboratory conditions is pH 4.4 to 4.5 [24, 25], and from 5.0 to 5.5 when pH of the media is adjusted with lactic acid [26], other studies have described the ability of L. monocytogenes to respond and to survive at even lower pH values [27, 28, 29]. Acid tolerance response (ATR) in L. monocytogenes can be induced by exposing the organism to mild acidic conditions, such as pH of 5.5 (1 M lactic acid). Such treatments make the cells resistant to severe acidic conditions [30]. The acid response upon exposure of cells to an acidic pH involves several changes in the cell such as protein induction, pH homeostasis and activation of the glutamate decarboxylase system [15]. A study of the role of the glutamate decarboxylase in the acid resistance of L. monocytogenes during gastric transit using synthetic human and porcine gastric fluid concluded that addition of glutamate increased the survival of the wild type strain in gastric fluid, creating a concern about contamination in foods containing glutamate [31]. Proteins such as GroEL, ATP synthase, and various transcriptional regulators showed increased synthesis under acid stress growth [32]. F0F1-ATPase is a multi-subunit enzyme involved in the acid adaptation of L. monocytogenes, serving as an ATP driven proton channel across the cell membrane, helping maintain cellular pH homeostasis [33]. An inadequately maintained intracellular homeostasis can be the cause of loss of cell viability [34]. Gahan [35] compared acid-adapted and non-adapted L. monocytogenes survival in a variety of acidic food products using a constitutive acid tolerant mutant isolated by prolonged exposure to pH 3.5 (3 M lactic acid). The acid-adapted strain and the acid tolerant mutant demonstrated better survival in commercial natural yogurt and cottage cheese made in a laboratory. Throughout the ripening of hard cheeses, the acid tolerant mutant showed enhanced resistance and the authors were able to recover pathogens after the 70-day ripening period. Moreover, during milk fermentation by Streptococcus thermophilus, the acid-adapted strain demonstrated enhanced survival compared to the non-adapted culture. The L. monocytogenes acid tolerant mutant also survived similar to the acid-adapted cells during the first 4 h of fermentation. In the present study no bacteria survived at a pH lower than 4.54.
After 6 h, turbidity measurements were significantly different among the majority of the survival treatments and the L. monocytogenes control during the exponential growth phase (Table 2). The positive Control showed the highest O.D. value (0.18) after 6 h of incubation, while Malic C was the lowest (0.02). Turbidities of Berries C and D were not significantly different at 6 h, a trend also observed at 12 and 18 h. Between 12 and 18 h, nearly all L. monocytogenes solutions ceased to grow as the stationary phase was reached. The only exception was Malic C, where growth inhibition was observed, without a specific lag and exponential growthphase.
Acid dissociation constants (pKa) are linked to antimicrobial activity of organic acids against L. monocytogenes as well as with greater permeability of weak acids in their undissociated form through the cell membrane [36]. When the solution pH is lower than the pKa of an acid, the majority of acid in the solution will be undissociated and will be able to pass through the lipid membranes, unlike the dissociated (ionized) form which cannot. In this study, lactic acid solutions were more efficient reducing pathogen growth when compared to malic acid solutions at the same pH. At same pH lactic acid has a pKa of 3.85, while malic acid has a pKa1 of 3.40. Since lactic acid has the higher pKa, it would have higher amounts of undissociated molecules. Their accumulation in the cells will lead to lower intracellular pH values and deregulation of metabolic activity of the cell, causing higher inhibitory activity. In aerobic bacteria, the active transport of protons is associated with the electron transport process in respiratory chains with three major constituents, dehydrogenases, quinines and oxidoreductases. In anaerobic bacteria, proton transport occurs through a specific H+ channel in the F0F1-ATPase molecule using energy from ATP hydrolysis. As a facultative bacterium, Listeria may use both processes to control its intracellular pH homeostasis [32].
Eswaranandam et al. (2004) studied the effectiveness of partial replacement of glycerol with citric, lactic, malic, and tartaric acids on the antimicrobial activities of nisin (205 IU/g protein) incorporated soy protein film against L. monocytogenes, Escherichia coli O157:H7, and Salmonella Gaminara [37]. In that study, organic acids such as malic and lactic acids had greater antimicrobial activity than citric acid. Moreover, Phan-Thanh [32] also noted that organic acids were more lethal at low pH than inorganic acids. This appeared to be due to their ability to alter the internal pH of the cell (pHi) of L. monocytogenes to a lower pH value than that observed with inorganic acids. Miller [38] indicated that weak organic acids are more efficient against L. innocua than a stronger acid, such as HCl, at the same pH. The effectiveness of malic and lactic acid against L. monocytogenes has been previously demonstrated [6] and confirmed in this study.
Except for Berries A, L. monocytogenes grew in all blueberry extract treatments. Turbidity of Berries C and D solutions showed no significant difference until 24 h. At 24 h, the O.D. growth between the Malic D and Berries B treatments were not significantly different (P > 0.05).
Wang et al. (2008) reported a total phenolic of 319.3 and 190.3 mg/100 g of fwt (fresh weight) blueberries from organic and conventional cultures, respectively. And a total anthocyanin content of 131.0 and 82.36 mg/100 g fwt blueberries from organic and conventional cultures, respectively [39]. The antimicrobial activity of phenolic compounds and anthocyanins from berries has been demonstrated [40]. However, several studies show that the growth of Listeria species are not inhibited by berry phenolics [41, 42, 43, 44]. In this study, blueberry extract showed antimicrobial activity against L. monocytogenes only when the pH was low, such as in Berries A (pH 3.85), while pathogen growth was observed in treatments Berries B, C and D with pH 6.13; 6.53 and 6.78, respectively (Table 2). These acidic solutions containing blueberry extract resisted the decrease of pH expected, unlike what occurred with the organic acids. Moreover, considering that blueberry extract contains acids, nutrients, minerals and water, it is understandable why the same effects were not seen when compared with malic and lactic acid, which were concentrated acids.
4Conclusions
Since consumers are demanding more natural food products, the use of natural food ingredients such as acidic juices may be an attractive option to control pathogen growth and prevent foodborne illnesses and outbreaks. However, in this study blueberry extract was ineffective in lowering pH of growth solution when compared to malic and lactic, hence presenting a limited inhibition of Listeria monocytogenes. Additionally, this research confirms that Listeria monocytogenes can adapt to acid-stress conditions and survive at pH 4.5. More research is required to understand the effectiveness of blueberry extracts as a natural antimicrobial for food, not considering inhibition due to low pH of the solutions. Even though current research results showed that blueberry extract exhibited poor antibacterial effectiveness on media, for future work this could be evaluated on a food forconfirmation.
Acknowledgments
The authors wish to thank Dr. Hengjian Wang for his scientific and statistical analysis support and Dr. Sean O’Keefe for his food chemistry scientific guidance. This publication is the result of research sponsored by the Virginia Tech Department of Food Science and Technology.
References
[1] | Scallan E , Hoekstra RM , Angulo FJ , Tauxe RV , Widdowson MA , Roy SL , Jones JL , Griffin PM . Foodborne illness acquired in the United States— major pathogens. Emerg Infect Dis. (2011) ;17: (1):7–15. |
[2] | Centers for Disease Control and Prevention. Multistate outbreak of listeriosis linked to whole cantaloupes from Jensen Farms, Colorado – United States; 2002. Available at http://www.cdc.gov/listeria/outbreaks/cantaloupes-jensen-farms/082712/index.html. Accessed 20 August 2013. |
[3] | Food and Drug Administration. Quantitative assessment of relative risk to public health from foodborne Listeria monocytogenes among selected categories of ready-to-eat foods; (2003) . Available at. http://www.fda.gov/downloads/food/scienceresearch/researchareas/riskassessmentsafetyassessment/ucm197330.pdf. Accessed 17 August 2013. |
[4] | Leverentz B , Conway WS , Camp MJ , Janisiewicz WJ , Abuladze T , Yang M , Saftner R , Sulakvelidze A . Biocontrol of Listeria monocytogenes on fresh-cut produce by treatment with lytic bacteriophages and a bacteriocin. Appl Environ Microbiol. (2003) ;69: (8):4519–26. |
[5] | Todd ECD , Notermans S . Surveillance of listeriosis and its causative pathogen, Listeria monocytogenes. Food Control. (2011) ;22: :1484–90. |
[6] | Szymczak B , Szymczak M , Sawicki W , Dąbrowski W . Anthropogenic impact on the presence of L. monocytogenes in soil, fruits, and vegetables. Folia Microbiologica. (2014) ;59: (1):23–9. |
[7] | Caggia C , Scifo GO , Restuccia C , Randazzo CL . Growth of acid-adapted Listeria monocytogenes in orange juice and in minimally processed orange slices. Food Control. (2009) ;20: :59–66. |
[8] | Kniel KE , Shearer AE . Berry Contamination: Outbreaks and Contamination Issues. In: Sapers G, Solomon E, Matthews KR, editors. The Produce Contamination Problem: Causes and Solutions. San Diego, CA: Academic Press. (2009) . pp. 271–297. |
[9] | Sado PN , Jinneman KC , Husby GJ , Sorg SM , Omiecinski CJ . Identification of Listeria monocytogenes from unpasteurized apple juice using rapid test kits. J Food Prot. (1998) ;61: (9):1199–202. |
[10] | Sivapalasingam S , Friedman CR , Cohen L , Tauxe RV . Fresh produce: A growing cause of outbreaks of foodborne illness in the United States, 1973 through 1997. J Food Prot. (2004) ;67: :2342–53. |
[11] | Braden CR , Norton DM . Foodborne listeriosis. In: Ryser ET, Marth EH, editors. Listeria, Listeriosis and Food Safety. 3rd Edition. New York, NY: Marcel Dekker, Inc., (1999) . pp. 299–58. |
[12] | Foster JW . When protons attack: Microbial strategies of acid adaptation. Curr Opin Microbiol. (1999) ;2: :170–4. |
[13] | Werbrouck H , Vermeulen A , Van Coillie E , Messens W , Herman L , Devlieghere F , Uyttendaele M . Influence of acid stress on survival, expression of virulence genes and invasion capacity into Caco-2 cells of Listeria monocytogenes strains of different origins. Int J Food Microbiol. (2009) ;134: :140–6. |
[14] | Economic Research Service, US Department of Agriculture. Loss-adjusted food availability: Fruit per capita availability adjusted for loss; 2012. Available at http://www.ers.usda.gov/Data/FoodConsumption/FoodGuideIndex.htm#fruit. Accessed 19 August 2013. |
[15] | Gandhi M , Chikindas ML . Listeria: A foodborne pathogen that knows how to survive. Int J Food Microbiol. (2007) ;113: :1–15. |
[16] | Rocourt J , Cossart P . Listeria monocytogenes. In: Doyle MP, Buechat LR, Montville TJ, editors. Food Microbiology – Fundamentals and Frontiers. Washington, DC: American Society for Microbiology (ASM) Press; (1997) . pp. 337–52. |
[17] | Wu VC , Kim B . Effect of a simple chlorine dioxide method for controlling five foodborne pathogens, yeasts and molds on blueberries. Food Microbiol. (2007) ;24: (7):794–800. |
[18] | McGlynnW . The importance of food pH in commercial canning operations. Division of Agricultural Sciences and Natural Resources. Oklahoma State University Cooperative Extension Service; 2000. Available at http://pods.dasnr.okstate.edu/docushare/dsweb/Get/Document-962/FAPC-118web.pdf Accessed 15 August 2013. |
[19] | Ehlenfeldt MK , Meredith FI , Ballington JR . Unique organic acid profile of rabbiteye vs. highbush blueberries. Hortscience. (1994) ;29: (4):321–3. |
[20] | Begot C , Desnier I , Daudin JD , Labadie JC , Lebert A . Recommendations for calculating growth parameters by optical density measurements. J Microbiol Meth. (1995) ;25: :225–32. |
[21] | Dalgaard PT , Ross T , Kamperman L , Neumeyer K , McMeekin TA . Estimation of bacterial growth rates from turbidimetric and viable count data. Int J Food Microbiol. (1994) ;23: (3):391–404. |
[22] | McClure PJ , Cole MB , Davies KW , Anderson WA . The use of automated turbidimetric data for the construction of kinetic models. J Industr Microbiol. (1993) ;12: :277–85. |
[23] | Hudson JA . Comparison of response surface models for Listeria monocyogenes strains under aerobic conditions. Food Res Int. (1994) ;27: :53–9. |
[24] | Parish ME , Higgins DP . Survival of Listeria monocytogenes in low pH model broth systems. J Food Prot. (1989) ;52: :144–7. |
[25] | Sorrells KM , Enigl DC , Hatfield JR . Effect of pH, acidulant, time, and temperature on the growth and survival of Listeria monocytogenes. J Food Prot. (1989) ;52: :571–3. |
[26] | Farber JM , Wang SL , Cai Y , Zhang S . Changes in population of Listeria monocytogenes inoculated on packaged fresh-cut vegetables. J Food Prot. (1998) ;61: :192–95. |
[27] | Davis M , Coote P , O’Byrne C . Acid tolerance in Listeria monocytogenes: The adaptive acid tolerance response (ATR) and growth-phase-dependent acid resistance. Microbiol. (1996) ;142: :2975–82. |
[28] | Kroll RG , Patchett RA . Induced acid tolerance in Listeria monocytogenes. Lett Appl Microbiol. (1992) ;14: :224–7. |
[29] | O’Driscoll B , Gahan C , Hill C . Two-dimensional polyacrylamide gel electrophoresis analysis of the acid tolerance response in Listeria monocytogenes LO28. Appl Environ Microbiol. (1997) ;63: (7):2679–85. |
[30] | O’Driscoll B , Gahan C , Hill C . Adaptive acid tolerance response in Listeria monocytogenes: Isolation of an acid-tolerant mutant which demonstrates increased virulence. Appl Environ Microbiol. (1996) ;62: (5):1693–8. |
[31] | Cotter PD , Gahan CGM , Hill C . A glutamate decarboxylase system protects Listeria monocytogenes in gastric fluid. Mol Microbiol. (2001) ;40: :465–75. |
[32] | Phan-Thanh L , Mahouin F , Alige S . Acid responses of Listeria monocytogenes. Int J Food Microbiol. (2000) ;55: :121–6. |
[33] | Cotter PD , Gahan CGM , Hill C . Analysis of the role of the Listeria monocytogenes F0F1-ATPase operon in the acid tolerance response. Int J Food Microbiol. (2000) ;60: :137–46. |
[34] | Chitarra LG , Breeuwer P , Van den Bulk RW , Abe T . Rapid fluorescence assessment of intracellular pH as a viability indicator of Clavibacter michiganensis subsmichiganensis. J Appl Microbiol. (2000) ;88: (5):809–16. |
[35] | Gahan CG , O’Driscoll B , Hill C . Acid adaptation of Listeria monocytogenes can enhance survival in acidic foods and during milk fermentation. Appl Environ Microbiol. (1996) ;62: (9):3128–32. |
[36] | Vasseur C , Baverel L , Hébraud M , Labadie J . Effect of osmotic, alkaline, acid or thermal stresses on the growth and inhibition of Listeria monocytogenes. J Appl Microbiol. (1996) ;86: :469–76. |
[37] | Eswaranandam S , Hettiarachchy NS , Johnson MG . Antimicrobial activity of citric, lactic, malic, or tartaric acids and nisin-incorporated soy protein film against Listeria monocytogenes, Escherichia coli OH7, and Salmonella Gaminara. J Food Sci. (2004) ;69: (3):79–84. |
[38] | Miller FA , Ramos B , Gil MM , Brandão TR , Teixeira P , Silva CL . Influence of pH, type of acid and recovery media on the thermal inactivation of Listeria innocua. Int J Food Microbiol. (2009) ;133: (1-2):121–8. |
[39] | Wang SY , Chen CT , Sciarappa W , Wang CY , Camp MJ . Fruit quality, antioxidant capacity, and flavonoid content of organically and conventionally grown blueberries. J Agric Food Chem. (2008) ;56: (14):5788–94. |
[40] | Cavanagh HMA , Hipwell M , Wilkinson JM . Antibacterial activity of berry fruits used for culinary purposes. J Med Food. (2003) ;6: :57–61. |
[41] | Nohynek LJ , Alakomi HL , Kähkönen MP , Heinonen M . Berry phenolics – Antimicrobial properties and mechanisms of action against severe human pathogens. Nutr Cancer. (2006) ;54: :18–32. |
[42] | Puupponen-Pimiä RL , Nohynek L , Alakomi HL , Oksman-Caldentey KM . Bioactive berry compounds -Novel tools against human pathogens. Appl Microbiol Biot. (2005) ;67: :8–18. |
[43] | Puupponen-Pimiä R , Nohynek L , Meier C , Kähkönen M , Heinonen M , Hopia A , Oksman-Caldentey KM . Antimicrobial properties of phenolic compounds from berries. J Appl Microbiol. (2001) ;90: (4):494–507. |
[44] | Rauha JP , Remes S , Heinonen M , Hopia A . Antimicrobial effects of Finnish plant extracts containing flavonoids and other phenolic compounds. Int J Food Microbiol. (2000) ;56: :3–12. |
Figures and Tables
Fig.1
Listeria monocytogenes Scott A optical density turbidity growth curve measured using tryptic soy broth with yeast extract (TSB+YE) under different treatments (B, C, or D) with different acids (malic acid, lactic acid and blueberry extract) incubated at 25°C for 24 h.
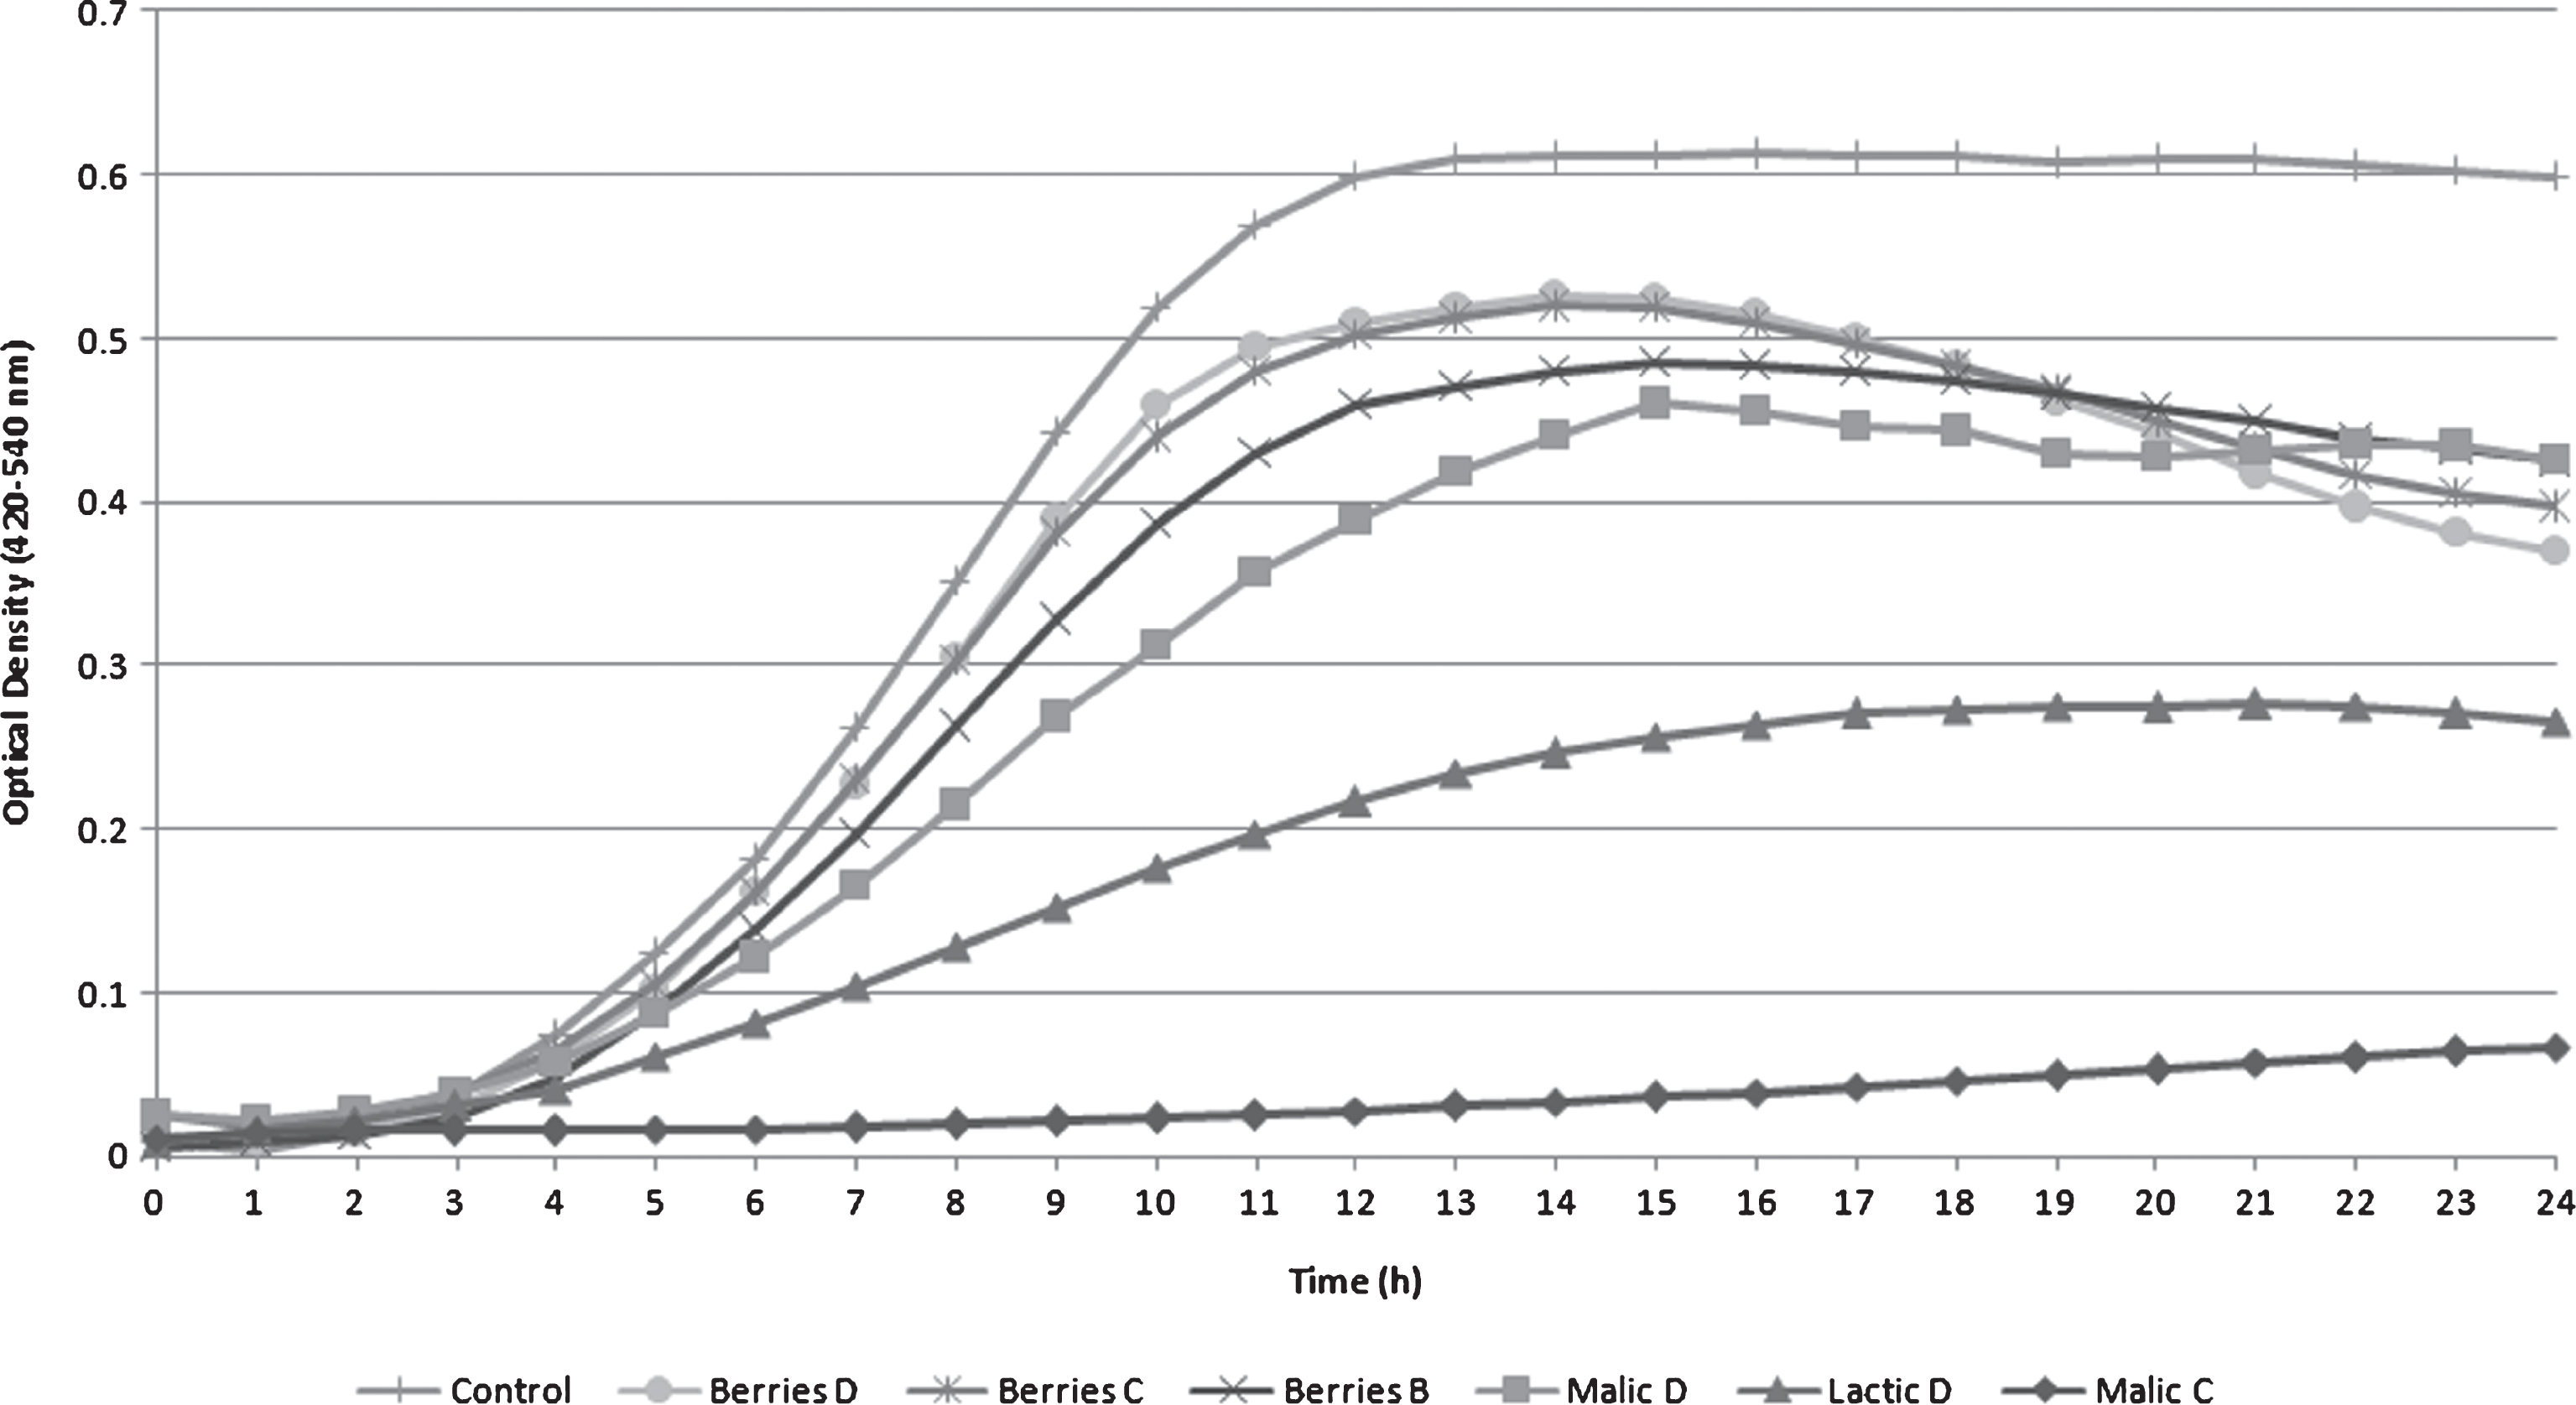
Table 1
Treatment solutions pH before inoculation with 10 μl of Listeria monocytogenes in 0.1% peptone water
| Treatment | Acid Solution | Growth Media (pH 7.0) | Treatment pH |
| Malic A | 15 μl of Malic acid pH 2.0 | 125 μl of TSB+YE | 3.04±0.02 |
| Malic B | 15 μl of Malic acid pH 3.0 | 125 μl of TSB+YE | 3.67±0.04 |
| Malic C | 15 μl of Malic acid pH 4.0 | 125 μl of TSB+YE | 4.54±0.04 |
| Malic D | 15 μl of Malic acid pH 5.0 | 125 μl of TSB+YE | 5.76±0.10 |
| Lactic A | 15 μl of Lactic acid pH 2.0 | 125 μl of TSB+YE | 3.02±0.02 |
| Lactic B | 15 μl of Lactic acid pH 3.0 | 125 μl of TSB+YE | 3.53±0.07 |
| Lactic C | 15 μl of Lactic acid pH 4.0 | 125 μl of TSB+YE | 4.30±0.08 |
| Lactic D | 15 μl of Lactic acid pH 5.0 | 125 μl of TSB+YE | 6.04±0.11 |
| Berries A | 15 μl of Blueberry extract pH 2.0 | 125 μl of TSB+YE | 3.85±0.03 |
| Berries B | 15 μl of Blueberry extract pH 3.0 | 125 μl of TSB+YE | 6.13±0.05 |
| Berries C | 15 μl of Blueberry extract pH 4.0 | 125 μl of TSB+YE | 6.53±0.02 |
| Berries D | 15 μl of Blueberry extract pH 5.0 | 125 μl of TSB+YE | 6.78±0.01 |
Table 2
Mean and standard deviation of optical density turbidity growth curve values (n = 12) for Listeria monocytogenes Scott A in TSB+YE under acid treatments incubated at 25°C for 24 h
| Treatment | O.D. 420–540 nm | |||
| 6 hours | 12 hours | 18 hours | 24 hours | |
| Control | 0.18±0.05A | 0.60±0.05A | 0.61±0.03A | 0.60±0.03A |
| Berries D | 0.16±0.06B | 0.51±0.02B | 0.48±0.04B | 0.37±0.02D |
| Berries C | 0.16±0.05B | 0.50±0.04B | 0.48±0.04B | 0.40±0.02C |
| Berries B | 0.14±0.05C | 0.46±0.05C | 0.47±0.04B | 0.42±0.04B |
| Malic D | 0.12±0.07D | 0.39±0.10D | 0.44±0.09C | 0.43±0.08B |
| Lactic D | 0.08±0.07E | 0.22±0.14E | 0.27±0.14D | 0.27±0.12E |
| Malic C | 0.02±0.01F | 0.03±0.02F | 0.05±0.03E | 0.07±0.04F |
Means within each column followed by the same letter are not significantly different (P > 0.05) from each other. Abbreviations: Positive Listeria monocytogenes Scott A Control (Control), Blueberry extract (Berries), Malic acid (Malic) and Lactic acid (Lactic).


