
Nutraceutical properties of wild berry fruits from Southern Italy
Abstract
BACKGROUND: Numerous epidemiological studies have shown that a diet rich in fruits and vegetables, such as berry fruits, reduces the risk of many chronic diseases, such as cardiovascular diseases and cancer.
OBJECTIVE: The aim of this study was to evaluate the nutraceutical proprieties of wild and cultivated blackberry (Rubus sp.) and wild elderberry (Sambuca nigra) fruits produced in some regions of Southern Italy, such as Basilicata and Campania.
METHODS: Liquid chromatography and HPLC-UV system were used for the identification and quantification of individual health-promoting compounds.
RESULTS: A comparative analysis of nutraceutical compounds in berry fruits produced by different regions of South Italy showed a high significant variability inter species (p < 0.05), independently on location area, with higher values for wild than cultivated blackberries for the major part of compounds.
CONCLUSIONS: In this paper, differences in the health-promoting compounds of berry fruits belonging from different areas of South Italy were reported.
1Introduction
Numerous epidemiological studies have shown that a diet rich in fruits and vegetables reduces the risk of many chronic diseases, such as cardiovascular diseases and cancer [1]. These biological effects are in part due to their antioxidant capacity. In particular, this parameter is strictly correlated to the presence of efficient oxygen radical scavengers, such as phenolic compounds and vitamin C, which play an important role in controlling oxidative reactions in the human body and exhibit anticarcinogenic activities [2, 3]. Among different fruits, berries are particularly rich in phenolic compounds, such as flavonoids (anthocyanins, flavonols, cathechins), tannins (proanthocyanidins, ellagitannins, gallotannins), stilbenoids (resveratrol, pterostilbene, piceatannol), phenolic acids (hydroxybenzoic and hydroxycinnamic acid derivates) and lignans [4–6]. In particular, the antioxidant activity of blackberry fruits is highly correlated with ellagitannins and anthocyanin content [7–9]. Ellagitannins and its derivative, ellagic acid, have recently been receiving much attention, because of their health benefits [10, 11]. They contain one or more hexahydroxydiphenic acid moieties, esterified to a polyol, most often to β-D-glucose. Above all, ellagic acid has been reported to have antiviral activity, provide protection against cancers of the colon, lung, and esophagus and recently has been demonstrated that has different effect on the innate immune mediator [12–14]. Also elderberry fruits have components with high biological activity, primarily polyphenols, such as flavonols, phenolic acids, proanthocyanidins and anthocyanins, responsible of the characteristic black-purple colour. The main anthocyanin compounds of S. nigra are cyanidin 3-glucoside and cyanidin 3-sambubioside [15]. Recent studies suggested that cyanidin and its glycosides potentially inhibit intestinal α-glucosidases, by reducing postprandial hyperglycemia and hyperinsulinemia [16]. Blackberries and elderberries are also known for their content of flavonols, such as quercetin, kaempferol and myricetin, as well as their derivatives (primarily glycosides) which may provide health benefits as dietary antioxidants [2]. Furthermore, these fruits are not only rich in phenolic substances, but also contain important micronutrients, such as vitamins A, B9, C and E, calcium, magnesium, potassium, iron, zinc and selenium [6, 17]. Many of these compounds have anti-cancer and anti-inflammatory effects, because they act as chemopreventive agents targeting oxidation, UV radiation, with consequent damage to the DNA [17, 18]. Moreover, their high level of fructose makes them valuable for individuals with diabetes and the high dietary fiber content is important because fruit pectin acts as an intestinal regulator [5]. However, the chemical composition of blackberries is affected by several factors, such as cultivar, growing conditions, ripeness stage. In particular, it has been reported that wild grown species generally contain more phenolic than cultivated ones [19].
Blackberry (Rubus sp.) and elderberry (Sambucus nigra) fruits are commonly present in Southern Italy [20]. Until today some studies reported the characterization of blackberries in Mediterranean area [21–23], but there are only few data about blackberries in Basilicata, a region of South Italy [20]. Moreover, to our knowledge, in Southern Italy the elderberries have been characterized only in Sicily [24].
Whereas the specific composition of berry fruits depends besides by the species, the variety, degree of ripeness, as well as environmental and climatic conditions [15, 25, 26], the aim of this study was to evaluate the nutraceutical proprieties of wild and cultivated blackberry and wild elderberry fruits produced in some regions of Southern Italy, such as Basilicata and Campania.
2Material and methods
2.1Chemicals and apparatus
The analytical standards cyanidin chloride, ellagic acid, myricetin, kampferol, quercetin and rutin hydrate were purchased from Sigma-Aldrich (Milan, Italy), whereas anthocyanins mixture (6 monoglucosides, 5μmol of each compound) was purchased from Polyphenols Laboratoires (Sandnes, Norway). Spectrophotometric analyses was performed with a Beckman Coulter DU 730 instrument (Milan, Italy). HPLC analyses were performed using a Varian-Agilent (Milan, Italy) system, consisting in a ternary pump 9012 series and an UV-VIS detector 9050 series coupled to a STAR 4.5 software for data acquisition and elaboration.
2.2Berry source and storage
Ripe fruits belonging to the genus Rubus and Sambucus grown wild were collected (500–900 g each) in different areas of Basilicata and Campania regions (Southern Italy) as shown in Table 1. Elderberry fruits were harvested with stalks from 22 to 31 July, while blackberry fruits were harvested from 21 August to 9 September. Before harvesting, plant parts were collected during flowering in order to species identification, according to [27]. Two cultivated blackberry samples (Rubus fruticosus) were also considered. Vitamin C was determined on fresh fruits, whereas for all other analytical determinations fresh fruits were packed in plastic bags, frozen and kept at –20°C until analysis. Immediately before analysis, the elderberry stalks were removed.
2.3Vitamin C determination
Vitamin C was extracted with a phosphoric buffer and then HPLC determined according to the procedure described by Galgano et al. [28].
2.4Methanolic extraction and hydrolysis
Methanolic extraction was performed on 1 g of homogenized defrosted berry with ultrasound procedure, according to Caruso et al. [29]. This extract was used as such for some analyses, while for others it was previously hydrolysed in acidic conditions as described by Caruso et al. [29].
2.5Total polyphenols, anthocyanins and flavonols quantification
Total polyphenols were determined with Folin Ciocalteau’s reagent, according to the method of Singleton and Rossi [30]. Gallic acid was employed as calibration standard and results were expressed as gallic acid equivalents (GAE) per 100 g fresh weight. Total anthocyanins were determined on the methanolic extract by the pH-differential method proposed by Lee [31], based on the colour change of these pigments at pH 1.0 and pH 4.5. Total anthocyanin content (TAC) was expressed as cyanidin-3-glucoside equivalents per 100 g of fresh weight. Total flavonoids were determined on the methanolic extract at 510 nm according to Bunea et al. [32]. Results were expressed as quercetin equivalents (on the basis of a calibration curve) per 100 g fresh weight.
2.6Determination of antioxidant activity
The methanolic phase antioxidant activity was determined by the ABTS ([2,2’-azinobis(3-ethylbenzothiazoline-6-sulfonic acid)] cation radical decolorization assay [33]. The method is based on the consumption of preformed ABTS radical (ABTS. +) in presence of potassium persulphate. The absorption maximum of ABTS is at 734 nm. Addition of antioxidants to ABTS. + reduces it to ABTS. The decrease of the adsorption due to the methanolic berry extract was measured after 6 min and the result expressed as percentage of quenching. Moreover, FRAP (Ferric Reducing Antioxidant Power) method was applied, according to the procedure described by Szöllösi and Szöllösi [34]. In the FRAP method the yellow Fe3 +-TPTZ (2,4,6-tripyridyl-S-triazine) complex is reduced to the blue Fe2 +-TPTZ complex by electron-donating substances under acidic conditions. The absorbance of the methanolic solution of berry extract mixed with the FRAP reagent was read at 590 nm after 5 min of incubation at 37°C. The final absorbance of each sample was compared with those obtained from the standard curve made from gallic acid and the results were expressed in GAE per 100 g fresh weight.
2.7HPLC analysis of phenolic compounds
Anthocyanins and rutin were detected by injection of the methanolic berry extract. Anthocyanins quantification was expressed as mg cyanidin chloride equivalent /100 mg f.w.
Free flavonols (quercetin, myricetin, kaempferol) and ellagic acid were determined on the methanolic extracts submitted to acidic hydrolysis. The selected wavelenghts of the UV-VIS detector were 520 nm for anthocyanins, 360 nm for flavonoids and 260 nm for ellagic acid. A Gemini NX C18 À column, 250×4.6 mm (Phenomenex, Bologna, Italy) was the stationary phase. The elution solvents and programs used were previously described [29].
2.8Statistical analysis
In order to study the effect of species on quality characteristics, data were processed by analysis of variance (ANOVA), and the least significant difference (LSD) test was performed for comparison of means (p < 0.05). Correlation analysis (p < 0.05) regression analysis and cluster analysis were also applied to the data. All statistical procedures were computed using the statistical package SYSTAT for Windows (ver. 10, 2003) (Systat Software, Chicago, IL). Cluster analysis according Euclidean distances and Ward’s method was also used as unsupervised technique to discover the similarity between samples; the initial assumption of this analysis is that the nearness of the objects, defined by their variables, reflects the similarity of their properties [35].
3Results and discussion
3.1Chemical profile of berry fruits
The chemical composition of Sambucus nigra and Rubus spp. extracts were reported in Table 2 and Table 3, respectively. The LSD test showed that the all chemical parameters differ statistically in the various samples (P < 0.001), with exception on vitamin C content, cyanidin 3-glucoside and FRAP in elderberry fruits.
Total phenol content (TPC) was present in greater amounts in the elderberries rather than blackberries, as confirmed by Ochmian et al. [36]. In particular, in the elderberries TPC ranged from 474.43 to 701.15 mg gallic acid /100 g f.w., with a variability based on the collection area; in fact, the sample S1 and the sample S2, collected in the same region (Campania), didn’t show significant differences. However, in our study it was possible to observe significant differences also between samples grown in the same area.
Akbult et al. [37] have reported a concentration of TPC in the range of 371–432 mg GAE/100 g fresh matter in Turkish S. nigra. Lee and Finn [33] evaluated the concentration of TPC in two genotypes of European elder (S. nigra) and in eight genotypes of American elder (Sambucus canadensis) throughout two growing seasons and reported a TPC value ranging from 327 to 582 mg GAE/g fresh matter with higher levels in the cultivars Adams 1 and Adams 2 (S. canadensis) and Korsør (S. nigra) in both seasons, demonstrating that the TPC is closely related to the genotype. In another study, Mandrone et al. [24] have reported substantial differences in polyphenol concentration for S. nigra grown in four different Sicilian area, with a value ranging from 1811.13 to 2743.07 mg/100 g, and these differences were attributed to the different degree of fruit’s maturity.
In the blackberry fruits TPC was characterized by high variability inter and intraspecies ranging from 234.82 to 419.99 mg gallic acid /100 g f.w. In fact, the minimum value (234.82 mg gallic acid/100 g f.w.) but also the maximum value (419.99 mg gallic acid/100 g f.w.) was found in Rubus ulmifolis. This could be attributed to the different areas of blackberries’s samples collection. Rios de Souza et al. [6] have reported a mean value of 850.52 mg gallic acid equivalents (GAE)/100 g for Brazilian blackberries although, it must be emphasized, that the TPC is closely related to the extraction technique used, as shown by Reátegui et al. [38], and to the degree of maturation. In this context, Rutz et al. [4] have reported that during ripening of blackberries it is possible to observe an increase in the concentration of phenolic compounds, anthocyanins and antioxidant activity. In particular, the increased amount of anthocyanins at the mature stage is due to the synthesis of these pigments during ripening. In any case, a lower values were found in wild (M3 ÷ M14) than cultivated (M1 and M2) ones as shown in the Table 1. In contrast significantly lower values of total polyphenols were recorded for wild blackberries [36].
The content of total anthocyanins (TAC) was from 198.00 to 398.20 mg cyanidin-3-glucoside/ 100 g f.w. for elderberries and from 60.66 to 195.60 mg/100 g f.w. for blackberries. The high concentration of anthocyanins in elderberry is confirmed by other studies; for example Denev et al. [39] reported a value of 1.69 g/l inelderberry and 0.45 g/l in blackberry. The elderberries’s pattern of anthocyanins was characterized by the presence of specific compounds namely cyanidin 3-sambubioside and cyanidin 3-glucoside. The other anthocyanins are cyanidin-3-sambuboside-5-glucoside, cyanidin 3,5-diglucoside, cyanidin 3-rutinoside, pelargonidin-3-glucoside, pelargonidin-3-sambubioside and delfinidine-3-rutinoside [15, 40]. As reported by Mikulic-Petkovsek et al. [19], cyanidin-3-sambubioside and cyanidin-3-glucoside are the most abundant anthocyanins in S. nigra, and this is in line with our results. In particular, elderberries showed values ranging from 232.74 to 392.86 mg/100 g f.w. of cyanidin 3-sambubioside and from 156.70 to 334.81 mg/100 g of cyanidin 3-glucoside. Veberic et al. [41] studied the profile of two elderberry cultivars (“Rubini” and “Haschberg”) grown in Austria by an HPLC analysis by using a Gemini column C18 (150×4.6 mm 3μm, Phenomenex) and reported that the separation of cyanidin-3-sambubioside by cyanidin-3-glucoside and cyanidin-3-sambubioside-5-glucososide by cyanidin-3,5-diglucoside is not possible because the retention time of these anthocyanins is identical, as also affirmed by Bermúdez-Soto and Tomás-Barberán [40]. Due to the analytical conditions used in this work, a separation of the couple cyanidin-3-sambubioside and cyanidin-3-glucoside has been obtained. Also Mandrone et al. [24] evaluated the polyphenolic composition of elderberry species being endemic in Sicily by LC-MS analysis and separated three peaks: Cyanidin-3-sambubioside-5 glucoside, cyanidin-3-sambubioside and cyanidin-3-glucoside.
In blackberry the pattern of anthocyanins was characterized by the presence of 3-glucoside, 3-rutinoside, 3-xyloside, and 3-O-β-(6”-malonylglucoside) of cyanidin, and 5 cyanidin-3-O-β-(6”-(3-hydroxy-3-methylglutaroyl)-glucoside [8]. In our study, the chromatograms obtained from blackberries showed the presence of four principal peaks and only one of these was identified and attributed to cyanidin-3-glucoside, with a value ranging from 17.67 (value found for cultivated blackberry sample) to 36.06 mg/100 g f.w. (value referred to a wild berry fruit sample) (Fig. 1). Different genotypes frequently had comparable overall levels of total anthocyanins and phenolic compounds, but were characterized by a high different composition in individual profiles of compounds.
The total flavonoids were higher in elderberries than in blackberries, as confirmed in literature [36, 42] and ranged from 569.08 to 995.25 mg quercetin/100 g f.w. and from 169.27 to 682.72 mg quercetin/100 g f.w. respectively. In this latter case a lower concentration of total flavonoids was recorded for cultivated blackberry fruits with respect to wild ones. In the present study the analysis of flavonoids has focused particularly on the quantization of the glycoside rutin and aglycones quercetin, kaempferol and myricetin. The quercetin and the rutin were present only in the samples of elderberries and with a high variability intraspecies and the values of samples from different areas are not always significantly different. The values of rutin ranged from 14.44 to 43.11 mg/100 g, while the value of quercetin with from 11.88 to 74.66 mg/100 g. Quercetin was not detected in any of the blackberry samples analysed in our study; this is probably due to the presence of quercetin derivates in blackberries, as also reported in literature [2]. On the other hand, kaempferol and myricetin were present only in blackberries. Kaempferol was the predominant flavonoid and showed an high variability intraspecies and interspecies. Both the sample with the lowest and the highest concentration belonged to the species R. ulmifolius ranging from 19.57 to 444.86 mg/100 g f.w. The myricetin had high variability among samples of different species. The R. ulmifolius was characterized by the highest concentration ranging from 3.29 to 22.63 mg/100 g f.w., while the lower concentration was observed in the only one sample of R. hirtos. Different results have been reported by Jakobek and Seruga [42], who analyzing samples of R. fruticosus and S. nigra, found the presence of both kaempferol and quercetin in samples of elderberry and quercetin, but not kaempferol, in samples of blackberry fruits. In a study conducted in Georgia on cultivated blackberry fruits no quercetin and kaempferol were found, while a low concentration of myricetin was reported (about 10 mg/100 g f.w.) [43].
Also Jakobek et al. [44] analyzed the flavonoids in berries and particularly myricetin, kaempferol and quercetin. In blackberry fruits the amount of kaempferol and quercetin detected was 2.13 and 55.42 mg/kg f.w respectively, while myricetin was not present. This different result in blackberry flavonol composition could be due to similar retention times of quercetin and myricetin. In the same work, in the elderberry fruits no amount of quercetin, myricetin and kaempferol was found; it should emphasized that in our work a total quercetin obtained by the hydrolysis of glycosides has been analysed, while the data reported by Jakobek et al. [44] were referred only to quercetin in free form, without considering glycosylated quercetin.
The amounts of individual flavonols, such as kaempferol and myricetin, as well as ellagic acid were significant different between wild blackberries and common commercial cultivars, showing higher mean values for wild than commercial samples, as also reported by Milivojevic et al. [2].
The ellagic acid was present only in blackberry samples, ranging from 18.99 to 200.06 mg/100 g of product, with an high variability intraspecies and interspecies. Also Jakobek and Seruga [40] reported the presence of ellagic acid only in commercial blackberry and not in elderberry fruits, with a average value of 22.5 mg/kg of fresh weight. In any case, the lower concentrations were observed for cultivated berry fruits, belonging to R. fruticosus. Higher values of ellagic acid have been reported by Jakobek et al. [43], who compared the composition of different berries collected in Slavonia (Croatia), including S. nigra and R. fruticosus, and reported the highest concentration of ellagic acid (121 mg/kg) in blackberries and its absence in elderberry fruits.
The vitamin C levels showed no significant differences in elderberries and the values ranged from 23.98 mg/100 g to 38.75 mg/100 g f.w. Similar values of ascorbic acid were found by Akbulut et al. [37] in wild European elderberry fruits. Moreover, this nutrient compound did not differentiate all samples either in terms of location area or intra species variability (p > 0.05). In blackberries, the concentration varied from 11 mg/100 g to a maximum of 20.73 mg/100 g of product, with a higher concentration in wild blackberries. Highest values were found by Rios de Souza et al. [6] who reported a mean concentration of 52.41 mg/100 g of ascorbic acid in Brazilian blackberries. On the other hand, Veberic et al. [41] found low mean values of vitamin C for several cultivated blackberries of about 6.87 mg/100 g f.w.
Antioxidant activity is generally due to bioactive photochemical compounds and is frequently associated with total polyphenols or total flavonoid concentration. Moreover, the estimation of the antioxidant activity may vary depending on the method used, so it is preferable to determine it by using at least two techniques. In this study, the antioxidant properties of the extracts were analyzed by the ferric reducing antioxidant power (FRAP) and 2-2’-azino-di-(3-ethylbenzthiazoline sulfonic acid) (ABTS) radical scavenging capacity assays. The antioxidant activity in elderberry fruits ranged from 111.00 to 203.80 mM Eq gallic acid (FRAP) and from 26.36 to 42.52% quenching (ABTS). In blackberries the antioxidant activity ranged from 40.09 to 91.69 mM Eq gallic acid (FRAP) and from 16.16 to 37.02 % quenching (ABTS). The different methods reported in the scientific literature by different studies used did not allow a good comparison among the antioxidant activities. Anyway, in our study the correlation between antioxidant activity and phenolic substances was better, though not very high, between FRAP and total polyphenols (R2 = 0.78) and total flavonoids (R2 = 0.65), than between FRAP and total anthocyanins (R2 = 0.58) as also showed by Denev et al. [39]. These latter researchers evaluated the antioxidant activity of various berry fruits with different methods (TRAP, ORAC, HORAC and NO scavenging activity). Instead, the correlation coefficient between the antioxidant activity determined by ABTS method and polyphenols, anthocyanins and total flavonoids was lower. Conversely, the antioxidant activity evaluated with FRAP method by Ozgen et al. [45] was positively correlated with the concentration of total polyphenols and anthocyanins (R2 = 0.84 and 0.85, respectively). Our different finding was due to the fact that the berries composition is characterized by a large amount of phenolic compounds, such as procyanidins, that act as antioxidants, besides anthocyanins. Moreover, the antioxidant potential of different anthocianins is determined by their structural characteristics [8].
According to Rios de Souza et al. [6] climate, soil composition and management of berries are the main factors that may explain the difference in terms of bioactive compounds concentration. Moreover, significant differences in phytochemical and physicochemical compositions of berry fruit can be also observed according to the degree of maturation [46]. This has been demonstrated by Josiane et al. [4], which found higher values of anthocyanins, TPC and antioxidant activity in blackberry fruits with highest degree of maturation. Furthermore, it is also important to emphasize that the difference found in our results could be also explained by the various extraction methods applied.
3.2Cluster analysis
In order to verify if the beneficial properties of berry fruits on human health can be strictly related to the species, a Cluster analysis was performed. The data were represented as a dendogram and showed the presence of wine clusters (Fig. 2). According LSD test, a high variability inter species occurred; however, the cluster analysis showed that samples of the same species differ noticeably from other species. In fact, despite the high variability of the chemical parameters resulted from LSD test, two main clusters can be discerned, one includes all blackberry samples and the other all elderberry samples, allowing also a good discrimination within blackberry cluster, as function of the species (Fig. 1). In fact, two samples of R. fruticosus constitute a subcluster to a linkage distance of about 0.7, while samples of R. procerus form a subcluster with a linkage distance of 0.5. The only sample of R. hirtos is included in the subcluster that encloses all samples of R. ulmifolius.
4Conclusions
Mediterranean diet is made by several foods of plant origin, which are rich in nutraceuticals, able to exert antimicrobial, antioxidant, neuroprotective and anti-cancer activities. Among phytonutrients, there are flavonols (such as quercetin, a powerful antioxidant, present in apples, onions, in elderberry, capable to counteract the production of Reactive Oxygen Species (ROS) generated by oxidative stress in the heart), isoflavones (found in legumes, a protective effect against cardiovascular disease) anthocyanins. These latter moieties are powerful antioxidants with cardioprotective and neuroprotective effect and are present in red fruits and vegetables, such as blackberries and elderberries.
An increasing consumption of these products in the diet can help in prevention of certain diseases. Data contained in this study provide an insight into the nutraceutical substances in wild and cultivated blackberry and wild elderberry fruits, which are natural resources of some regions of Southern Italy, such as Basilicata and Campania, little valued and used in our diet.
The results showed a high variability in the health-promoting compounds, even within the same species, independently on the specific area of the collection, with higher values for wild than cultivated blackberries for the majority of the compounds analyzed. In any case, the blackberries, and even more the elderberries, are considered an excellent source of several nutraceuticals.
The use of wild species in the breeding programs of small fruits can be used for choosing berry fruits with a high content of health-promoting properties.
Acknowledgments
The authors thank Prof. Simona Fascetti and Dr. Leonardo Rosati for their assistance in botanical species identification.
References
[1] | Galgano F , Favati F , Caruso M , Pietrafesa A , Natella S . The influence of processing and preservation on the retention of health-promoting compounds in broccoli. J Food Sci. (2007) ;72: : S130–S135. doi: 10.1111/j.1750-3841.2006.00258.x |
[2] | Milivojević J , Maksimović V , Nikolić M , Bogdanović J , Maletić R , Milatović D . Chemical and antioxidant properties of cultivated and wild fragaria and rubus berries. J Food Qual. (2011) ;34: :1–9. doi: 10.1111/j.1745-4557.2010.00360.x |
[3] | Wu X , Gu L , Prior RL , McKay S . Characterization of anthocyanins and proanthocyanidins in some cultivars of Ribes, Aronia, and Sambucus and their antioxidant capacity. J Agric Food Chem. (2004) ;52: :7846–7856. doi: 10.1021/jf0486850 |
[4] | Rutz JK , Voss GB , Zambiazi RC . Influence of the degree of maturation on the bioactive compounds in blackberry (Rubus spp.) cv. Tupy. Food Nutr Sci. (2012) ;3: :1453–1460. doi: 10.4236/fns.2012.310189 |
[5] | Nile SH , Park SW . Edible berries: Bioactive components and their effect on human health. Nutrition. (2014) ;30: :134–144. doi: 10.1016/j.nut.2013.04.007 |
[6] | Rios De Souza V , Pereira PA , da Silva TL , de Oliveira Lima LC , Pio R , Queiroz F . Determination of bioactive compounds, antioxidant activity and chemical composition of Brazilian blackberry, red raspberry, strawberry, blueberry and sweet cherry fruits. Food Chem. (2014) ;156: :362–368. doi: 10.1016/j.foodchem.2014 |
[7] | Mertz C , Gancel AL , Gunata Z , Alter P , Dhuique-Mayer C , Vaillant F , et al. Phenolic compounds, carotenoids and antioxidant activity of three tropical fruits. J Food Comp Anal. (2009) ;22: :381–387. doi: 10.1016/j.jfca.2008.06.008 |
[8] | Ivanovic J , Tadic V , Dimitrijevic S , Stamenic M , Petrovic S , Zizovic I . Antioxidant properties of the anthocyanin-containing ultrasonic extract from blackberry cultivar “Čačanska Bestrna”. Ind Crop Prod. (2014) ;53: :274–281. doi: 10.1016/j.indcro2013.12.048 |
[9] | Parnprawit A , Heyes JA , Molan AL , Kruger MC . Antioxidant activity and inhibitory potential of blueberry extracts against key enzymes relevant for hyperglycemia. J Food Biochem. (2015) ;39: :109–118. doi: 10.1111/jfbc.12094 |
[10] | Forbes-Hernández TY , Giampieri F , Gasparrini M , Mazzoni L , Quiles JL , Alvarez-Suarez JM ., et al. The effects of bioactive compounds from plant foods on mitochondrial function: A focus on apoptotic mechanisms. Food Chem Toxicol. (2014) ;68: :154–182. doi: 10.1016/j.fct.2014.03.017 |
[11] | Zarfeshany A , Asgary S , Javanmard SH . Potent health effects of pomegranate. Adv Biom Res. (2014) ;3: :100–108. doi: 10.4103/2277-9175.129371 |
[12] | Acosta-Montoya Ó , Vaillant F , Cozzano S , Mertz C , Pérez AM , Castro MV . Phenolic content and antioxidant capacity of tropical highland. Food Chem. (2010) ;119: :1497–1501. doi: 10.1016/j.foodchem.2009.09.032 |
[13] | Gonzaález-Barrio R , Borges G , Mullen W , Crozier A . Bioavailability of anthocyanins and ellagitannins following consumption of raspberries by healthy humans and subjects with an ileostomy. J Agric Food Chem. (2010) ;58: :3933–3939. doi: 10.1021/jf100315d |
[14] | Promsong A , Chung WO , Satthakarn S , Nittayananta W . Ellagic acid modulates the expression of oral innate immune mediators: Potential role in mucosal protection. J Oral Pathol Med. (2015) ;44: :214–221. doi: 10.1111/jo12223 |
[15] | Sidor A , Gramza-Michałowska A . Advanced research on the antioxidant and health benefit of elderberry (Sambucus nigra) in food–a review. J Funct Foods. (2015) ;18: :941–958. doi: 10.1016/j.jff.2014.07.012 |
[16] | Akkarachiyasit S , Charoenlertkul P , Yibchok-anun S , Adisakwattana S . Inhibitory activities of cyanidin and its glycosides and synergistic effect with acarbose against intestinal α-glucosidase and pancreatic α-amylase. Int J Mol Sci. (2010) ;11: :3387–3396. doi: 10.3390/ijms11093387 |
[17] | Folmer F , Basavaraju U , Jaspars M , Hold G , El-Omar E , Dicato M , Diederich M . Anticancer effects of bioactive berry compounds. Phytochem Rev. (2014) ;13: :295–322. doi: 10.1007/s11101-013-9319-z |
[18] | Yang H , Hewes D , Salaheen S , Federman C , Biswas D . Effects of blackberry juice on growth inhibition of foodborne pathogens and growth promotion of Lactobacillus. Food Control. (2014) ;37: :15–20. doi: 10.1016/j.foodcont.2013.08.042 |
[19] | Mikulic-Petkovsek M , Schmitzer V , Slatnar A , Todorovic B , Veberic R , Stampar F , et al. Investigation of anthocyanin profile of four elderberry species and interspecific hybrids. J Agric Food Chem. (2014) ;62: :5573–5580. doi: 10.1021/jf5011947 |
[20] | Rotundo A , Bounous G , Benvenuti S , Vampa G , Melegari M , Soragni F . Quality and yield of Ribes and Rubus cultivars grown in Southern Italy hilly locations. Phytother Res. (1998) ;12: :S135–S137. |
[21] | Pantelidis GE , Vasilakakis M , Manganaris GA , Diamantidis GR . Antioxidant capacity, phenol, anthocyanin and ascorbic acid contents in raspberries, blackberries, red currants, gooseberries and Cornelian cherries. Food Chem. (2007) ;102: :777–783. doi: 10.1016/j.foodchem.2006.06.021 |
[22] | Ganhão R , Estévez M , Kylli P , Heinonen M , Morcuende D . Characterization of selected wild Mediterranean fruits and comparative efficacy as inhibitors of oxidative reactions in emulsified raw pork burger patties. J Agric Food Chem. (2010) ;58: :8854–8861. doi: 10.1021/jf101646y |
[23] | Vrhovsek U , Giongo L , Mattivi F , Viola R . A survey of ellagitannin content in raspberry and blackberry cultivars grown in Trentino (Italy). Eur Food Res Technol. (2008) ;226: :817–824. doi: 10.1007/s00217-007-0601-4 |
[24] | Mandrone M , Lorenzi B , Maggio A , La Mantia T , Scordino M , Bruno M , Poli F . Polyphenols pattern and correlation with antioxidant activities of berries extracts from four different populations of Sicilian Sambucus nigra L. Nat Prod Res. (1246) ;28: :1246–1253. doi: 10.1080/14786419.2014.898147 |
[25] | Giampieri F , Tulipani S , Alvarez-Suarez JM , Quiles JL , Mezzetti B , Battino M . The strawberry: Composition, nutritional quality, and impact on human health. Nutrition. (2014) ;28: :9–19. doi: 10.1016/j.nut.2011.08.009 |
[26] | Gullo G , Dattola A , Liguori G , Vonella V , Zappia R , Inglese P . Evaluation of fruit quality and antioxidant activity of kiwifruit during ripening and after storage. J Berry Res. (2016) ;1–11. doi: 10.3233/JBR-150111 |
[27] | Pignatti S . Flora D’Italia. Edagricole. (2011) ; Vol.I-III: . |
[28] | Galgano F , Favati F , Lapelosa L , Albanese D , Montanari L . Effect of chilling on the vitamin c content of fennel during storage. Ital J Food Sci. (2002) ;14: :167–174. |
[29] | Caruso MC , Galgano F , Pecora M , Tolve R , Verrastro M , Favati F . Conventional and organic foods: A comparison focused on animal products. J Chem. (2015) ;1–18. doi: 10.1080/23311932.2016.1142818 |
[30] | Singleton V , Rossi J . Colorimetry of total phenolics with phosphomolybdic-phosphotungstic acid reagents. Am J Enol Vitic. (1965) ;16: :144–158. |
[31] | Lee J . Determination of total monomeric anthocyanin pigment content of fruit juices, beverages, natural colorants, and wines by the pH differential method: Collaborative study. J AOAC Int. (2005) ;88: :1269–1278. |
[32] | Bunea A , Ruginà DO , Pintea AM , Sconta Z , Bunea CI , Socaciu C . Comparative polyphenolic content and antioxidant activities of some wild and cultivated blueberries from Romania. Not Bot Horti Agrobo. (2011) ;39: :70–76. |
[33] | Erel O . A novel automated direct measurement method for total antioxidant capacity using a new generation, more stable ABTS radical cation. Clin Biochem. (2004) ;37: :277–285. doi: 10.1016/j.clinbiochem.2003.11.015 |
[34] | Szöllösi R , Szöllösi VI . Total antioxidant power in some species of Labiatae (Adaptation of FRAP method). Acta Biol Szeged. (2002) ;46: :125–127. |
[35] | Kment P , Mihaljevič M , Ettler V , Šebek O , Strnad L , Rohlová L . Differentiation of Czech wines using multielement composition–A comparison with vineyard soil. Food Chem. (2005) ;91: :157–165. doi: 10.1016/j.foodchem.2004.06.010 |
[36] | Ochmian I , Oszmiański J , Skupień K . Chemical composition, phenolics, and firmness of small black fruits. J Appl Bot Food Qual. (2012) ;83: :64–69. |
[37] | Akbulut M , Ercisli S , Tosun M . Physico-chemical characteristics of some wild grown European elderberry (Sambucus nigra L.) genotypes. Pharmacogn Mag. (2009) ;5: :320–323. doi: 10.4103/0973-1296.58153 |
[38] | Reátegui JLP , Machado APDF , Barbero GF , Rezende CA , Martínez J . Extraction of antioxidant compounds from blackberry (Rubus sp.) bagasse using supercritical CO2 assisted by ultrasound. J Supercrit Fluids. (2014) ;94: :223–233. doi: 10.1016/j.supflu.2014.07.019 |
[39] | Denev P , Ciz M , Ambrozova G , Lojek A , Yanakieva I , Kratchanova M . Solid-phase extraction of berries’ anthocyanins and evaluation of their antioxidative properties. Food Chem. (2010) ;123: :1055–1061. doi: 10.1016/j.foodchem.2010.05.061 |
[40] | Bermúdez-Soto MJ , Tomás-Barberán FA . Evaluation of commercial red fruit juice concentrates as ingredients for antioxidant functional juices. Eur Food Res Technol. (2004) ;219: :133–141. doi: 10.1007/s00217-004-0940-3 |
[41] | Veberic R , Jakopic J , Stampar F , Schmitzer V . European elderberry (Sambucus nigra L.) rich in sugars, organic acids, anthocyanins and selected polyphenols. Food Chem. (2009) ;114: :511–515. doi: 10.1016/j.foodchem.2008.09.080 |
[42] | Jakobek L , Seruga M . Influence of anthocyanins, flavonols and phenolic acids on the antiradical activity of berries and small fruits. Int J Food Prop. (2012) ;15: :122–133. doi: 10.1080/10942911003754684 |
[43] | Sellappan S , Akoh CC , Krewer G . Phenolic compounds and antioxidant capacity of Georgia-grown blueberries and blackberries. J Agric Food Chem. (2002) ;50: :2432–2438. doi: 10.1021/jf011097r |
[44] | Jakobek L , Seruga M , Novak I , Medvidovic-Kosanovic M . Flavonols, phenolic acids and antioxidant activity of some red fruits. Dtsch Lebensmitt Rundsch. (2007) ;103: :369–378. |
[45] | Ozgen M , Scheerens JC , Reese RN , Miller RA . Total phenolic, anthocyanin contents and antioxidant capacity of selected elderberry (Sambucus canadensis L.) accessions. Pharmacogn Mag. (2010) ;6: :198–203. doi: 10.4103/0973-1296.66936 |
[46] | Woods MF , Dozier WA Jr , Ebel RC , Thomas RH , Nesbitt M , Wilkins BS , Himelrick DG . Fruit quality and antioxidant properties in alabama-grown blackberries during fruit maturation. Int J Fruit Sci. (2007) ;6: :67–85. doi: 10.1300/J492v06n03_06 |
Figures and Tables
Fig.1
Anthocyanins in blackberry methanolic extract.
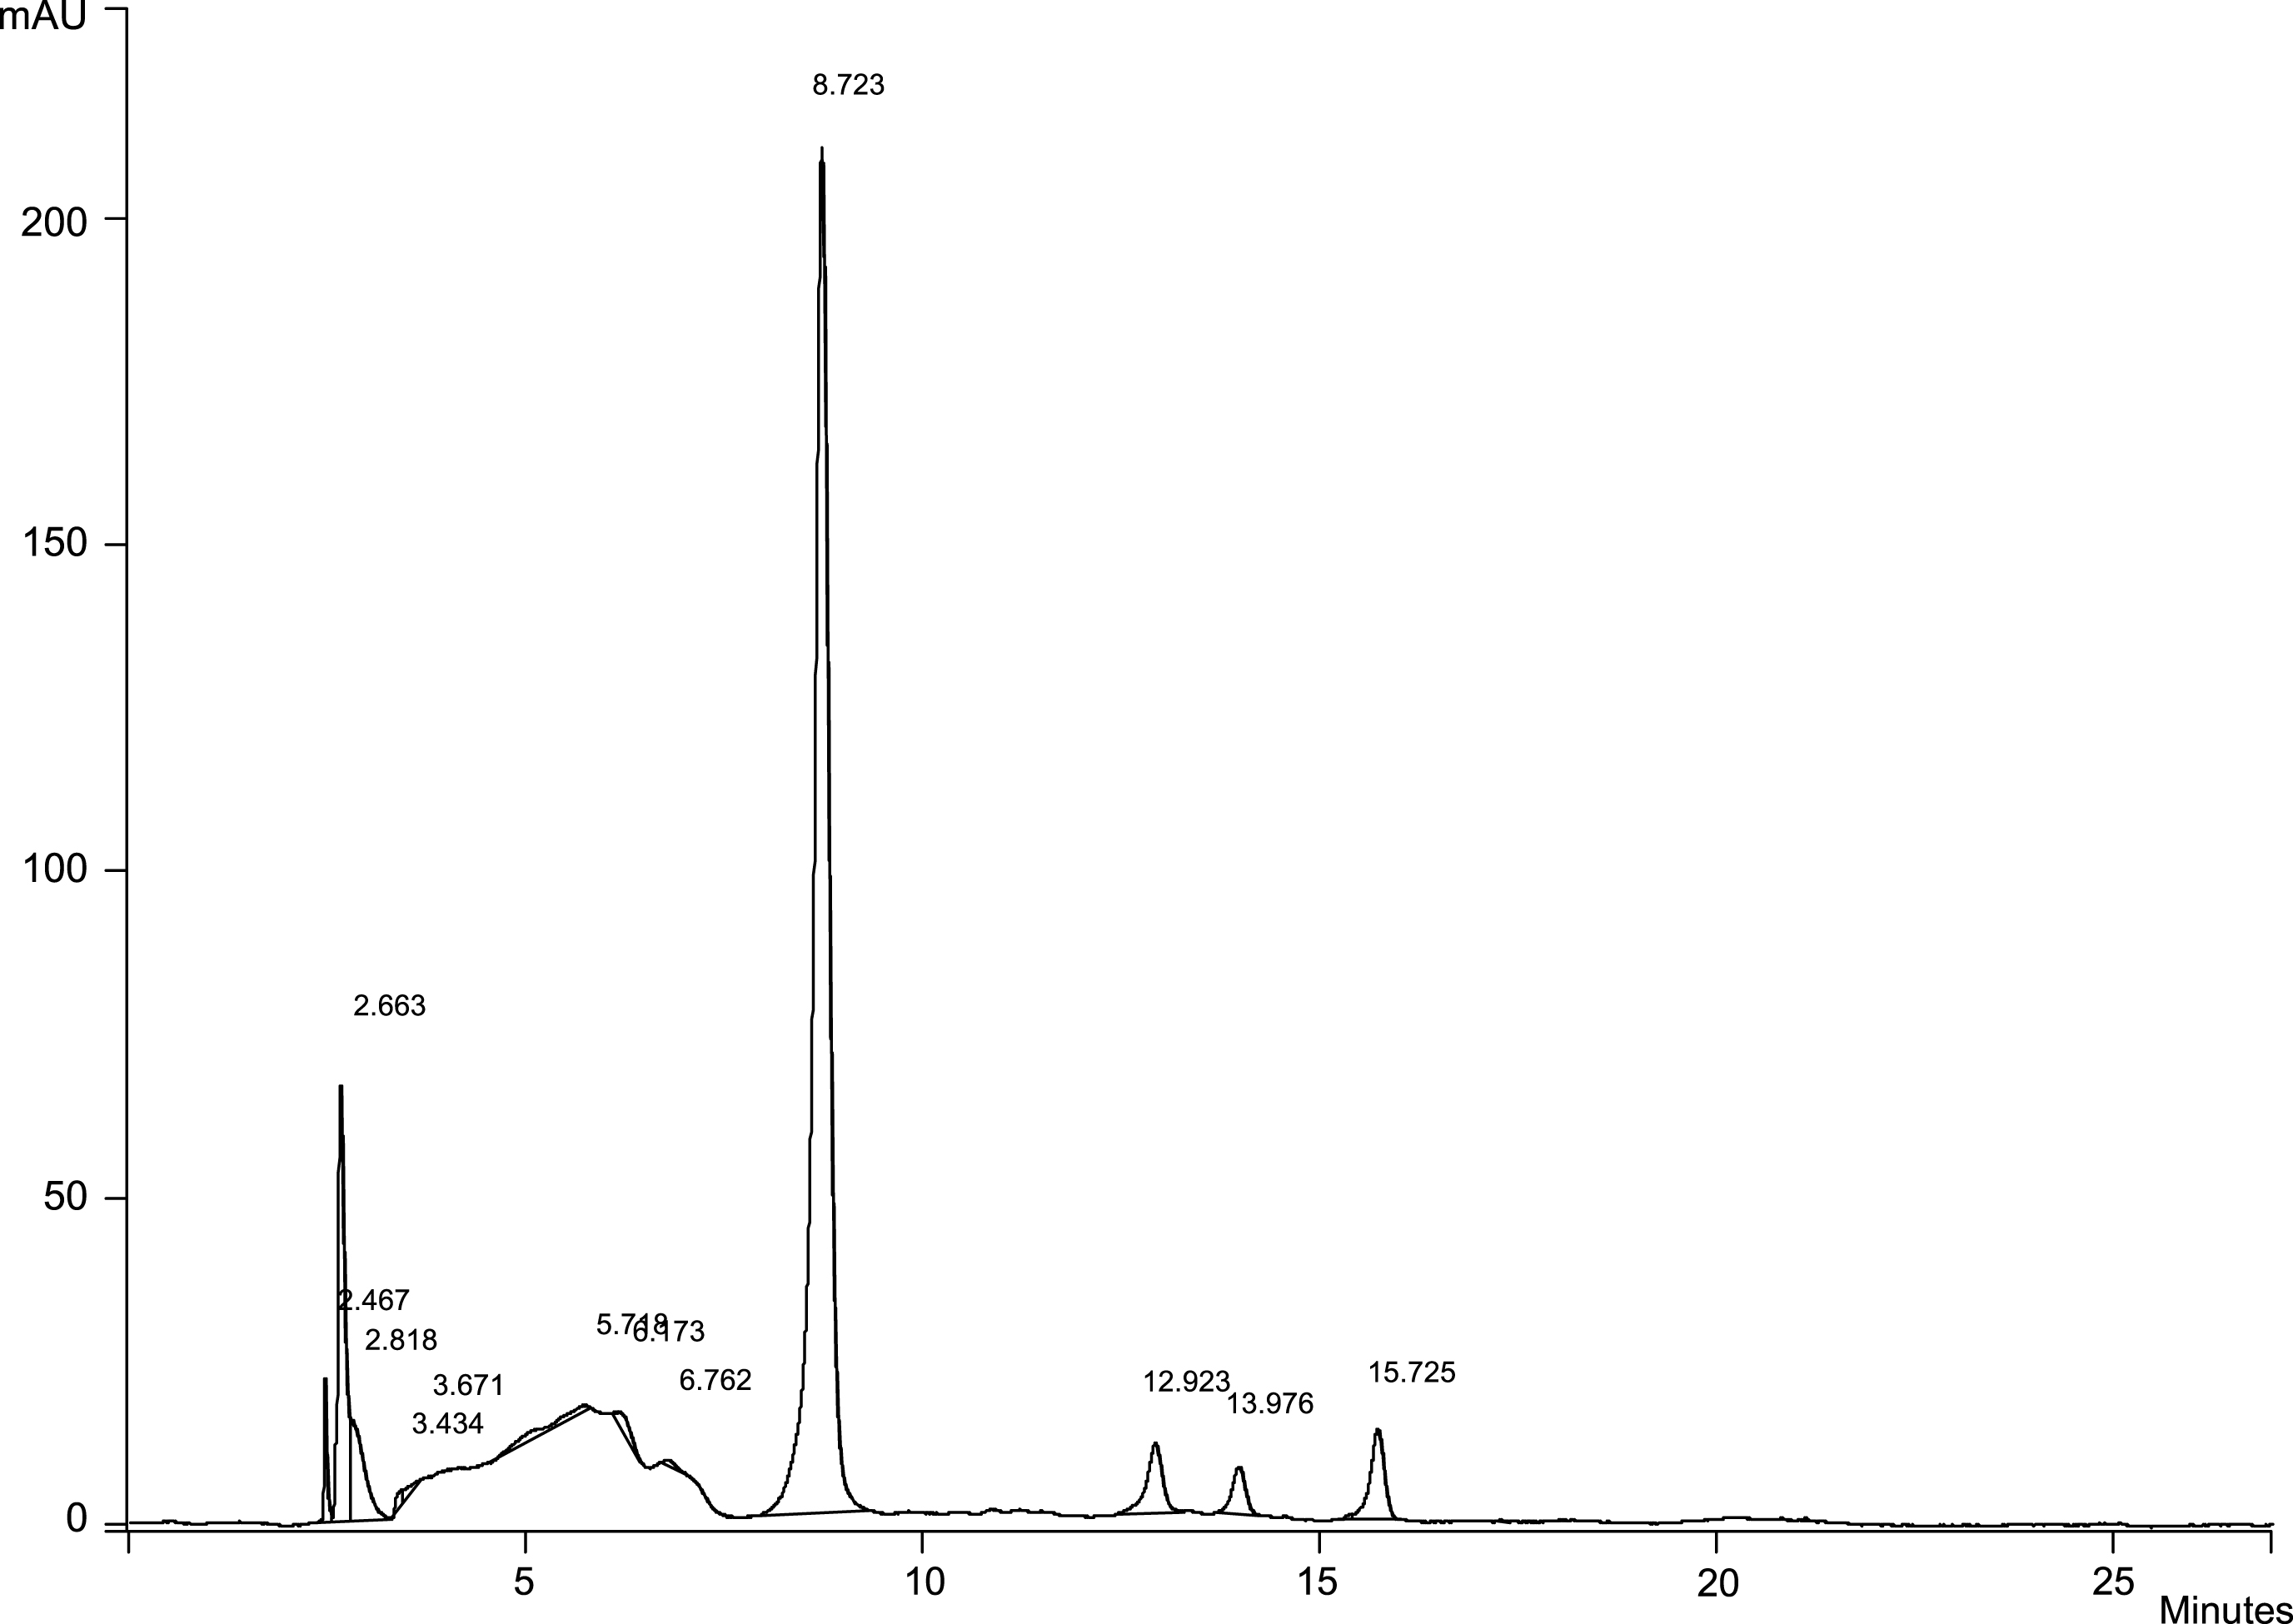
Fig.2
Cluster Analysis of blackberry and elderberry samples (Euclidean distances, Ward’s method).
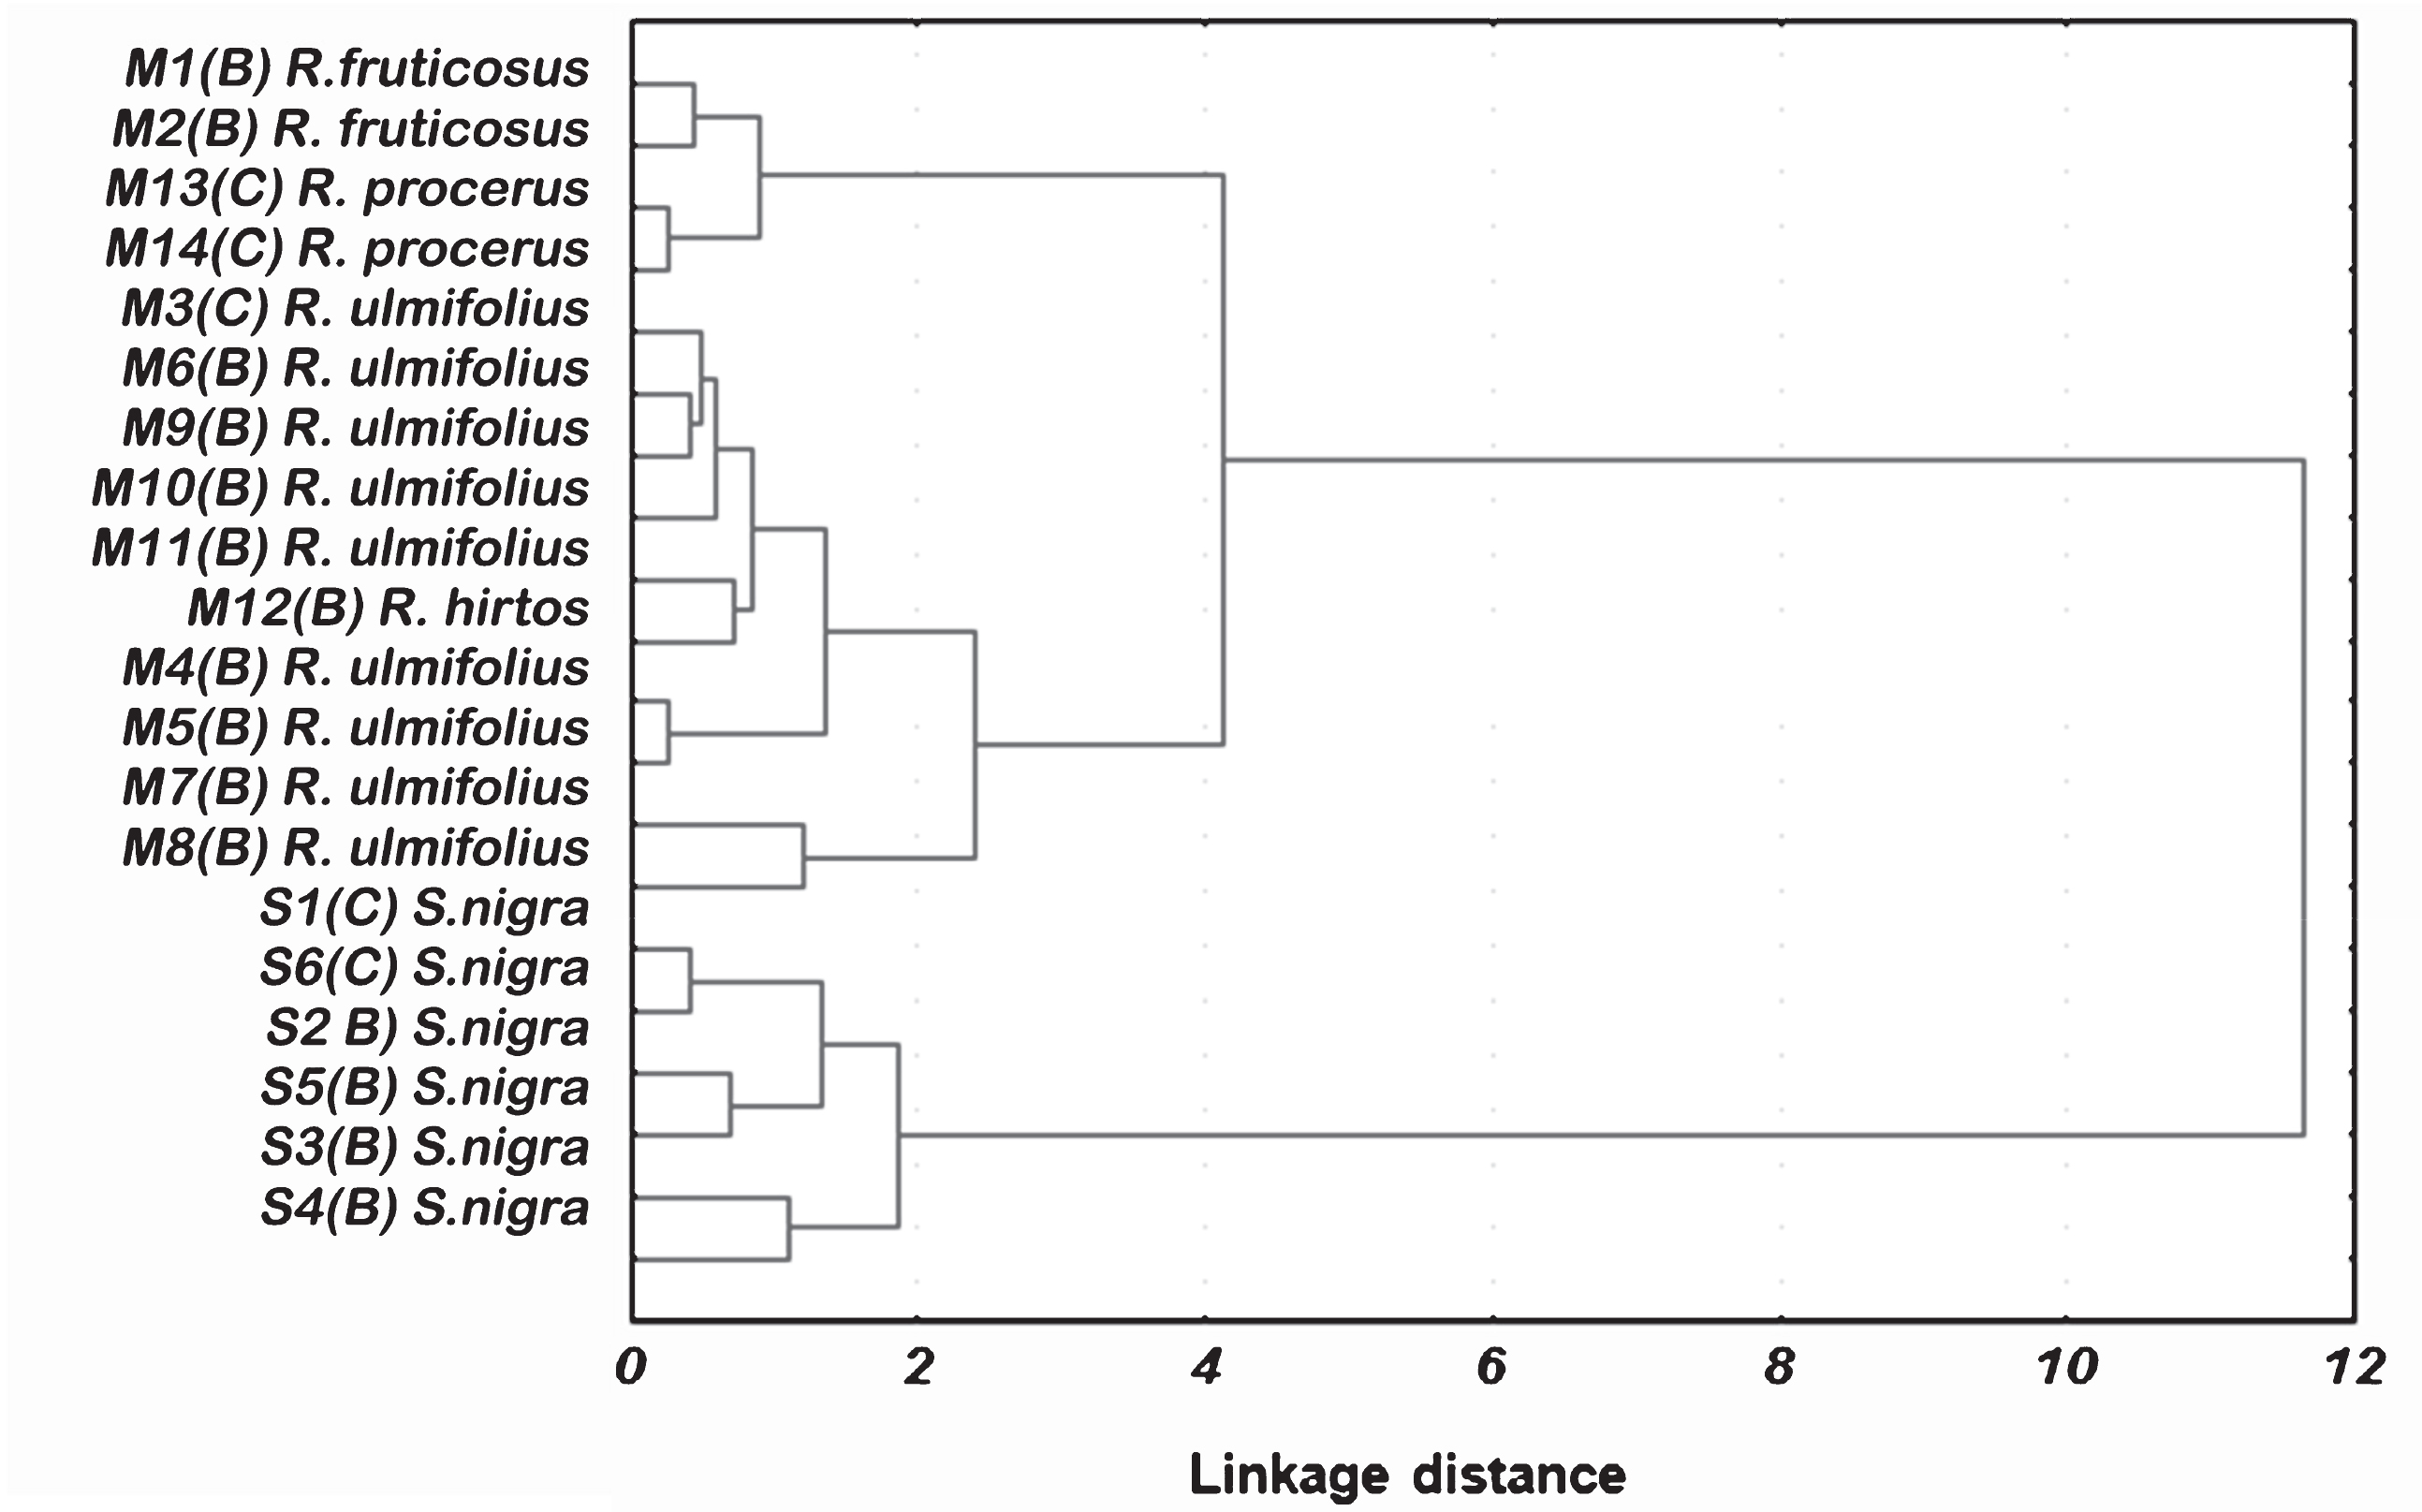
Table 1
Location where samples were grown
| Sample | Species | Region | Collecting area | Latitude | Longitude | Elevation (m) |
| N | E | |||||
| S1 | Sambucus nigra | Campania | Avellino | 40°54’ | 14°47’ | 348 |
| S2 | Sambucus nigra | Campania | Avellino | 40°54’ | 14°47’ | 348 |
| S3 | Sambucus nigra | Basilicata | Chiaromonte (PZ) | 40°7’ | 16°12’ | 794 |
| S4 | Sambucus nigra | Basilicata | Brienza (PZ) | 40°28’ | 15°37’ | 713 |
| S5 | Sambucus nigra | Basilicata | Potenza | 40°38’ | 15°48’ | 819 |
| S6 | Sambucus nigra | Basilicata | Potenza | 40°38’ | 15°48’ | 819 |
| M1 | Rubus fruticosus | Basilicata | Potenza | 40°38’ | 15°48’ | 819 |
| M2 | Rubus fruticosus | Basilicata | Potenza | 40°38’ | 15°48’ | 819 |
| M3 | Rubus ulmifolius | Campania | Avellino | 40°54’ | 14°47’ | 348 m |
| M4 | Rubus ulmifolius | Basilicata | Corleto P.ra (PZ) | 40°23’ | 16°2’ | 749 m |
| M5 | Rubus ulmifolius | Basilicata | Corleto P.ra (PZ) | 40°23’ | 16°2’ | 749 m |
| M6 | Rubus ulmifolius | Basilicata | Potenza | 40°38’ | 15°48’ | 819 m |
| M7 | Rubus ulmifolius | Basilicata | Potenza | 40°38’ | 15°48’ | 819 m |
| M8 | Rubus ulmifolius | Basilicata | Potenza | 40°38’ | 15°48’ | 819 m |
| M9 | Rubus ulmifolius | Basilicata | Potenza | 40°38’ | 15°48’ | 819 m |
| M10 | Rubus ulmifolius | Basilicata | Potenza | 40°38’ | 15°48’ | 819 m |
| M11 | Rubus ulmifolius | Basilicata | Potenza | 40°38’ | 15°48’ | 819 m |
| M12 | Rubus hirtos | Basilicata | Pietrapertosa | 40°31’ | 16°3’ | 1088 m |
| M13 | Rubus procerus | Campania | Avellino | 40°54’ | 14°47’ | 348 m |
| M14 | Rubus procerus | Campania | Avellino | 40°54’ | 14°47’ | 348 m |
Table 2
Variability of the chemical characteristics in wild Sambucus nigra samples
| Chemical parameters | Samples of S.nigra | F | p | |||||
| S1(C) | S2(C) | S3(B) | S4(B) | S5(B) | S6(B) | |||
| Quercetin mg/100 g f.w. | 18.98c | 12.79e | 16.07d | 74.66a | 11.88e | 22.92b | 5900.03 | *** |
| Rutin mg/100 g f.w. | 34.00c | 14.44e | 20.11d | 43.11a | 19.17d | 37.00b | 321.21 | *** |
| Vitamin C mg/100 g f.w. | 38.75a | 29.21a | 28.98a | 37.70a | 23.98a | 34.83a | 4.72 | n.s. |
| Cyanidin-3-Glucoside mg/100 g f.w. | 209.48a | 334.81a | 179.76a | 185.76a | 156.70a | 189.31a | 1.16 | n.s. |
| Cyanidin-3-Sambubioside mg/100 g f.w. | 285.95c | 392.86a | 232.74e | 246.80d | 353.27b | 250.04d | 3091.35 | *** |
| TAC mg Cy 3-Glu/100 g f.w. | 284.28c | 398.20a | 198.00f | 219.42e | 318.22b | 227.93d | 1621.41 | *** |
| TPC mg gallic acid /100 g f.w. | 573.87b | 603.47b | 353.44e | 505.82c | 701.15a | 474.43d | 200.47 | *** |
| Total Flavonoids mg quercetin /100 g f.w. | 892.20b | 995.25a | 580.57e | 569.08f | 842.03c | 756.04d | 12963.53 | *** |
| FRAP mg gallic acid /100 g f.w. | 337.86a | 286.94a | 233.59a | 188.83a | 346.70a | 287.72a | 4.38 | n.s. |
| ABTS % quenching | 40.38 ab | 41.60a | 26.36c | 28.35c | 42.52a | 37.47b | 59.88 | *** |
Least Significant Difference (LSD): Averages in the same row with different letters are significantly different; (*p < 0.05; ** p < 0.01; *** p < 0.001). B = Basilicata; C = Campania.
Table 3
Variability of the chemical characteristics in samples of genus Rubus
| Samples of Rubus | ||||||||||||||||
| Chemical | R. fruticosus | R. ulmifolius | R. hirtos | R. procerus | ||||||||||||
| parameters | Cultivated | Wild | Wild | Wild | ||||||||||||
| M1(B) | M2(B) | M3(C) | M4(B) | M5(B) | M6(B) | M7(B) | M8(B) | M9 (B) | M10(B) | M11(B) | M12(B) | M13(C) | M14(C) | F | p | |
| Kaempferol mg/100 g f.w. | 125.42e | 41.56i | 30.86j | 134.88d | 71.35g | 48.70 h | 444.86a | 78.63f | 19.57k | 20.80k | 258.42b | 142.79c | 33.10j | 23.84k | 6344.01 | *** |
| Myricetin mg/100 g f.w. | 41.14d | 1.56k | 14.34f | 20.66e | 6.87h | 3.57ij | 200.25b | 222.63a | 4.70i | 4.07ij | 70.19c | 3.29ij | 10.09g | 4.83i | 30265.99 | *** |
| Ellagic acid mg/100 g f.w. | 18.99k | 29.70j | 119.17d | 154.08c | 168.95b | 58.72h | 200.06a | 78.90e | 56.95h | 77.97ef | 40.74i | 75.16e | 69.95f | 77.40e | 1981.66 | *** |
| Vitamin C mg/100 g f.w. | 14.37 c | 13.13d | 11.00d | 20.43a | 19.91a | 20.73a | 20.29a | 20.39a | 15.80bc | 12.71cd | 14.72c | 18.32ab | 19.18a | 20.09a | 11.24 | *** |
| Cyanidin-3-Glucoside mg cyanidin chloride equivalent /100 g f.w. | 18.38f | 17.67f | 36.06a | 34.53b | 31.83c | 35.39ab | 18.82ef | 19.99e | 35.44ab | 24.16d | 35.19ab | 18.73ef | 18.37f | 20.21e | 257.08 | *** |
| A1 mg cyanidin chloride equivalent /100 g f.w. | 26.87a | 23.07b | 0.00c | 0.00c | 0.00c | 0.00c | 0.00c | 0.00c | 0.00c | 0.00c | 0.00c | 0.00c | 26.26a | 26.96a | 1064.31 | *** |
| A2 mg cyanidin chloride equivalent /100 g f.w. | 26.80d | 26.04d | 49.94a | 48.91abc | 46.09bc | 49.54ab | 27.32d | 29.20d | 49.37ab | 45.77c | 49.53ab | 0.00e | 28.60d | 26.99d | 164.41 | *** |
| A3 mg cyanidin chloride equivalent /100g | 31.90de | 29.30f | 42.67a | 39.76b | 33.37d | 39.88b | 32.52de | 31.82de | 36.22c | 30.83ef | 40.16b | 0.00c | 31.91de | 33.31d | 316.41 | *** |
| TAC m Cy 3-Glu/100 g f.w. | 195.60a | 169.27b | 128.73c | 108.01de | 94.29ef | 119.62cd | 60.66g | 73.67g | 118.32cd | 86.19f | 119.92 cd | 102.40ef | 119.72cd | 127.33c | 51.49 | *** |
| TPC mg gallic acid/100 g f.w. | 289.53efg | 247.35h | 309.43de | 337.67bc | 353.12b | 305.47def | 419.99a | 352.05b | 278.89g | 279.97fg | 234.82 h | 285.22efg | 274.13g | 318.69cd | 30.39 | *** |
| Total Flavonoids mg quercetin /100 g f.w. | 236.29i | 169.27j | 324.81h | 648.39b | 368.39b | 318.59h | 682.72a | 500.50c | 388.31f | 682.45a | 479.01d | 366.61g | 330.65h | 418.29e | 1601.81 | *** |
| FRAP mg gallic acid /100 g f.w. | 82.36gh | 68.29h | 130.45cde | 140.64bcd | 155.98a | 95.05fg | 159.88abcd | 121.86e | 144.40abc | 148.24ab | 129.10bc | 87.17efg | 68.20g | 105.10de | 37.78 | *** |
| ABTS % quenching | 26.43d | 25.80de | 25.52de | 33.35bc | 32.88bc | 30.54c | 16.16g | 22.88def | 22.57ef | 25.62de | 23.47d | 21.92d | 34.13ab | 37.02a | 24.71 | *** |
Least Significant Difference (LSD): Averages in the same row with different letters are significantly different; (*p < 0.05; ** p < 0.01; *** p < 0.001); B = Basilicata; C = Campania.


