
Kiwifruit pollination: the interaction between pollen quality, pollination systems and flowering stage
Abstract
BACKGROUND: Kiwifruit (cv. Hayward) artificial pollination is a crucial technique useful to increase fruit quality and size. However, artificial pollination efficiency depends on the timing of application and the pollination system.
OBJECTIVE: The main objective is identify the best practices to be applied in the orchard to reach the best pollination by deciphering the relation between the floral stage and the pollination technique.
METHODS: Many parameters were analyzed in different environments in Italy for many years, such as pollen quality (germinability, humidity, conservation at –18°C), pollination system (dry or liquid, using different machines) and flowering stage. The interaction of the pollination systems and the flowering stage were evaluated by labeling flowers according to their flowering stage and weighting the fruit later.
RESULTS: The petals fall and the early petal fall stages is the best moments for dry and liquid pollination respectively. The dry blower system gave the best results. The low pollination rate observed using the pollen-lycopodium mix is due to the interfering of the lycopodium on pistils. Pollen quality was achieved keeping it at low temperature during its harvesting and must have low humidity when stored at low temperature.
CONCLUSIONS: The dry pollination with pure pollen reach the best result because at the end of flowering the pistil exudate increase the pollen adhesion.
1Introduction
Artificial pollination in kiwifruit (Actinidia deliciosa (A. Chev.) C.F. Liang et A.R. Ferguson) is a cultural practice much more important in kiwifruit than in other fruit trees because the kiwifruit size is directly related to seeds number [1–3], which depend on the pollination. Moreover, in kiwifruit pollination is more difficult than other species since it’s dioecious and the flowers are not that attractive to pollinator due to the lack of nectar [2]. Therefore, pollinators usually prefer other plant (often grass) that bloom at the same time, also at some kilometers of distance [4]. The number of seeds in a fruit weighting 100 g is around one thousand and it is estimated that is necessary about tenfold pollen grains to reach this seeds number [1–3]. Insufficient pollination leads to unsatisfactory fruit size, shape and uniformity, which, in turn, reduces the market value of the production [5].
For all these reasons, artificial pollination became an important technique necessary to increase kiwifruit quality and size [1, 2, 6]. However, pollination not always reaches the maximal efficiency being depend on the flower phenological stage at pollination, the year, the pollen harvesting system and the pollination system. In this study, many parameters were analyzed alone and in interaction in different environments in Italy and for many years: pollen quality, pollination system and flowering.
High quality pollen is crucial for good results. Pollen germinability, germination energy and humidity were evaluated under different harvesting conditions, storage at different temperatures and exposition at different temperatures [7]. Finally, different pollination equipment and different adjuvants (i.e. dry or liquid) were tested.
The influence of the flower phenological stage on the different pollination systems was also evaluated in order to understand which is the best flowering stage in relation to the pollination system adopted.
2Materials and methods
Pollen was harvested in a commercial orchard from Actinidia deliciosa cv Tumuri (in Verona in 2008). Two different commercial equipment, cyclone system (ApiraPollineMini2) and filter system (AspiraPollineTM, both by Biotac, Verona, Italy), were tested to evaluate their pollen harvesting efficacy.
Before the use, pollen germinability was tested by dispersion of dry pollen on Petri disc containing solid medium as described in Hecker et al. [8], and observed under 200x optical microscope after 8 hours at 20°C. The germinability was evaluated as described by Hopping et al. [1] and using UTHSCSA ImageTool, tube length was evaluated by count the diameter fold of pollen grain (about 25 micron). The analysis were conducted with 3 biological repetitions and by counting at least 100 pollen grains each. To evaluate optimal temperature for germination, the pollen tube length was recorder each hour for 14 hours during germination at three different temperature (18°C, 24°C, 30°C). Humidity was evaluated by drying pollen at 105°C until its weight became constant (three biological repetitions).
The comparison among different pollination equipment was performed on Actinidia deliciosa cv Hayward in field conditions in Lagnasco (Cuneo) in 2009. The machines used in the pollination-systems comparative test (Fig. 1) were: 12 V dry distributor pollen-lycopodium (45 –55%) mixture model Speedy (Dell’Agata, Forlí, Italy), operative speed 5–7 h/ha (Fig. 1A); liquid distributor 12 V diaphragm pump model Professional membrana (Ravello, Cuneo, Italy), productivity 4 h/ha (Fig. 1B); blower dry distributor of pure pollen model SoffiaPolline (Biotac, Verona, Italy) pollination productivity 1 h/ha (Fig. 1C); liquid distributor tractor machine model SpruzzaPollineTR (Gerbaudo, Cuneo, Italy), with fogger type nozzles, speed 2 h/ha (Fig. 1D); manual pollination namely “pon-pon”, 25 h/ha (Fig. 1E); tractor fans model Ventole (Romani, Verona, Italy) speed 0.5 h/ha (Fig. 1F). Pollination was performed when about 90% of flowers were at petal fall (with white pistils). Pollination was carried out in a single step at early morning (form 6 am to 8 am, temperature average 18°C, humidity average 65%) and 600 g of pollen per hectare were sprayed. For the liquid distribution, 12 g of pollen were suspended in 995 ml of deionized water and 5 ml of activator PollenAid (Kiwi Pollen, New Zealand) was added and 50 L of suspension were sprayed per hectare.
The experiment was designed in randomized block in standard orchards (male:female rate 1:6) growth with T-bar system, 5 plants per block, 5 blocks per thesis.
In the experiment established to elucidate the influence of flower phenological stage on the performances of artificial pollination, each flower was labeled with a different color in relation to its flowering stage: closed flower, white petals, ocher petals, early petals fall, petals fall (Fig. 2). To label flowers a “tape binder” (Byoung Jue Agricultural Co., Korea) was used. The fruit size was manually measured at harvest. Both liquid and dry pollen preparation were used and the pollen was distributed by liquid distributor 12 V diaphragm pump model “Professional membrana” (Ravello, Cuneo, Italy) and blower dry distributor SoffiaPolline (Biotac, Verona, Italy) respectively. The experiment was performed in commercial orchards in Cuneo (2010) and Verona (2011, 2012, 2013) on T-Bar and in Latina (2011) on pergola. The experiment was designed in randomized block 2 plants per block, 4 repetitions, with at least 100 flower per stage. The pollination was made with one-step distribution with 600 g/ha of pure pollen.
The experiment established to understand the effect of inert like lycopodium in the pollination, usually added to pollen in dry pollination Speedy distributor (as suggested by manufacturer instructions), was performed in 2013 in Verona by comparing two dry pollination equipment (Speedy and SoffiaPolline) with and without lycopodium added. Experimental design consisted of four thesis (two rows each): natural pollination, pollination with SoffiaPolline with pure pollen, pollination with SoffiaPolline with pollen-lycopodium (55 –45%) mixture and pollination with Speedy with pollen-lycopodium mixture. The thesis with pure pollen sprayed with Speedy was not conducted because at the minimal dosage imposed to the machine the quantity of pollen is too high, anyway in practical application it was recommended to use diluted pollen with that equipment. Statistical analysis was performed by ANOVA Tukey test (P value 0.05): different letters indicate statistically significant differences.
The experiments were conducted in commercial orchards because the aim of the work was to develop methods that could be applied in real field conditions by the growers. The presence of natural pollination, due to the presence of pollen in the air derived from male plants present in the same orchard where the experiments were conducted or from neighbor orchards, was took in account by evaluating the pollination of untreated flower or closed flower at the moment of artificial pollination.
3Results and discussion
3.1Evaluation of pollen harvesting systems
Pollen harvest system influence the pollen humidity if the air relative humidity is high during the harvesting, as happened in the two year of experimentation: in the case of filter system (AspiraPollineTR) pollen grains were dried to about 10% of relative humidity (RH) independently to the air RH whereas in the case of cyclone system (AspiraPollineMini2) pollen RH increase with air RH increasing (Table 1). This difference is due to the vacuum inside the filter of AspiraPollineTR, therefore lower temperature (5°C to 8°C) in comparison to external one: water vapor in the air is condensed by vacuum cooling and then extracted, so the pollen results dried. The pollen humidity appear to be crucial for long-term storage. Pollen viability are evaluated comparing the germination of pollen with 10.2% of humidity and with 20.5%. The analysis was performed each year for 10 years: in 2003, the year of harvesting, the germinability was around 93% for both samples but in the subsequent year after storage at –18°C the dryer pollen maintain its germinability higher in comparison with the wet one. Germinability remain more than 85% up to 3 years when pollen has an humidity of 10.2% whereas germinability decrease rapidly if the pollen has an humidity of 20.5% (Fig. 3). Moreover germination energy was evaluated because a pollen with high germinability could have low germination energy (length of germination tube during the time) if there were stresses like exposure to high temperature during collecting or during pollination. The tube length was recorder each hour during germination at different temperature: 18°C, 24°C and 30°C. During pollen germination, the pollen tube length is higher if the germination occurs at lower temperature whereas at higher temperature the germination stops early and tube length is lower (Fig. 4). This observation suggest that the best condition for pollination is a temperature lower than 24°C.
3.2Evaluation of pollination equipments
The distribution machine by liquid pollen suspension (SpruzzaPollineTR) gave interesting results (95 g), in comparison with the free pollination (91 g) and with the manual method of pon-pon (97.4 g) when the application was done 2 days earlier than the dry pollination (Fig. 5). Even if the free pollinated fruit reach a good size, the effect of the artificial application is statistical appreciable. This observation indicate that the flower stage is fundamental for a good pollination. This aspect will be analyzed in the following experiment. Interesting to note that the same pollination system applied at the same time of the other equipment, when 90% of flowers were without petals, but with double pollen concentration, gave similar results: 93.2 g instead 88.1 g as with standard pollen concentration (Fig. 5). This result could be due to the fact that in the same small volume of liquid that remain on the stigma surface after its spraying there are more pollen grains than in the standard concentration. In the standard concentration the number of pollen grains that arrive or remain on the stigma surface are not enough to fertilize the majority of ovules. It means that the liquid is not a good carrier for the pollen at this flower phenological stage. The dry pollen application with the blower system (SoffiaPolline, Fig.1C) gave the best results (99.6 g, Fig. 5). For the three systems SpruzzaPollineTR, 2 days before dry pollination or with double pollen concentration, pon-pon and SoffiaPolline, the higher appreciated fruit size class 100–120 g was the most representative (34%, 27%, 35% and 36% respectively) and the unmarketable class (under 70 g) was drastically reduced (Fig. 6).
3.3Role of lycopodium in pollination
The fruit size obtained in the thesis pollinated with pollen-lycopodium mixture was lower than the thesis pollinated with pure pollen: average weight of 95 g and 98 g with the pollen-lycopodium mixture using SoffiaPolline and Speedy, respectively, and 107 g with pure pollen (Fig. 5). These results indicate that the presence of this inert may adversely affect fertilization, even if the fruit weight is much higher than the natural free pollination (74 g) regardless of the distribution system. The low pollination rate observed using the pollen-lycopodium mix with Speedy machine (Fig. 1A) in the previous experiment (Fig. 5) do not depend to the machine: the addition of lycopodium to the SoffiaPolline gave similar results (Fig. 7). The hypothesis is that lycopodium could adversely influence the pollination with its drying effect on pistils and/or a physical interference with pollen on the stigma surface.
3.4Influence of flower phenological stage on pollination efficency
The influence of flower age on pollination efficiency was tested using the two most effective pollination equipments found in the previous experiments, namely SoffiaPolline (dry pollen preparation) and SpruzzaPollineTR (wet pollen preparation).
Concerning the dry pollen application (SoffiaPolline), the highest fruit size (103 g) was obtained by flowers pollinated at petal fall stage (Fig. 8), just before pistils senescence when the stigma surface change from white to brown color. Closed flowers result pollinated, even if with a not good size (the minimum size for commercialization is 70 g) because there are pollen in the air and the experiment was conducted in a commercial orchard. Anyway the effect of pollination was always statistical significant respect to the untreated control. Concerning wet pollen application (SpruzzaPollineTR), the highest efficacy (98 g) was obtained by spraying flowers at early petal fall (Fig. 9).
A possible explanation of these results resides in the abundance of stigmatic exudates that may contribute both to pollen attachment to the stigma and to pollen germination. The physical adhesion of the dry pollen grains to the stigma surface is increased if there is the pistil exudate and vice versa dry pollen can’t stick to the stigma if its surface is dry. In this view, the highest exudation of stigmatic secretion, that can be observed at petal fall, may increase the efficacy of dry pollination by increasing the number of pollen grains attached to the stigma, while it may reduce the pollination efficacy of wet formulation since the excess of liquid may reduce pollen-stigma adhesion. In this view, the wet pollen application with a double pollen concentration (Fig. 5) could mitigate this effect of scarce adhesion: anyway, this strategy was not recommendable because the huge amount of pollen need for pollination.
The bigger fruit size observed with dry pollination could be related to higher number of receptive ovules in the flower that appear to be maximum at the petals fall stage, just before pistils senescence. Anyway, further experiments conducted at histological level are necessary to study the ovary maturation and the pollen fertilization in the different flowering stages.
4Conclusion
A good pollination is fundamental for the production of fruit with high weight and thus with high marketable quality: the artificial pollination can increase the production up to 30% comparing with untreated flowers (Figs. 5 to 9). The highest pollen quality was obtained when the pollen was picked up from the collecting machine frequently during the day (about every hour), to avoid any stresses, and stored at 4°C for no more than 7 days (Galimberti, personal communication). Pollen can be stored at –18°C up to 3 years, better with low humidity (Fig. 3). The dry pollination must be made with pure pollen at the end of flowering (Fig. 8) before the pistils became brown (petals fall stage) when the stigma exudate is maximum. In practical situation the pollination must be conducted with environmental high humidity (early morning) when the pistil exudate is abundant and the temperature is low, usually in two steps in order to follow the scalarity of the flowering on the plants. Analogously the liquid pollination must be made not later than early petal fall stage (Fig. 9).
Acknowledgments
We also thank for their cooperation Andrea Bonetti, Laura Asteggiano, Luca Giordani, Luca Nari, Alessandro Bevilacqua, Giovanni Rigo and Lorenzo Tacconi.
References
[1] | Hopping ME , Simpson LM . Supplementary pollination of tree fruit. New Zealand Journal of Agricultural Research. (1982) ;25: :245–250. |
[2] | Costa G , Testolin R , Vizzotto G . Kiwifruit pollination: An unbiased estimate of wind and bee contribution. New Zealand Journal of Crop and Horticultural Science. (1993) ;21: (2):189–195. |
[3] | Testolin R , Vizzotto G , Costa G . Kiwifruit pollination by wind and insects in Italy. New Zealand Journal of Crop and Horticultural Science. (1991) ;19: :381–384. |
[4] | Free JB . Insect pollination of crops Second edition Academic Press, London, UK, (1993) . |
[5] | Goodwin RM . Zespri Innovation Kiwifruit Pollination Manual. Zespri Innovation Company Limited & The Horticulture and Food Research Institute of New Zealand Limited, (2000) . |
[6] | Underwood R . Pollination of kiwifruit. New Zealand Kiwifruit Journal. (2001) )44–6. |
[7] | Bomben C , Malossini C , Cipriani O , Testolin R . Long term storage of kiwifruit pollen. Proceedings of 4th International Kiwifruit Symposium, Acta Horticulture. ((1999) ) 498, ISHS, pp. 105–108. |
[8] | Hecker RJ , McClintock M . Sugarbeet Pollen Germination in Vitro Journal of Sugar Beet Research. (1988) ;25: (1):42–54. |
Figures and Tables
Fig.1
The machines used in the comparative test of pollination-systems. A. 12 V dry distributor pollen-lycopodium (45 –55%) mix model “Speedy” (Dell’Agata, Forlí, Italy) (speed 5–7 h/ha); B. liquid distributor 12 V diaphragm pump model “Professional membrana” (Ravello, Cuneo, Italy) (4 h/ha); C. blower dry distributor of pure pollen model “SoffiaPolline” (Biotac, Verona, Italy) (1 h/ha); D. liquid distributor tractor machine model “SpruzzaPollineTR” (Gerbaudo, Cuneo, Italy), with fogger type nozzles (2 h/ha); E manual pollination “pon-pon” (25 h/ha); F tractor fans model “Ventole” (Romani, Verona, Italy) (0,5 h/ha).
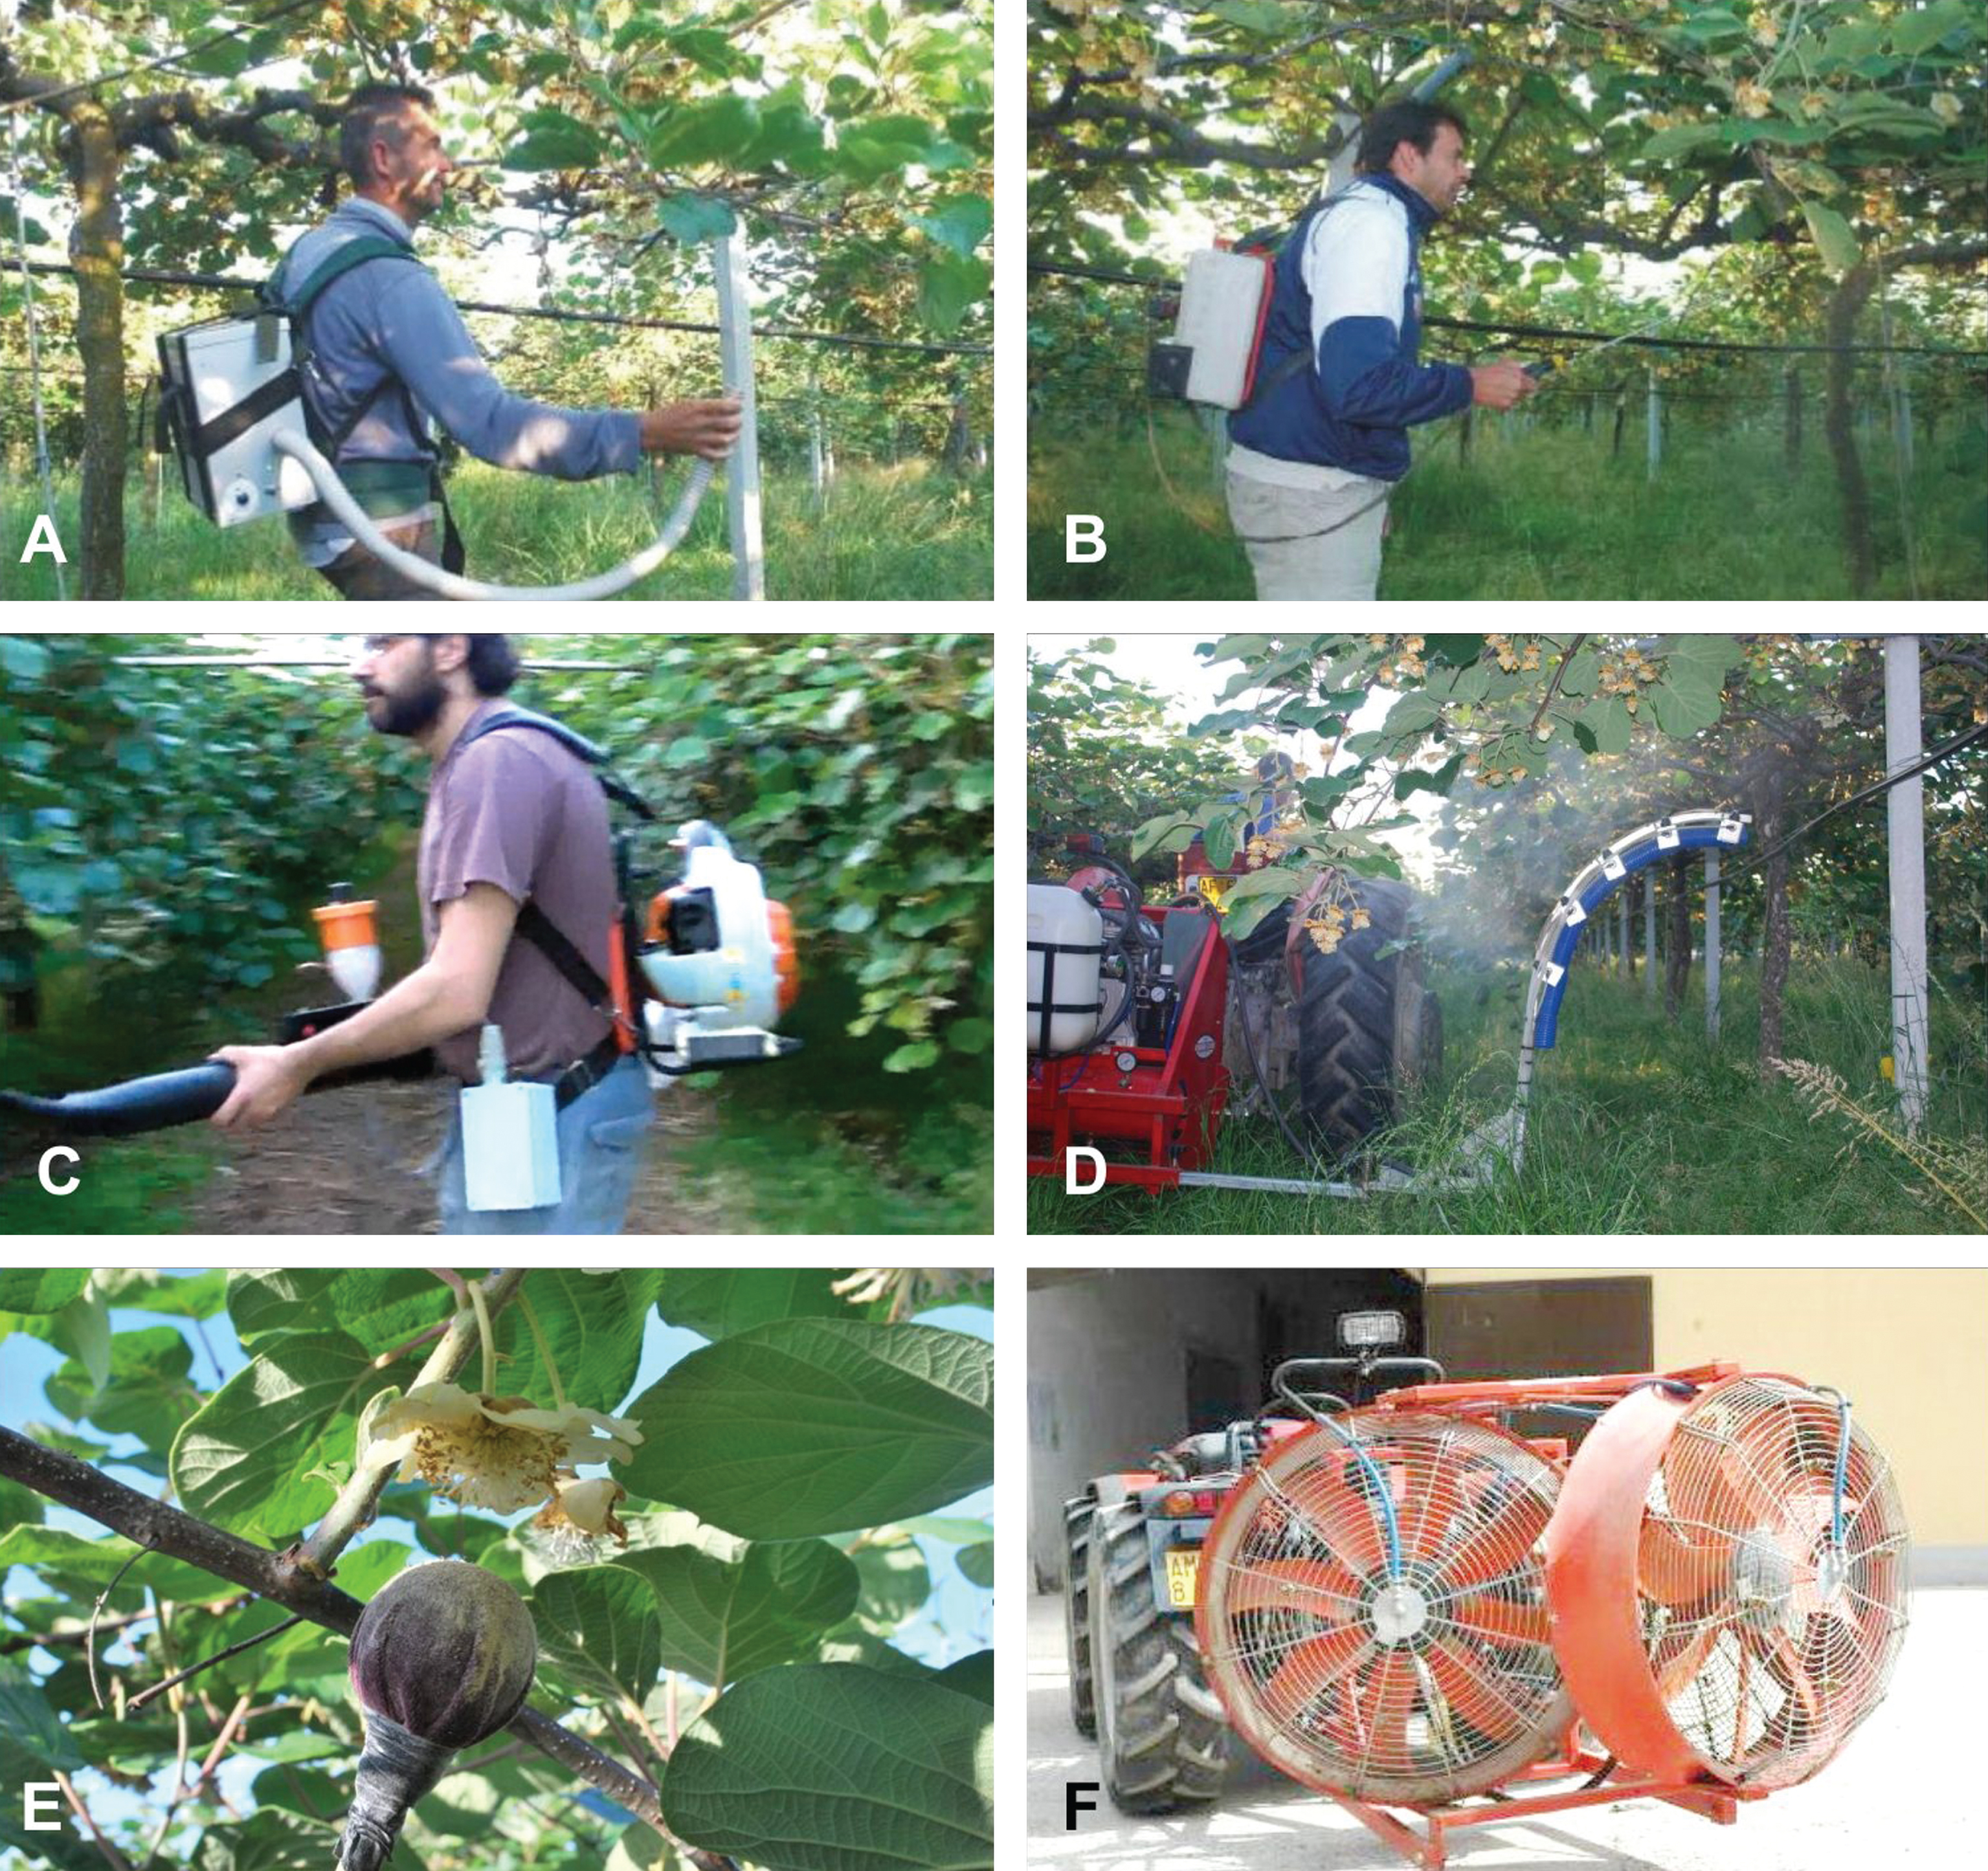
Fig.2
The marked flower at the time of pollination, with colored ribbon, allow to evaluate the fruit size according to the original flowering stage during pollination. A closed flower; B white petals; C ocher petals; D early petals fall; E petals fall.
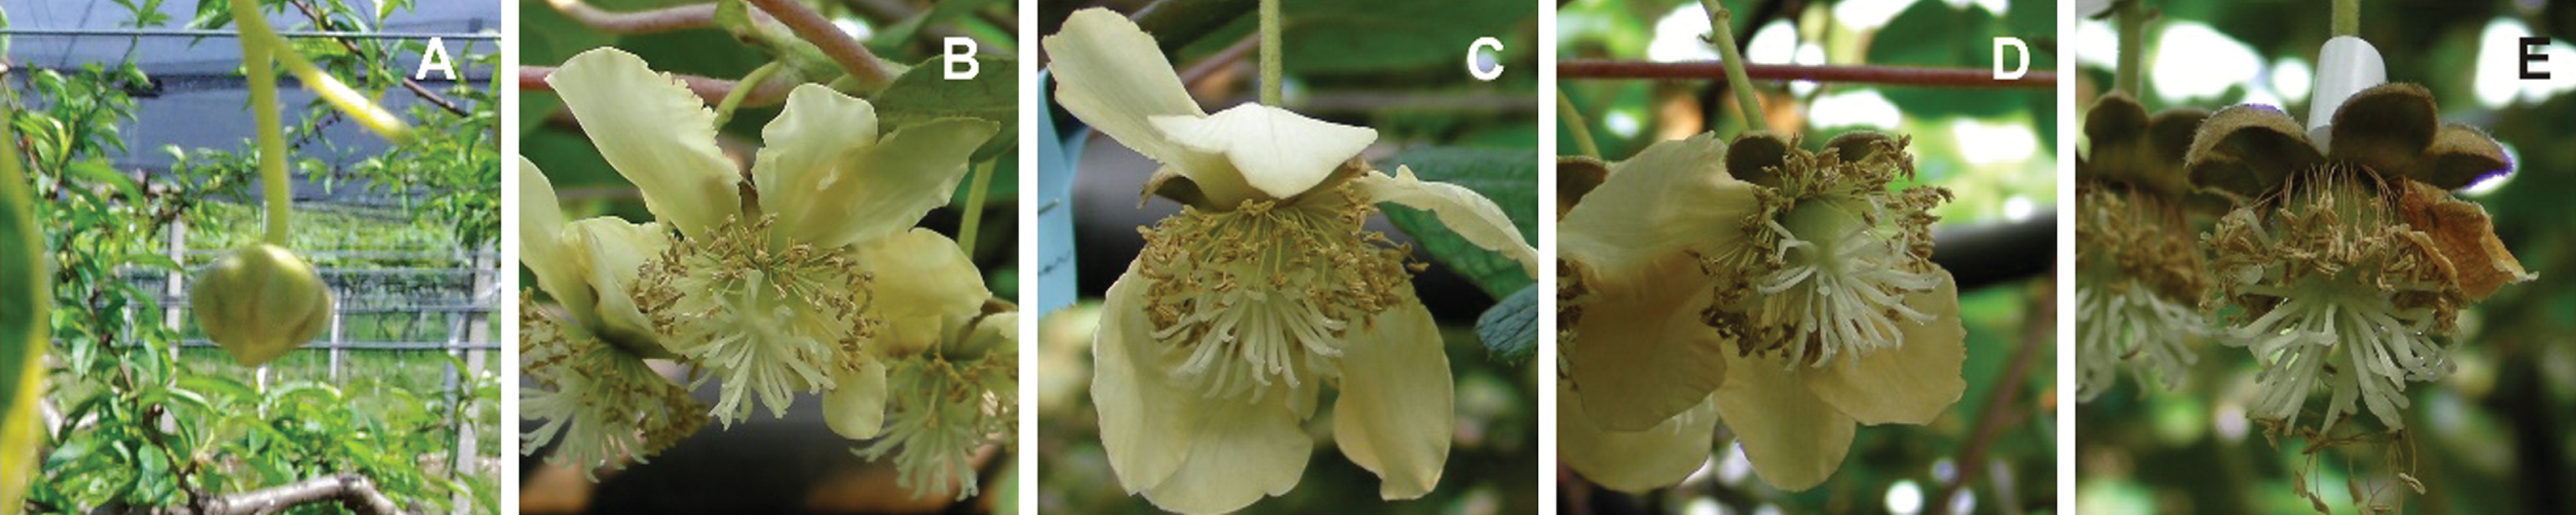
Fig.3
Germinability of two sample of kiwifruit pollen with different humidity, preserved for several years at –18°C. The analysis were conducted on the same sample each year. Error bar was reported for each analysis point.
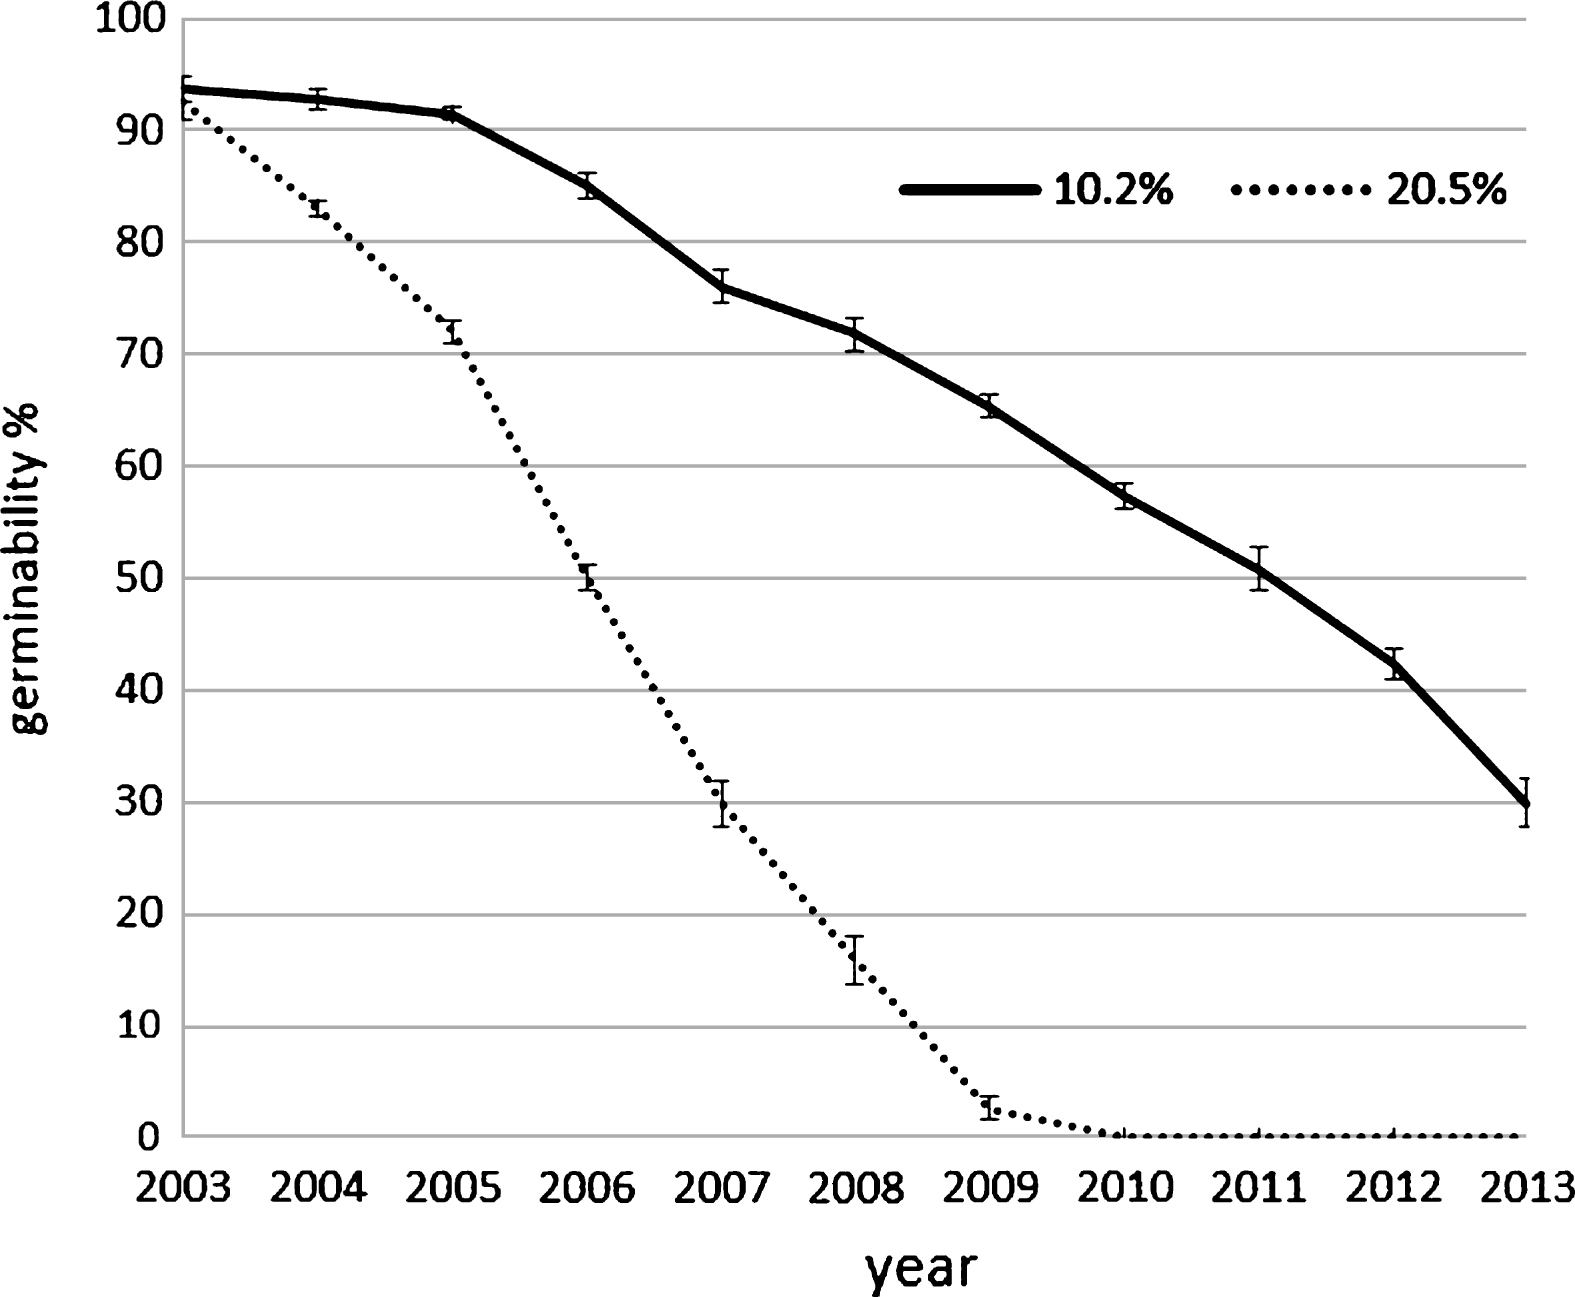
Fig.4
Elongation of pollen tube at different incubation temperatures. Error bar was reported for each measure point.
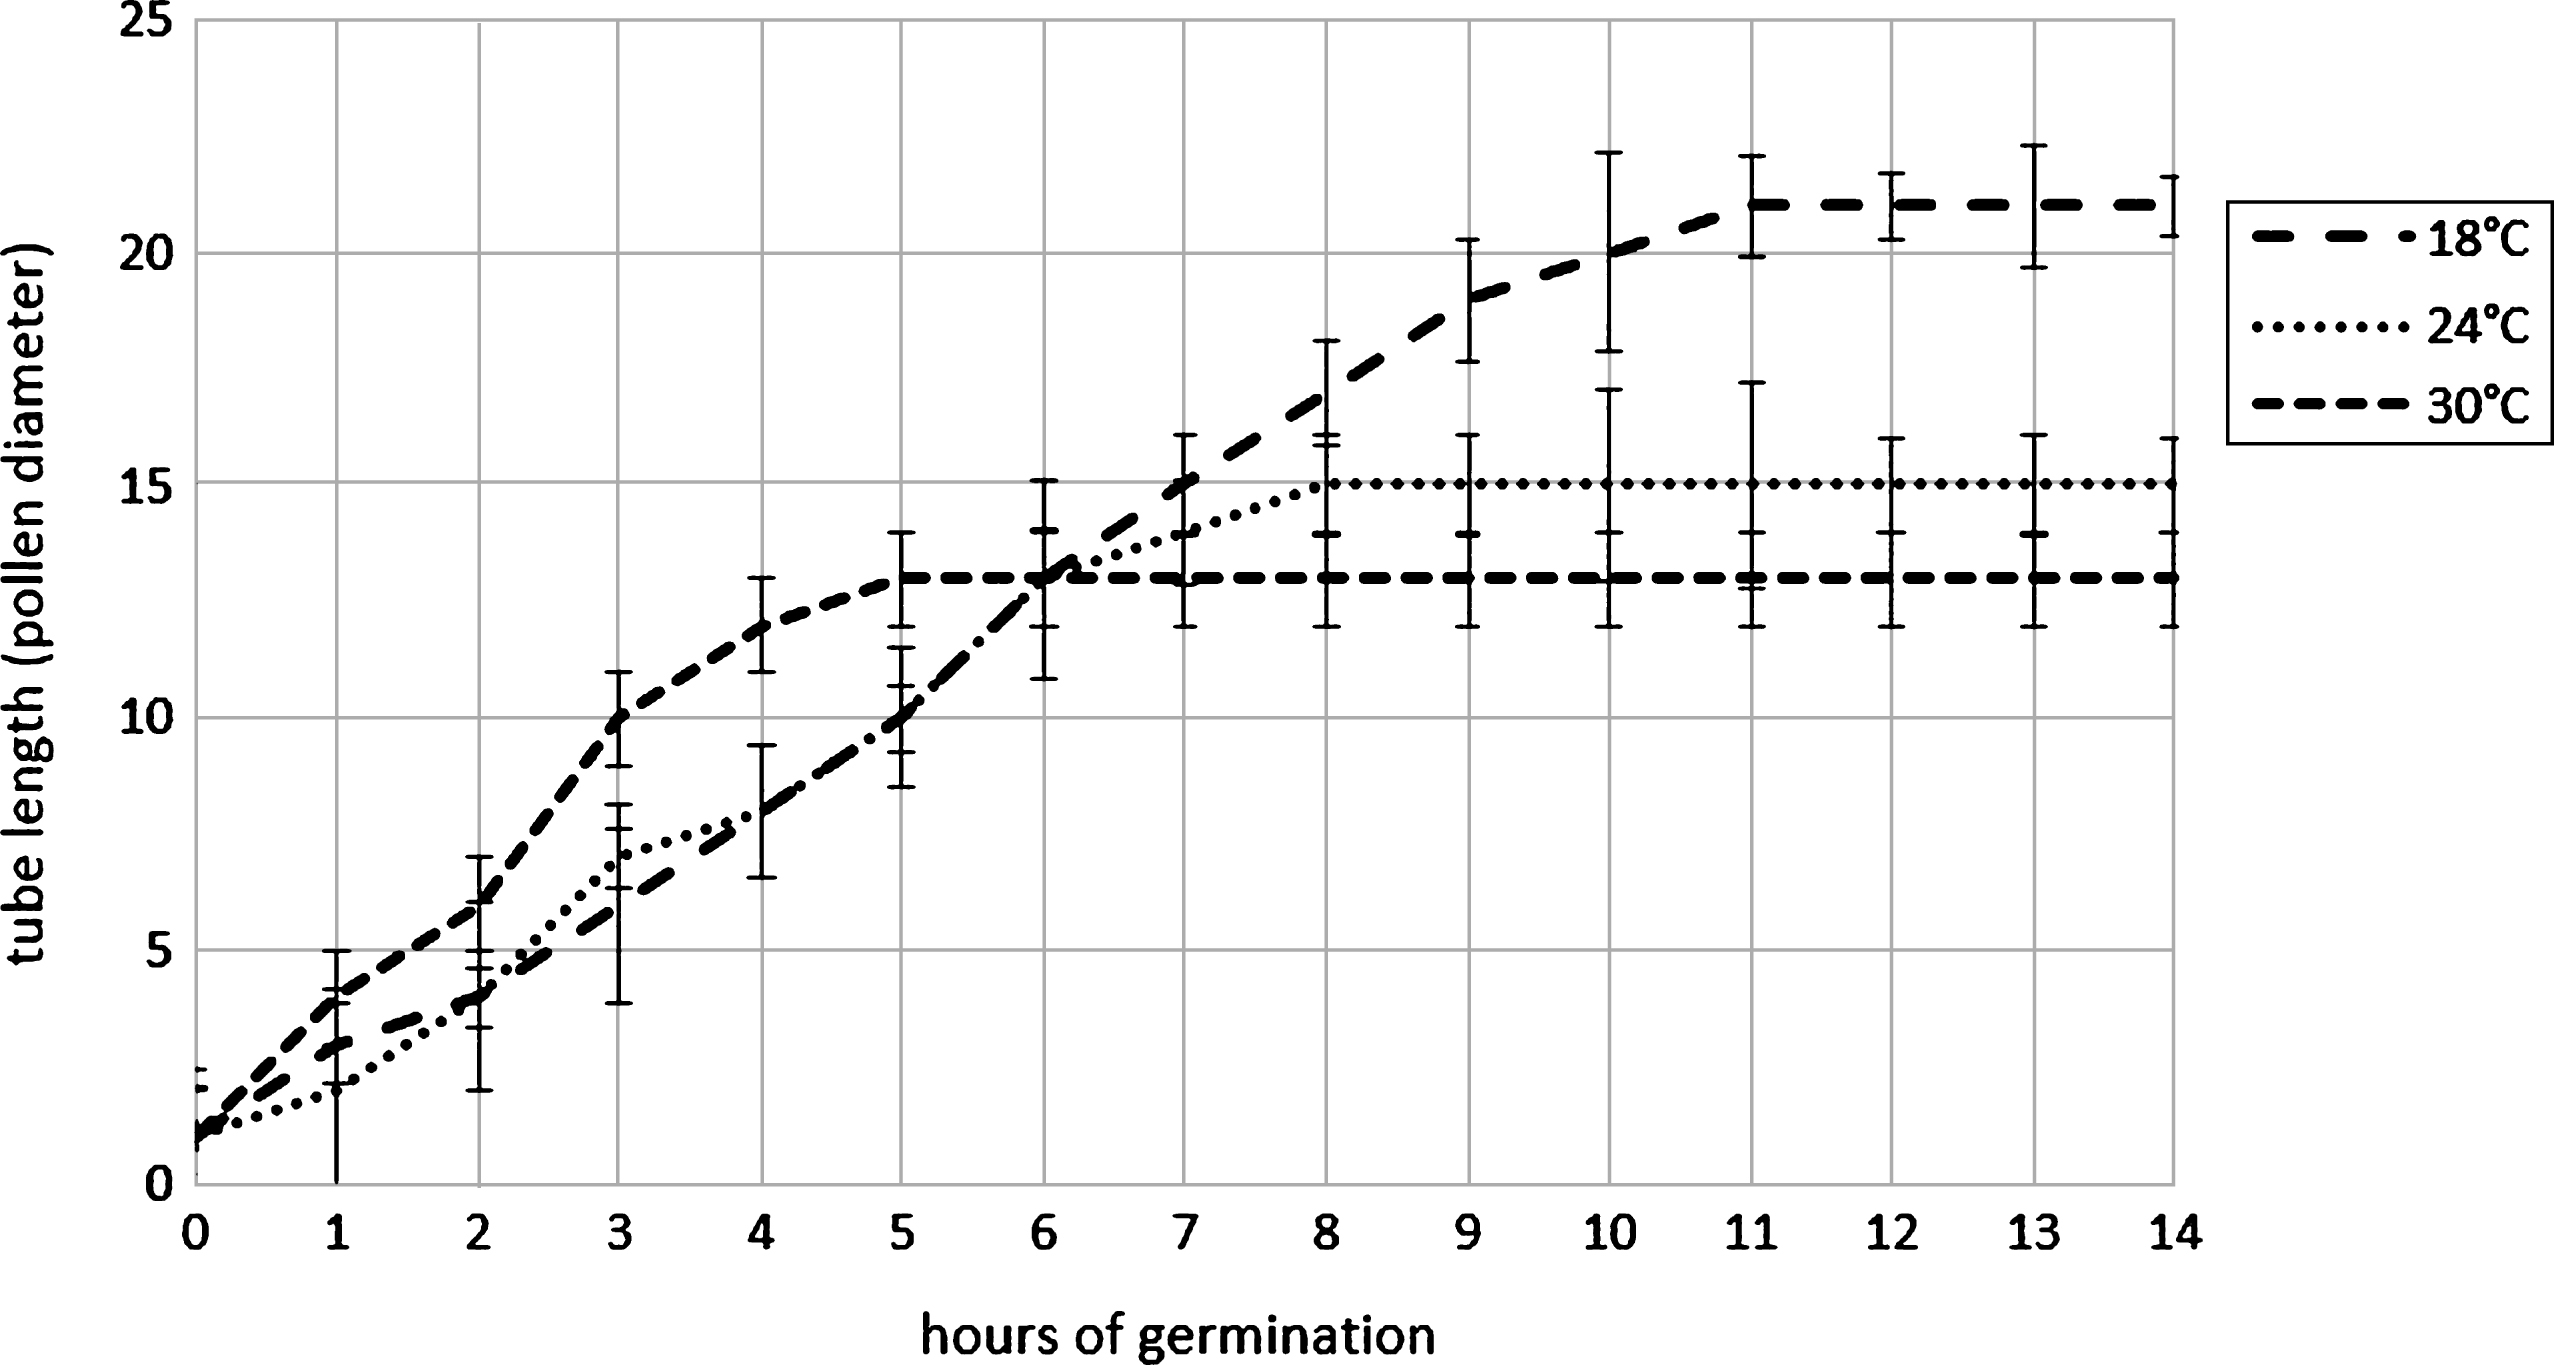
Fig.5
Average fruit weight in relation to the different pollination machines, the control was the natural field pollination (free pollination).
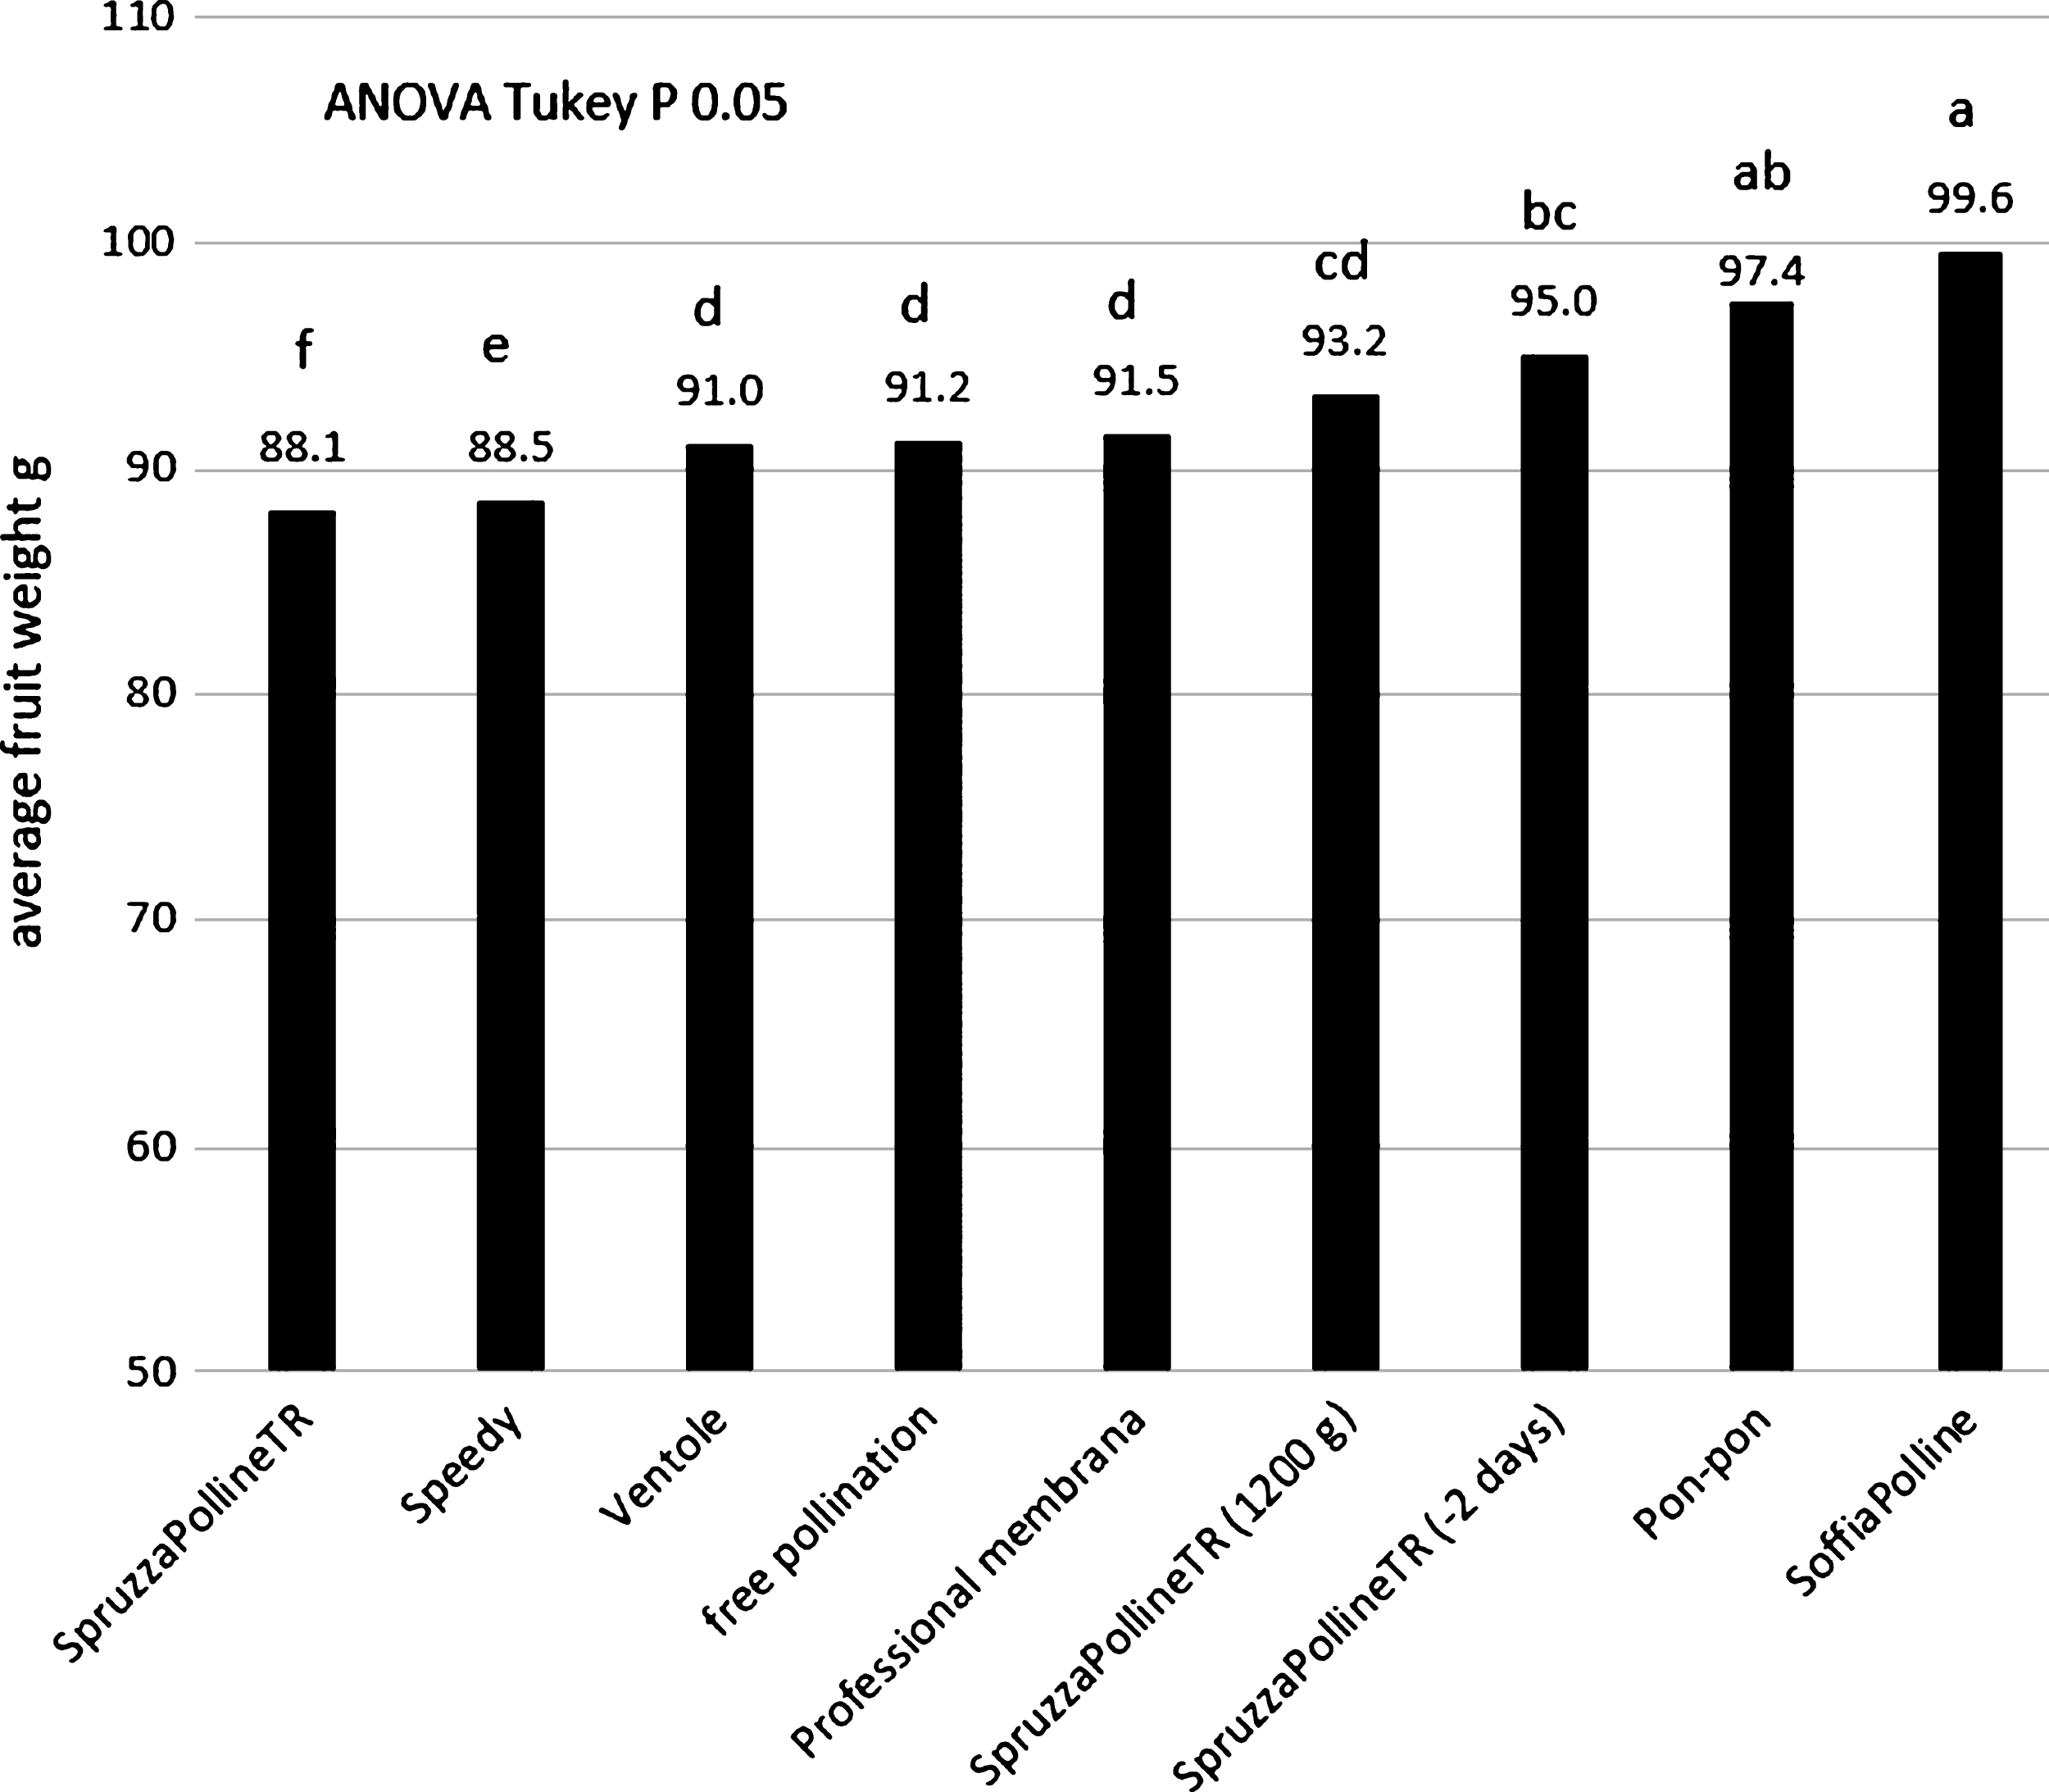
Fig.6
Weight distribution of the fruit sampled in the comparative field trial.
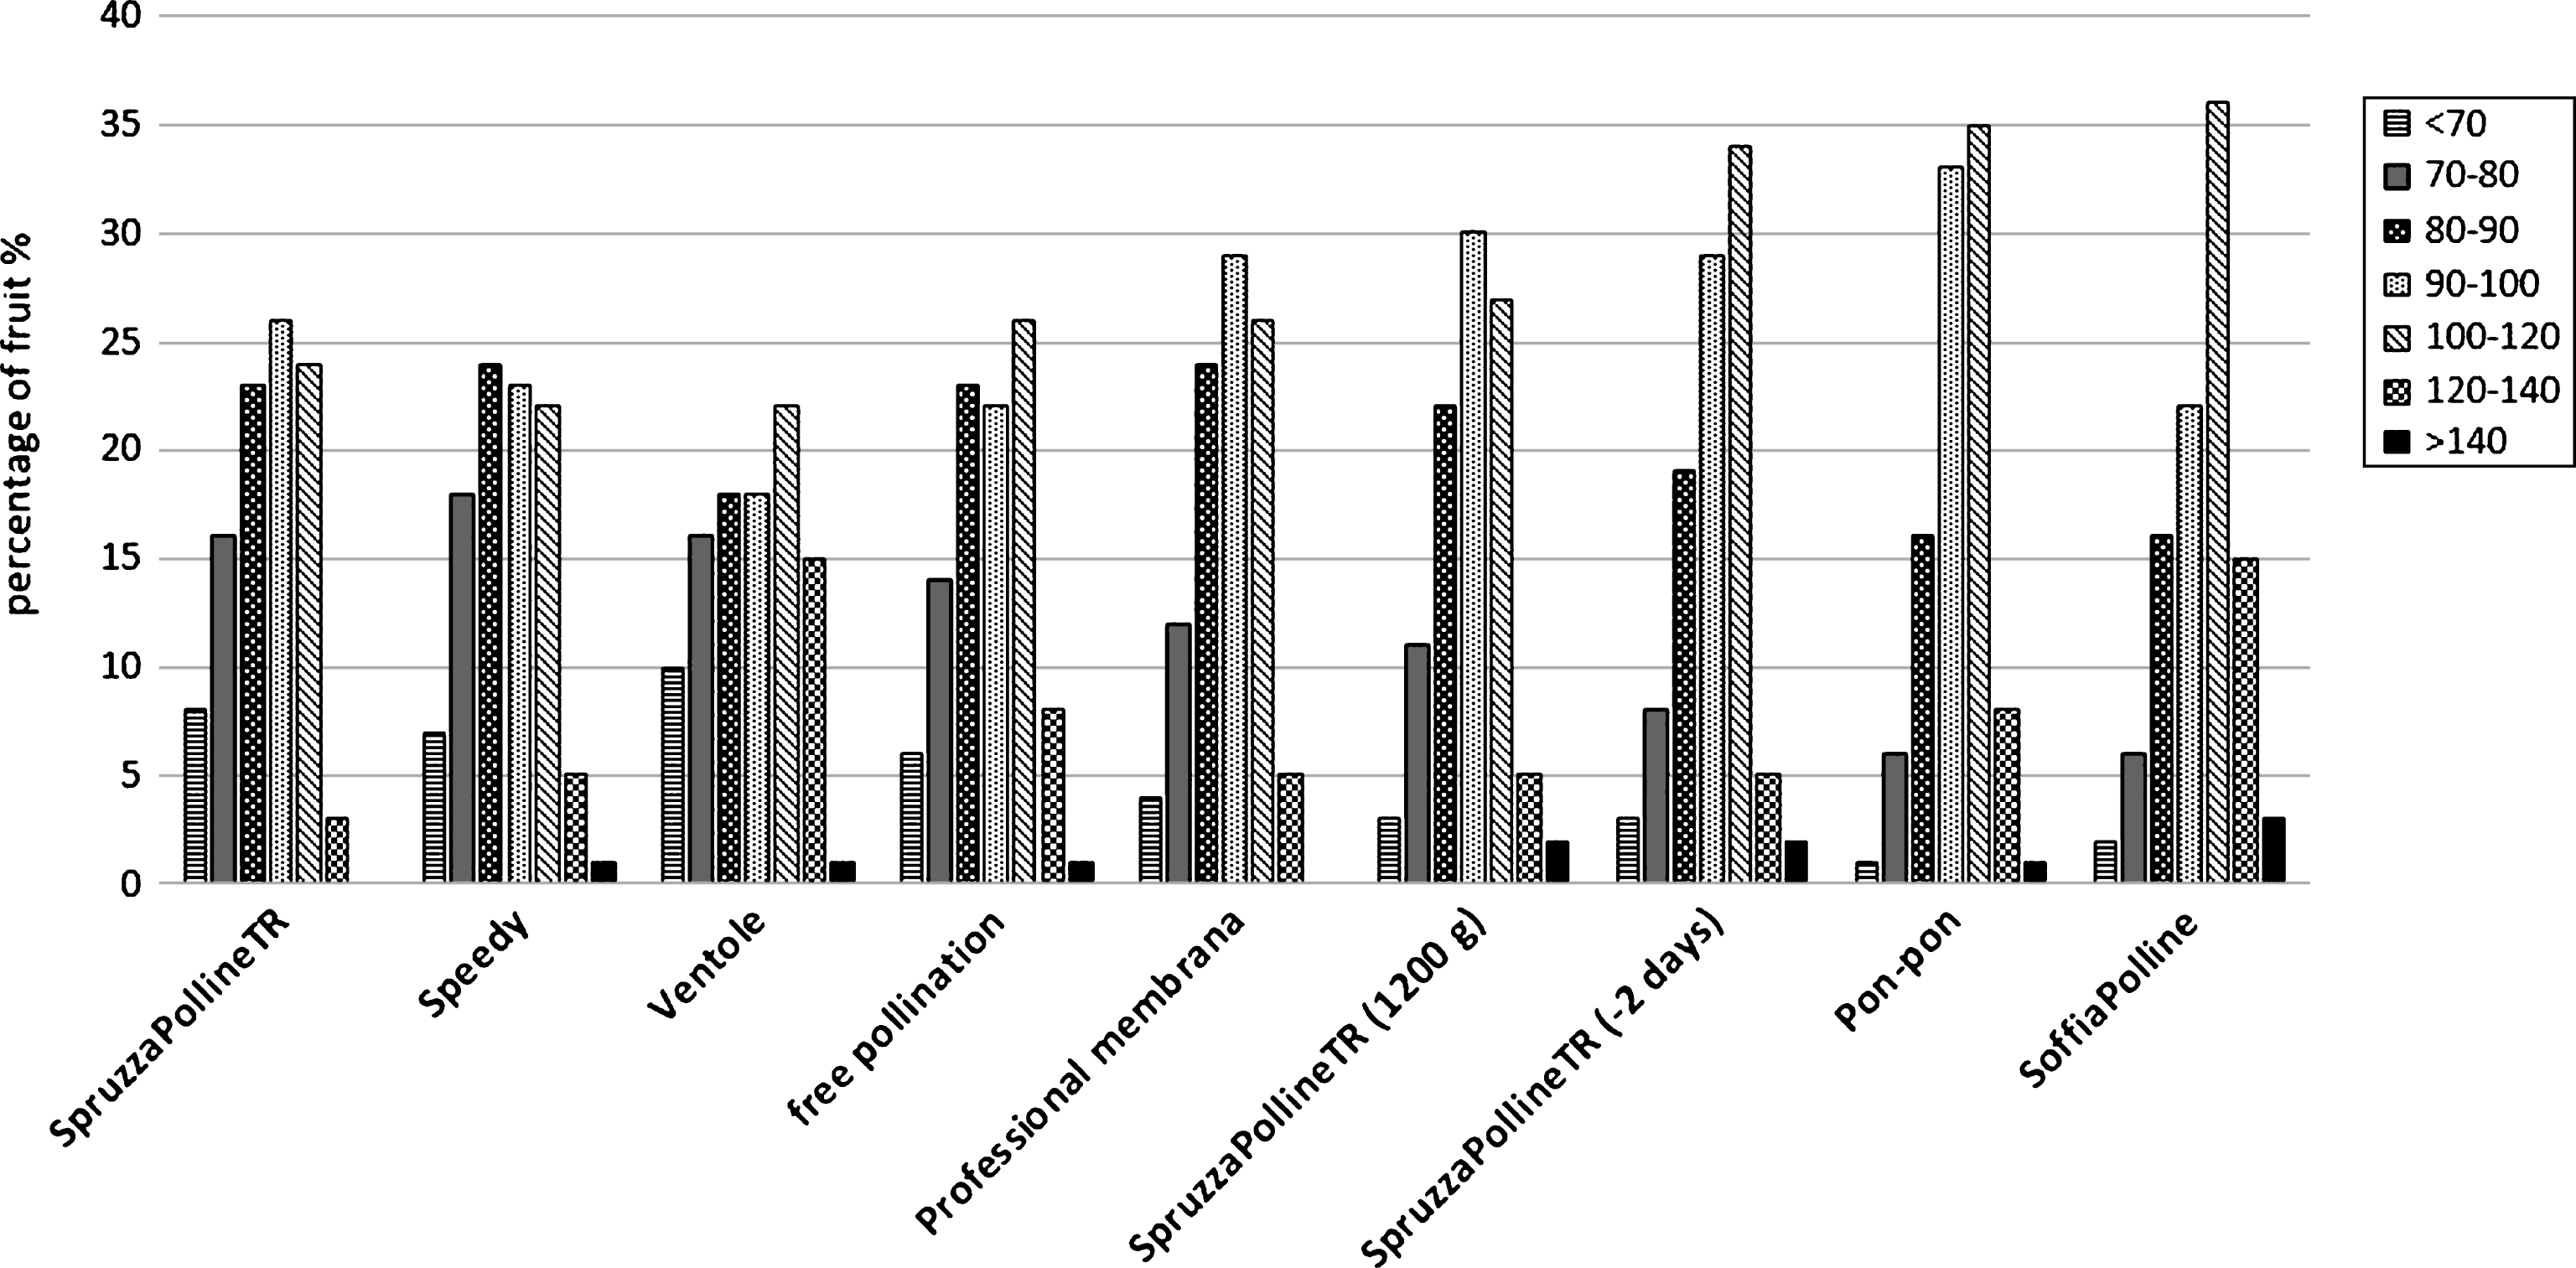
Fig.7
Average weight of the fruit in the experimental where were compared pollination with pure kiwifruit pollen and the mix with lycopodium, by using two pollination machines.
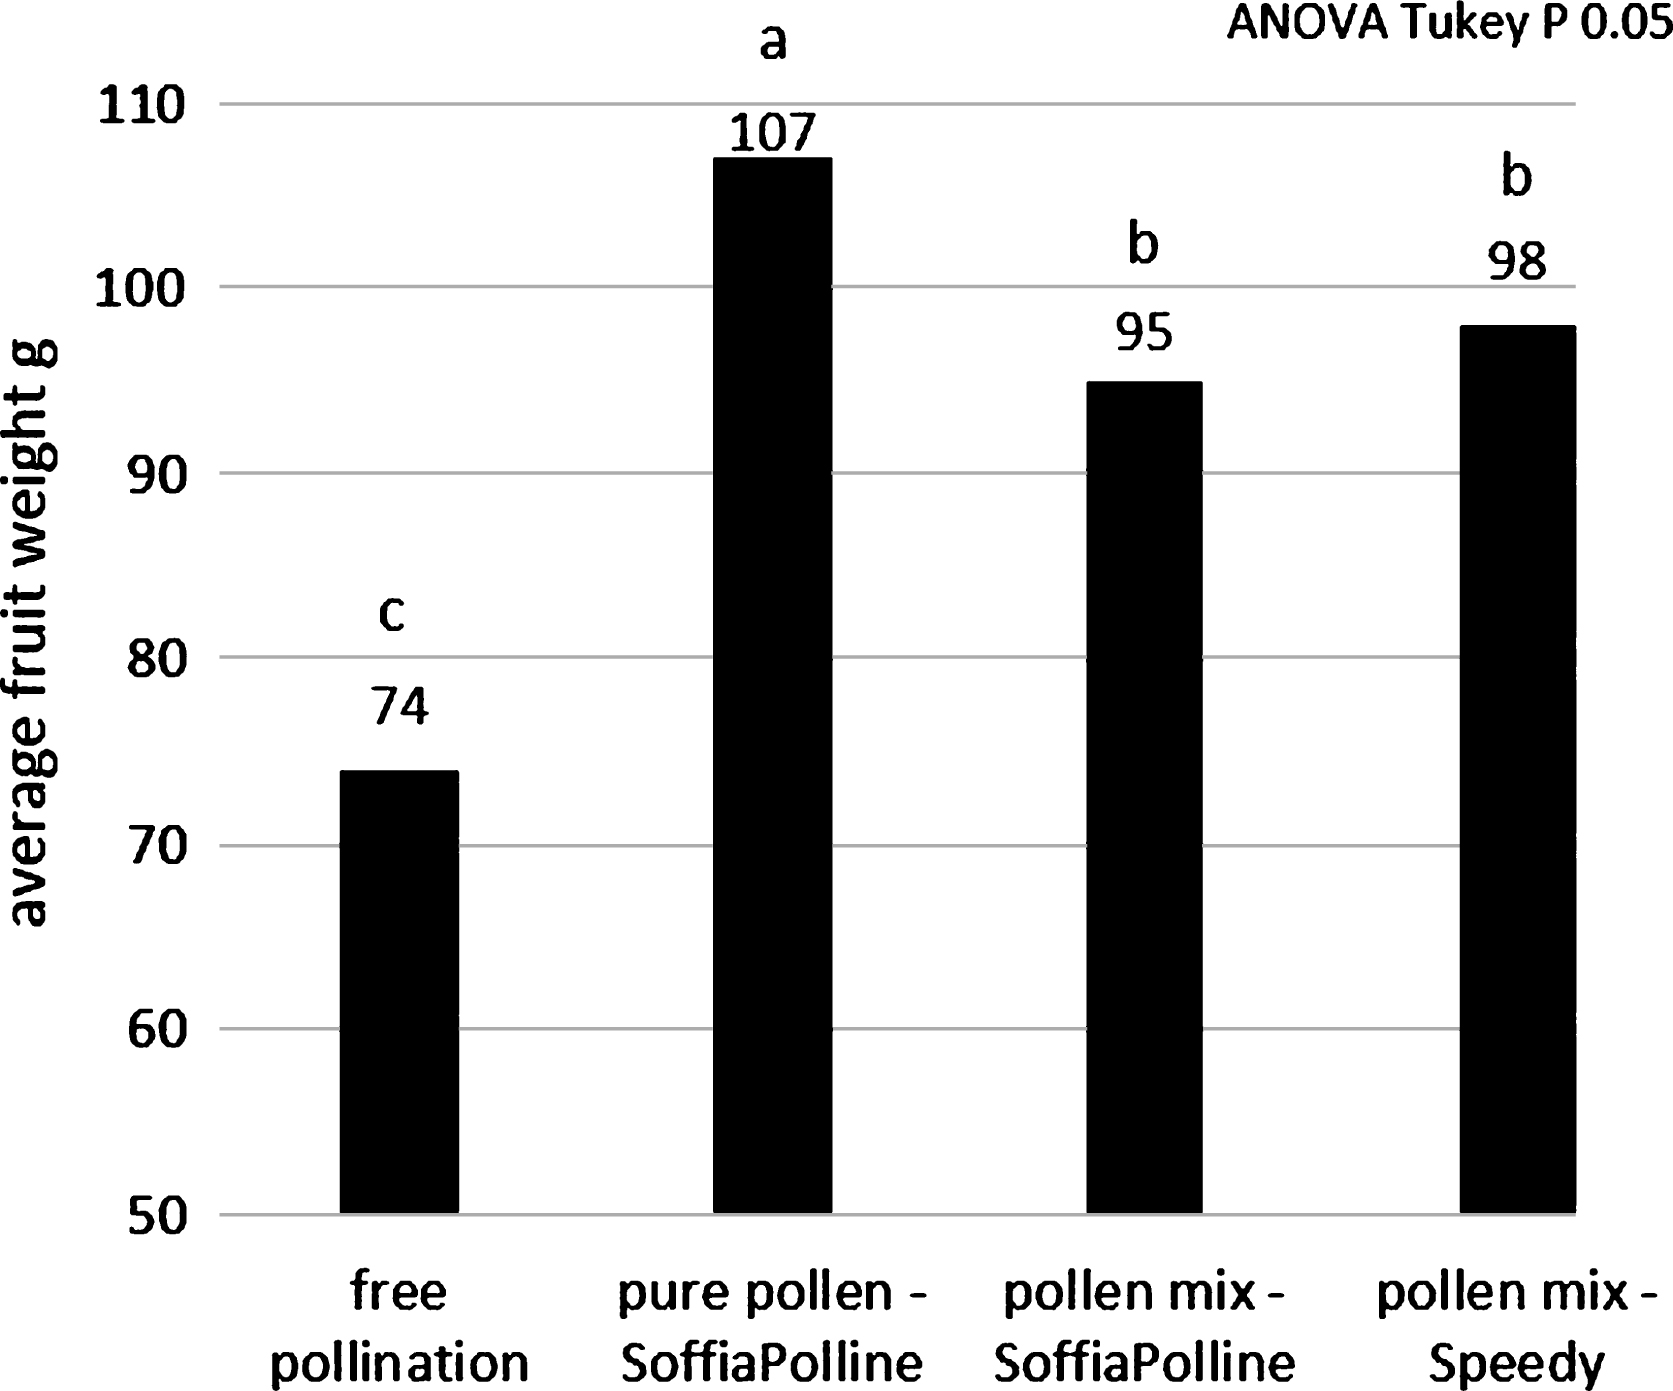
Fig.8
Average weights of the fruit pollinated by dry pollination system, clustered according their flowering stage during pollination.
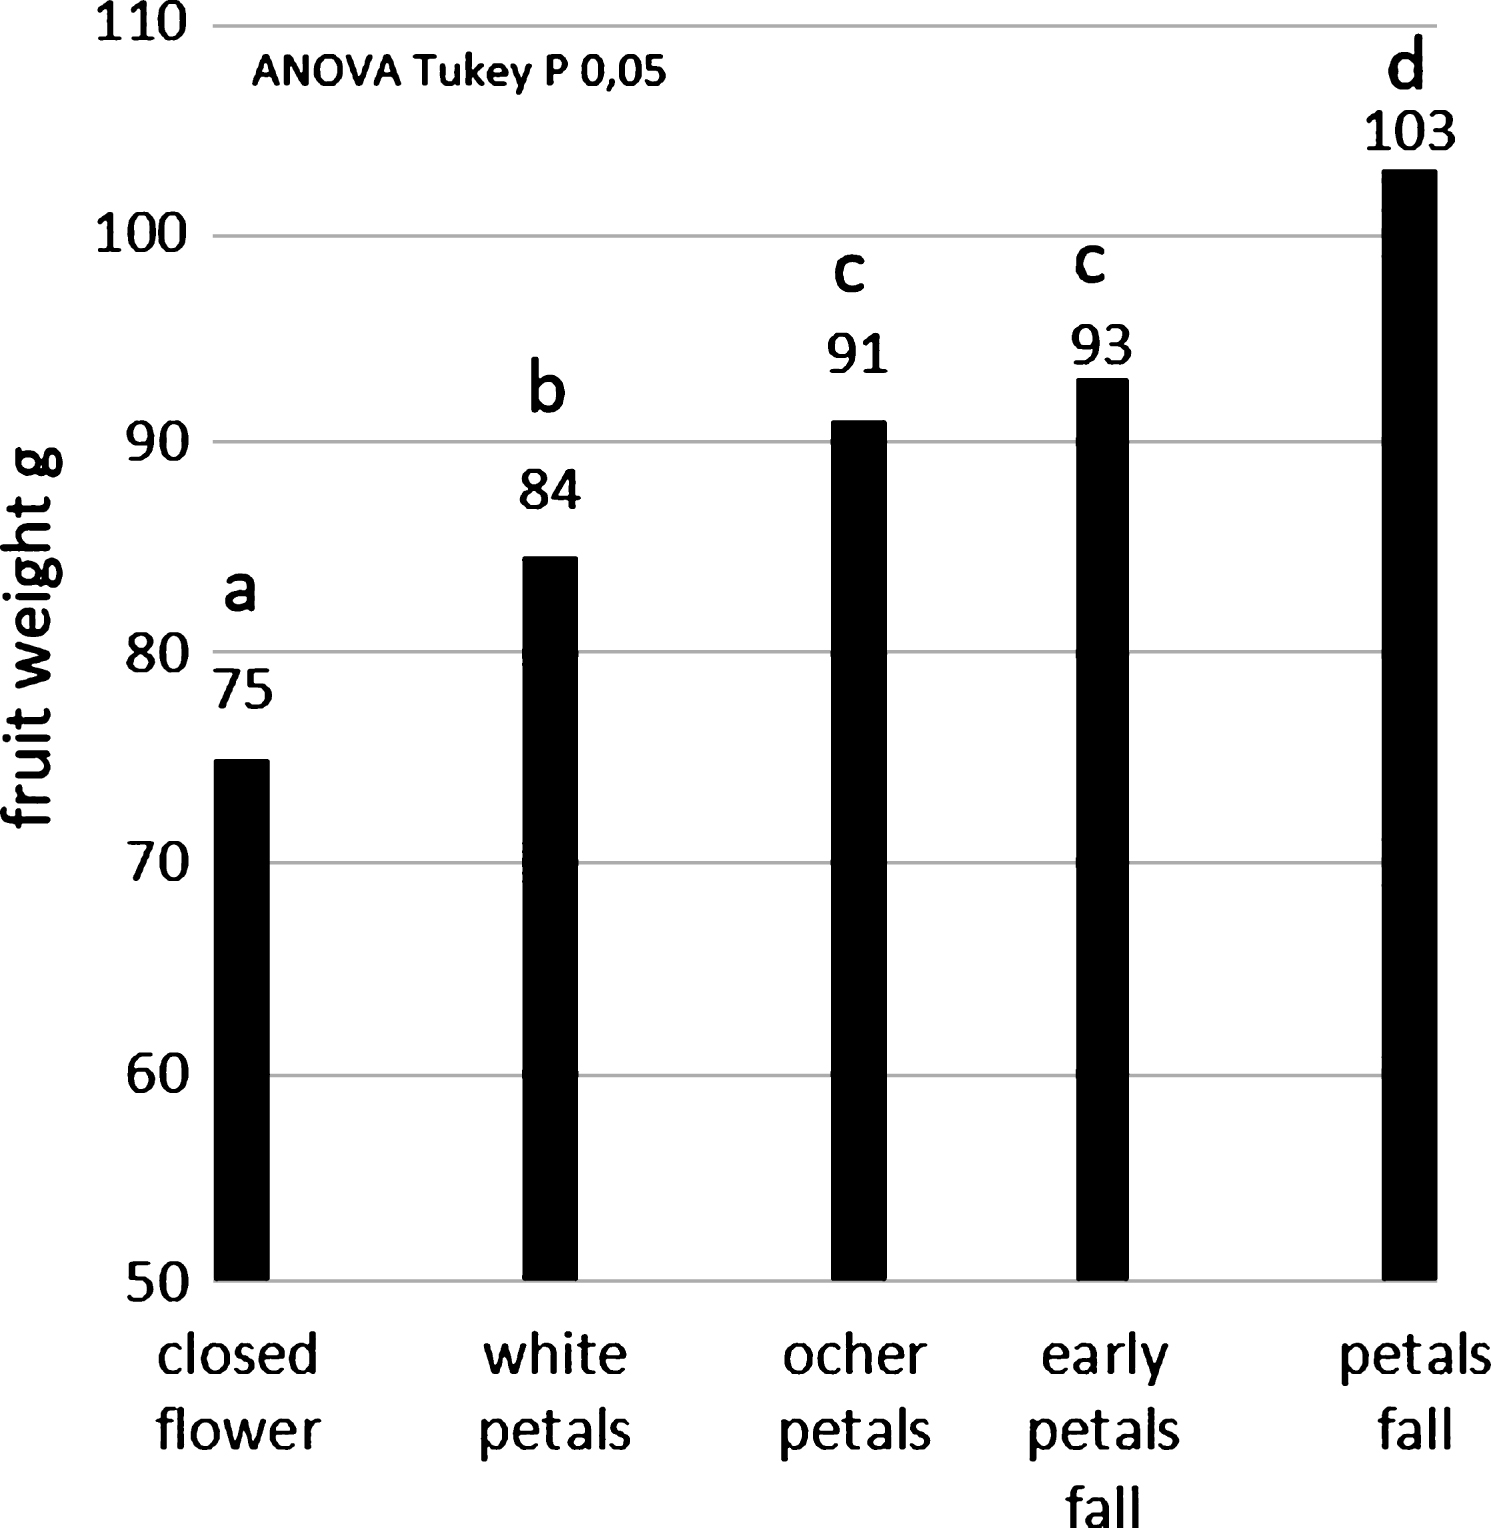
Fig.9
Average weights of the fruit pollinated by liquid pollination system, clustered according their flowering stage during pollination.
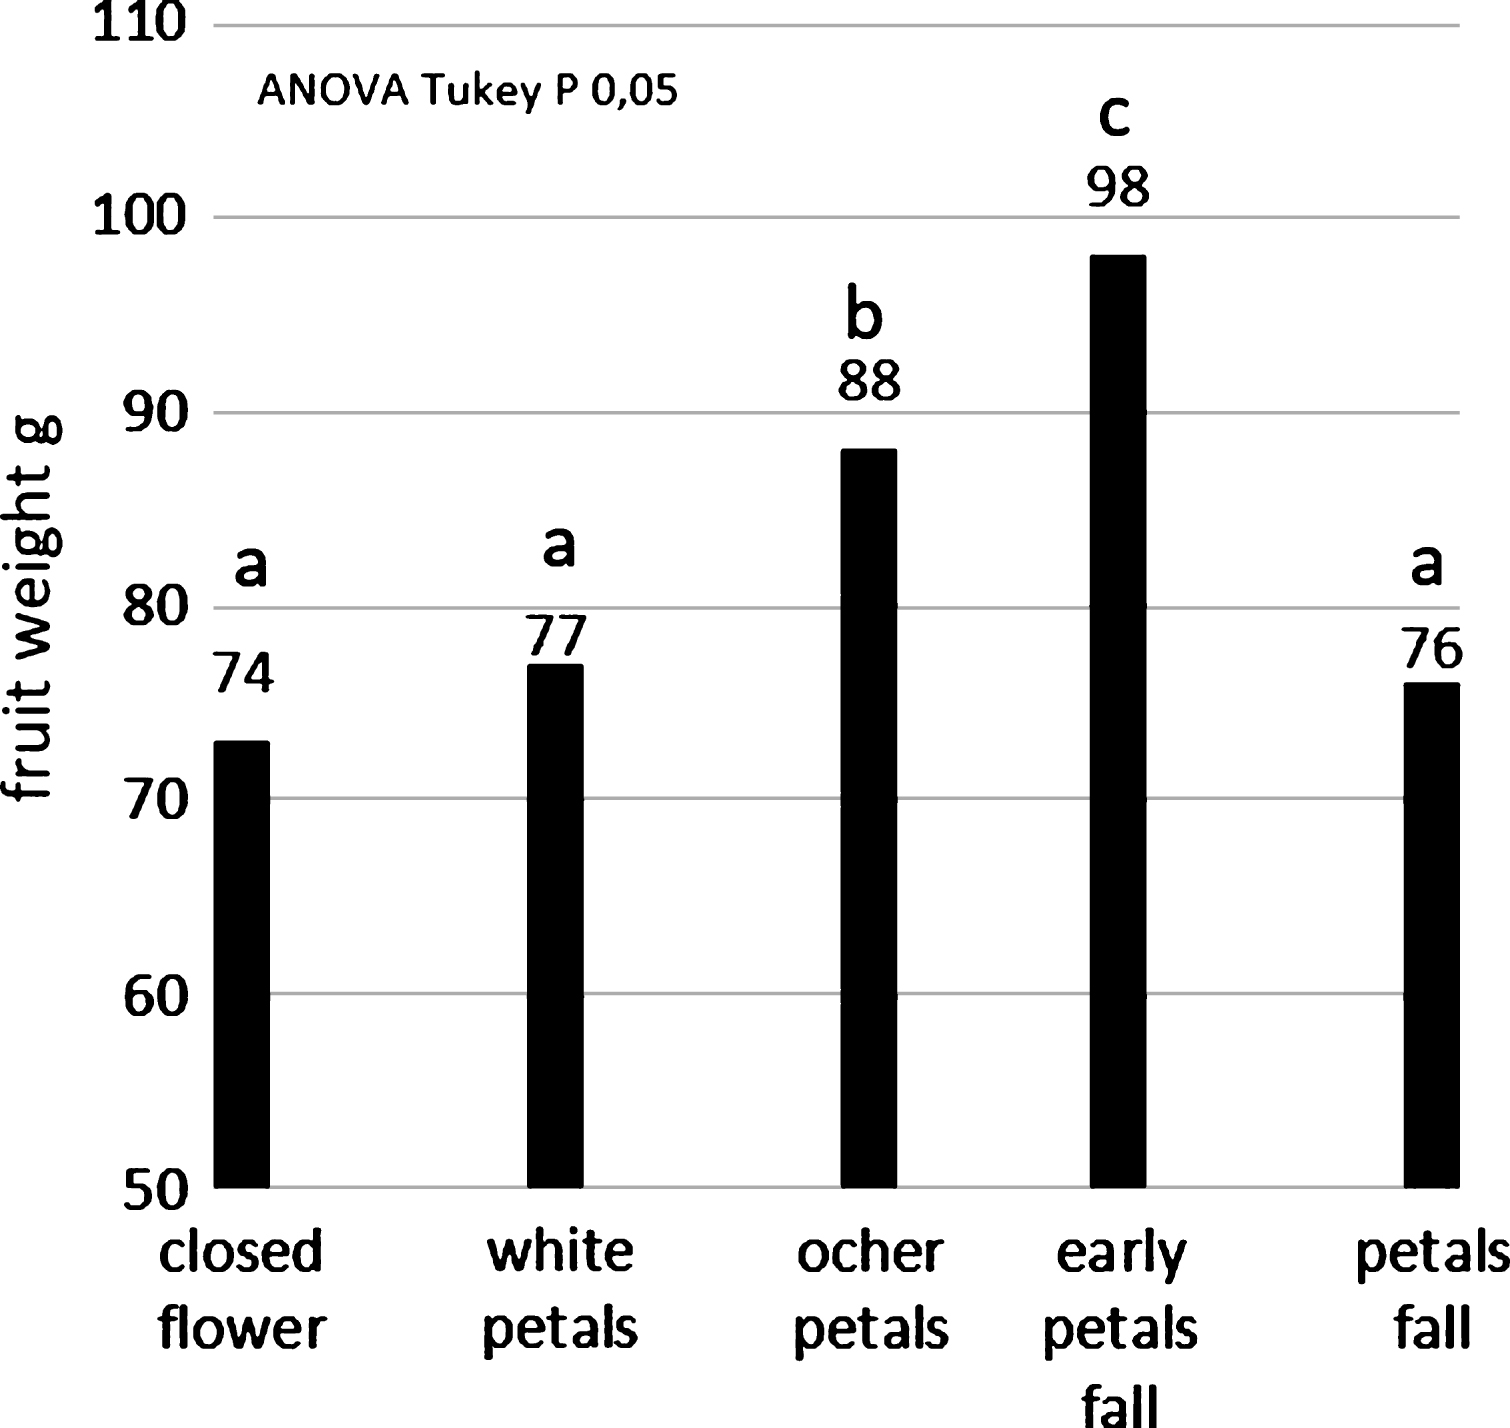
Table 1
Pollen humidity during collection in two years (20th May 2003 and 23th May 2004) with different environmental conditions (in the same orchard in Verona, data were recorded by WatchDog Data Loggers in the orchard during the collection of pollen from 10 am to 5 pm)
| Collecting system | Filter 2003 | Cyclone 2003 | Filter 2004 | Cyclone 2004 |
| Pollen humidity % | 9.8±0.5 | 20.5±0.4 | 10.2±0.5 | 16.2±0.4 |
| average air T°C | 17.6 | 22.9 | ||
| average air RH% | 85.6 | 63.9 | ||
| minimum air RH% | 55.3 | 25.9 |


