
Development of obesity is reduced in high-fat fed mice fed whole raspberries, raspberry juice concentrate, and a combination of the raspberry phytochemicals ellagic acid and raspberry ketone
Abstract
BACKGROUND: A significant body of research demonstrates that intake of berries and berry phytochemicals favorably influence metabolism via a number of different biological mechanisms. However, raspberries and select phytochemicals present in raspberries have been less studied than several other berry fruits.
OBJECTIVE: The current study tested the relative effect of whole raspberry products or raspberry phytochemicals using the C57BL/6J mouse fed a high-fat, high-sucrose diet as a model for the obesigenic Western diet. The development of obesity and related metabolic complications were measured.
METHODS: C57BL/6J mice were fed experimental diets for ten weeks. Diets were formulated to include a typical dietary level of whole raspberry food products, or for the case of ellagic acid (EA) and raspberry ketone (RK), levels that could be reasonably achieved with typical dietary supplement use. In week nine, a glucose tolerance test was conducted. After ten weeks, animals were sacrificed, serum collected, and liver tissue saved for histology and lipid accumulation measurements.
RESULTS: Addition of raspberry food products and phytochemicals to high-fat diet reduced body weight gain significantly when raspberry juice and puree concentrates (RJC and RPC), and the EA+RK combination were added. Food efficiency values reflected these weight changes, with the same three groups having food efficiencies similar to normal-weighted low-fat fed mice. Serum insulin and resistin levels were measured and resistin levels were reduced in the two groups fed high fat diets with RPC or RJC added. A histological evaluation of liver tissue was completed and some differences were impacted by diet.
CONCLUSIONS: When added to a high-fat diet, raspberry juice and puree concentrates and the combination of EA+RK decreased weight gain and food efficiency obesity associated with consumption of the obesigenic high-fat, high-calorie diet. Future studies are required to determine mechanisms that may be responsible for these changes.
1Introduction
Obesity and associated metabolic complications are a serious public health problem. The incidence of obesity and diabetes has been increasing at epidemic rates for several decades, and may still be increasing [1]. According to NHANES, in 2012 approximately 36% of Americans were obese [2]. Obesity often precedes and accelerates the development of diabetes, hypertension, CVD, metabolic syndrome, and dyslipidemia [3]. Obesity is primarily caused by excessive energy intake resulting in excess fat accumulation in adipose tissue, where it intended to be stored, and in other tissues in an inappropriate fashion, such as liver and muscle. Increased fat deposition in tissues can result in loss of function and dysregulation of energy utilization of those tissues [4].
Attempts to find a cure for obesity, diabetes, and associated metabolic conditions have been studied for decades; however very little progress, aside from prescribing dietary and lifestyle changes, has been made [1, 5, 6].
Some diet-based advances have been made in reducing some of the risk factors of obesity-related diseases. Some research has recently focused on the potential of certain phytochemicals found in fruits and vegetables to promote anti-obesity effects and disease prevention [7]. The aim of the present study is to investigate the potential of raspberry products and selected raspberry phytochemicals to ameliorate the development of obesity and related metabolic complications induced by the consumption of a high-energy, high-fat diet in a rodent model. The mouse model used herein is the high-fat (HF)-fed C57BL/6J mouse [8]. When presented with an energy-dense Western-style diet, this strain overconsumes, becomes obese and develops other metabolic complications including loss of normal glucose control and fatty liver.
Many of the most important modern commercial red raspberry cultivars derive from hybrids between R. idaeus and R. strigosus. Red raspberries possess unusually good nutritional value: For example, one serving (∼100 g wet weight) provides more dietary fiber than almost any other whole food and are also a rich source of vitamin C, and manganese and dietary fiber [9]. Like most berries, raspberries are a low-glycemic index food.
Beyond the essential nutrients, raspberries are also rich in phytochemicals, containing ellagic acid (EA) (from ellagitannins), quercetin, gallic acid, cyanidins, pelargonidins, catechins, kaempferol and salicylic acid [10, 11].
Both yellow and red raspberries contain carotenoids, mostly lutein esters, but these are masked by anthocyanins in the red fruits [12]. A set of existing research data suggests a tie between the phytochemical content of raspberries and antioxidant and antiproliferative (chemo-preventive) effects in cell and rodent studies [13–16]. Other results show an anti-inflammatory effect of raspberry extracts and/or EA in a variety of models [17–20]. There are at least two reports of an effect on vasorelaxation and blood pressure [10, 21]. The body of research from human studies is growing and suggests a role for red raspberries in reducing the risk of metabolic disease [22]. Although a growing collection of research studies are highlighted above, compared to other pigmented fruits and vegetables, raspberries have been less studied.
The present study utilizes raspberry concentrates produced from a whole raspberry puree and raspberry juice, a dried whole raspberry powder, and an extract produced from raspberry seeds. Further, two pure compounds present in raspberry were tested: Ellagic acid (EA) and raspberry ketone (RK) (4-(4-Hydroxyphenyl)butan-2-one). Although EA is not singularly unique to raspberry, it is quite abundant in raspberries; in fact, raspberries are one of a small number of fruits that contain the very highest concentrations of EA [23, 24]. Ellagic acid appears to be emerging as a phytonutrient that may provide health benefits. For example, recent studies show that the level of EA in fruit extracts produces beneficial effects on metabolic disease symptoms in mice and alters the metabolism of human adipocytes [25, 26]. In the GI tract, EA is converted into a family of compounds calls the urolithins [27–29]. It has been suggested it is the urolithins that mediate the health benefits produced by consumption of ellagitannins and EA [30, 31]. On the other hand, raspberry ketone, the aromatic compound that is the hallmark aroma of raspberry, has been minimally-studied in terms of metabolic disease. Although RK is promoted as a dietary supplement, as a product to help promote or maintain weight loss, there are few studies that document a clear effect [32, 33]. More recently, publications investigating aspects of raspberry ketone have evaluated bone cell differentiation [34]; fatty liver [35]; and gene expression changes [36]. The efficacy of RK is not known with certainty at this time. More information regarding RK is needed, both in terms of efficacy and safety of use as a dietary supplement. Although there are many other important phytochemicals contained in raspberries that may improve metabolism (quercetin, catechins, and anthocyanins, to name three), the scope of this project was focused on raspberry food products and phytochemicals either abundant or unique to raspberries.
2Material and methods
2.1Mouse diet studies
Seventy-six 6-week old male C57BL/6J mice were purchased from Jackson Laboratories (Bar Harbor, ME) and randomly divided into nine experimental groups: Low-fat control group (LF) (10% calories from fat), High-fat control group (HF) (45% calories from fat) and seven “High-fat treatment” groups (HF+X): High-fat plus raspberry juice concentrate (HF+RJC), raspberry puree concentrate (HF+RPC), raspberry fruit powder (HF+RFP), raspberry seed extract (HF+RSE), EA (HF+EA), raspberry ketone (HF+RK), and a combination of equal parts EA and raspberry ketone (HF+E+R). All groups were n = 8 except for HF, which was n = 12. Raspberry food products and extracts were obtained from Milne Fruit Products (Prosser, WA) and EA and RK from Sigma-Aldrich (St. Louis, MO). The composition of the diets are shown in Table 1. Experimental diets were prepared by Research Diets Inc. (New Brunswick, NJ, USA). Energy-containing raspberry foods (juice and puree concentrates and whole fruit powder) were provided as 10% of total energy, while purified phytochemicals were provided at 0.2% (w/w). In the case of HF+E+R, EA and RK were each provided at 0.2% (w/w) to provide a total supplement of 0.4% (w/w). The dietary concentration of these phytochemicals was set based on prior work feeding phytochemicals to this mouse strain [37] and is a level consistent with human intake of phytochemical-based dietary supplements. Diets were balanced for total macronutrient content and simple sugar content and are modeled after a typical Western-style diet containing energy at ∼45% fat, ∼ 35% carbohydrate, and ∼ 20% protein (all % by total calories). All high fat diets also contained added cholesterol and sucrose. Mice were housed four to a cage under standard conditions of regulated temperature (22 ± 2°C), controlled climate, a 12-hour light/dark cycle, and access to water and food ad libitum. Animals were acclimated for two weeks with a standard chow diet (Purina 5001) and then randomly divided into their respective treatment groups and fed their experimental diets for 10 weeks. Body weights, food intake, and food spillage were measured weekly as a total amount consumed for each dietary group per week. At the end of the study, food was withheld from mice for six hours prior to anesthetization via inhalation of 5% isofluorane. Blood was collected by cardiac puncture and glucose level was measured with a handheld glucose meter. Plasma samples were collected after centrifuging at 2000 RPM with an Eppendorf 5417 R microfuge for 15 minutes at 4°C, then stored at –80°C until needed. Liver tissue was collected, weighed, and flash-frozen in liquid nitrogen within 1-2 minutes of killing. The animal protocol was reviewed and approved by the Institutional Animal Care and Use Committee at Oregon State University (ACUP #4455).
2.2Intraperitoneal glucose tolerance test
In week nine of the study, a glucose tolerance test was performed following standard protocols [38, 39]. Glucose levels were measured using a ReliOn® Ultima Blood Glucose Monitoring System (ReliOn® Ultima, Abbott, Alameda, CA). Prior to initial baseline glucose measurement, food was withheld from mice for six hours. Mice were anesthetized using isofluorane inhalation at 5% concentration, a tail cut was made under anesthesia from which a sample of blood was collected and an initial baseline glucose measurement was taken. Following the initial baseline glucose measurement at time zero, 10μL of 15% glucose in 0.9% saline solution per g body weight was injected into the abdomen of the mouse. Mice were then allowed to recover from anesthesia and glucose levels were subsequently measured at 30-minute intervals over a 2-hour period of time while awake.
2.3Histological analyses
Liver tissue was fixed in buffered formalin and paraffin embedded, and three to four 5μm thick sections were transferred to numbered slides. Slides were then stained with Masson’s trichrome stains. Images were acquired using a Nikon Eclipse E400 microscope (Nikon Co., Tokyo, Japan) equipped with an extended digital camera (Q imaging, Surrey, BC, Canada). Lipid droplet percentage (the ratio of white color area pixel to the total area pixel) was obtained with Adobe Photoshop 7.0, generally as described by Kassan et al. [40].
2.4Statistical analysis
Data are presented as means ± SEM. ANOVA was used to compare sets of data and Tukey’s post-hoc procedure was used for the post hoc testing. Significance was established at a level of p < 0.05 and a trend to significance is defined as a p value between 0.05 and 0.10. Statistical analyses were carried out using GraphPad Prism 6 (GraphPad Software, San Diego, CA, USA).
3Results
As expected, intake of the high-fat, high-sucrose diet impacted body weight, weight change, and food efficiency. Over the ten week feeding period, weight gain (Fig. 1C) was significantly higher for HF- vs. LF-fed mice: 18 ± 2.3 g (HF-fed) vs 7 ± 1.0 g (LF-fed). Addition of RJC, RPC, and the combination of EA+RK to the HF diet significantly reduced weight gain observed in the HF-fed mice (P < 0.05) and for the case of HF+RJC, reduced weight gain to a level that was statistically equivalent to the weight gain of the LF-fed mice (P < 0.05). These changes in body weights for the HF-fed groups were observed despite the fact that all HF-fed groups consumed equivalent amounts of energy. All HF-fed groups consumed more energy than LF-fed mice throughout the study (P < 0.05; data not shown).
Food efficiency values (Fig. 1A) generally paralleled the weight change values, with LF-fed mice having a lower food efficiency compared to HF-fed mice. The HF+RJC-, HF+RPC-, and HF+EA+RK-fed mice had food efficiencies significantly lower than HF-fed mice and statistically equivalent to LF-fed mice (all P < 0.05).
For the glucose tolerance test, at 30 minutes all blood glucose levels reached a maximum and then generally declined for 90 more minutes, approaching basal levels (not shown). Plasma levels of fasting glucose were not significantly changed by diet (Fig. 2A). Relative levels of glucose sensitivity is shown as incremental area under the curve (AUC) during a two hour glucose tolerance test (Fig. 2B). Statistical tests did not show any differences in baseline glucose or AUC values.
A serum marker of insulin insensitivity, resistin [41], was measured. Consumption of HF+RJC and HF+RPC diets decreased serum resistin levels compared to HF-fed mice which trended to significance (0.05 < P<0.10, Fig. 3A). We examined the effect of raspberry intake on two serum markers of inflammation, TNF-a, and MCP-1. No significant effect (P < 0.10) was observed (data not shown).
Ratios of kidney, liver, and intraperitoneal adipose weights to total body weight are shown in Table 2. The HF-fed mice had significantly decreased kidney/body weight ratio compared to LF diet (P < 0.05). Mice fed HF+RPC had a ratio statistically equivalent to the LF-fed mice. HF diet increased both the liver and adipose to body weight ratios compared to LF-fed mice (P < 0.05). Mice fed HF+RJC had reduced liver to body weight ratio compared to HF-fed mice (P < 0.05). None of the HF-fed groups had statistically different adipose to body weight ratios, although mice fed HF+RJC had a ratio of intermediate value between HF and LF that was reduced to a degree from HF such that the value was statistically indistinguishable from both LF and HF groups (P < 0.05).
Liver tissues were fixed at necropsy with formalin and stained to allow microscopic examination of tissues from all groups. Qualitative evaluation of tissue sections showed differences in vesicular lipid accumulation with most hepatocytes from HF-fed mice displaying micro- and macro-vesicular intracellular lipid accumulation. Quantitatively, mice fed HF+EA had the greatest amount of intracellular lipid accumulation which was significantly reduced in groups fed LF and HF+RK diets (P < 0.05, Fig. 4B).
4Discussion
The intake of raspberry whole food products and the phytochemicals, EA and RK as an addition to an obesigenic high-fat, high-calorie Western-style diet supplemented with sucrose and cholesterol ameliorated some factors associated with the development of obesity during the study. The addition of RJC, RPC, and the combination of EA+RK to HF diets resulted in weight gains that were statistically equivalent to LF-fed mice, despite the consumption of a significantly different macronutrient profile (Fig. 1, Table 1). Generally speaking, food efficiencies paralleled these weight gain results, indicating the reduction in weight gain in HF with supplements was perhaps more likely due to enhanced energy utilization, rather than amount of energy consumed, as all HF-fed groups had similar food intake values. There were some differences in the ratio of kidney, liver, and adipose compared to final body weight. These differences illustrate the difference between the kidney, which does not accumulate significant fat, vs. liver and adipose which increase in weight due to accumulation of significant intracellular triglycerides.
The test groups showing reductions in weight gain while consuming a HF-containing diet (RJC, RPC, and EA+RK) did not show any significant difference in baseline glucose measurements or AUC measurements made during a glucose tolerance test (Fig. 2). However, despite the fact that glucose measurements showed no significant differences, other data suggest that glucose sensitivity may have been improved in some groups. For example, compared to HF-fed mice, mice fed HF+RJC or RPC showed a statistical trend toward decreased serum resistin concentrations (Fig. 3A), a marker of glucose insensitivity that generally correlates with the advancement of diabetes [41]. Although not statistically different (ANOVA P = 0.14), a pattern suggests hyperinsulinemia is occurring in HF-fed mice that may be remediated by supplement of raspberry food and supplement ingredient (Fig. 3B). A follow-up study, using a larger number of mice per group may help clarify if resistin and insulin levels are indeed affected by these test diets. Similarly, hepatic lipid levels were different in some groups (Fig. 4). A direct measurement of hepatic triglycerides by enzymatic assay might provide a more definitive analysis compared to our use of densitometry of microscopic images, further, as these data were obtained at only N = 4 per groups, it is conceivable analysis with greater N would show more significant differences. Interestingly, we found HF+RK-fed mice to have a relatively low level of intrahepatic fat which is consistent with the findings of Wang et al., 2012 [35].
All of the changes shown occurred at levels of supplementation that are considered dietary rather than pharmacologic doses. For calorie-containing whole food ingredients, raspberry products were provided at 10% of total dietary energy, the equivalent of a human consuming 200 Calories in a 2000 Calorie daily diet. Using the FDA-suggested scaling for inter-species evaluation of drugs and xenobiotics [42], our level of supplementation for the HF+EA or HF+RK diets are equivalent to approximately 900 mg/day of a dietary supplement of those compounds. As they are commonly sold as 500 mg tablets, we consider this dose to be well within the range that we might expect to see humans consume.
It is entirely possible that metabolic effects of consumption of these test diets were produced by more than a single mechanism. In the past, we have suggested that polyphenolic phytochemicals may be acting via transactivation or antagonism selected nuclear hormone receptors in the liver and other tissues [43, 44] It is evident that raspberry phytonutrients and/or their subsequent colonic metabolites are absorbed into the blood stream, and may thus have effects on major metabolic target tissues such as liver and muscle. Recent gene expression studies [25, 26], and metabolomic evaluations data support this presumption. For example, a metabolic evaluation of liver tissue shows accumulation of raspberry-related metabolites including methyl glucopyranoside and S-methylmethionine only when whole raspberry products were provided to mice fed a HF diet [45]. Other evidence suggests alterations in fermentation of the colonic microbiota are involved [46]. Others have shown another role for the microbiome, including the conversion of ellagic acid into urolithins [28, 47, 48].
The present data indicate that the intake of a reasonable level of some raspberry food products or raspberry phytochemicals influences some of the metabolic consequences of consumption of a high-fat, high-calorie Western-style diet, most notably the development of obesity. It is hoped that findings from this study may perhaps help guide the design of future clinical trials, which may then be translated into sound guidance to allow people to better select healthy foods and/or more effective dietary supplements.
Funding
National Processed Raspberry Council (USA).
References
[1] | NCD-RisC (Risk Factor Collaboration) Worldwide trends in diabetes since 1980: A pooled analysis of 751 population-based studies with 4·4 million participants. The Lancet. (2016) ;387: :1513–1531. |
[2] | Schiller JS , Lucas JW , Ward BW , Peregoy JA . Summary health statistics for US Adults: National health interview survey, 2010. Vital Health Stat. Series 10, Data from The National Health Survey. (2012) ;252: :1–207. |
[3] | Ahmad KA , Najafi B . Obesity in type 2 diabetes: A review of health economic evidences 2012. Hakim Research Journal (2012) ;14: (4):233–241. |
[4] | Grundy SM . Obesity, metabolic syndrome, and cardiovascular disease. J Clin Endocr Metab. (2004) ;89: (6):2595–2600. |
[5] | Kaiser KA , Brown AW , Bohan Brown MM , Shikany JM , Mattes RD , Allison DB . Increased fruit and vegetable intake has no discernible effect on weight loss: A systematic review and meta-analysis. Am J Clin Nutr. (2014) ;100: (2):567–576. |
[6] | Mytton OT , Nnoaham K , Eyles H , Scarborough P , Ni Mhurchu C . Systematic review and meta-analysis of the effect of increased vegetable and fruit consumption on body weight and energy intake. BMC Public Health. (2014) ;14: :886. |
[7] | González-Castejón M , Rodriguez-Casado A . Dietary phytochemicals and their potential effects on obesity: A review. Pharmacol Res. (2011) ;64: (5):438–455. |
[8] | Paigen B . Genetics of responsiveness to high-fat and high- cholesterol diets in the mouse. Am J Clin Nutr. (1995) ;62: (2):458S–462S. |
[9] | USDA Nutrient Database ((2013) ) at www.usda.gov. |
[10] | Mullen W , McGinn J , Lean ME , MacLean MR , Gardner P , Duthie GG , ... & Crozier A. Ellagitannins, flavonoids, and other phenolics in red raspberries and their contribution to antioxidant capacity and vasorelaxation properties. J Agr Food Chem. (2002) ;50: (18):5191–5196. |
[11] | Beekwilder J , Hall RD , Vos R , De CH . Identification and dietary relevance of antioxidants from raspberry. Biofactors. (2005) ;23: (4):197–205. |
[12] | Carvalho E , Fraser PD , Martens S . Carotenoids and tocopherols in yellow and red raspberries. Food Chem. (2013) ;139: (1):744–752. |
[13] | Liu M , Li XQ , Weber C , Lee CY , Brown J , Liu RH . Antioxidant and antiproliferative activities of raspberries. J Agr Food Chem. (2002) ;50: (10):2926–2930. |
[14] | Seeram NP , Adams LS , Zhang Y , Lee R , Sand D , Scheuller HS , Heber D . Blackberry, black raspberry, blueberry, cranberry, red raspberry, and strawberry extracts inhibit growth and stimulate apoptosis of human cancer cells in vitro . J Agr Food Chem. (2006) ;54: (25):9329–9339. |
[15] | Sharma M , Li L , Celver J , Killian C , Kovoor A , Seeram NP . Effects of Fruit Ellagitannin Extracts, Ellagic Acid, and Their Colonic Metabolite, Urolithin A, on Wnt Signaling. J Agr Food Chem. (2009) ;58: (7):3965–3969. |
[16] | González-Sarrías A , Espín JC , Tomás-Barberán FA , García-Conesa MT . Gene expression, cell cycle arrest and MAPK signalling regulation in Caco2 cells exposed to ellagic acid and its metabolites, urolithins. Mol Nutr Food Res. (2009) ;53: (6):686–698. |
[17] | Sangiovanni E , Vrhovsek U , Rossoni G , Colombo E , Brunelli C , Brembati L , ... Dell’Agli M.. Ellagitannins from Rubus berries for the control of gastric inflammation: in vitro and in vivo studies. PloS one. (2013) ;8: (8):e71762. |
[18] | Jean-Gilles D , Li L , Ma H , Yuan T , Chichester III CO , Seeram NP . Anti-inflammatory effects of polyphenolic-enriched red raspberry extract in an antigen-induced arthritis rat model. J Agr Food Chem. (2011) ;60: (23):5755–5762. |
[19] | Giménez-Bastida JA , González-Sarrías A , Larrosa M , Tomás-Barberán F , Espín JC , García-Conesa MT . Ellagitannin metabolites, urolithin A glucuronide and its aglycone urolithin A, ameliorate TNF-α-induced inflammation and associated molecular markers in human aortic endothelial cells. Mol Nutr Food Res. (2012) ;56: (5):784–796. |
[20] | Larrosa M , González-Sarrías A , Yáñez-Gascón MJ , Selma MV , Azorín-Ortuño M , Toti S , .... & Espín JC. Anti-inflammatory properties of a pomegranate extract and its metabolite urolithin-A in a colitis rat model and the effect of colon inflammation on phenolic metabolism. J Nutr Biochem. (2010) ;21: (8):717–725. |
[21] | Jia H , Liu JW , Ufur H , He GS , Liqian H , Chen P . The antihypertensive effect of ethyl acetate extract from red raspberry fruit in hypertensive rats. Pharmacogn Mag. (2011) ;7: (25):19. |
[22] | Burton-Freeman BM , Sandhu AK , Edirisinghe I . Red raspberries and their bioactive polyphenols: cardiometabolic and neuronal health links. Adv Nutr. (2016) ;7: (1):44–65. |
[23] | National Cancer Institute (NCI) ((2013) ). Raspberries are a good source of EA. http://www.cancer.org/treatment/treatmentsandsideeffects/complementaryandalternativemedicine/dietandnutrition/ellagic-acid. |
[24] | Vattem DA , Shetty K . Biological functionality of ellagic acid: A review. J Food Biochem. (2005) ;29: (3):234–266. |
[25] | Gourineni V , Shay NF , Chung S , Sandhu AK , Gu L . Muscadine grape (Vitis rotundifolia) and wine phytochemicals prevented obesity-associated metabolic complications in C57BL/6J mice. J Agr Food Chem. (2012) ;60: (31):7674–7681. |
[26] | Okla M , Kang I , Kim DM , Gourineni V, Shay N, Gu L, Chung S. Ellagic acid modulates lipid accumulation in primary human adipocytes and human hepatoma Huh7 cells via discrete mechanisms. J Nutr Biochem. (2015) ;26: (1):82–90. |
[27] | Cerdá B , Periago P , Espín JC , Tomás-Barberán FA . Identification of urolithin A as a metabolite produced by human colon microflora from ellagic acid and related compounds. J Agr Food Chem. (2005) ;53: (14):5571–5576. |
[28] | González-Barrio R , Edwards CA , Crozier A . Colonic catabolism of ellagitannins, ellagic acid, and raspberry anthocyanins: in vivo and in vitro studies. Drug Metab Dispos. (2011) ;39: (9):1680–1688. |
[29] | García-Villalba R , Beltrán D , Espín JC , Selma MV , Tomás-Barberán FA . Time course production of urolithins from ellagic acid by human gut microbiota. J Agr Food Chem. (2013) ;61: (37):8797–8806. |
[30] | Kang I , Kim Y , Tomás-Barberán FA , Espín JC , Chung S . Urolithin A, C and D, but not iso-Urolithin A and Urolithin B, attenuate triglyceride accumulation in human cultures of adipocytes and hepatocytes. Mol Nutr Food Res. (2016) . doi: 10.1002/mnfr.201500796. [Epub ahead of print]. |
[31] | Ludwig IA , Mena P , Calani L , Borges G , Pereira-Caro G , Bresciani L , Del Rio D , Lean ME , Crozier A . New insights into the bioavailability of red raspberry anthocyanins and ellagitannins. Free Radic Biol Med. (2015) ;89: :758–769. |
[32] | Morimoto C , Satoh Y , Hara M , Inoue S , Tsujita T , Okuda H . Anti-obese action of raspberry ketone. Life sciences. (2005) ;77: (2):194–204. |
[33] | Park KS . Raspberry ketone increases both lipolysis and fatty acid oxidation in 3T3-L1 adipocytes. Planta medica. (2010) ;76: (15):1654. |
[34] | Takata T , Morimoto C . Raspberry ketone promotes the differentiation of C3H10T1/2 stem cells into osteoblasts. J Med Food. (2014) ;17: (3):332–338. |
[35] | Wang L , Meng X , Zhang F . Raspberry ketone protects rats fed high-fat diets against nonalcoholic steatohepatitis. J Med Food. (2012) ;15: (5):495–503. |
[36] | Park KS . Raspberry ketone, a naturally occurring phenolic compound, inhibits adipogenic and lipogenic gene expression in 3T3-L1 adipocytes. Pharm Biol. (2014) ;53: (6):870–875. |
[37] | Snyder SM , Zhao B , Luo T , Kaiser C , Cavender G , Hamilton-Reeves J , Sullivan DK , Shay NF . Consumption of quercetin and quercetin-containing apple and cherry extracts affects blood glucose concentration, hepatic metabolism, and gene expression patterns in obese C57BL/6J high fat-fed mice. J Nutr. (2016) . pii: jn228817. [Epub ahead of print]. |
[38] | Andrikopoulos S , Blair AR , Deluca N , Fam BC , Proietoo J . Evaluating the glucose tolerance test in mice. Am J Physiol Endocrinol Metab. (2008) ;295: :E1323–E1332. |
[39] | Ayala JE , Samuel VT , Morton GJ , Obici S , Croniger CM , Shulman GI , Wasserman DH , McGuinness OP . Standard operating procedures for describing and performing metabolic tests of glucose homeostasis in mice. Dis Model Mech. (2010) ;3: (9-10):525–534. |
[40] | Kassan A , Herms A , Fernández-Vidal A , Bosch M , Schieber NL , Reddy BJ , Gross SP . Acyl-CoA synthetase 3 promotes lipid droplet biogenesis in ER microdomains. J Cell Bio. (2013) ;203: (6):985–1001. |
[41] | Steppan CM , Bailey ST , Bhat S , Brown EJ , Banerjee RR , Wright CM , Patel HR , Ahima RS , Lazar MA . The hormone resistin links obesity to diabetes. Nature. (2001) ;18;409: (6818):307–312. |
[42] | Center for Drug Evaluation FDA: Guidance for Industry –Estimating the Maximum Safe Starting Does in Initial Clinical Trials for Therapeutics in Adult Healthy Volunteers. U S. Department of Health and Human Services. Published by: Food and Drug Administration, Center for Drug Evaluation and Research (CDER), July (2005) , Pharmacology and Toxicology. |
[43] | Shay NF , Banz WJ . Regulation of gene transcription by botanicals: Novel regulatory mechanisms. Annu Rev Nutr. (2005) ;25: :297–315. Review. |
[44] | Ricketts ML , Moore DD , Banz WJ , Mezei O , Shay NF . Molecular mechanisms of action of the soy isoflavones includes activation of promiscuous nuclear receptors. J Nutr Biochem. (2005) ;16: (6):321–330. |
[45] | Shay NF , Luo T , Miranda-Garcia & Adamson A. Mice fed high-fat obesigenic diets with walnut plus other whole foods demonstrate metabolic improvement and changes in gene expression and metabolomic patterns. FASEB J. (2016) ; 428.3. |
[46] | Fotschki B , Juśkiewicz J , Sójka M , Jurgoński A , Zduńczyk Z . Ellagitannins and Flavan-3-ols from Raspberry Pomace Modulate Caecal Fermentation Processes and Plasma Lipid Parameters in Rats. Molecules. (2015) ;20: (12):22848–22862. |
[47] | Heyman L , Axling U , Blanco N , Sterner O , Holm C , Berger K . Evaluation of beneficial metabolic effects of berries in high-fat fed C57BL/6J mice. J Nutr Metab. (2014) ;2014: :403041. |
[48] | Puupponen-Pimiä R , Seppänen Laakso T , Kankainen M , Maukonen J , Törrönen R , Kolehmainen M , ... & Poutanen K. Effects of ellagitannin-rich berries on blood lipids, gut microbiota, and urolithin production in human subjects with symptoms of metabolic syndrome. Mol Nutr Food Res. (2013) ;57: (12):2258–2263. |
Figures and Tables
Fig.1
Final body weight, body weight change, and food efficiency. Body weight was measured weekly and at the end of the study. Diet consumption was recorded weekly. Food efficiency was calculated as average weekly weight gain per feeding group/average weekly diet intake in kcals per feeding group. Values are expressed as the mean ± SEM, n = 8–12. Bars with the same superscript letter are not significantly different from each other. P < 0.05.
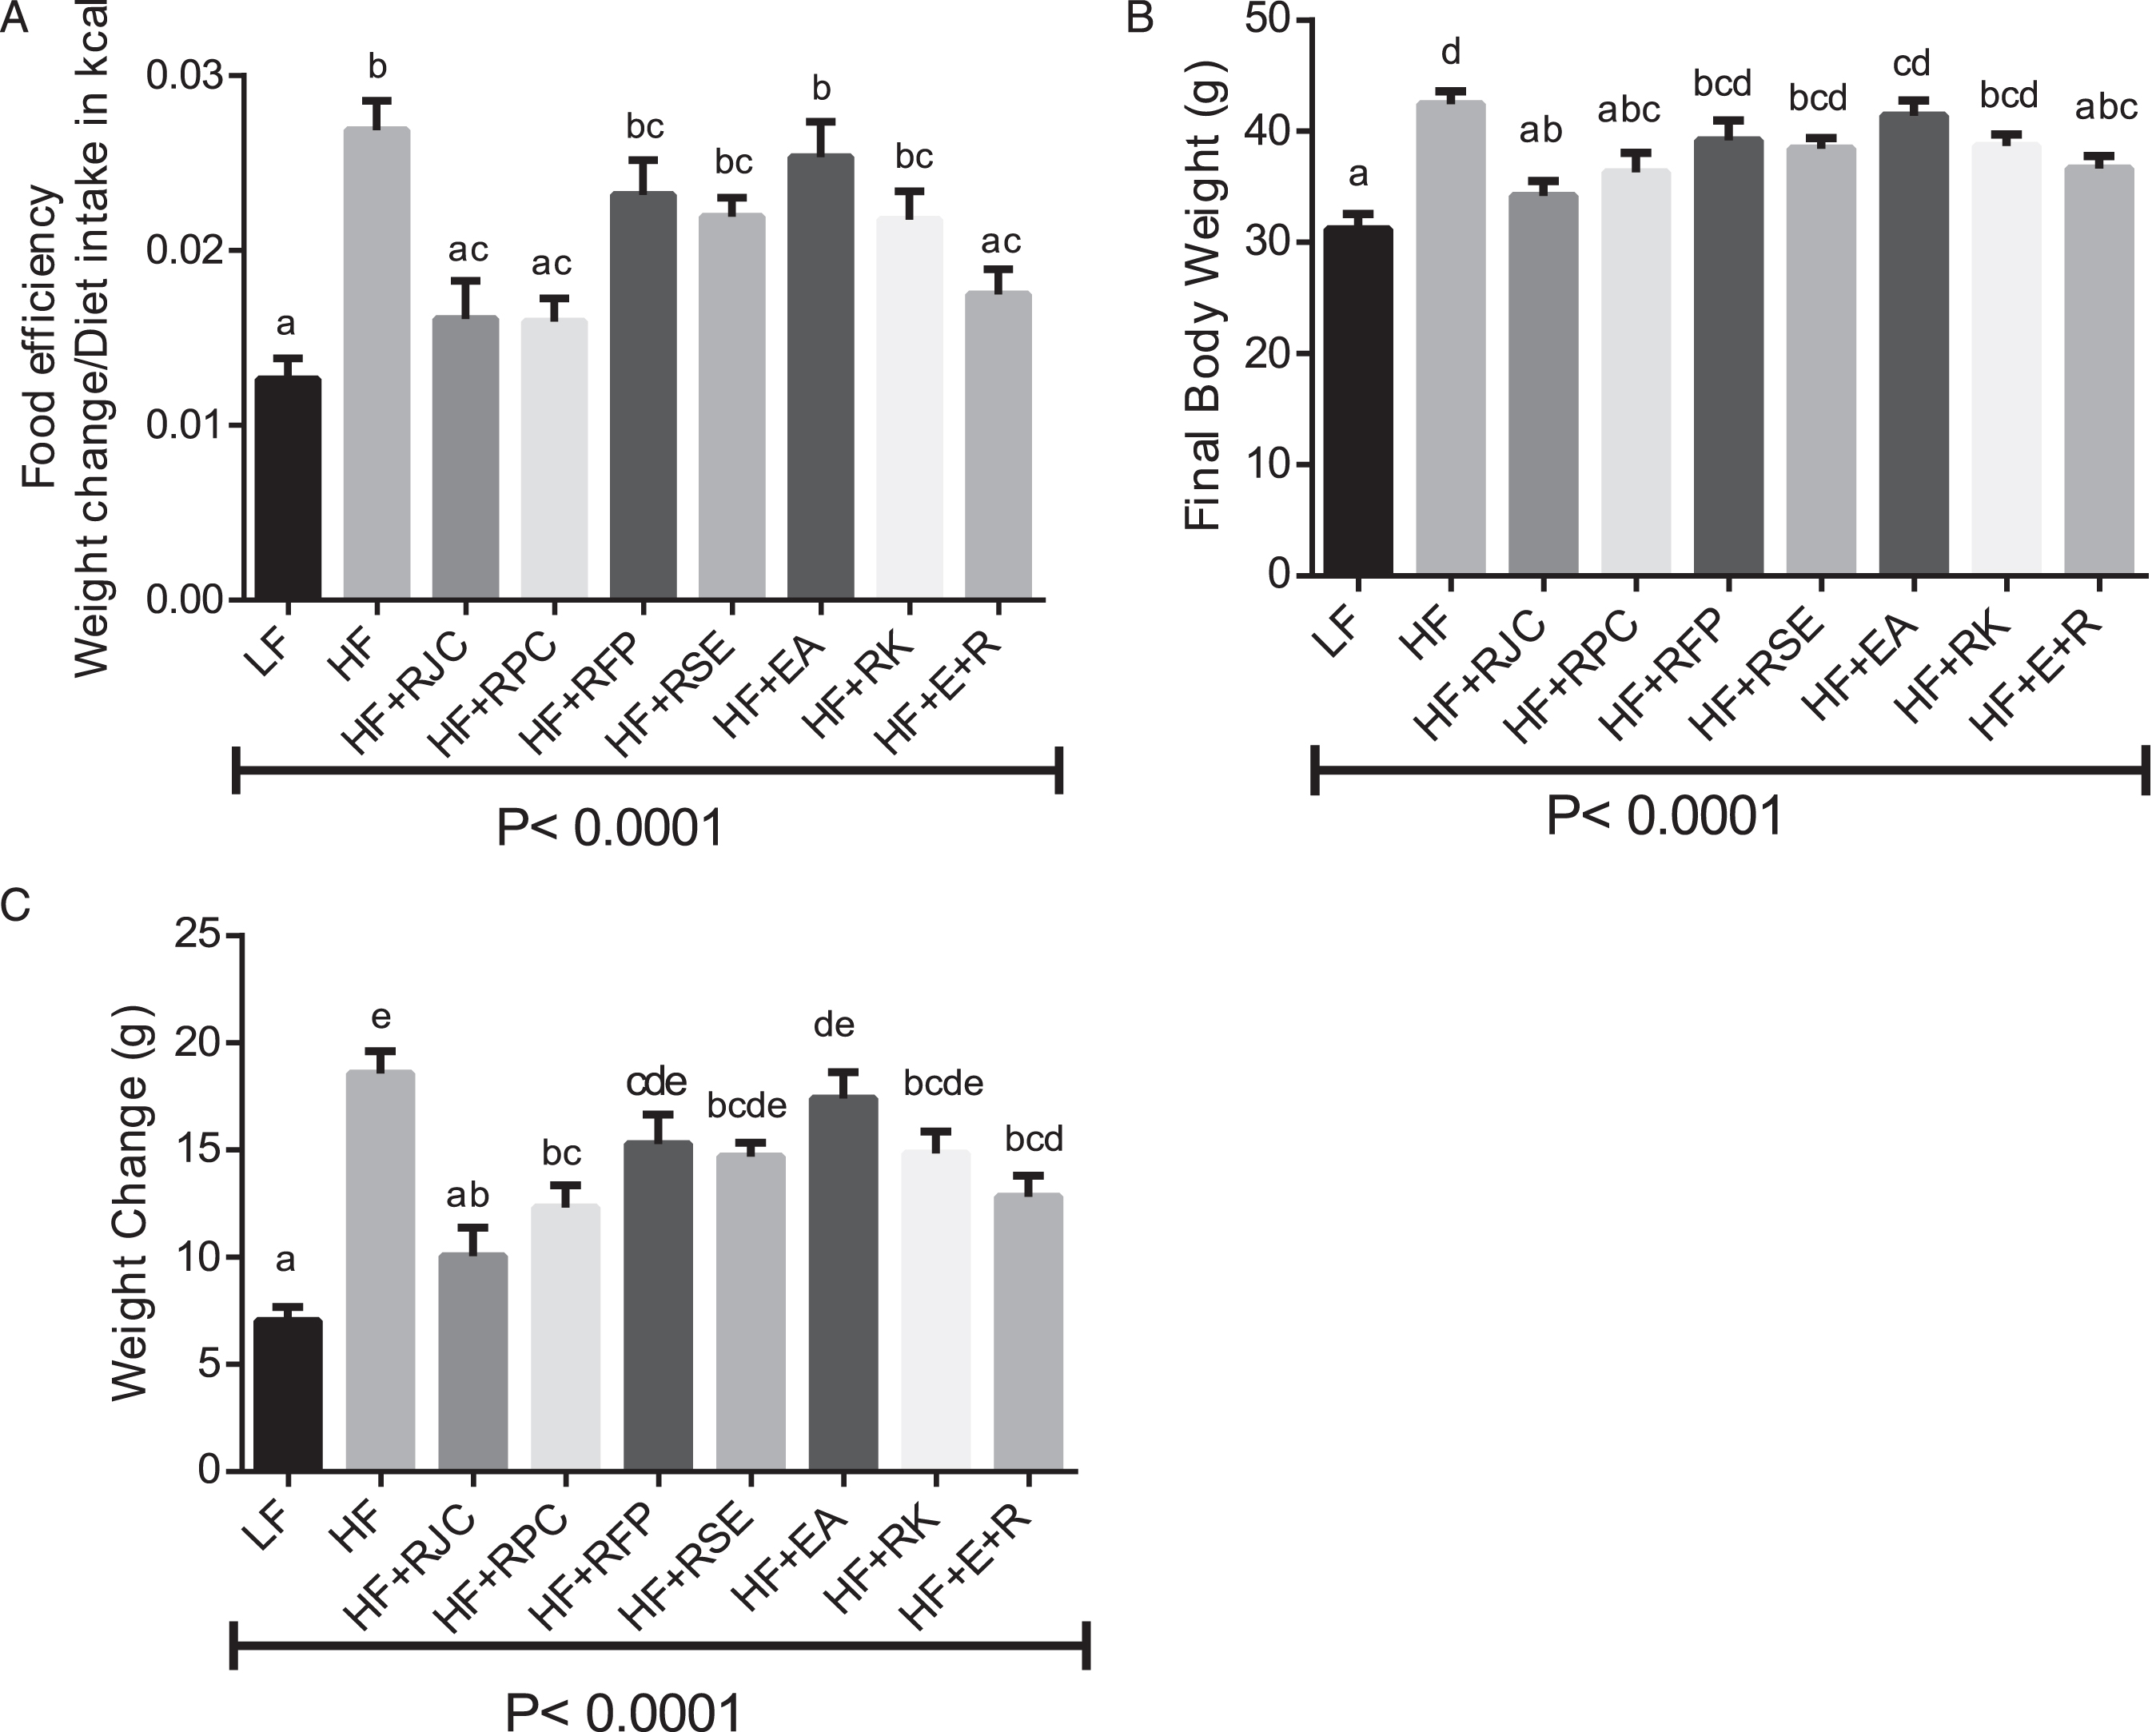
Fig.2
Baseline glucose, area under the curve. At week nine of the study, a glucose tolerance test was performed. Prior to initial baseline glucose measurement, food was withheld from mice for six hours. Values are expressed as the mean ± SEM, n = 8–12. Bars with the same superscript letter are not significantly different from each other. P < 0.05.
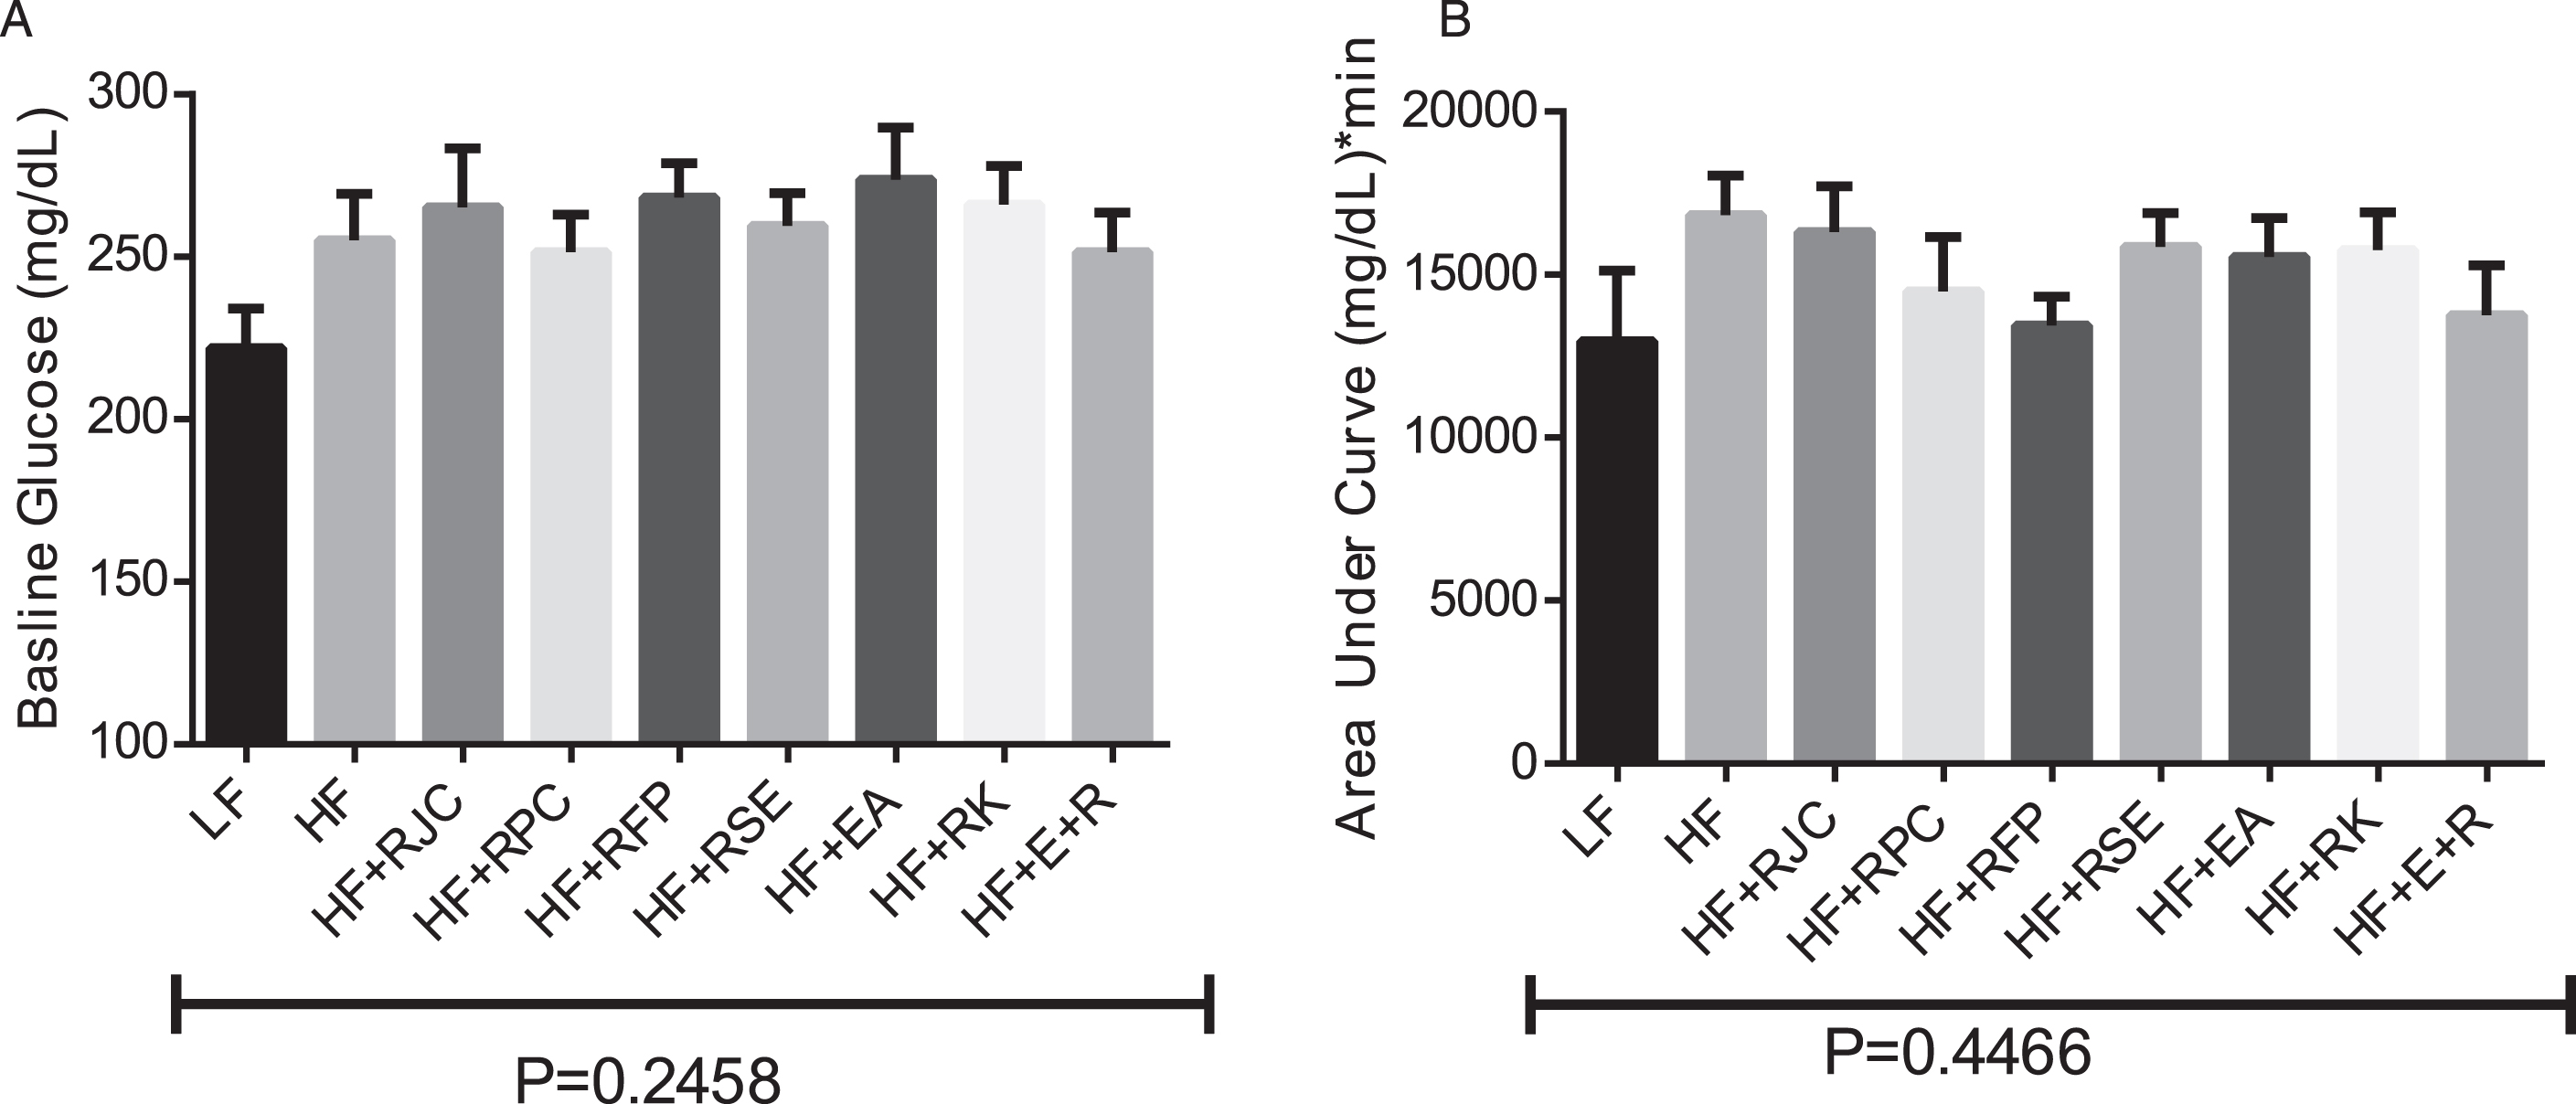
Fig.3
Insulin and resistin content. After mice were sacrificed, blood and serum samples were taken to evaluate resistin and insulin levels. Bars are mean ± SEM, n = 8–12. The bars with the same superscript letter are not significantly different from each other, P < 0.1.
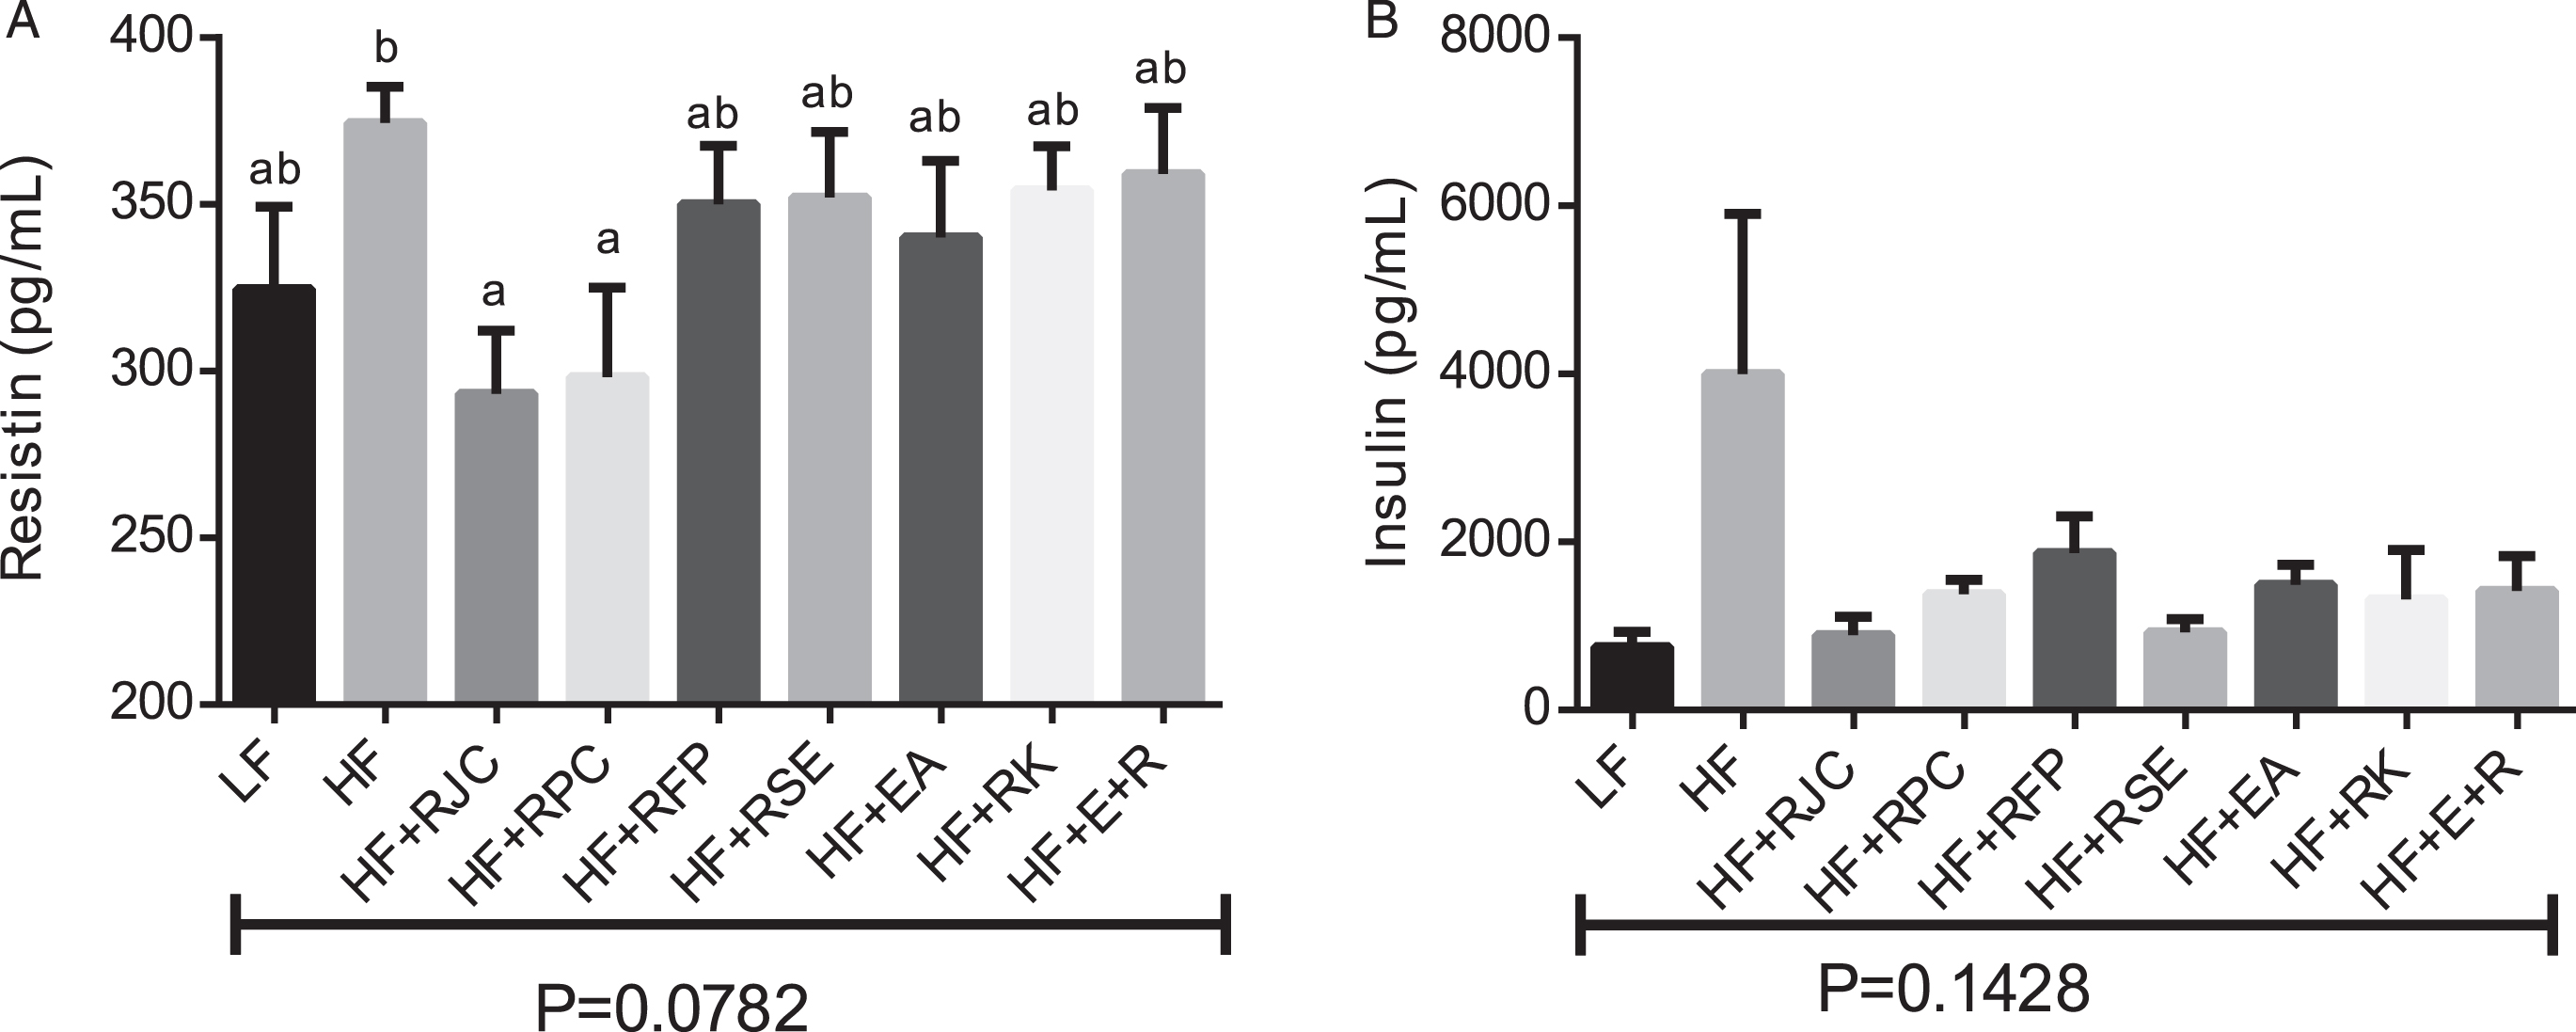
Fig.4
Hepatic trichrome-stained micrographs and quantification of hepatic adipose tissue content. Percent adipose (the ratio of white color area to the total area) was obtained with Adobe Photoshop 7.0. Values are expressed as the mean ± SEM, n = 4. Bars with the same superscript letter are not significantly different from each other. P < 0.05.
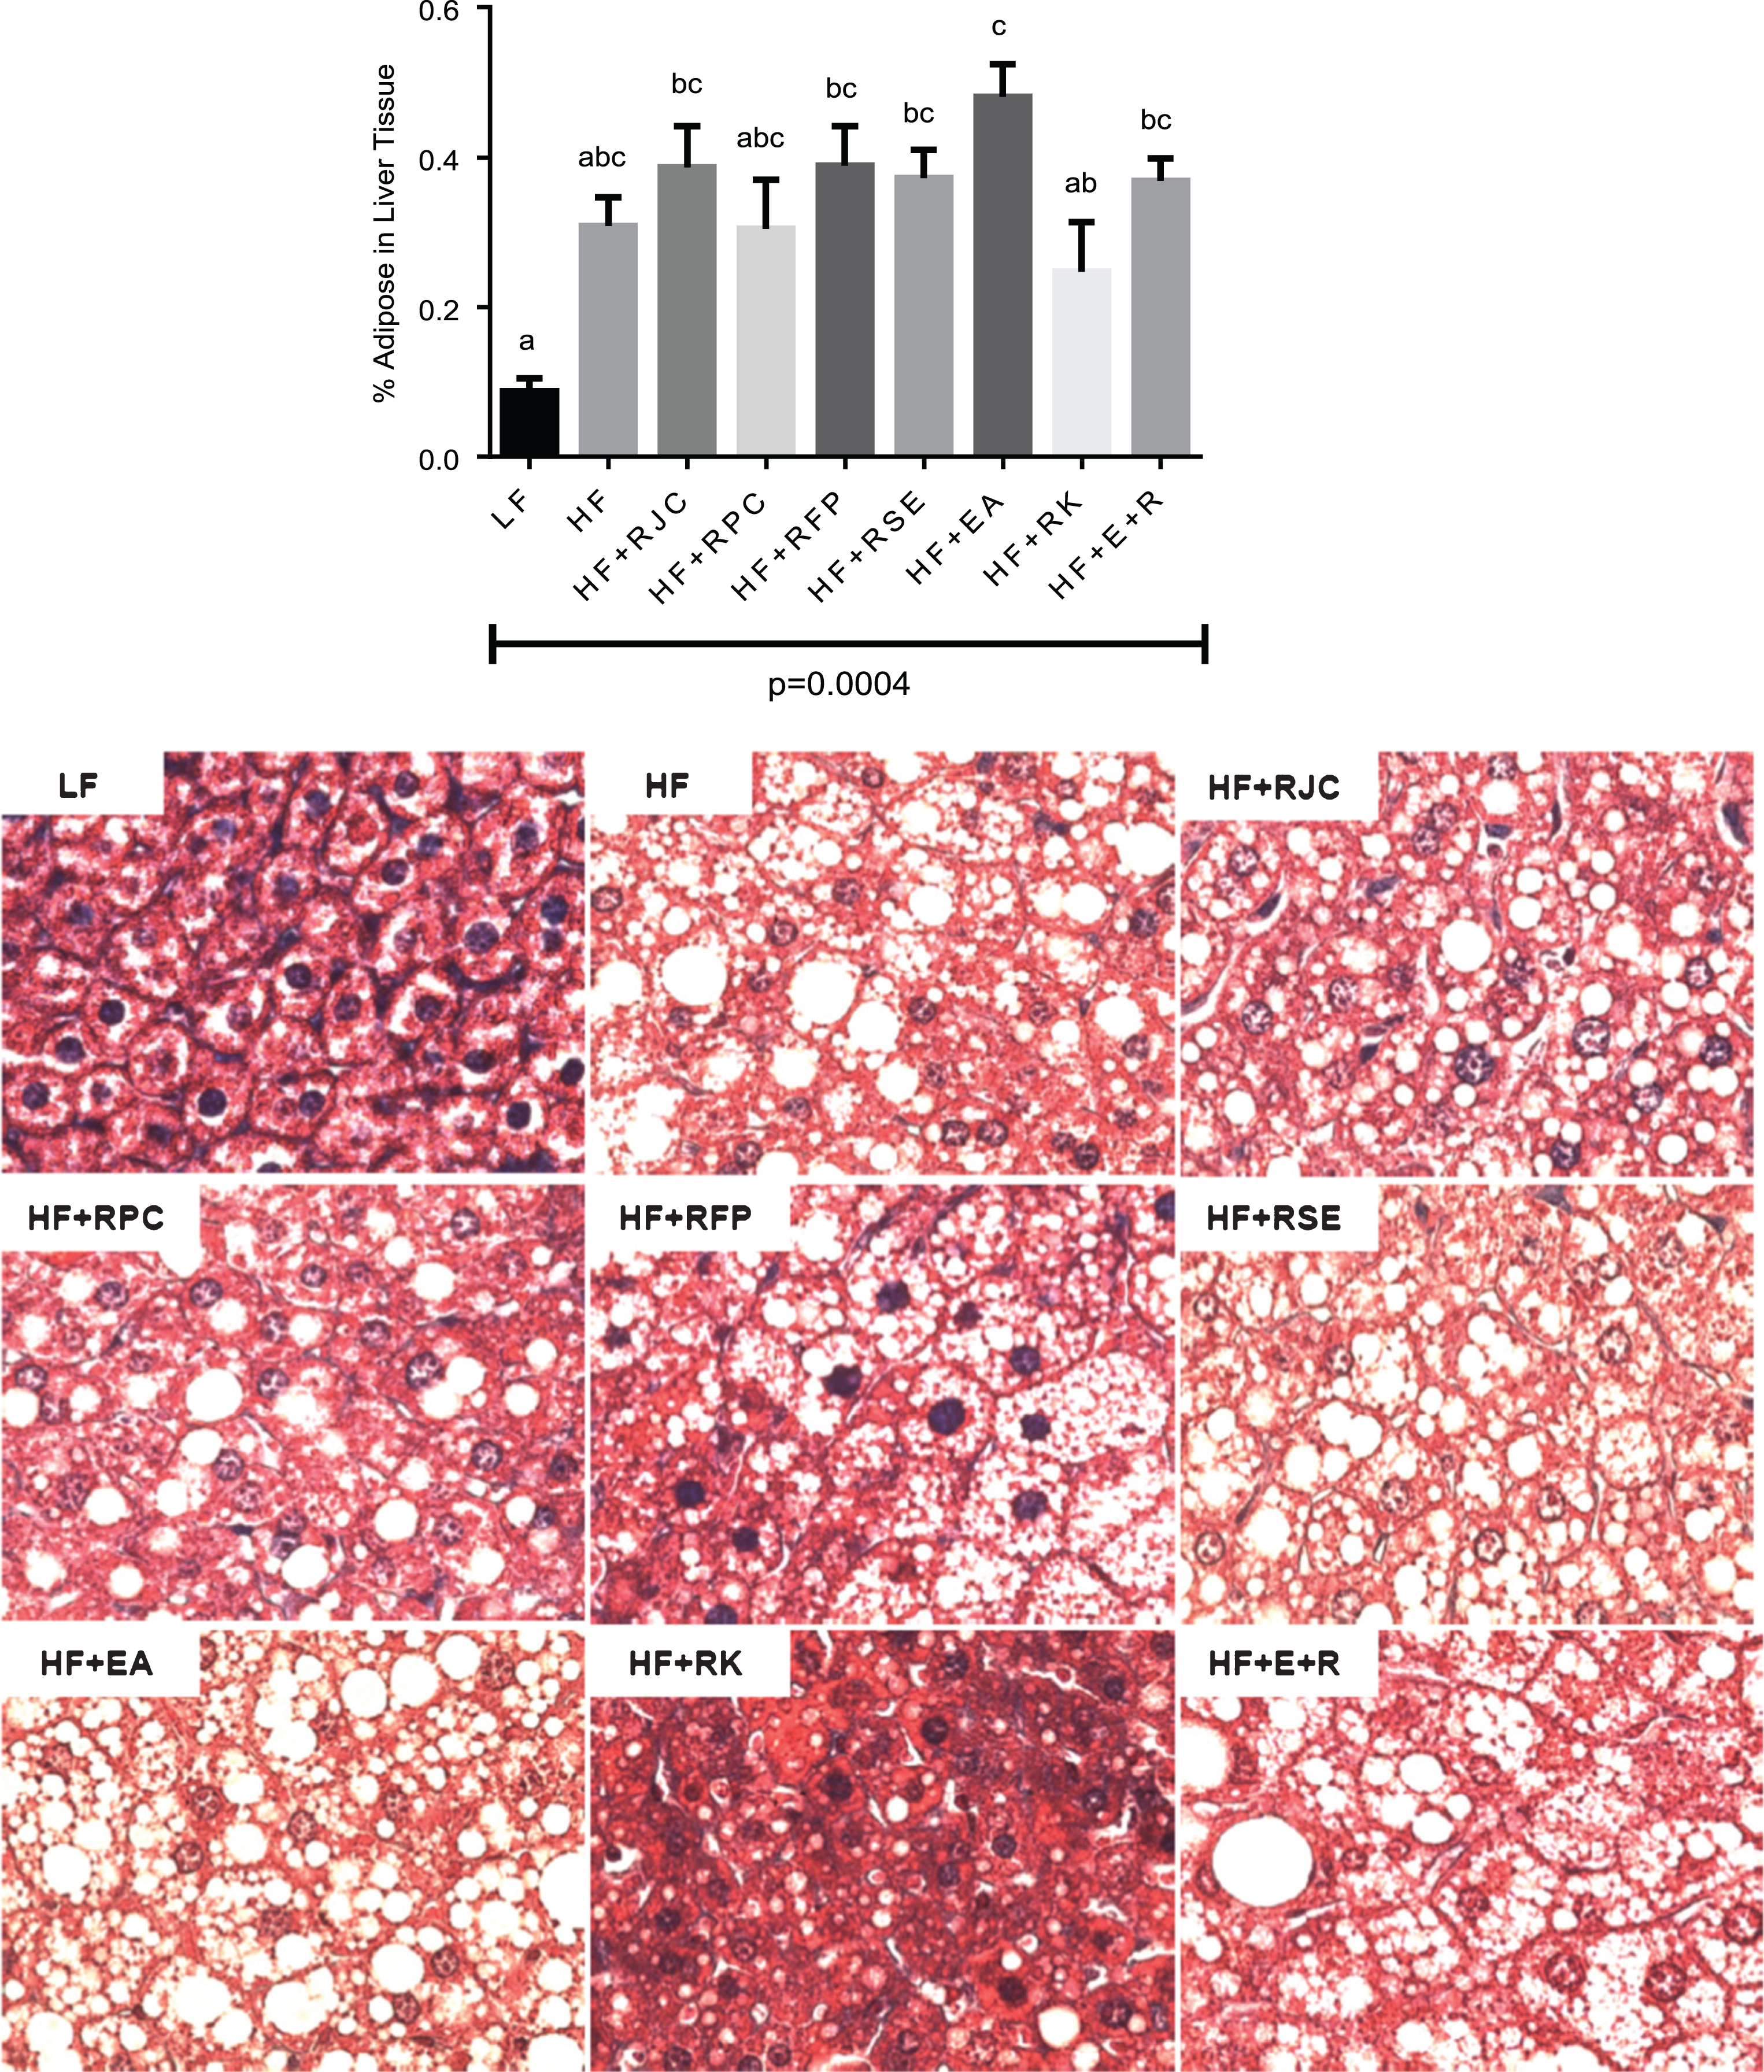
Table 1
Composition of the experimental diet
| LF | HF | HF+RJC | HF+RPC | HF+RFP | HF+RSE | HF+EA | HF+RK | HF+E+R | |
| Casein | 200 | 200 | 194 | 190 | 191 | 200 | 200 | 200 | 200 |
| L-Cystine | 3 | 3 | 3 | 3 | 3 | 3 | 3 | 3 | 3 |
| Corn Starch | 506.2 | 72.8 | 53.7 | 57 | 56.7 | 72.8 | 72.8 | 72.8 | 72.8 |
| Maltodextrin 10 | 125 | 100 | 100 | 100 | 100 | 100 | 100 | 100 | 100 |
| Sucrose | 68.8 | 172.8 | 110.8 | 112.80 | 128.9 | 172.8 | 172.8 | 172.8 | 172.8 |
| Cellulose, BW200 | 50 | 50 | 47.5 | 42.5 | 27 | 50 | 50 | 50 | 50 |
| Soybean Oil | 25 | 25 | 25 | 25 | 25 | 25 | 25 | 25 | 25 |
| Lard | 20 | 177.5 | 172.8 | 174.3 | 173.4 | 177.5 | 177.5 | 177.5 | 177.5 |
| Mineral Mix S10026 | 10 | 10 | 10 | 10 | 10 | 10 | 10 | 10 | 10 |
| Dicalcium Phosphate | 13 | 13 | 13 | 13 | 13 | 13 | 13 | 13 | 13 |
| Calcium Carbonate | 5.5 | 5.5 | 5.5 | 5.5 | 5.5 | 5.5 | 5.5 | 5.5 | 5.5 |
| Potassium Citrate, 1H2O | 16.5 | 16.5 | 16.5 | 16.5 | 16.5 | 16.5 | 16.5 | 16.5 | 16.6 |
| Vitamin Mix V10001 | 10 | 10 | 10 | 10 | 10 | 10 | 10 | 10 | 10 |
| Choline Bitartrate | 2 | 2 | 2 | 2 | 2 | 2 | 2 | 2 | 2 |
| Cholesterol | 0 | 8.5 | 8.5 | 8.5 | 8.5 | 8.5 | 8.5 | 8.5 | 8.5 |
| Raspberry Juice Concentrate | 0 | 0 | 159 | 0 | 0 | 0 | 0 | 0 | 0 |
| Raspberry Puree Concentrate | 0 | 0 | 0 | 375 | 0 | 0 | 0 | 0 | 0 |
| Raspberry Fruit Powder | 0 | 0 | 0 | 0 | 104.6 | 0 | 0 | 0 | 0 |
| Raspberry Seed Extract | 0 | 0 | 0 | 0 | 0 | 1.5 | 0 | 0 | 0 |
| Ellagic Acid | 0 | 0 | 0 | 0 | 0 | 0 | 1.5 | 0 | 1.5 |
| Raspberry Ketone | 0 | 0 | 0 | 0 | 0 | 0 | 0 | 1.5 | 1.5 |
| g% | |||||||||
| Protein | 19 | 20.4 | 20.2 | 15.4 | 20.2 | 20.4 | 20.4 | 20.4 | 20.4 |
| Carbohydrate | 67 | 41.0 | 40.5 | 31.0 | 40.6 | 41.0 | 41.0 | 41.0 | 40.9 |
| Fat | 4 | 23.6 | 23.4 | 17.9 | 23.4 | 23.6 | 23.6 | 23.6 | 23.6 |
| Fiber | 0 | 5.8 | 5.7 | 5.7 | 5.8 | 5.8 | 5.8 | 5.8 | 5.7 |
| Kcal/gm | 3.8 | 4.59 | 4.53 | 4.57 | 4.59 | 4.58 | 4.58 | 4.58 | 4.58 |
Table 2
Kidney, liver and adipose weight/body weight ratios1
| Diet | Kidney Wt/BW | Liver Wt/BW | Adipose Wt/BW |
| LF | 0.011 ± 0.0002bc | 0.036 ± 0.001a | 0.040 ± 0.005a |
| HF | 0.0092 ± 0.0002a | 0.052 ± 0.003c | 0.076 ± 0.003b |
| HF+RJC | 0.011 ± 0.0004abc | 0.040 ± 0.0010ab | 0.059 ± 0.005ab |
| HF+RPC | 0.011 ± 0.0003b | 0.041 ± 0.003abc | 0.063 ± 0.007b |
| HF+RFP | 0.0097 ± 0.0006abc | 0.051 ± 0.003c | 0.079 ± 0.005b |
| HF+RSE | 0.0098 ± 0.0004abc | 0.042 ± 0.001abc | 0.074 ± 0.004b |
| HF+EA | 0.0099 ± 0.0006abc | 0.053 ± 0.004c | 0.076 ± 0.003b |
| HF+RK | 0.0096 ± 0.0006abc | 0.044 ± 0.0025abc | 0.076 ± 0.005b |
| HF+E+R | 0.010 ± 0.0003abc | 0.045 ± 0.002abc | 0.066 ± 0.005b |
1Data analyzed within each column by ANOVA followed by Tukey’s post-hoc test. Values not sharing common superscripts are different, P < 0.05.


