
Antioxidant responses of ‘Selva’ strawberry as affected by salicylic acid under salt stress
Abstract
BACKGROUND: Salicylic acid (SA) is a phenolic-endogenous plant hormone and its ameliorative effects against abiotic stresses have been well documented.
OBJECTIVE: To evaluate the influence of salinity and SA on enzymatic and non-enzymatic antioxidants responses of ‘Selva’ strawberry plants with respect to the time of SA application.
METHOD: Well-rooted daughter strawberry plants cv. Selva, were potted in 3 L plastic pots and after their establishment, were sprayed with 0.5 or 1.0 mM salicylic acid solutions one week before, during or one week after being exposed to 40 mM NaCl salinity. Experiments were carried out as bi-factorial in a completely randomized design.
RESULTS: The activities of superoxide dismutase and glutathione reductase increased by both salinity and SA treatments. The highest antioxidant enzymes activity was observed in plants treated with SA one week before being exposed to salinity stress. These plants had both higher proline and glycine betaine contents and lower protein degradation.
CONCLUSION: Before being exposed to salinity stress, treating strawberry plants with salicylic acid probably by improving their antioxidant systems will prepare them to cope better with the deleterious effects of salt stress.
1Introduction
Soil salinity is a serious threat to global crop production. More than 20% of cultivated land is affected by salinity worldwide and due to climate changes; the world area affected by salinity is expected to increase [1]. Salt stress can lead to stomatal closure, which reduces CO2 availability in the leaves and reduces photosynthetic carbon fixation, exposing chloroplasts to photodynamic damages which in turn increases the generation of reactive oxygen species (ROS) such as superoxide, hydrogen peroxide (H2O2), hydroxyl radicals and singlet oxygen [2]. Reactive oxygen species are highly oxidative and can cause cellular damages through oxidation of lipids, proteins and nucleic acids [3, 4].
Salicylic acid is a seven carbon containing, naturally occurring phenolic compound which is synthesized endogenously and acts as a signaling molecule in plants. The role of SA in provoking salinity tolerance mechanisms in plants has been well established for many crops [5, 6]. Salt stress damages to a SA-deficient NahG transgenic Arabidopsis line, has been attributed to its diminished antioxidant enzymes activities [7]. Karlidag et al. [8] reported adverse influences of salt stress on growth, leaf chlorophyll content and mineral uptake of strawberry plants. They concluded that the exogenous SA treatments did not completely reverse the deleterious effects of salt stress on the growth of strawberry plants. However, foliar application of 1 mM SA solution improved plants tolerance to salinity as compared to control. SA application on ‘Camarosa’ strawberry plants ameliorated the deleterious effects of salt stress on membrane permeability and chlorophyll contents [9]. Application of 0.01 mM SA solution to tomato plants by root drenching, has attenuated the depressive effect of salinity on plants which resulted in higher plants growth and development, higher photosynthetic pigments and also higher K+ contents [10].
Strawberry plant is classified as one of the most salt-sensitive crops with varying degrees of tolerance among its cultivars. Salinity causes leaf edge burn and necrosis, nutrient imbalance, specific ion toxicity, reduction in fruit quality and yield, and potential plant death under long duration of salinity stress conditions [11, 12]. In most studies, with respect to the induction of salinity tolerance by SA, the temporal aspects (prior, simultaneously or after stress initiation) of its applications have not been studied. The aim of the present study was to evaluate the importance of temporal SA application on alleviating the influence of salinity stress on ‘Selva’ strawberry and to determine the time when the maximum beneficial effects of exogenous SA could be achieved.
2Materials and methods
2.1Plant growth conditions and treatments
Uniformly rooted daughter strawberry plants cv. Selva were potted in 3 L plastic pots filled with peat moss and perlite (1:1). After the initiation of plants growth (week7), those with four or five fully expanded leaves, based on the following treatments, were divided into 10 groups: 1. Control (C), sprayed with distilled water, 2. Plants exposed to 40 mM NaCl salinity stress (the concentration of NaCl salinity was chosen according to the previous study. This NaCl concentration could impose salinity stress but did not cause plant death) and sprayed with distilled water (NaCl alone), 3. Plants sprayed with 0.5 mM SA solution under non-stress conditions (SA0.5), 4. Plants sprayed with 1 mM SA solution under non-stress conditions (SA1), 5. Plants sprayed with 0.5 mM SA solution 7 days before exposing them to 40 mM NaCl salinity stress (SA0.5⟶NaCl), 6. Plants sprayed with 1 mM SA solution 7 days before treating them with 40 mM NaCl salinity stress (SA1⟶NaCl), 7. Plants sprayed with 0.5 mM SA solution during (simultaneously with initiation of salt stress) their exposure to 40 mM NaCl salinity stress (SA0.5-NaCl), 8. Plants sprayed with 1 mM SA solution during (simultaneously with initiation of salt stress) their exposure to 40 mM NaCl salinity stress (SA1-NaCl), 9. Plants exposed to 40 mM NaCl salinity and after 7 days were sprayed with 0.5 mM SA solution (NaCl⟶SA0.5) and 10. Plants exposed to 40 mM NaCl salinity and after 7 days were sprayed with 1 mM SA solution (NaCl⟶SA1).
Plants were kept under natural light (>800μmol.m- 2•S- 1) in the greenhouse. The average day and night temperatures were 21±2/17±2°C. Relative humidity was about 60±5%. Until full growth, plants were fertigated with 150 mL (this volume of nutrient solution was chosen with respect to RH, average temperature, sunlight and pots size) of 1/2 strength Hoagland nutrient solution and then after full establishment of plants with 150 mL of 1strength Hoagland nutrient solution once a day. Excess nutrient solutions were allowed to pass through the containers to ensure salt stress in the root medium at a given concentration, also to avoid anoxia by water logging. Fully expanded and mature leaves were used for measurements. Bulk samples were analyzed (one leaf from each pot).
On day 6 of the 1st week, leaves samplings were started and on the following day, plants in groups 3, 4, 5 and 6 were sprayed with SA. On day 6 of the 2nd week, the second round of leaves samplings were carried out and on the following day (day 14th), plants in groups 7 and 8 were sprayed with SA solution. From day 14th onwards salt treatment was started for groups 2, and 5-10 by adding 40 mM NaCl to Hoagland nutrient solution and was continued till the end of experiment. In order to avoid precipitation, nutrient solution was stirred after NaCl addition. On day 6 of the 3rd week, the third round of sampling was carried out, and on the following day (day 21st after the start of the experiment), groups 9 and 10 were sprayed with SA. On day 7 of 4th week, the fourth round of sampling was carried out. Control plants received only Hoagland nutrient solution and water spray.
2.2Biochemical analyses
For enzyme extraction, fresh leaves (0.5 g) were ground to fine powder in liquid nitrogen with mortar and pestle and then homogenized in 2 mL extraction buffer containing 10% (w/v) polyvinyl pyrrolidone (PVP) in 50 mM potassium-phosphate buffer (pH 8), 0.1 mM ethylene diamine tetra acetic acid (EDTA) and 1 mM dithiothreitol (DTT). The homogenate was centrifuged at 15000×g (4°C) for 30 minutes. The supernatants were used for enzymes analyses.
Glutathione reductase (GR, EC 1.6.4.2) activity was determined by following the rate of glutathione oxidation or GSSG-dependent NADPH oxidation by the decrease in the solutions absorbance at 340 nm. The assay mixture (1 mL final volume) was composed of 0.4 M potassium phosphate buffer (pH 7.5), 0.4 mM Na2EDTA, 5.0 mM GSSG and 100μL of crude extract. The reaction was initiated by the addition of 2.0 mM NADPH. Corrections were made for the background (reaction mixture without NADPH) absorbance at 340 nm. Enzyme activity was expressed as units (μmol of NADPH oxidized per minute) per milligram of protein [13].
Superoxide dismutase (SOD, EC 1.11.1.5) activity was assayed according to Dhindsa et al. [14]. One mL of the reaction mixture contained 13 mM methionine, 25 mM nitro-blue tetrazolium chloride (NBT), 0.1 mM EDTA, 50 mM phosphate buffer (pH 7.8), 50 mM sodium carbonate and 0.1 mL enzyme extract. Reaction was started by adding 2 mM riboflavin and placing the tubes under two 15 W fluorescent lamps for 15 minutes. A complete reaction mixture without enzyme, with maximum color, served as control. Reaction was stopped by switching off the lights and keeping the tubes in dark. A non-irradiated complete reaction mixture served as blank. The absorbance was recorded at 560 nm, and one unit of enzyme activity was taken as the amount of enzyme that reduced the absorbance by 50% in comparison with reaction mixtures without enzyme. SOD activity was expressed as units per milligram of protein per minute.
Catalase (CAT, EC 1.11.1.6) activity was measured spectrophotometrically according to the method of Chance and Maehly [15], by monitoring the decline in absorbance at 240 nm due to H2O2 consumption. One mL of reaction mixture contained 50 mM potassium phosphate buffer (pH 7.0) and 15 mM H2O2. The reaction was initiated by adding 50μL of crude extract to this solution. CAT activity was expressed as units (μmolH2O2 consumed per minute) per milligram of protein.
Peroxidase (POD, EC 1.11.1.7) activity was determined by Chance and Maehly [15] method. One mL of reaction mixture contained 13 mM guaiacol, 5 mM H2O2 and 50 mM potassium phosphate buffer (pH 7). Increase in absorbance due to oxidation of guaiacol (extinction coefficient: 26.6 mM- 1•cm- 1) was monitored at 470 nm for a minute. Peroxidase activity was expressed as units (μmol guaiacol oxidized per minute) per milligram of protein.
Ascorbate peroxidase (APX, EC 1.11.1.11) activity was measured spectrophotometrically according to Nakano and Asada [16] by following the decline in absorbance at 290 nm due to ascorbate oxidation. The oxidation rate of ascorbate was estimated between 1 and 60 seconds after starting the reaction with the addition of H2O2. One mL of reaction mixture contained 50 mM potassium phosphate buffer (pH 7), 0.5 mM ascorbate, 0.15 mM H2O2, 0.1 mM EDTA and 50μL of enzyme extract. APX activity was expressed as units (μmol of ascorbate oxidised per minute) per milligram of protein.
Protein concentration was determined according to Bradford [17] by using bovine serum albumin as standard.
Total phenolic content was determined with Folin-Ciocalteu reagent using gallic acid as standard. In brief, 1 g of leaf samples was placed in an Eppendorf tube, with 1 mL of methanol (80%), grinded at 4 °C and centrifuged (15000×g) for 15 min. The extract was mixed with 0.5 mL of Folin-Ciocalteu reagent (diluted 1:1 with water) and then 1 mL of a 5% sodium carbonate solution was added. After 30 min, solutions absorbance were read at 725 nm and expressed as mg phenolic comounds•g- 1 fresh weight.
Leaves proline content was determined by the method of Bates et al. [18]. Leaf segments were homogenized with 3% sulfosalicylic acid and the homogenate was centrifuged at 2500×g for 20 min. The supernatant was treated with acetic acid and acid ninhydrin, boiled for 1 h and then the solutions absorbance were read at 520 nm. Leaves proline contents were expressed as μmol•g- 1 fresh weight. Proline amino acid was used as standard.
Glycine betaine was estimated according to the method of Grieve and Grattan [19]. The freeze-dried plant material was finely ground, mechanically shaken with 20 mL deionized water for 48 h at 25 °C. The samples were then filtered and the filtrates were diluted 1:1 with 2 M H2SO4. Aliquots were placed in centrifuge tubes and cooled in ice water for 1 h. Cold KI-I2 reagent was added and the reactants were gently stirred with a vortex mixer. The tubes were stored at 4 °C for 16 h and then centrifuged at 15000×g for 20 min at 0 °C. The supernatant was carefully aspirated. The periodide crystals were dissolved in 1, 2-dichloroethane and then the solutions absorbance were read at 365 nm using glycine betaine as standard. Glycine betaine content was ex-pressed as μmol•g- 1 fresh weight.
Total yield was determined by adding the weight of all fruits produced during 2 months (the duration of the experiments plus four more weeks) and expressed as grams per plant.
2.3Experimental design and statistical analysis
The experiments were carried out as bi-factorial in a completely randomized design (10 treatments×4 times measuring). Each treatment category was considered as a level of the first factor, that is 10 levels, and the second factor, that is time of measurement (all parameters were measured weekly for 4 weeks), with four replications with three pots in each replication. Data were analyzed by SPSS 16 (ANOVA test) and means were compared using Duncan’s multiple range test at 5% probability level.
3Results
Salinity caused a significant increase in the activity of all antioxidant enzymes. Activity of SOD, CAT, APX, POD and GR increased by 1.74, 1.37, 2.33, 1.62 and 2.45 folds respectively as compared to control. Application of 0.5 and 1.0 mM SA solution under non-saline conditions caused a significant decrease in CAT and APX activity (Table 1). Applying 0.5 and 1.0 mM SA one week before, during and one week after salt treatment did not have significant effects on plants CAT activity. Irrespective of concentrations and time of application, SA treatment increased plants SOD, GR and POD activities (Table 1). The highest antioxidant enzymes activity was observed 3 and 4 weeks after plants were treated with salinity or SA (Table 2). Maximum SOD, CAT and GR activities were observed in the 3rd or 4th week of the experimental period in plants treated with SA (irrespective of SA levels) one week before being exposed to salinity stress (Fig.1a, b, and d). In week 2, the APX activity in plants, treated with either 0.5 mM or 1.0 mM SA and in those treated with 0.5 mM SA and then NaCl or with 1.0 mM SA and then NaCl treatment, the APX activity was decreased significantly (Fig. 1c).
Leaves proline content increased significantly when plants were exposed to salinity or treated with 0.5 or 1.0 mM SA. The latter treatments caused about 30% rise in leaves proline content under non-saline conditions. The maximum amount of leaves proline content observed in plants treated with salinity plus 1.0 mM SA (Table 3). In week 3 or 4, the highest amount of leaves proline was found in plants treated with salinity and/or SA which was about 2.4 times higher than the amount was present in week 1 (Fig. 2a).
The amount of leaves glycine betaine content in plants treated with salinity alone was up to 34% higher than in control. Similar increase in the leaves glycine betaine content was observed in plants treated with SA (0.5 or 1.0 mM) alone. However, the rise in leaves glycine betaine was even higher in plants treated with salinity and sprayed with 0.5 or 1.0 mM SA (Table). Leaves glycine betaine in week 3 or 4 was significantly higher than in week 1 or 2 (Table 4). Spraying plants with 0.5 or 1.0 mM SA solutions without salt treatment, caused a progressive increase in leaves glycine betaine content up to day 10 and then started to decrease. The maximum amount of leaves glycine betaine content was observed in week 3 or 4 in plants treated with 0.5 mM SA treatment and then NaCl, although the amount was not statistically different from the one observed in week 3 or 4 in plants treated with SA one week before, during or one week after salt treatment (Fig. 2b).
Leaves total polyphenols increased up to 28% in salt treated plants. Spraying plants with 0.5 or 1.0 mM SA solution under non-saline conditions increased this parameter, in comparison to control. The maximum amount of leaves total polyphenols was observed in plants treated with 0.5 or 1.0 mM SA and then NaCl (Table 3). Leaves total polyphenols, was significantly higher in week 3 or 4 than in week 1 or 2 (Table 4). The highest amount of leaves polyphenols (25.11 mg. g- 1 FW) was observed in week 3 in plants treated with 0.5 mM SA and then NaCl. However, the amount was not statistically different than in week 3 or 4 in salt-stressed plants sprayed with SA (0.5 or 1.0 mM) at all application times (Fig. 2c).
Leaves protein content decreased significantly (about 11%) in plants exposed to salinity. However, under non-saline conditions, spraying plants with0.5 or 1.0 mM SA solution, caused an increase in leaves protein content. Under saline conditions, SA application one week before or simultaneously with the initiation of salinity treatment, reduced leaves protein degradation (Table 3). This SA effect was significantly higher in week 2 of the experimental period (Table 4). In week 4, salt-stressed plants sprayed with SA (0.5 or 1.0 mM), one week before or simultaneously with the initiation of salt stress, their leaves protein was not significantly different from control (Fig. 2d).
Maximum plant productivity occurred in plants treated with 0.5 mM SA solution. Plants exposed to salinity but not sprayed with SA, their productivity was reduced by 50%. The productivity of plants under salt stress but sprayed with SA was also reduced. However, the reduction was still less than those exposed to salt stress but sprayed with distilled water (Fig. 3).
4Discussion
The increase in the activity of SOD, APX, GR, CAT and POD in plants exposed to salt stress has been reported by various authors for different plant species [20, 21]. The production of ROS in plants under salt stress is well documented [22]. Plants have developed some complex enzymatic and non-enzymatic antioxidant systems to cope with the damages incurred by ROS. Demiralay et al. [23] have reported an increase in the activities of CAT and APX in Ctenanthesetosa plants under osmotic stress conditions. Similar reports were given by Szepesi et al. [24] who showed an increase in CAT activity in the roots of salt stressed tomato plants. Increased activation of antioxidant enzymes can improve salt tolerance by their actions in scavenging ROS [25]. In our study the activities of SOD, GR and CAT increased following SA treatments. Similarly, it has been reported that the activities of CAT and APX have increased following the application of SA solution as spray on maize plants grown under saline conditions [26]. Also, the activity of GR has stimulated by SA in vivo, when applied exogenously on maize plants [27]. Tobacco plants growing in vitro in the presence of 0.01 or 0.1 mM SA showed increased GR activity in their shoots. In our study, SA decreased the activities of CAT and APX under non-saline conditions. These results are in agreement with previous studies as this hormone is capable of binding to CAT and APX enzymes, inhibiting their activities leading to increased ROS levels which will act as a secondary stress signal to enhance the activities of other antioxidant enzymes [28].
In agreement with other studies [29], in the present investigation, salinity and/or SA spray, caused an increase in leaves proline and glycine betaine content. Osmolytes accumulation such as proline and glycine betaine is considered as an adaptive mechanism in plants under osmotic stress [30]. Also, SA application is known to increase plants endogenous proline content by inducing its de novo synthesis [31, 32]. Hoyos and Zhang [33] showed that induction of glycine betaine synthesis by SA could be due to the activation of a protein kinase under osmotic stress. The amount of leaves polyphenols increased after plants exposure to saline conditions and/or SA spray. Increase in polyphenols under saline conditions is considered as plants protective reaction against abiotic stresses [34, 35].
Effects of temporal application of SA were also significant, as plants treated with 0.5 or 1.0 mM SA and then NaCl, had higher shoot fresh weight, chlorophyll content, leaf area, number of inflorescences, total fruits polyphenols (data not shown), SOD and GR activities as compared with plants treated with SA solution (0.5 or 1.0 mM) one week after salt application. In our previous study, in these plants shoot N content was significantly higher and shoot Cl accumulation was lower than control [36]. According to the findings of Mutlu et al. [37] SA effect on plants physiological responses is time dependent. They reported that the application of 0.1 mM SA decreased freezing injury in two barley varieties for at least 24 days. After SA application a period begins during which plant are more tolerant against abiotic stresses and this can be due to: 1. A more vigorous plants antioxidant response to stresses. Increased levels of enzymatic and non-enzymatic antioxidants can protect plants against the damaging effects of ROS more efficiently. 2. Changes in mineral absorption. It has been hypothesized that alteration in mineral uptake by SA application might be one of the mechanisms responsible for the alleviating effects of SA on salt stress [8]. SA-mediated restoration of membrane potential and prevention of salt-induced K+-loss via a GORK channel, and eventually improved salinity-tolerance has been evinced in A. thaliana. In long term treatments, SA increased shoot K+ and decreased shoot Na+ contents. SA pretreatment ameliorates salinity stress by counteracting NaCl-induced membrane depolarization and by decreasing K+ efflux [38]. In our study, highest K/Na ratios in shoots or roots were observed in plants grown under non-stress conditions and sprayed with 1.0 mM SA solution (data not shown here). Also plants treated with SA and then with NaCl had greater leaf relative water content and yield and lower leaf electrolyte leakage compared with plants treated with NaCl and then with SA. Application of SA solution (1.0 mM) one week before initiation of salt stress resulted in greater root Mg and shoots Ca concentrations in comparison to NaCl and then SA1.0 treatment [36]. The higher concentrations of essential elements such as N, K, Ca and Mg in different parts of plants pretreated with SA can eventually mitigate some of the injuries induced by increased Na and/or Cl ions. 3. Possible effects of SA on other endogenous plants hormones. Szepesi et al. [39] reported that SA may induce and elevate the biosynthesis of polyamines in SA-pretreated-tomato plants which were under the influence of saline conditions.
After SA application, plant becomes more salt tolerant. So when this increase in salt tolerance is achieved before the stress initiation, the possibilities of salt-induced injuries become less likely. Application of SA after stress initiation may also help the plants, but since the stress has already harmed the plants, SA application may help to maintain the current conditions, prevent further damages and even induce some recovery.
References
[1] | Wassmann R , Jagadish SVK , Heuer S , Ismail A , Redona E , Serraj R , Singh RK , Howell G , Pathak H . Climate change affecting rice production: The physiological and agronomic basis for possible adaptation strategies. Adv Agron. (2009) ;101: :59–122. |
[2] | Ahmad P , Sharma S . Salt stress and phyto-biochemical responses of plants. Plant Soil Environ. (2008) ;54: (3):89–99. |
[3] | Apel K , Hirt H . Reactive oxygen species: Metabolism, oxidative stress and signal transduction. Ann Review Plant Biol. (2004) ;55: :1331–41. |
[4] | Deinlein U , Stephan AB , Horie T , Luo W , Xu G , Schroeder JI . Plant salt-tolerance mechanisms. Trend Plant Sci. (2014) ;19: (6):371–9. |
[5] | Metraux JP . Recent breakthroughs in the study of salicylic acid biosynthesis. Trends Plant Sci. (2002) ;7: :332–4. |
[6] | Stevens J , Senaranta T , Sivasithamparam K . Salicylic acid induces salinity tolerance in tomato cv. ‘Roma’: Associated changes in gas exchanges, water relations and memberane stabilization. Plant Growth Regul. (2006) ;49: :77–83. |
[7] | Lederer B , Böger P . Antioxidative responses of tobacco expressing a bacterial glutathione reductase. Zeitschriftfür Naturforschung. (2003) ;58: :843–9. |
[8] | Karlidag H , Yildirim E , Turan M . Salicylic acid ameliorates the adverse effect of salt stress on strawberry. Scientia Agricola. (2009) ;66: (2):180–7. |
[9] | Tohma O , Esitken A . Response of salt stressed strawberry plants to foliar salicylic acid pre-treatments. J Plant Nutr. (2011) ;34: 4:590–9. |
[10] | Wasti S , Mimouni H , Smiti S , Zid E , Ben-Ahmed E . Enhanced salt tolerance of tomatoes by exogenous salicylic acid applied through rooting medium. J Integ Biol. (2012) ;16: :1–8. |
[11] | Saied AS , Keutgen AJ , Noga G . The influence of NaCl salinity on growth, yieldand fruit quality of strawberry cvs. ‘Elsanta’and ‘Korona’. Sci Hort. (2005) ;103: (3):289–303. |
[12] | Sun Y , Niu G , Wallace R , Masabni J , Gu M . Relative Salt Tolerance of Seven Strawberry Cultivars. Horticulturae. (2015) ;1: :27–40. |
[13] | Foyer C , Halliwell B . The presence of glutathione and glutathione reductase in hloroplasts: A proposed role in ascorbic acid metabolism. Planta. (1976) ;133: :21–25. |
[14] | Dhindsa RS , Dhindsa PP , Thorpe TA . Leaf senescence correlated with increased levels of membrane permeability and lipid-peroxidation and decreased levels of superoxide dismutase and catalase. J Exp Bot. (1980) ;32: :93–101. |
[15] | Chance B , Maehly AC . Assay of catalase and peroxidase. Meth Enzym. (1955) ;2: :764–75. |
[16] | Nakano Y , Asada K . Hydrogen peroxide is scavenged by ascorbate-specific peroxidase in spinach chloroplasts. Plant Cell Physiol. (1981) ;22: :867–80. |
[17] | Bradford M . A rapid and sensitive method for the quantitation of microgram quantities of protein utilizing the principle of protein-dye binding. Analytic Biochem. (1976) ;72: :248–54. |
[18] | Bates LS , Waldren RP , Teare ID . Rapid determination of free proline for water-stress studies. Plant Soil. (1973) ;39: :205–7. |
[19] | Grieve CM , Grattan SR . Rapid assay for determination of water soluble quaternary ammonium compounds. Plant Soil. (1983) ;70: :303–7. |
[20] | Azooz MM , Youssef AM , Ahmad P . Evaluation of salicylic acid (SA) application on growth, osmotic solutes and antioxidant enzyme activities on broad bean seedlings grown under diluted seawater. Int J Plant Physiol Biochem. (2011) ;3: :253–64. |
[21] | Koyro HW , Ahmad P , Geissler N . Abiotic stress responses in plants: An overview, In: Ahmad P, Prasad MNV, editors. Environmental adaptations and stress tolerance of plants in the era of climate change.. New York: Springer Science+Business Media; (2012) ;1–28. |
[22] | Ahmad P , Hakeem KR , Kumar A , Ashraf M , Akram NA . Salt-induced changes in photosynthetic activity and oxidative defense system of three cultivars of mustard (Brassica juncea L). Afr J Biotechnol. (2012) ;11: (11):2694–703. |
[23] | Demiralay M , Saglam A , Kadioglu A . Salicylic acid delays leaf rolling by inducing antioxidant enzymes and modulating osmoprotectant content in Ctenanthesetosa under osmotic stress. Turk J Biol. (2013) ;37: :49–59. |
[24] | Szepesi A , Poór P , Gémes K , Horváth E , Tari I . Influence of exogenous salicylic acid on antioxidant enzyme activities in the roots of salt stressed tomato plants. Acta Biol Szegediensis. (2008) ;52: (1):199–200. |
[25] | Alscher RG , Erturk N , Heath LS . Role of superoxide dismutases (SODs) in controlling oxidative stress in plants. J Exp Bot. (2002) ;53: :1331–41. |
[26] | El-Khallal SM , Hathout STA , Raheim A , Ahsour A , Almalik A , Kerrit A . Brassinolide and salicylic acid induced antioxidant enzymes, hormonal balance and protein profile of maize plants grown under salt stress. Res J Agric Biol Sci. (2009) ;5: (4):391–402. |
[27] | Janda T , Szalai G , Tari I , Paldi E . Hydroponic treatment with salicylic acid decreases the effects of chilling injury in maize (Zea mays L). plants. Planta. (1999) ;208: :175–180. |
[28] | Belkadhi A , De Haro A , Soengas P , Obregon S , Cartea ME , Djebali W , Chaïbi W . Salicylic acid improves root antioxidant defense system and total antioxidant capacities of flax subjected to cadmium. OMICS. (2013) ;17: (7):398–406. |
[29] | Shakirova FM , Sakhabutdinova AR , Bezrukova MV , Fatkhutdinova RA , Fatkhutdinova DR . Changes in the hormonal status of wheat seedlings induced by salicylic acid and salinity. Plant Sci. (2003) ;164: :317–22. |
[30] | Rai VK . Role of amino acids in plant responses to stress. J Plant Biol. (2002) ;45: (4):481–7. |
[31] | Hayat Q , Hayat S , Irfan M , Ahmad A . Effect of exog–enous salicylic acid under changing environment: A review. Environ Exp Bot. (2010) ;68: :14–25. |
[32] | Hayat Q , Hayat S , Alyemeni MN , Ahmad A . Salicylic acid mediated changes in growth, photosynthesis, nitrogen metabolism and antioxidant defense systemin Cicer arietinum L. Plant. Soil Environ. (2012) ;58: (9):417–23. |
[33] | Hoyos ME , Zhang S . Calcium-independent activation of salicylic acid-induced protein kinase and a 40-kilodalton protein kinase by hyperosmotic stress. Plant Physiol. (2000) ;122: :1355–63. |
[34] | Keutgen AJ , Pawelzik E . Quality and nutritional value of strawberry fruit under long term salt stress. Food Chem. (2008) ;107: :1413–20. |
[35] | Neves GS , Marchiosi R , Ferrarese MLL , Siqueira-Soares C , Ferrarese-Filho O . Root growth inhibition and ligni fi cation induced by salt stress in soybean. J Agron Crop Sci. (2010) ;196: :467–73. |
[36] | Jamali B , Eshghi S . Salicylic acid-induced salinity redressal in hydroponically grown strawberry. Comm. Soil Sci. Plant Anal. (2015) ;46: (12):1482–93. |
[37] | Mutlu S , Karadagoglu O , Atici O , Tasgin E , Nalbantoglu B . Time-dependent effect of salicylic acid on alleviating cold damage in two barley cultivars differing in cold tolerance. Turk J Bot. (2013) ;37: :343–9. |
[38] | Jayakannan M , Bose J , Babourina O , Rengel Z , Shabala S . Salicylic acid improves salinity tolerance in Arabidopsis by restoring membrane potential and preventing salt-induced K+ loss via a GORK channel. J Exp Bot. (2013) ;64: (8):2255–68. |
[39] | Szepesi A , Gémes G , Orosz AP , Zoltán M , Vorák U , Tari I . Interaction between salicylic acid and polyamines and their possible roles in tomato hardening processes. Acta Biol Szegediensis. (2011) ;55: (1):165–6. |
Figures and Tables
Fig.1
Changes of enzymatic antioxidants SOD (a), CAT (b), APX (c), GR (d) and POD (e) activities during experimental period. Columns with the same letters represent means not differing at 5% probability using Duncan’s multiple range test. Vertical bars indicate standard error (n = 4).
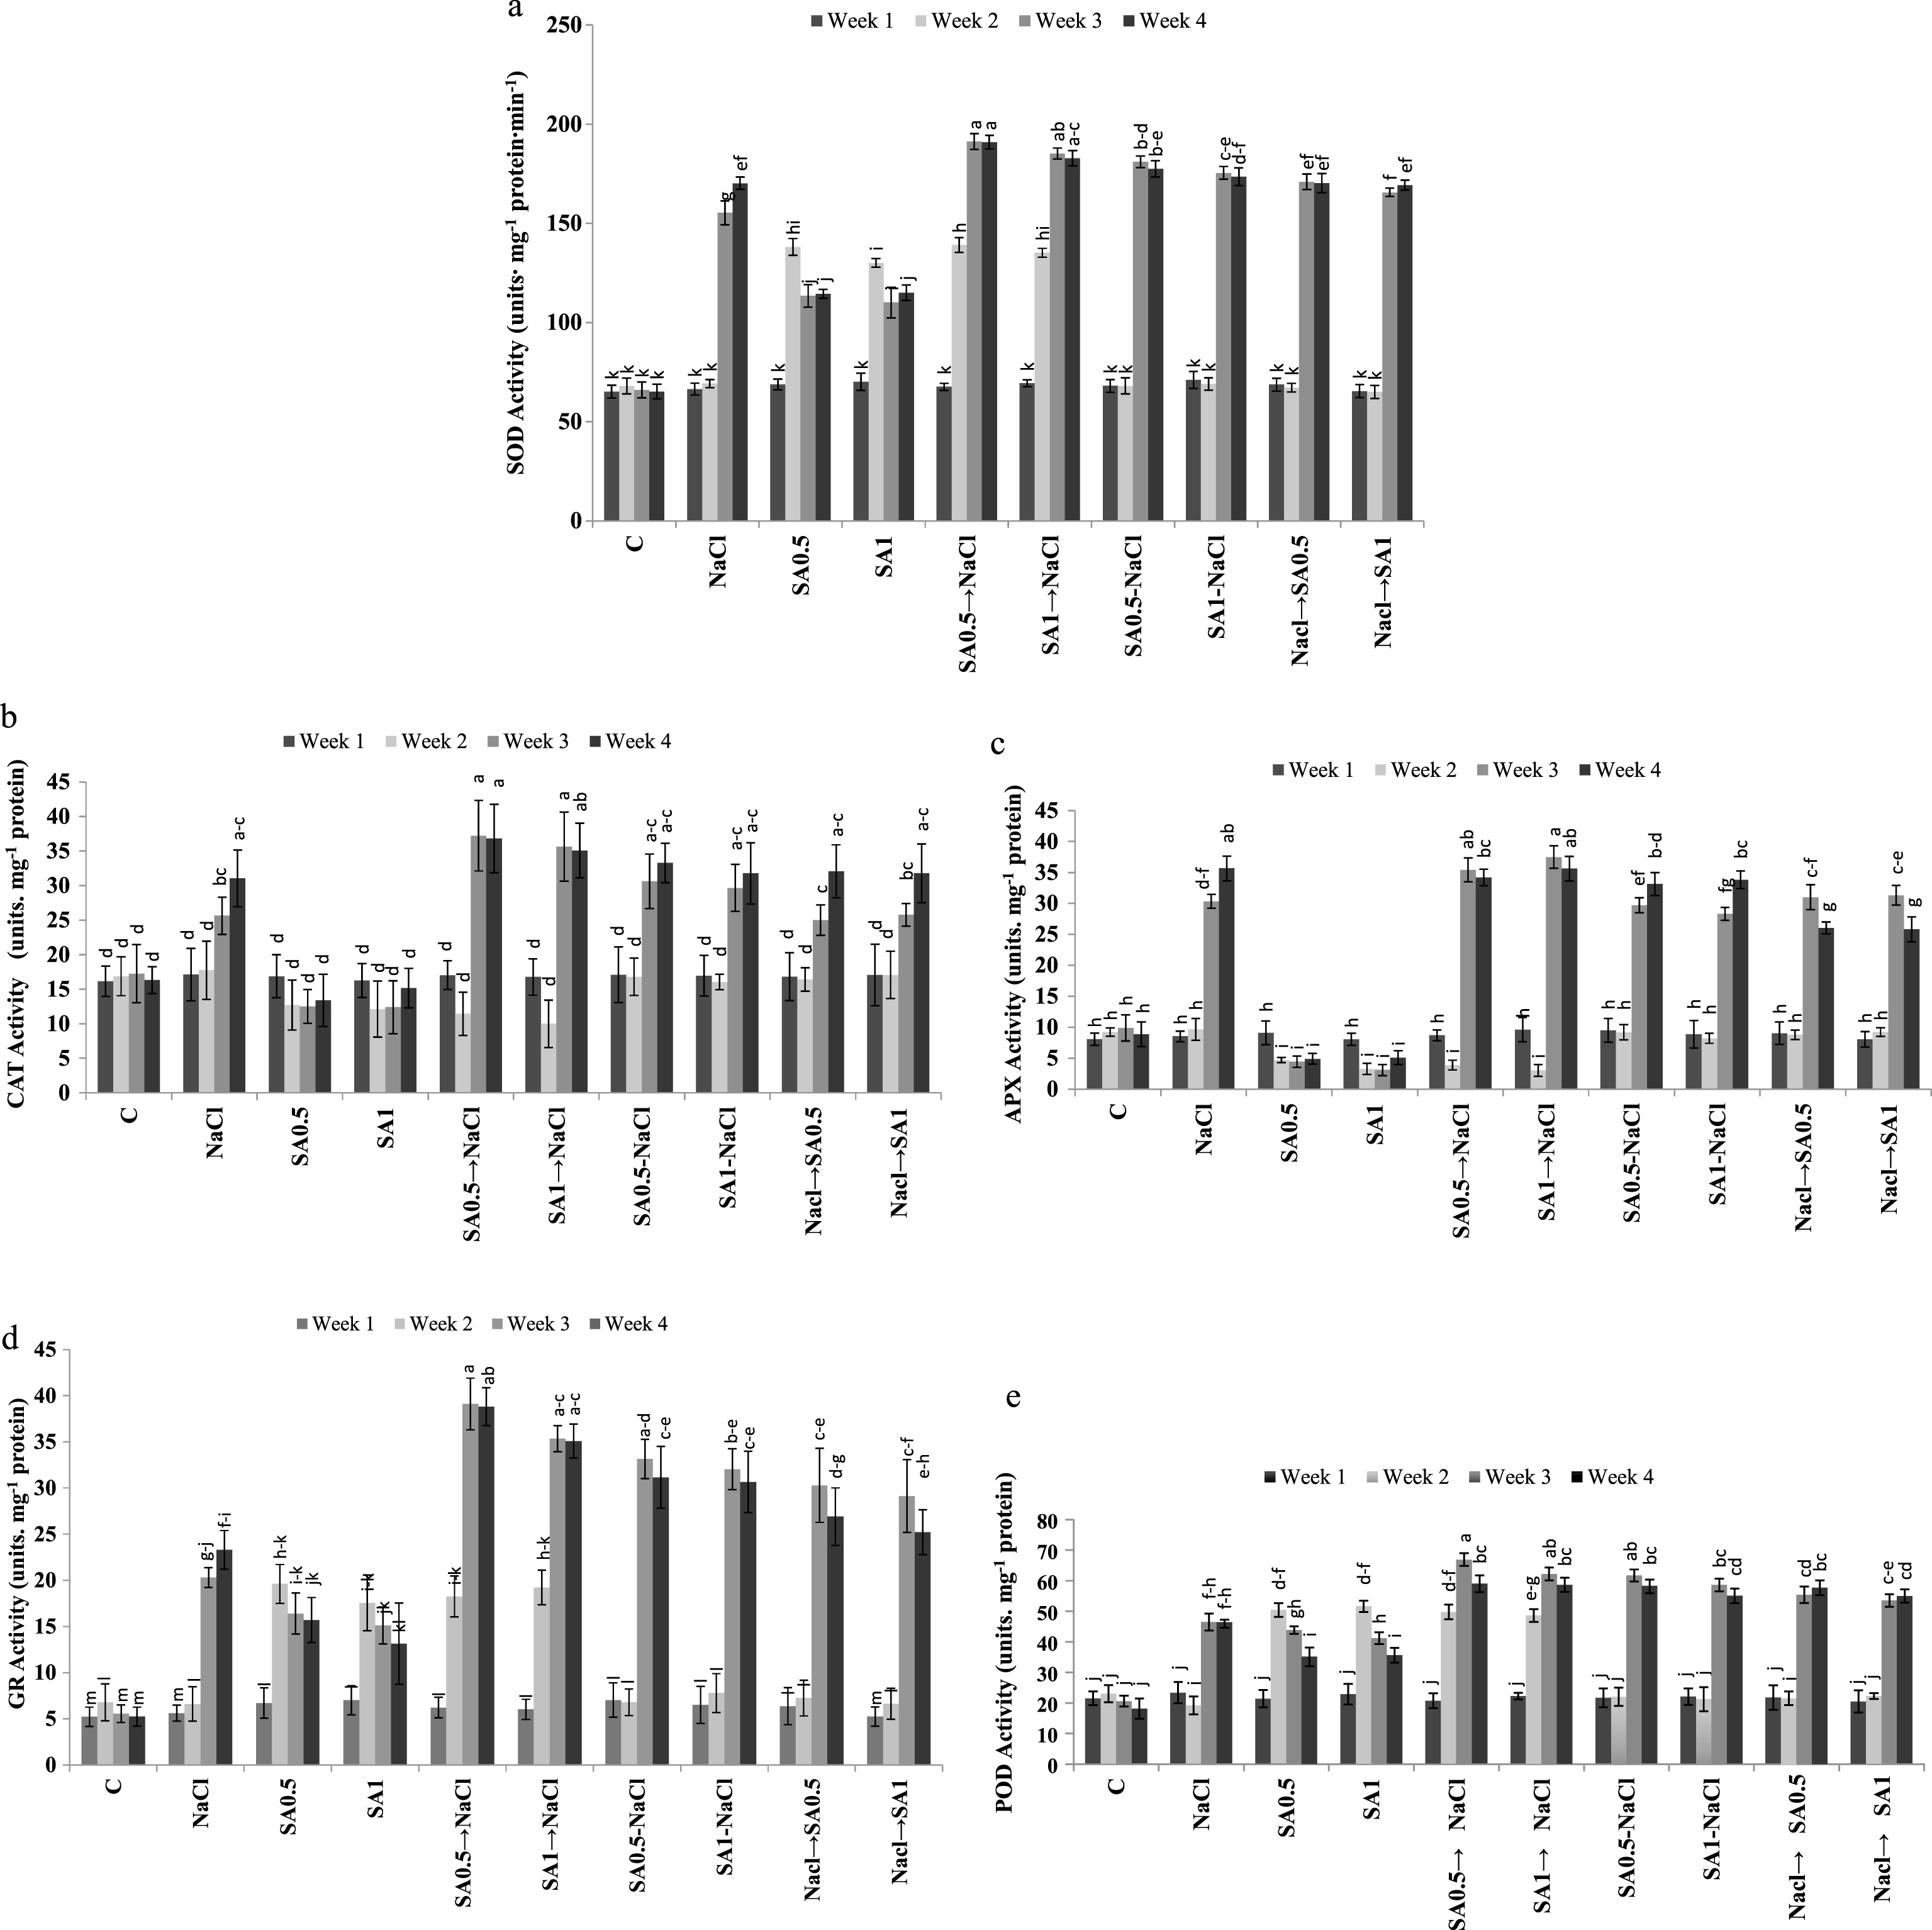
Fig.2
Changes of leaves proline (a), glycine betaine (b), polyphenols (c) and proteins (d) during experimental period. Columns with the same letters represent means not differing at 5% probability using Duncan’s multiple range test. Vertical bars indicate standard error (n = 4).
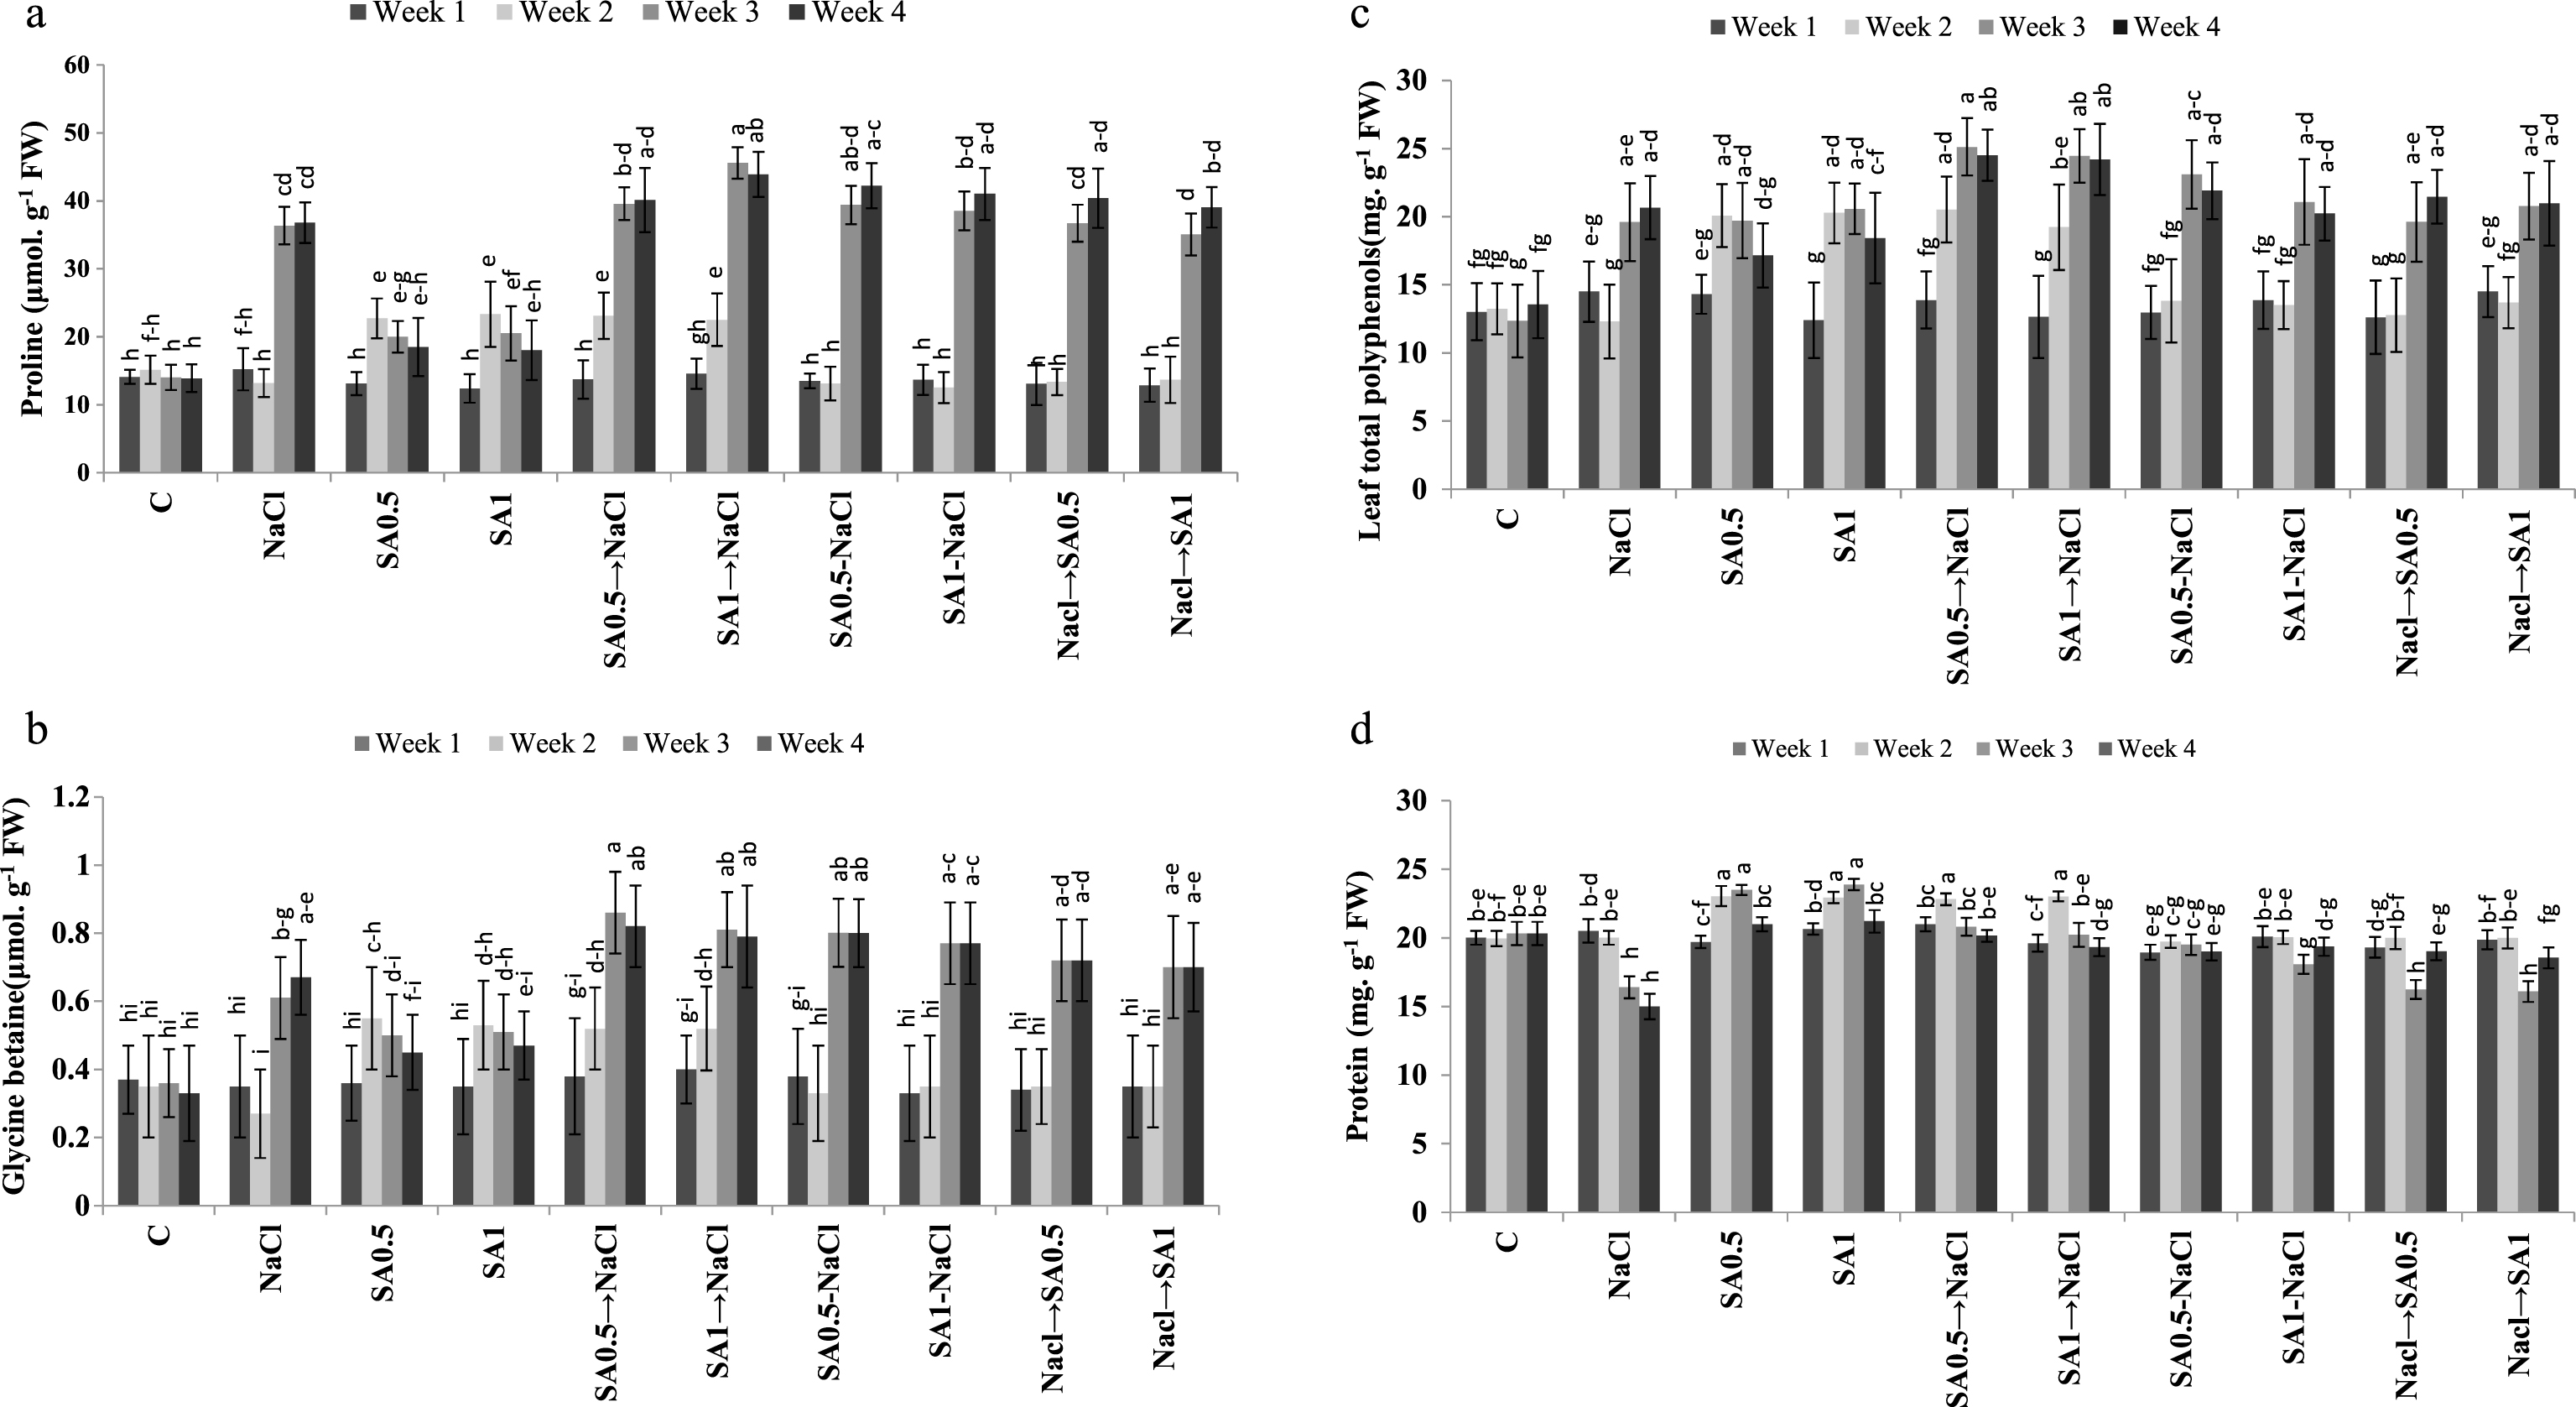
Fig.3
Total fruits yield. Columns with the same letters represent means not differing at 5% probability using Duncan’s multiple range test. Vertical bars indicate standard error (n = 4).
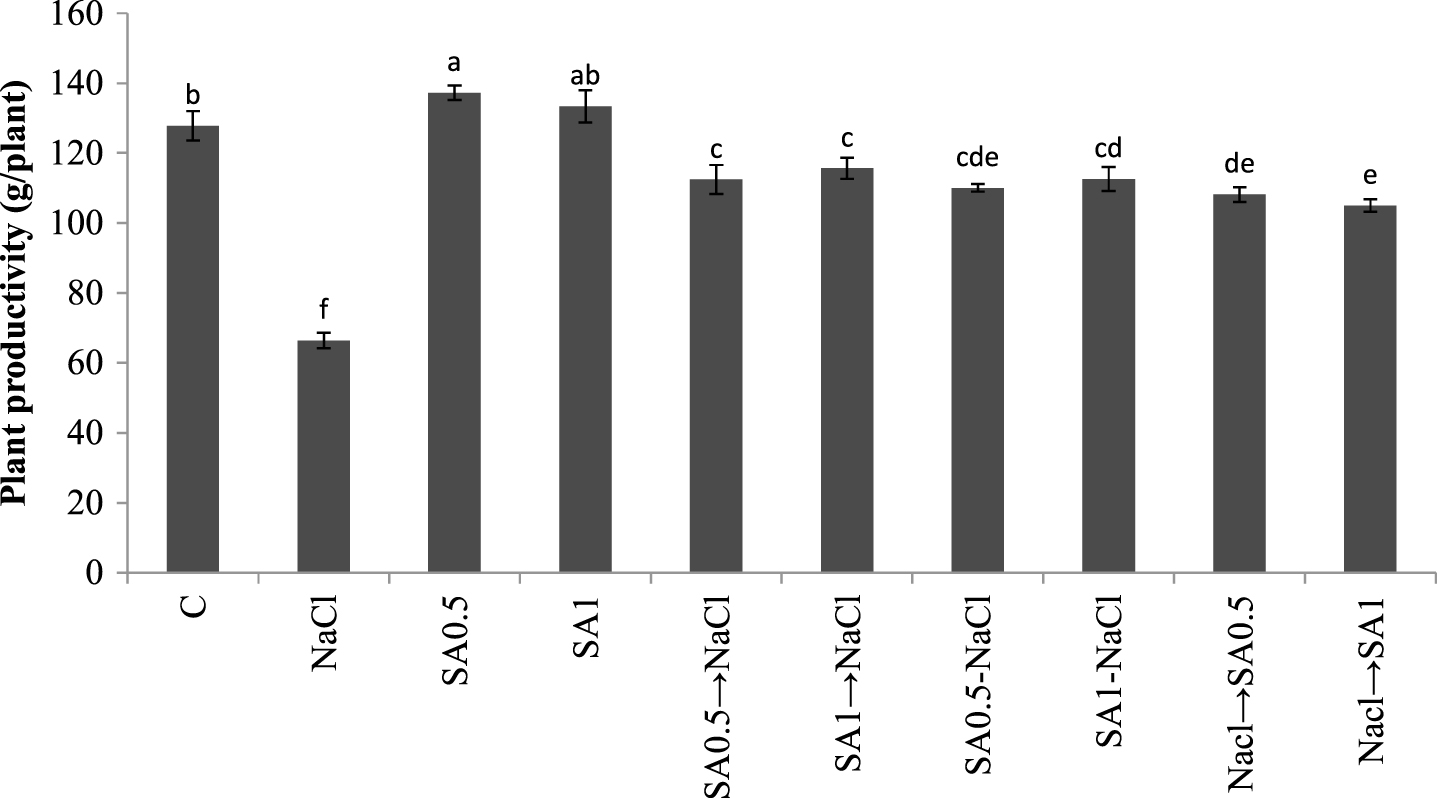
Table 1
Effects of 0.5 and 1.0 mM SA solution on the activity of some antioxidant enzymes s in ‘Selva’ strawberry plants grown under saline (40 mM NaCl) and non-saline conditions
| Treatments | SOD | CAT | APX | GR | POD |
| (units•mg- 1 protein•min- 1) | (units.mg- 1 protein) | ||||
| Control | 66.14±2.43g | 16.65±1.03b | 9.02±0.41d | 5.69±1.05e | 20.79±1.87e |
| NaCl | 115.31±1.11e | 22.88±1.68a | 21.04±0.82ab | 13.96±1.10d | 33.73±2.11d |
| SA(0.5) | 108.72±2.10f | 13.86±1.41b | 5.8±0.78e | 14.60±1.25cd | 37.69±1.61c |
| SA(1.0) | 106.37±1.98f | 13.97±0.95b | 4.88±0.61e | 13.20±1.33d | 37.83±1.44c |
| SA(0.5)⟶NaCl | 147.23±1.10a | 25.62±1.91a | 20.55±0.65ab | 25.59±1.25a | 49.10±1.22a |
| SA(1.0)⟶NaCl | 143.16±1.05b | 24.37±1.37a | 21.44±0.79a | 23.92±1.57a | 47.92±1.25a |
| SA(0.5) -NaCl | 123.67±2.11c | 24.44±2.11a | 20.38±0.72ab | 19.53±1.46a | 40.88±1.25b |
| SA(1.0) -NaCl | 122.28±1.06c | 23.61±1.51a | 19.80±0.63bc | 19.24±1.23b | 39.23±1.11bc |
| NaCl⟶SA(0.5) | 119.31±1.47d | 22.57±2.05a | 18.71±0.70c | 17.70±1.72bc | 39.10±2.10bc |
| NaCl⟶SA(1.0) | 116.36±1.40e | 22.91±1.07a | 18.6±53c | 16.54±1.61bcd | 37.82±1.51c |
z Means followed by the same letters within columns are not different at 5% probability using Duncan’s test. All data indicated Mean±standard error (n = 4).
Table 2
The activity of some antioxidant enzymes in ‘Selva’ strawberry plants under 40 mM NaCl saline and non- saline conditions with respect to the times of analyses
| Treatments | SOD | CAT | APX | GR | POD |
| (units•mg- 1 protein•min- 1) | (units.mg- 1 protein) | ||||
| Week 1 | 68.18±2.10c | 16.81±1.95b | 8.76±0.61b | 6.192±0.96c | 21.80±1.45d |
| Week 2 | 94.90±3.40b | 14.72±2.41b | 6.92±0.75c | 11.64±0.68b | 32.96±2.07c |
| Week 3 | 151.46±3.56a | 25.16±1.82a | 24.10±0.86a | 25.64±1.07a | 51.05±1.13a |
| Week 4 | 152.94±2.33a | 27.66±2.11a | 24.31±1.07a | 24.51±1.11a | 47.83±1.23b |
z Means followed by the same letters within columns are not different at 5% probability using Duncan’s test. All data indicated Mean±standard error (n = 4).
Table 3
Effects of 0.5 or 1.0 mM SA solution on leaves proline, glycine betaine, polyphenols and proteins contents in strawberry ‘Selva’ plants grown under 40 mM NaCl saline or non-saline conditions
| Treatments | Proline (μmol.g- 1 FW) | Glycine betaine (μmol.g- 1 FW) | Total polyphenols (mg.g- 1 FW) | Total protein (mg.g- 1 FW) |
| Control | 14.29±2.05e | 0.35±0.04e | 13.03±1.00d | 20.15±0.66bc |
| NaCl | 25.39±1.49c | 0.47±0.02cd | 16.76±1.02c | 17.98±0.66e |
| SA(0.5) | 18.58±1.57d | 0.46±0.03d | 17.81±1.10bc | 21.81±0.88a |
| SA(1.0) | 18.55±1.28d | 0.46±0.06d | 17.91±1.00bc | 22.17±0.65a |
| SA(0.5)⟶NaCl | 29.13±1.25ab | 0.64±0.05a | 21.00±0.93a | 21.19±0.84a |
| SA(1.0)⟶NaCl | 31.62±1.31a | 0.63±0.05ab | 20.13±1.01ab | 20.54±0.72b |
| SA(0.5) -NaCl | 27.06±1.10bc | 0.57±0.04abc | 17.95±0.85bc | 19.29±0.51cd |
| SA(1.0) -NaCl | 26.43±0.97bc | 0.55±0.06abcd | 17.17±0.97b | 19.39±0.63cd |
| NaCl⟶SA(0.5) | 25.87±1.06c | 0.53±0.05bcd | 16.61±1.08c | 18.64±0.51de |
| NaCl⟶SA(1.0) | 25.16±1.22c | 0.52±0.06bcd | 17.48±1.00c | 18.65±0.75de |
z Means followed by the same letters within columns are not different at 5% probability using Duncan’s test. All data indicated Mean±standard error (n = 4).
Table 4
The leaves proline, glycine betaine polyphenols and proteins contents in ‘Selva’ strawberry plants grown under 40 mM NaCl saline and in non-saline conditions, with respect to the time of analyses
| Treatments | Proline (μmol.g- 1 FW) | Glycine betaine (μmol.g- 1 FW) | Total polyphenols >(mg.g- 1 FW) | Total protein (mg.g- 1 FW) |
| Week 1 | 13.62±1.22c | 0.36±0.02b | 13.47±1.15c | 19.97±0.21b |
| Week 2 | 17.26±2.05b | 0.41±0.08b | 15.94±1.30b | 21.67±0.47a |
| Week 3 | 32.57±0.95a | 0.66±0.11a | 20.63±2.20a | 19.50±0.37b |
| Week 4 | 33.38±1.71a | 0.65±0.08a | 20.30±1.28a | 19.29±0.55b |
z Means followed by the same letters within columns are not different at 5% probability using Duncan’s test. All data indicated Mean±standard error (n = 4).


