
Optimization of cultural practices to reduce the development of Pseudomonas syringae pv. actinidiae, causal agent of the bacterial canker of kiwifruit
Abstract
BACKGROUND: The bacterial canker of kiwifruit, caused by Pseudomonas syringae pv. actinidiae (Psa), affects several cultivated Actinidia species, including A. chinensis and A. deliciosa. Its development is related to permissive environmental conditions, such as temperature, humidity, presence of entry points, genetic and physiological features of the host plant. Moreover, also cultural practices influence, directly or indirectly, the disease development.
OBJECTIVE: The role of agricultural practices on disease development and spread was studied.
METHODS: Irrigation, pruning and training systems were tested in the field according to conventional orchard management. Experiments on mineral nutrition, use of bio-regulators and rootstock susceptibility were performed in controlled conditions. Bacterial growth, symptom development and disease incidence were assessed in relation to the different practices.
RESULTS: High nitrogen fertilization, iron deficiency and water stress were related to more severe symptoms. Open canopies allow a better irradiation, aeration, and penetration of phytosanitary treatments. Synthetic gibberellins reduced disease incidence and severity in controlled conditions. Fruits from diseased plants showed a lower quality and storability.
CONCLUSIONS: Dense canopies are harder to manage and more exposed to bacterial canker. Pruning tools and irrigation water are relevant for the bacterial spread.
1Introduction
The bacterial canker of kiwifruit, caused by Pseudomonas syringae pv. actinidiae (Psa), is considered the most dangerous disease of kiwifruit [1], affecting all the cultivated varieties of Actinidia deliciosa andA. chinensis. Although no resistant genotypes are available, different levels of susceptibility were put incorrelation with pathogen colonization of plant tissues [2]. The pathogen can penetrate through natural openings (such as flowers, stomata and lenticels) and wounds [3], and spreads rapidly in the host tissues, causing severe symptoms and crop losses and, eventually, plant death. Disease development is related to conducive climatic and environmental conditions, mostly occurring in spring and autumn: in particular, a temperature between 10 and 20°C, water availability, with rain and wind facilitating the pathogen dispersal [4]. Nutritional imbalances, affected by fertilization and leaf/fruit ratio, may also promote pathogen growth or depress plant defences [5]. Therefore, a combination of cultural practices, such as different training and pruning systems, fertilization and irrigation rates might result in negative conditions for the bacterial colonization of the plant. Furthermore, all of the cultural management practices, affecting the vine vegetative and reproductive performances, are exploited to force productivity, at the expense of other physiological processes. Therefore, the resulting imbalance can adversely affect the plant’s ability to react to abiotic or biotic stress, making it even more susceptible to diseases.
The role of agricultural practices on bacterial canker incidence and development was studied to define the proper orchard management practices, minimizing disease incidence and severity. Therefore, the role of fertilization, irrigation, use of bio-regulators, rootstock, training system and pruning on the incidence and epidemiology of Psa were examined.
Finally, the influence of the disease on fruit production, quality and storability was studied. For this purpose, qualitative parameters of fruits from diseased or healthy plants were analysed at harvest and during storage.
2Materials and methods
2.1Biological material and phytopathometric evaluations
2.1.1Plant material
The experiments in controlled condition were performed on 30 cm tall potted A. deliciosa (cv. Hayward) plants. The growing medium was obtained by mixing 1:1 (v/v) peat and sand, with standard drip irrigation (1.33 L day–1 plant–1). The peat mineral concentration declared by the manufacturer was: NH4+ 25 g m–3, NO3– 35 gm–3; P2O5 104 g m–3, K2O 120 g m–3; MgO 12 g m–3; micronutrients 25 g m–3. The plants were kept at 60% relative humidity (RH), 22°C and with a light-dark cycle of 16:8 hours.
The field trials were performed in commercial orchards, on approximately 10 years old A. deliciosa (cv. Hayward) and A. chinensis (cvs. Hort16A and Jintao) plants. Standard fertirrigation was applied during the whole season.
Micropropagated A. deliciosa (cv. Hayward) plants were maintained on M&S base medium [6], containing sucrose (30 g L–1), myo-inositol (100 mg L–1), thiamine-HCl (1 mg L–1), nicotinic acid (1 mg L–1), pyridoxine (1 mg L–1), glycine (1 mg L–1), indolebutyric acid (0.5 mg L–1), benzylaminopurine (1 mg L–1), GA3 (0.1 mg L–1), adjusted to pH 5.7 with KOH.
2.1.2Bacterial cultures
The bacterial strain used for artificial inoculation was CFBP 7286, genetically modified to express the green fluorescent protein (GFPuv), to facilitate the bacterial recognition in subsequent experimental steps [3]. Prior to inoculation, Psa was grown on Luria-Bertani medium at 27°C for 48 hours.
2.1.3Bacterial population and canker symptom assessment
Phytopathometric assessments were done visually according to a Disease Index [7] based on the percentage of leaf area covered by necrotic spots: (0) healthy leaf; (1) <1% of the leaf area affected; (2) 1–2% of the leaf area affected, single spots, few coalescent spots; (3) 3–4% of the leaf area affected, spots start to coalesce; (4) 5–9% of the leaf area affected, coalescent spots covering veins and increasing in size; (5) >10% of the leaf area affected.
Psa epiphytic populations were obtained by washing sample tissues in 10 mM MgSO4 under vigorous shaking (180 rpm) for 30 minutes. For endophytic populations, the plant tissue was surface-sterilized by washing in ethanol (70%), NaOCl (1%), and twice in sterile water. Subsequently, samples were ground in 5 mL of sterile 10 mM MgSO4.
The resulting plant macerates were serially diluted 1:10 in 10 mM MgSO4; 3 drops of 10 μL for each dilution were plated on Luria-Bertani agarized medium in order to quantify Psa colony forming units (CFU) per ml of extract. Plates were incubated in the dark at 27°C for 48 hours before colony enumeration.
2.2Influence of fertilization on disease development
The influence of nitrogen form, rating and mode of application (root or foliar) were investigated. In addition, the role of micronutrients deficiency or excess on the disease development was studied.
Psa inoculation on plants was done by spraying a 108 CFU mL–1 bacterial suspension in 10 mM MgSO4, one week after treating with the first dose of nitrogen, two weeks after transplanting on micronutrient-deficient medium, or two weeks after the first excess micronutrient supply, according to the experiments. Symptoms developments were monitored weekly.
One month after inoculation, the endophytic population of the pathogen inside each plant was measured. Plant weight, number of new leaves and chlorophyll fluorescence (measured with the PSI equipment, Photon Systems Instruments, Czech Republic) were monitored. On micropropagated plants, carbon exchange was also measured by means of the EGM-4 equipment (PP System international, Amesbury, USA). Each experiment was replicated at least twice over two years. Statistical significance of differences among treatments was assessed by ANOVA followed by Fisher’s Least Significant Difference test with P < 0.05.
2.2.1Nitrogen nutrition
Bacterial canker development was monitored on plants with different nitrogen sources, rates and modes of application. Seedlings of A. deliciosa were transplanted on sand, with no nitrogen fertilization for one month. The following nitrogen fertilizers were tested at the concentration of 0.15 kg N plant–1 (assumed to correspond to 150 kg N ha–1 in field conditions): ammonium nitrate (NH4NO3), ammonium sulphate [(NH4)2SO4] and NPK applied as Poly-Feed [Fertica SA (16N-8P-32K)]. The same amount of P and K provided with the NPK fertilization was also supplied to the plants treated with ammonium nitrate or ammonium sulphate. All fertilizers were applied monthly for 4 times. Biometric and physiological parameters were monitored monthly. After the 4-months nitrogen treatment, plants were spray-inoculated with a 107 CFU mL–1 bacterial suspension. Bacterial canker symptoms were monitored 15, 30 and 40 days after inoculation.
For nitrogen dosage experiments, N-deprived seedlings were treated twice a week with 0, 0.286 or 2.86 mg NH4NO3 per plant, plus 6.75 g K3PO4 in each plant. These amounts were calculated to correspond to 0%, 10% and 100% of standard N application in open field corresponding to 80 kg N ha–1 (equivalent to 0.08 kg plant–1). The 100% N dosage was applied either by root drench or by foliar application.
2.2.2Micronutrients deficiency or excess in vitro and in controlled conditions
Micropropagated A. deliciosa plants were grown on M&S agar supplemented with inorganic salts, except one of the following: Ca, Fe, Mn, B, Zn. Control plants were provided with all M&S inorganic salts. Micronutrient excess was imposed on seedlings of A. deliciosa grown in greenhouse conditions with a standard NPK fertilization, by treating twice a week for two months with: CaSO4 (60 μmol), MnSO4 (2 μmol), ZnSO4 (2 μmol), FeEDTA (50 μmol) or H3BO3 (25 μmol). Control plants did not receive any mineral supplement.
2.3Influence of irrigation on disease development
2.3.1Effect of the irrigation rate in controlled conditions
The water field capacity was determined by drying for 7 days at 110°C an aliquot of soil. Subsequently, water was applied till percolation to determine the volume corresponding to 100% field capacity. A. deliciosa plantswere potted in a known volume of soil and maintained at 100%, 50% or 25% field capacity. Inoculation was performed 3 months after the beginning of the differential irrigation strategy, by spraying a 108 CFU mL–1 bacterial suspension in 10 mM MgSO4. Disease symptoms were assessed 40 days after inoculation. The experiment was replicated twice. Statistical significance of differences among treatments was assessed by ANOVA followed by Fisher’s Least Significant Difference test with P < 0.05.
2.3.2Influence of the water supply source on the spread of the disease in field conditions
Thirty infected commercial orchards located near Faenza (44° 17’ 8” N; 11° 53’ 0” E) were listed according to the source of water supply: artificial reservoirs inside the orchards, or running water from artificial canals (Canale Emiliano Romagnolo, ramification Senio-Lamone) and natural rivers (Marzeno, Senio, Lamone). On each commercial orchard, disease symptoms and spread were monitored monthly for 3 years.
2.4Role of pruning in the disease cycle and curative pruning
The experiments aimed to investigate the role of pruning cuts as possible entry points for Psa, the influence of the different commercial pruning strategies on the disease occurrence, and the migration rate of Psa inside the plant organs.
2.4.1Pruning wounds as possible entry points
The time needed in field conditions by plants to heal the pruning cuts (suberification), preventing Psa invasion, was assessed. The trial was performed in January-February 2013 and 2014 on A. delciosa and A. chinensis adult plants near Bologna (44° 33’ 1 N; 11° 23’ 9” E). Branches were pruned 0, 1, 2, 3, 4, 25, 26, 29, 31 and 32 days before the inoculation date. Pruned branches were detached from the cane and transferred in greenhouse (60% RH, 22°C) where they were inoculated. Inoculation was performed by placing a cotton plug soaked in a bacterial suspension of Psa (108 CFU mL–1) over the open cut. After inoculation all the branches were kept at 100% RH for 2 days. Ten days after inoculation, the samples were surface-sterilized by washing twice in ethanol (70%) and in NaClO (1%) for 3 minutes, followed by three rinses in sterile water. After sterilization, a tissue portion of 3 cm from the cut was excised and Psa endophytic population was determined as previously described.
2.4.2Pruning time
The trials were performed from 2012 till 2014 in a commercial A. deliciosa (cv. Hayward) orchard located in Faenza (44° 15’ 13” N; 11° 52’ 50” E). The orchard was located in a highly infected area. Standard prevention treatments were applied: Bordeaux mixture (BordoFlow® Manica, Rovereto, Italy) equivalent to 20 g ha–1 of active copper every 15 days from November to February and from April to September, Bion® (Syngenta, Basel, Switzerland) at early and full bloom (100 g ha–1). Pruning times are reported in Table 1. After each pruning event, the orchard was sprayed with Bordeaux mixture. Symptom development was monitored until the following October.
2.4.3Pruning systems
Since Pergola vine training is the most widespread in Italy, 3 different pruning strategies were tested on this training system:
– Standard - standard winter pruning practice, with canes reaching the ground;
– Short - the lower part of the canes of the plants is pruned out in spring;
– Zero leaves - on spring pruning, the vigorous shoot of the third leaf over the last fruit is pruned out.
The experiment was carried out in a commercial orchard of A. deliciosa, located in Faenza (Italy, 44° 15’ 13” N; 11° 52’ 50” E). Symptom development was monitored monthly for 1 year. During the experiment, microclimatic data inside the canopy were recorded at hourly intervals. Finally, the penetration of phytosanitary sprays in the different managed canopies was estimated by using a BW-DVR sprayer (Maggio S.r.l., Bari, Italy) with ground speed of 3.9 km.h–1 at 300 kPa with 1-2 mm plate nozzle. The effectiveness of spraying operations was tested by placing water-sensitive papers (WSP) on the upper side and on the lower side of leaves [8]. The drop spots were analyzed with the software MacBiophotonics ImageJ 1.48 (MacBiophotonics, McMaster University, Hamilton, ON, Canada) to derive the size of the droplets and to calculate the Volume Median Diameter (VMD or d50). Drops were classified according to the index adopted by the British Crop Protection Council [9]: (VF) Very Fine: <145 μm drop diameter; (F) Fine: 145–225 μm; (M) Medium: 225–325 μm; (C) Coarse: 325–400 μm; (VC) Very Coarse: 400 –500 μm; (XC) Extremely Coarse: >500 μm.
2.4.4Efficacy of curative pruning
Psa migration rates through grafting points and along the plant were calculated in A. chinensis (cv. Jintao). Six potted plants were stab-inoculated with a blade dipped in a 104 CFU mL–1 Psa suspension. The inoculation point was labelled and 14, 21 and 120 days after inoculation, 1 cm tissue samples were excised every 10 cm above and below the infection site, and from branching nodes.
Psa migration was also assessed on uprooted A. chinensis (cv. Jintao) plants, grafted on Hayward or self-rooted, from a commercial orchard in Castel del Rio (44° 13’ 22” N; 11° 30’ 23” E). Wood samples of the plant were taken above and below the grafting point, and from roots (>1 mm diameter) and radicles (<1 mm diameter). Psa endophytic population inside the wood was determined as previously described.
2.4.5Bacterial spread through pruning activities
Pruning practices were monitored over three years (2012–2014) in 3 commercial orchards located in Faenza, where A. deliciosa cv. Hayward (44° 15’ 13” N; 11° 50’ 52” E), A. chinensis cv. Hort16A (44° 14’ 10” N; 11° 49’ 35” E), and A. chinensis cv. Jintao (44° 20’ 1” N; 11° 49’ 45” E) were grown. Each of the orchards presented approximately 60% of infected plants. Data were analysed with Ripley’s K function to check whether any spatial pattern in the distribution of dead plants could be ascribed to pruning activities.
2.5Effect of the training system on disease incidence
A commercial field of A. deliciosa cv. Hayward located in Castel Bolognese (Italy, 44° 20’ 16” N; 11° 48’ 58” E) was split in two plots, where the vines were trained according with the two typical training systems in Emilia-Romagna (‘Pergola’ and ‘Geneva Double Curtain’, GDC). Symptom development was monitored monthly for 1 year. During the experiment, microclimatic data inside the canopy were recorded at hourly intervals. Two data logger sensors (EasyLog-UBS-1) were placed in each plot, at the level of the leader and on the outer side in mid-length of the canes to collect temperature and humidity data for six months (June-November). The data obtained from the sensors were expressed as an average of 10-day cumulates, and the significance of their differences was assessed with the Student’s t test (P < 0.05). Finally, the penetration of water sprays inside the canopy was evaluated as previously described.
2.6Influence of the use of bioregulators on disease development
The experiments were performed in both controlled and field conditions. The influence of synthetic auxins and cytokinins on plant susceptibility to the disease was evaluated. 3,5,6-trichloro-2-pyridyloxyacetic acid (TPA, marketed as Maxim®, L. Gobbi S.r.l., Genova, Italy) was used as the synthetic auxin and 1-(2-chloropyridin-4-yl)-3-phenylurea (CPPU or Forchlorfenuron, marketed as Sitofex®, AlzChem AG, Trostberg, Germany) was used as the synthetic cytokinin.
2.6.1Experiments in controlled conditions
Potted A. deliciosa cv. Hayward plants were used. The commercial formulates were applied 7, 15 or 30 days before inoculation at 1 or 3 mL L–1 (Sitofex®), and at 20 or 40 mg L–1 (Maxim®). The corresponding pure active ingredients were applied 7 days before inoculation at the same concentrations. Thirty days after inoculation, symptoms were evaluated and Psa endophytic populations were measured. All the experiments were repeated twice. Differences in disease index scores and bacterial populations among the treatments and application timings were assessed by ANOVA followed by Fisher’s Least Significant Difference test, assuming a significance for P < 0.05.
2.6.2Field experiments
The experiments were performed in 4 commercial orchards of A. deliciosa cv. Hayward located near Faenza (44° 19’ 11”N; 11° 53’ 51” E; 44° 16’ 03” N; 11° 50’ 05” E; 44° 16’ 02” N; 11° 55’ 02” E; 44° 15’ 13”N; 11° 52’ 40” E). Standard fertirrigation and crop management practices were applied. Bordeaux mixture (BordoFlow® Manica, Rovereto, Italy), equivalent to 20 g ha–1 of active copper, was applied as standard prevention treatment every 15 days from November to February and from April to September. Sitofex was applied 3 weeks after full bloom (1 L ha–1 Sitofex®, 1000 L ha–1 water). Maxim was applied 2 weeks after petal fall (2 cp ha–1 Maxim®, 1000 L ha–1 water). The experimental design consisted in randomized blocks of 7 plants on the same row. Each block was repeated along 6 rows. The treated rows were separated by an untreated row to prevent contamination by spray drift. Symptoms development was monitored monthly. Since the bioregulators may influence fruit production, at the end of the experiment, yield and fruit quality parameters were evaluated on 60 fruits collected from 3 plants as described in previous work [10]. The significance of differences in disease incidence was assessed by the Z test.
2.7Effect of Psa infection on fruit production, quality and storability
In 2014, 100 fruits were collected from symptomatic and symptomless plants in commercial orchards of A. deliciosa cv. Hayward (44° 15’ 13”N; 11° 50’ 52” E), A. chinensis cv. Hort16A (44° 14’ 10” N; 11° 49’ 35” E),and A. chinensis cv. Jintao (44° 20’ 1” N; 11° 49’ 45” E) located in Faenza. The fruits were analyzed at harvest, after two months in cold storage and at the end of cold storage (4 months post harvest). Differences among samples from different plants were analyzed by Student’s t test with P < 0.05.
In addition, A. deliciosa cv. Hayward fruits were collected from symptomless and symptomatic plants. From the latter ones, fruit samples were also taken specifically from canes where symptoms were present. Qualitative tests were performed at harvest, after two months in cold storage, and after one week in shelf life. ANOVA and the Fisher’s Least Significant Difference test were applied to assess the significance of differences forP < 0.05.
The following parameters were measured: fruit weight, DA Index (IAD), flesh firmness, ethylene production, flesh colour, soluble solid contents, dry matter and titrable acidity. IAD was measured with “kiwi-meter” (TR, Forlí, Italy) on the peel (“skin DA Index”), and after peeling out 1 (for A. deliciosa) or 2 mm (for A. chinensis) (“flesh DA index”) [10]. The flesh firmness was measured by using a penetrometer (Güss Fruit Texture Analyzer, Cape Town, South Africa) with 8 mm tip on two orthogonal faces of the fruit, after peeling. Ethylene was measured by gas chromatography (Dani 86.10 HT, Milano, Italy) on two-fruits samples, closed in 1.7 L vessels for two days. Flesh colour was determined by colorimeter (CR-400, Konica Minolta, Tokyo, Japan) after removing 1 mm (for A. deliciosa) or 2 mm (for A. chinensis) of peel on two portions of the fruit placed orthogonally. Soluble solid content was measured by a digital refractometer Atago (Optolab, Modena, Italy). Dry matter was determined by drying a 2-mm thick fruit slice at 60°C for 48 hours. Acidity was measured by titration with 0.25 N NaOH, using a Crison Compact titrator (Crison Instruments, Barcelona, Spain).
2.8Statistical analyses
The STATISTICA version 5 software (StatSoft Inc, Tulsa, USA) was used for calculation of ANOVA, Fisher’s Least Significant Difference test and Student’s t test. The software SPPA 2.0 was used for geostatic analysis of the data.
3Results
3.1Effect of nitrogen form, dosages and mode of application in controlled conditions
Due to the high variability of response inside each of the fertilization treatment, the differences among samples treated with different nitrogen compounds or ratings were not statistically significant. However, the plant receiving NPK fertilization had the lowest disease incidence and severity, whereas the ones fertilized with ammonium nitrate showed incidence and severity vaules up to five and three times higher, respectively. All the recorded biometric parameters (production of new leaves, plant weight and quantum yield) were not influenced by the form of nitrogen applied to the plants. The highest nitrogen doses were associated to the mildest symptomatology, but also with the highest Psa endophytic populations. 100% nitrogen ratings decreased the dry matter content in leaves and it also caused a significant leaf drop. No differences in the symptom development or in the bacterial endophytic population were noted in relation to root or foliar application.
3.2Effect of micronutrients deficiency or excess
The depletion of any single microelement, among those tested, did not cause statistically significant differences compared to control plants with regard to symptoms, although the deficiency of specific micronutrients, such as Ca and Mn, slightly increased symptoms severity (Fig. 1A). The depletion of Ca, Fe and B generally caused an increase in Psa endophytic population (Fig. 1B). The excess of micronutrients did not statistically influence symptoms development (Fig. 2A), nor Psa endophytic population (data not shown). However, the excess of B and Ca slightly increased symptom severity. QY was significantly reduced by the excess of B and Mn (Fig. 2B).
3.3Influence of irrigation on disease development
Water deprivation increased disease symptom severity (Fig. 3), but not incidence. The source of the water supply used for irrigation influenced the disease incidence: for the whole duration of the monitoring, orchards irrigated with internal water sources presented a higher disease incidence than those receiving water from running water natural rivers or artificial canals (Fig. 4).
3.4Role of pruning in the disease cycle
The wound caused by pruning represented a possible entry point for Psa for longer than 1 month both in A. deliciosa and A. chinensis. Pruning performed when the plant is completely dormant resulted in the lowest disease incidence and severity, while late pruning, performed at the beginning of the vegetative season (bleeding sap), induced the highest disease incidence and severity (Table 1). Among the three different pruning types (standard, short, and zero leaves), tested on the Pergola training system, the short pruning granted a more effective water spray penetration at full leaf development (’medium’ drop size in June and September, compared to ‘fine’ or ‘very fine’ in the other pruning systems; Table 2). No significant changes in temperature and leaf wetness were recorded in the three cases (data not shown).
In three infected commercial orchards monitored over three years, a significant correlation was found between the position of diseased plants along each row in the orchard. In addition, the closest association between diseased plants was found below 5 meters, corresponding to the distance between rows.
3.5Bacterial migration and host colonization
Seven, 14, 21 and 120 days after stab-inoculation, self-rooted or grafted A. chinensis (cv. Jintao) plants were processed to verify the maximal length of bacterial migration. During 21 days, the maximum basipetal and acropetal migrations were, respectively, 3 and 2 cm. At the maximal distance of migration, the endophytic Psa population size was generally comparable to the one at the infection point. In 4 months, the pathogen had completely invaded the plant tissues in the apex direction, whereas its basipetal migration was approx. 138 cm (Table 3). Furthermore, Psa completely colonized the roots as well, overcoming the grafting point. Psa also migrated through the branching points (nodes) in the different directions (data not shown). The presence of the pathogen was confirmed in infected A. chinensis (cv. Jintao) plants after uprooting, regardless of whether the plant was grafted or self-rooted. In fact, the roots of infected plants hosted average populations of 4.27×10⁸ CFU g–1 in grafted plants and 1.15×10⁸ CFU g–1 in self-rooted plants, with bacterial populations in radicles even higher than in the aerial parts (Table 4).
3.6Effect of the training system on disease incidence
The influence of two training systems (pergola and GDC) on the microclimatic conditions inside the canopies and the penetration of water sprays was assessed. Water drop dispersion, after the full development of leaves, was most effective in the short pruning system (Table 2). Microclimatic data collected within the canopies showed no significant differences between two different training systems. However, GDC-trained canopies were constantly slightly warmer and less humid (Fig. 5).
3.7Influence of the use of bioregulators on disease development
The effects of forchlorfenuron (CPPU) and TPA on Psa are summarized in Fig. 6. When supplied 30 days before inoculation, both CPPU and TPA induced lower disease index scores than water-treated plants. When the bioregulators were applied 15 days before inoculation, disease incidence and severity were slightly reduced by the higher CPPU rate, but increased by TPA. Treatments performed 7 days before inoculation resulted ineffective (for CPPU) or detrimental (for TPA). Although subjected to high variability, bacterial populations were in agreement with symptomatology. No differences were noted between the application of pure active ingredients and commercial formulates. In field trials, both CPPU and TPA incremented the disease incidence (although differences were not statistically significant) when applied to increase fruit production (Table 5).
3.8Effect of Psa infection on fruit production, quality and storability
The analysis of fruits from symptomatic and asymptomatic plants (assessed by visual evaluation of symptoms) showed that the quality parameters are influenced by the disease and the changes in fruit quality can be observed both at harvest and after cold storage. Fruits harvested from symptomatic plants had a lower weight, particularly in A. chinensis cultivars (Table 6). Flesh colour at harvest is also affected by the disease, being enhanced in A. chinensis cultivars, and clearer in A. deliciosa cv. Hayward. Differences are even more evident between the fruits taken from asymptomatic plants and those taken from symptomatic branches of diseased plants (Table 7). Ethylene production by fruits harvested from diseased plants was also increased (Fig. 7).
4Discussion
The role of agronomic practices commonly carried out by farmers (such as training system, pruning, sanitation pruning, irrigation, fertilization) in the incidence and severity of the disease was explored. In fact, they may locally modify several agro-environmental conditions, with a potential influence on Psa growth and spread and bacterial canker development [1]. Moreover, the influence of Psa infection on fruit production and quality at harvest and during storage life was investigated.
4.1Influence of fertilization on disease development
Nutritional imbalances may cause stress in the plant making it more susceptible to pathogens attack. Our findings showed that nitrogen fertilization promotes bacterial growth and disease development, like for other biotrophic pathogens exploiting host metabolism for their multiplication [11]. Furthermore, in field conditions, high nitrogen fertilization results in denser canopies, which may provide favourable microclimatic conditions for Psa epiphytic growth. Denser canopy may also have an indirect positive effect for the disease development: in fact, they reduce the penetration of the copper sprays generally used for Psa control. Finally, nitrogen stimulates shoot growth, which, in turn, leads to the need of more pruning interventions, thus increasing the risk of infection through pruning wounds. The effect of nitrogen on Psa did not depend on its application mode (root or spray), nor its form (ammonium and/or nitrate). No differences in lignification (which could modify the tissue susceptibility to pathogens) were noticed among the treatments. In conclusion, our results suggest to reduce the use of nitrogen fertilization. In general, micronutrient deficiency promotes bacterial growth, especially in the case of iron. Iron is a key nutrient for Pseudomonas spp. [12]. However, we found that also the deficiency promotes the growth of the bacterium in planta, possibly due to the induction of early senescence, facilitating Psa growth by the inactivation of plant defences and the demolition of nutrient storages [13].
4.2Influence of irrigation on disease development
Leaf wetness and relative humidity are crucial to allow Psa epiphytic survival and growth [4]. In addition, we observed that water stress induced a more severe symptomatology. This may be explained by the worsening of drought stress due to the colonization of vascular tissues by Psa, reducing the capacity of vessels. Indeed, on drought stressed plants in greenhouse conditions, we observed that Psa symptoms often result in large desiccated areas harbouring a consistent bacterial population, which differ from the most common angular leaf spots. The spread of Pseudomonas syringae pv. syringae has been demonstrated to depend on the water cycle [14]. Our research showed a positive correlation between disease incidence and the use of irrigation water pumped from artificial basins collecting the rainwater from the infected orchards, thus suggesting a possible role of irrigation water in the local spread of the disease. However, further experiments are needed to fully elucidate the role of irrigation water in vectoring Psa. For example, in the area where the experiments have been performed, the only irrigation method used is drop irrigation to the root system and there is no evidence of Psa infecting the plants via the root system. A tentative explanation could be that irrigation by water containing Psa may increase the pathogen population in the litter where it can survive, even in harsh conditions, for months [15]. The increased environmental Psa population in the orchard may facilitate the spread of the pathogen to susceptible host parts such as leaves and flowers.
4.3Role of pruning in the disease cycle and curative pruning
Pruning cuts are possible entry points for Psa and, in the period when pruning is usually done (late winter) they need more than a month to heal. Therefore, the minimization of pruning interventions is suggested. In addition, post-pruning treatments able to seal the cuts, or the application of protective and/or disinfectant compounds to decrease Psa population may further reduce the risk of infection. On the other hand, pruning performed during vegetative dormancy are associated with the lowest disease risk.
The comparison of two common training systems (GDC and Pergola) showed similarities in the microclimatic conditions inside the canopy, although the GDC training system allowed slightly higher temperatures and lower humidity compared to the pergola, possibly due to the increased light penetration and air flow into the canopy. Psa shows the highest aggressiveness between 12–18°C, while its virulence is inhibited by temperatures above 25°C [16]. Thus, even though no difference in Psa incidence was observed in field conditions, the GDC training system seems to provide less favourable conditions to Psa infection. However, a reduction of the disease risk may also be achieved with the more widespread Pergola training system, by implementing specific pruning strategies. For example, the short pruning allowed the best accessibility of canopies to water sprays, while in the zero leaves system, slightly higher temperature values were observed in canes area, probably due to the greater penetration of light inside the canopy. These data suggest that the short and zero leaves pruning forms allow better aeration and irradiation of the foliage.
To set up an effective curative pruning, Psa rate and direction of migration inside the plant tissues are crucial information. After an initial slow migration, in 4 months, the bacterium was able to colonize the whole plant both acropetally and basipetally. Therefore a prompt pruning of the infected limbs may prevent the systemic migration of the pathogen. Nonetheless, when symptoms (i.e. cankers) are evident on canes, the infection has probably spread systemically. The branching nodes and the grafting point do not prevent bacterial migration. Therefore, coppicing and re-grafting are not suitable to reconstitute a productive plant.
Finally, our research also aimed to evaluate whether the current pruning practices may contribute to disease spread. In order to contain disease spread in open field, a prompt sanitary pruning and eradication of whole infected plants are crucial practices. The mapping of affected orchards demonstrated that, during the early stages of infection, the diseased plants mostly aggregated along the row rather than among adjacent rows. Thus, mechanical pruning performed along the row or, in case of manual pruning, the ineffective disinfection of tools may be regarded as a major issue for the bacterial spread.
4.4Influence of bioregulators on disease development
In controlled conditions, the synthetic cytokinin (Forchlorfenuron), applied up to one month prior inoculation, may induce a moderate resistance against Psa. On the other hand, the auxinic compound TPA enhanced disease development. Evaluations of treatments with synthetic auxins and cytokinins agree with previous observations, where auxin and cytokinins showed, respectively, antagonistic and synergistic effects on SA signalling [17]. In addition, the application of TPA in young plants caused phytotoxic effects, including deformation of shoots and hyperthrophic growth of the shoot tips, which also resulted in diffuse micro and meso-lesions of the plant surface. These lesions may facilitate Psa infection and spread. In field conditions, the use of bioregulators slightly increased Psa disease incidence. However, the disease incidence in all the 4 orchards considered for the experiments was very low. Thus, further experiments are needed to fully elucidate the influence of bioregulators in field conditions.
4.5Effect of Psa infection on fruit production, quality and storability
In order to verify whether fruit quality, besides crop yield, was affected by the bacterial canker, fruits were separately harvested from healthy and symptomatic plants and, in the latter case, at least for A. deliciosa, specifically from symptomatic canes. The quality parameters at harvest and during storage of these fruits were monitored. In general, fruits from symptomatic plants were smaller and with lower sugar content. Although not a typical climacteric fruit, kiwifruit produces ethylene in its post-harvest life [18]. In this work, a higher ethylene production was recorded by fruits from the symptomatic plants, and in particular by those from the most infected parts, compared to fruits from asymptomatic plants. The higher ethylene production may induce a faster ripening of fruits from infected plants during post-harvest with consequent storage disorders.
4.6Conclusions
This work provided evidence that different agricultural practices may significantly contribute to the control of bacterial canker. In particular, balanced fertilization, sufficient irrigation from non-contaminated water sources, and the limitation of pruning may contribute to reduce Psa disease incidence and severity. In addition, less dense training systems, such as GDC, are suggested when planting new kiwifruit orchards.
Acknowledgments
This work was supported by the EU 7th Framework Programme (FP7-KBBE-2013-7-613678: DROPSA - Strategies to develop effective, innovative and practical approaches to protect major European fruit crops from pests and pathogens) and Regione Emilia Romagna (CRPV 2011 –Cancro batterico dell’actinidia (Pseudomonas syringae pv. actinidiae). Mr. Sauro Graziani from Agrintesa Scrl. and Zespri International Ltd. are acknowledged for technical support.
References
[1] | Donati I , Buriani G , Cellini A , Mauri S , Costa G , Spinelli F . New insights on the bacterial canker of kiwifruit (Pseudomonas syringae pv. actinidiae). J Berry Res. (2014) ;4: :53. doi: 10.3233/JBR-140073. |
[2] | Montefiori M . Screening the Actinidia germoplasm for different degrees of tolerance, or resistance, to Psa (Pseudomonas syringae pv. actinidiae). 8th International Symposium on Kiwifruit, Chengdu, China, (2014) . |
[3] | Spinelli F , Donati I , Vanneste JL , Costa M , Costa G . Real time monitoring of the interactions between Pseudomonas syringae pv. actinidiae and Actinidia species. Acta Hort. (2011) ;913: :461. doi: 10.17660/ActaHortic.2011.913.61. |
[4] | Vanneste JL , Kay C , Onorato R , Yu J , Cornish DA , Spinelli F , Max S . Recent advances in the characterisation and control of Pseudomonas syringae pv. actinidiae, the causal agent of bacterial canker on kiwifruit. Acta Hort. (2011) ;913: :443–455. doi: 10.17660/ActaHortic.2011.913.59. |
[5] | Snoeijers SS , Pérez-García A , Joosten MH , De Wit PJ . The effect of nitrogen on disease development and gene expression in bacterial and fungal plant pathogens. Eur J Plant Pathol. (2000) ;106: (6):493–506. |
[6] | Murashige T , Skoog FK . A revised medium for rapid growth and bioassays with tobacco tissue cultures. Physiol Plant. (1962) ;15: (3):473–497. doi: 10.1111/j.1399-3054.1962.tb08052.x. |
[7] | Cellini A , Fiorentini L , Buriani G , Yu J , Donati I , Cornish DA , et al. Elicitors of the salicylic acid pathway reduce incidence of bacterial canker of kiwifruit caused by Pseudomonas syringae pv. actinidae. Ann Appl Biol. (2014) ;165: :441. doi: 10.1111/aab.12150. |
[8] | Salyani M , Fox RD . Evaluation of spray quality by oil- and water-sensitive paper. T ASABE. (1999) ;42: :37–43. 10.13031/2013.30720. |
[9] | Nuyttens D , Baetens K , De Schampheleire M , Sonck B . Effect of nozzle type, size and pressure on spray droplet characteristics. Biosys Eng. (2007) ;97: :333–345. doi: 10.1016/j.biosystemseng.2007.03.001. |
[10] | Costa G , Bonora E , Fiori G , Noferini M . Innovative non-destructive techniques for fruit quality assessment. Acta Hort. (2011) ;913: :575. doi: 10.17660/ActaHortic.2011.913.78. |
[11] | Fagard M , Launay A , Clément G , Courtial J , Dellagi A , Farjad M , Krapp A , Soulié M , Masclaux-Daubresse C . Nitrogen metabolism meets phytopathology. J Exp Bot. (2014) ;65: :5643–5656. 10.1093/jxb/eru323. |
[12] | Cornelis P . Iron uptake and metabolism in pseudomonads. Appl Microbiol Biotechnol. (2010) ;86: :1637–1645. doi: 10.1007/s00253-010-2550-2. |
[13] | Groen SC , Whiteman NK . The evolution of ethylene signaling in plant chemical ecology. J Chem Ecol. (2014) ;40: :700–716. doi: 10.1007/s10886-014-0474-5. |
[14] | Morris CE , Sands DC , Vinatzer BA , Glaux C , Guilbaud C , Buffière A , et al. The life history of the plant pathogen Pseudomonas syringae is linked to the water cycle. ISME J. (2008) ;2: :321–334. doi: 10.1038/ismej.2007.113. |
[15] | Tyson J , Manning M , Curtis C , Dobson S , Mckenna C , Vergara M . Inoculum production and infection of kiwifruit plants by Pseudomonas syringae pv. actinidiae in New Zealand. 8th International Symposium on Kiwifruit, Chengdu, China, (2014) . |
[16] | Scortichini M , Marcelletti S , Ferrante P , Petriccione M , Firrao G . Pseudomonas syringae pv. actinidiae: A re-emerging, multi-faceted, pandemic pathogen. Mol Plant Pathol. (2012) ;13: :631–640. doi: 10.1111/j.1364-3703.2012.00788.x. |
[17] | Pieterse CMJ , Van der Does D , Zamioudis C , Leon-Reyes A , Van Wees SCM . Hormonal modulation of plant immunity. Annu Rev Cell Dev Biol. (2012) ;28: :489–521. doi: 10.1146/annurev-cellbio-092910-154055. |
[18] | Koukounaras A , Sfakiotakis E . Effect of 1-MCP prestorage treatment on ethylene and CO2 production and quality of ‘Hayward’ kiwifruit during shelf-life after short, medium and long term cold storage. Postharvest Biol Technol. (2007) ;46: (2):174–180. doi: 10.1016/j.postharvbio.2007.05.002. |
Figures and Tables
Fig.1
Influence of microelement deficiency on bacterial canker symptoms development (A), and Pseudomonas syringae pv. actinidiae population sizes (B), one month after inoculation. Different letters indicate significant differences according to Fisher’s LSD test (P < 0.05).
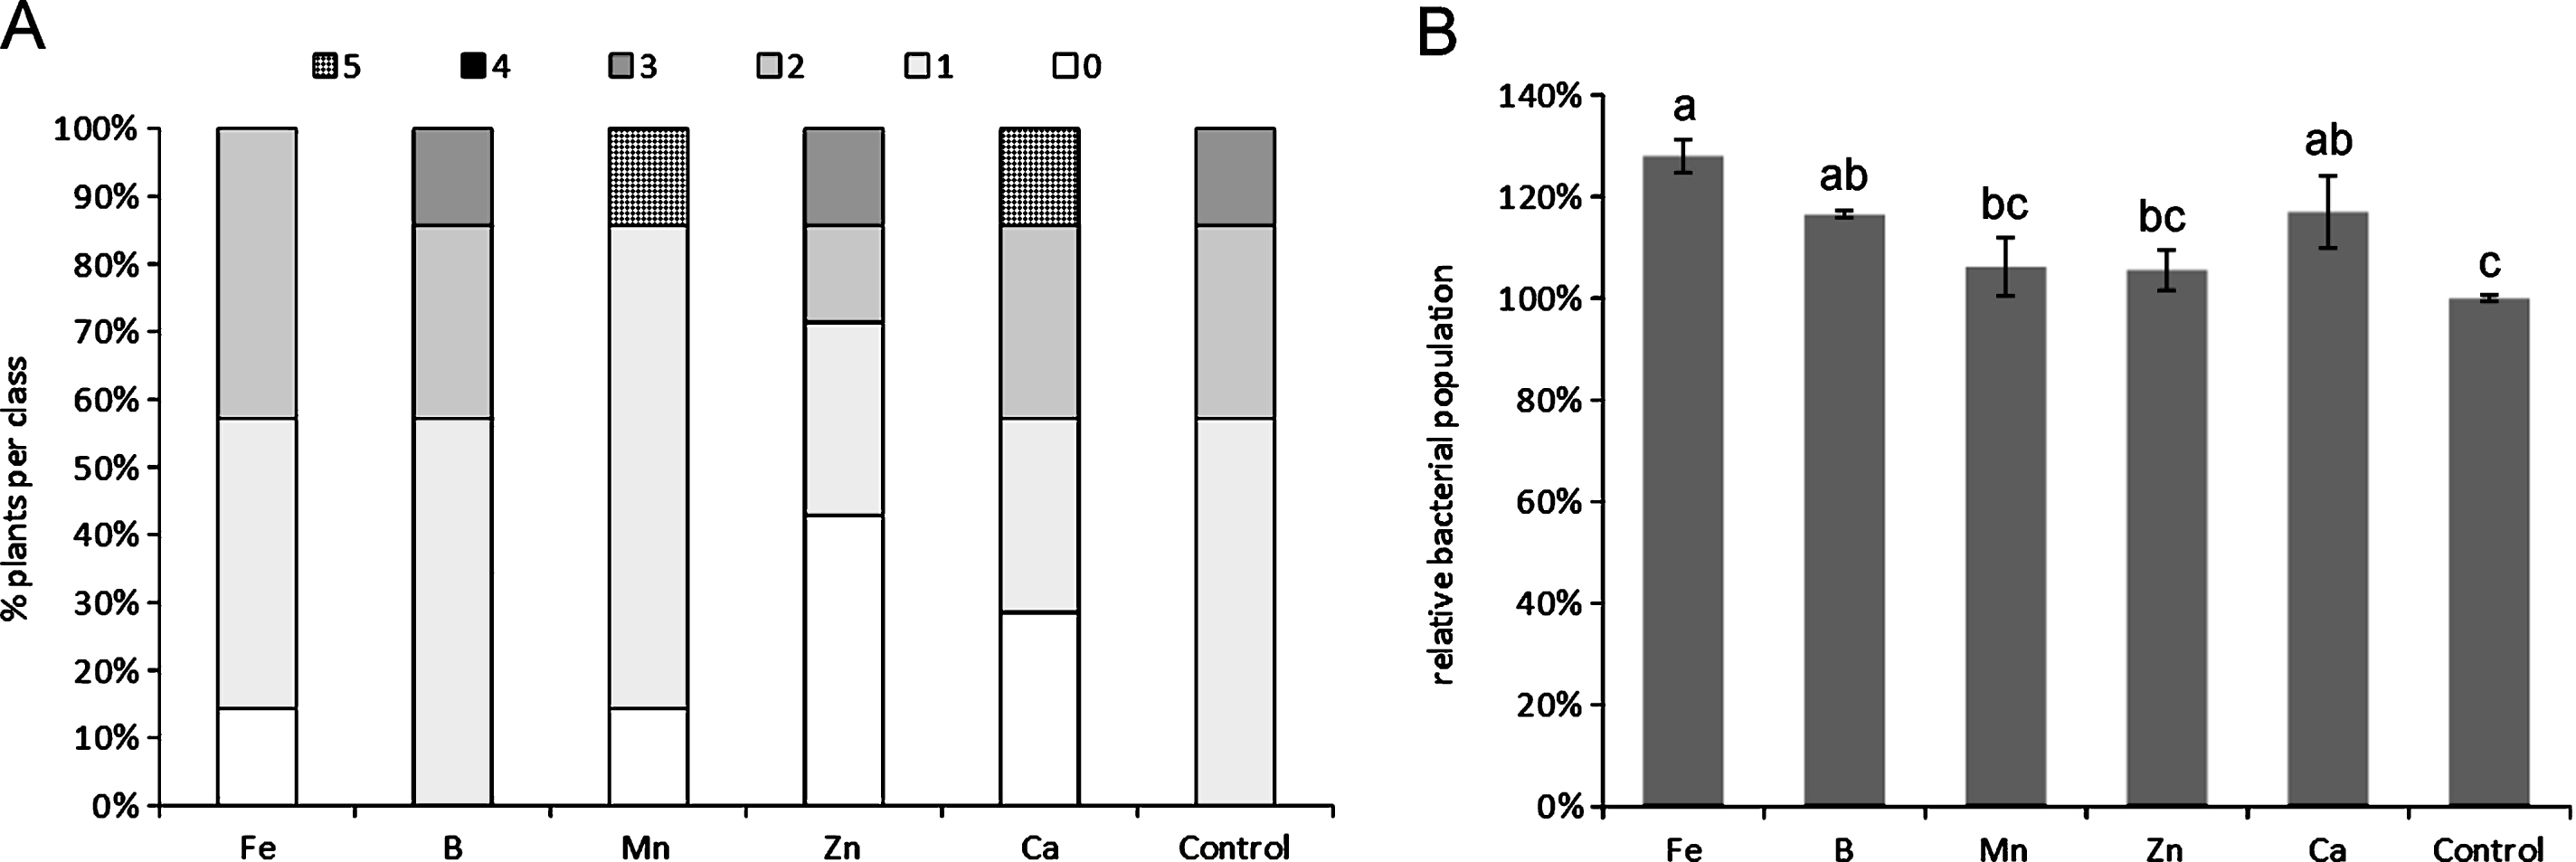
Fig.2
Influence of microelement excess on bacterial canker symptoms development (A) and photosynthetic quantum yield (B), one month after inoculation. Different letters indicate significant differences according to Fisher’s LSD test (P < 0.05).
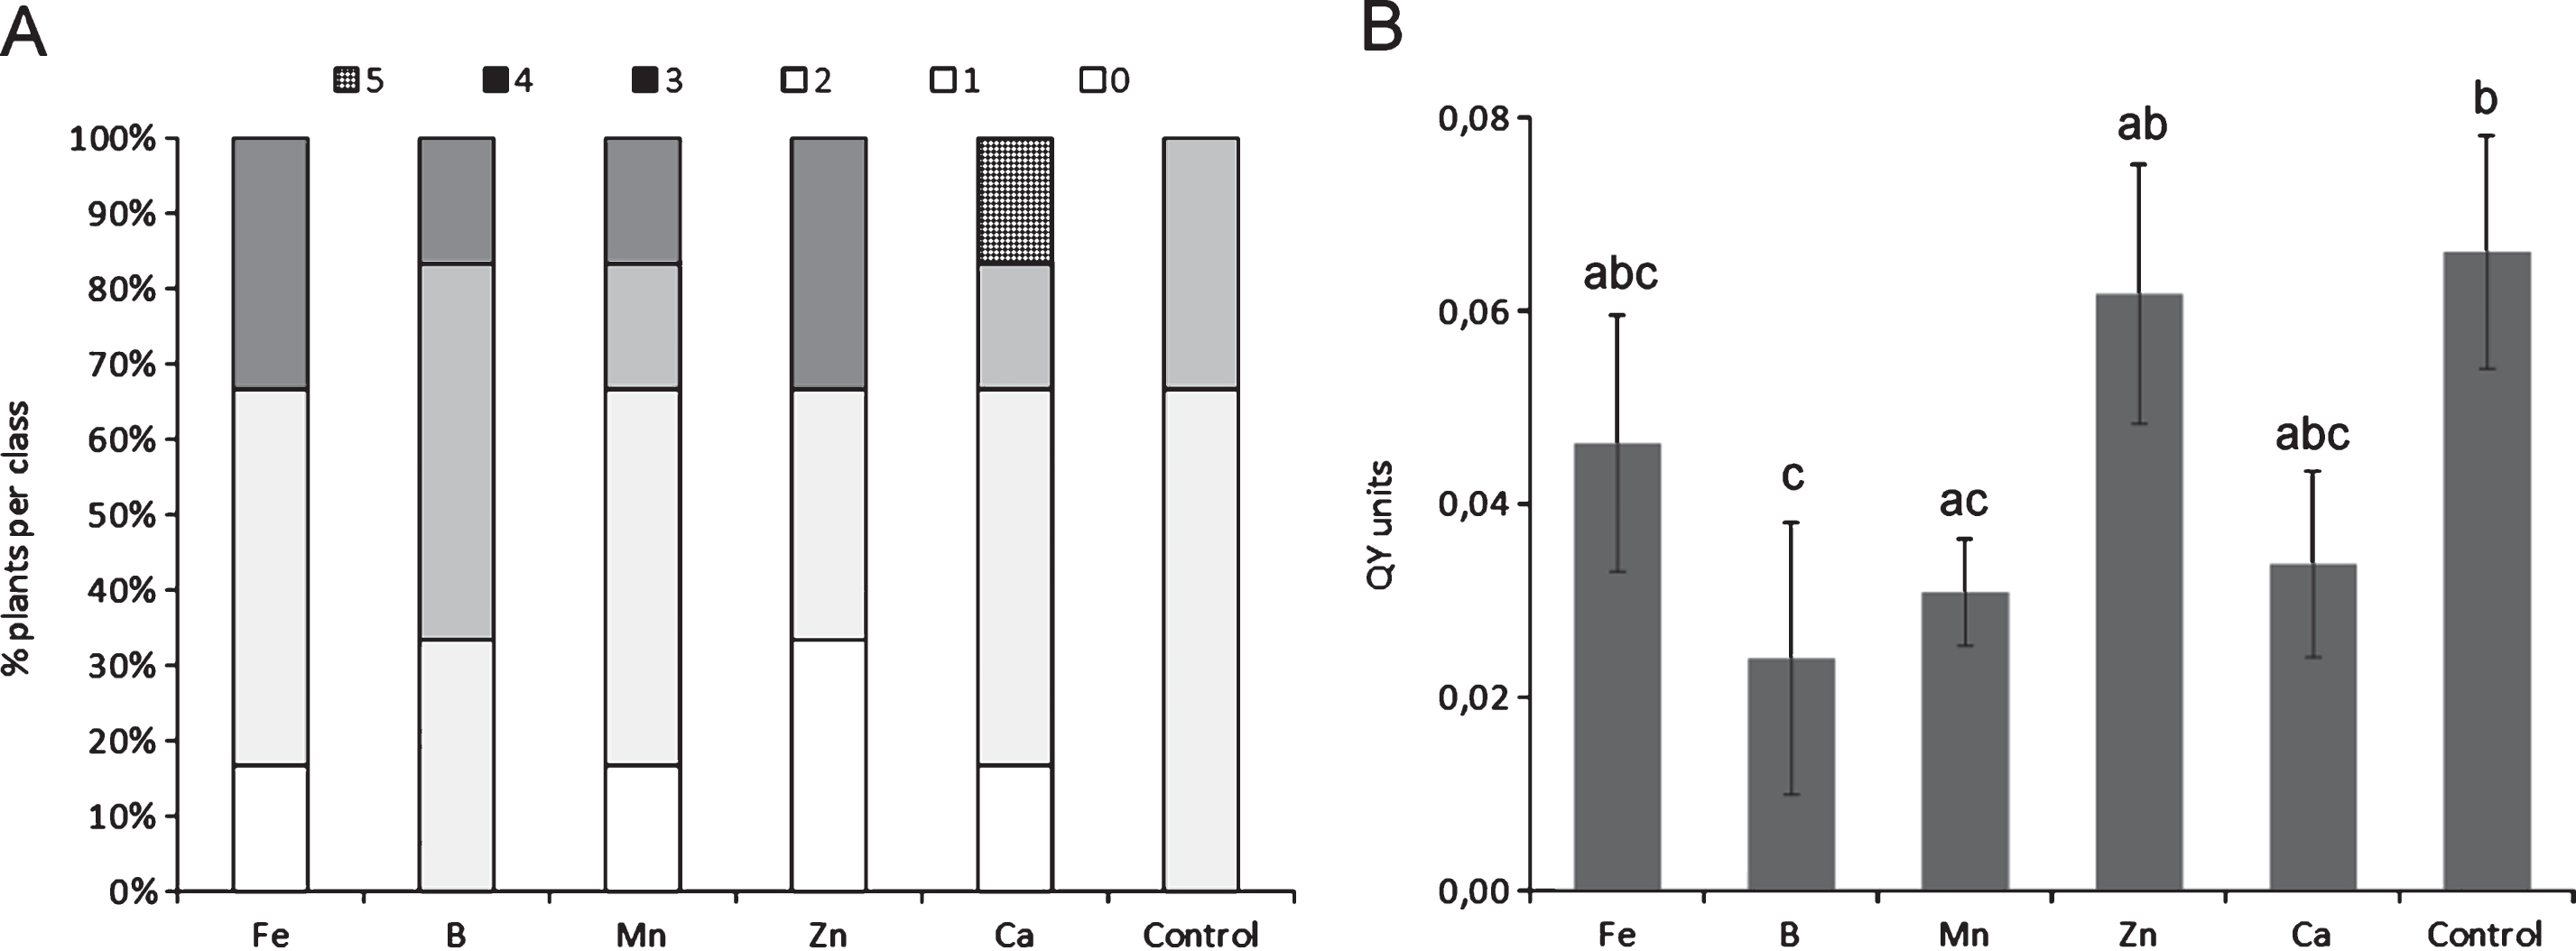
Fig.3
Development of bacterial canker symptoms, 4 months after inoculation with Pseudomonas syringae pv. actinidiae, in plants subjected to different irrigation rates. Different letters indicate significant differences according to Fisher’s LSD test (P < 0.05).
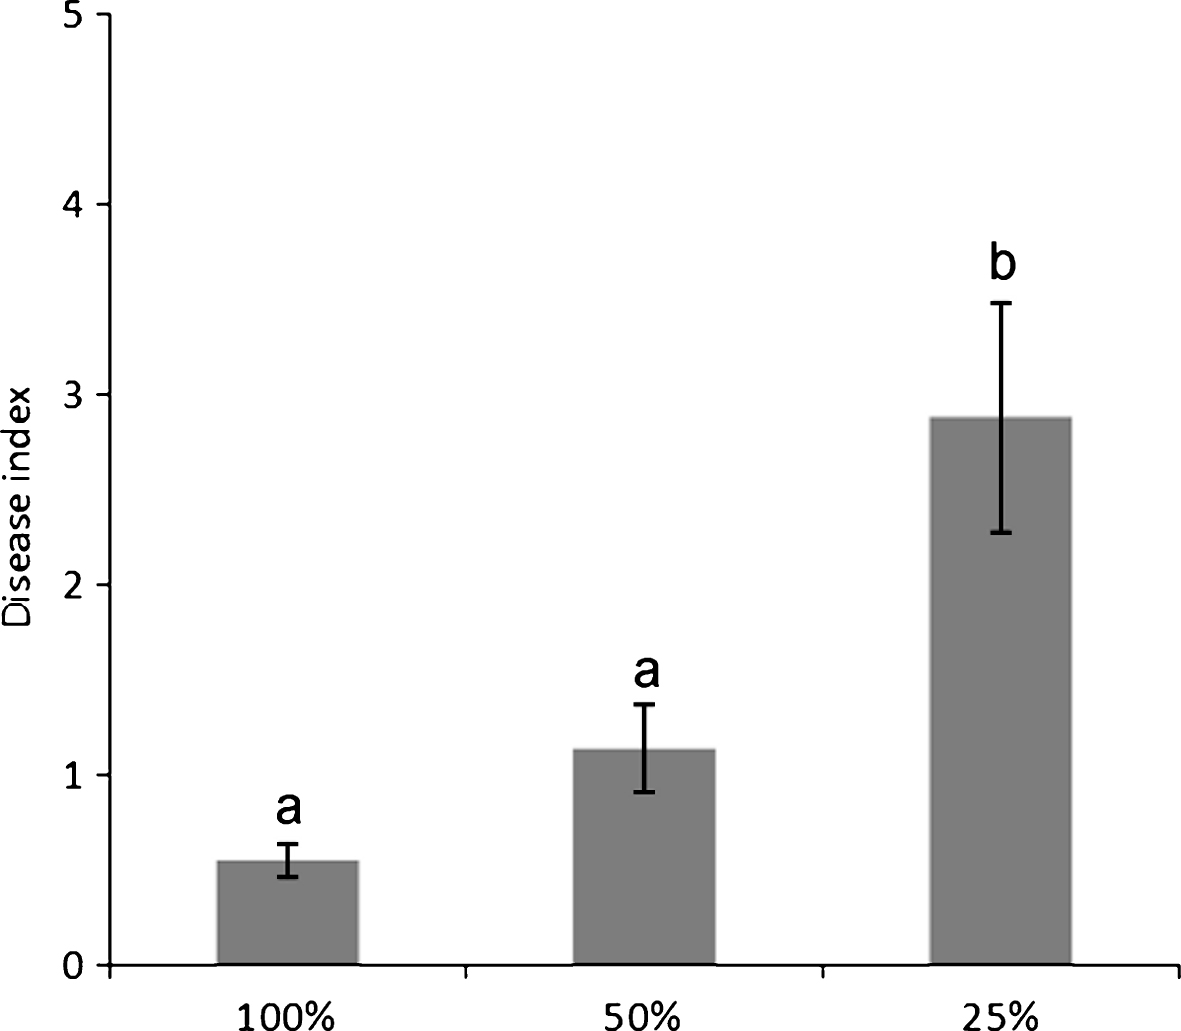
Fig.4
Bacterial canker incidence in commercial A. deliciosa and A. chinensis orchards over three seasons, according to their water supply. Local sources include wells and ponds with no access to running water.
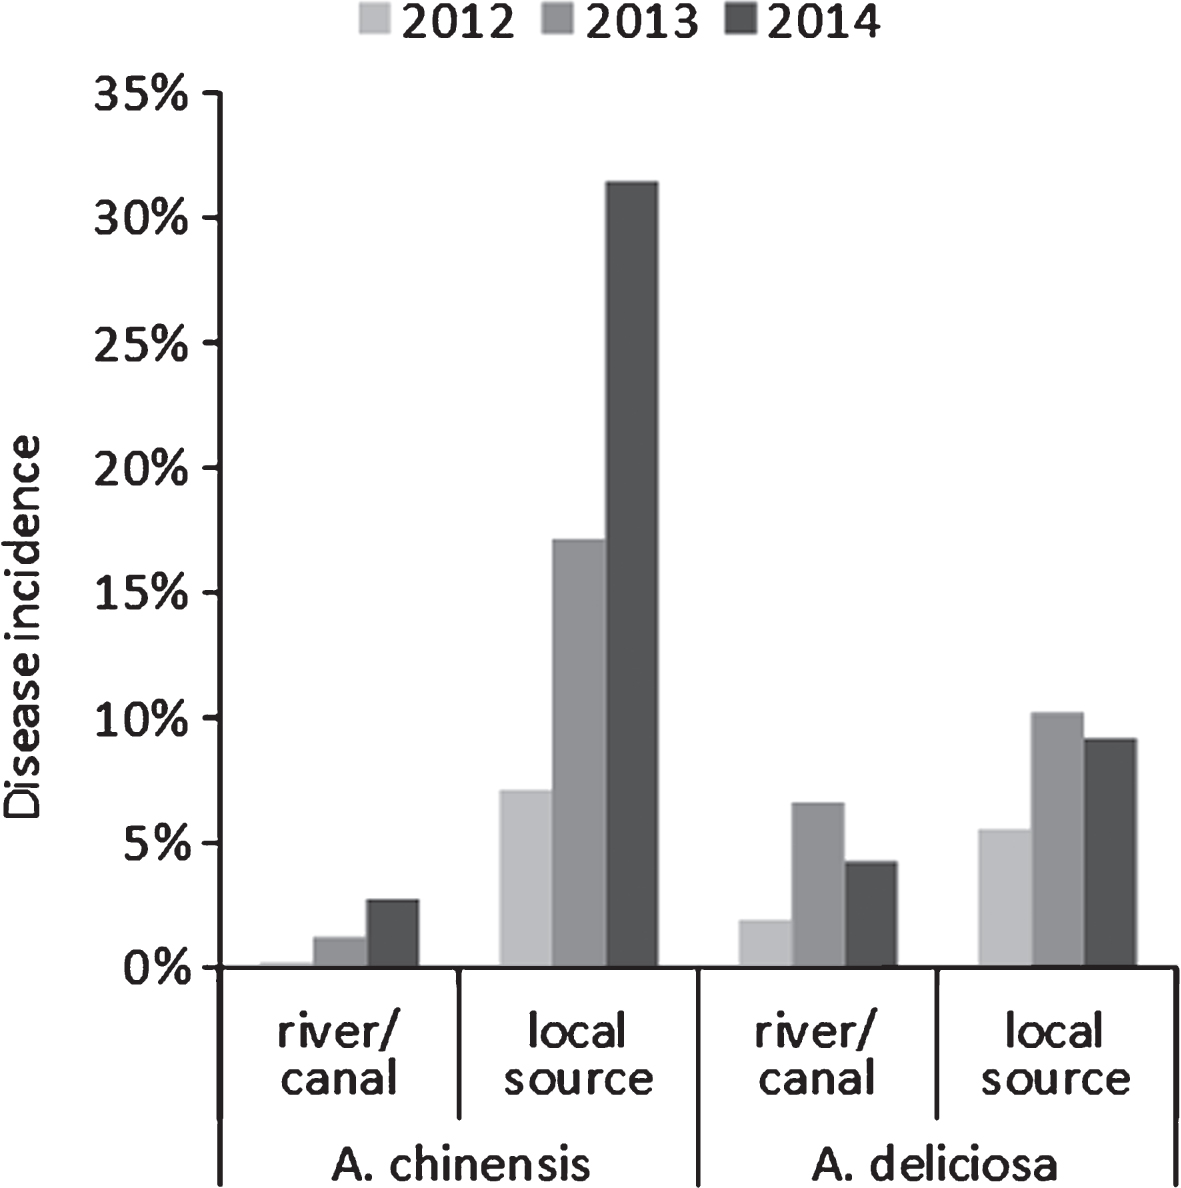
Fig.5
Influence of training system (Pergola or Geneva Double Courtain, GDC) on temperature (A) and relative humidity (B) in the canopy. Data are expressed as the average of daily cumulates over ten subsequent days.
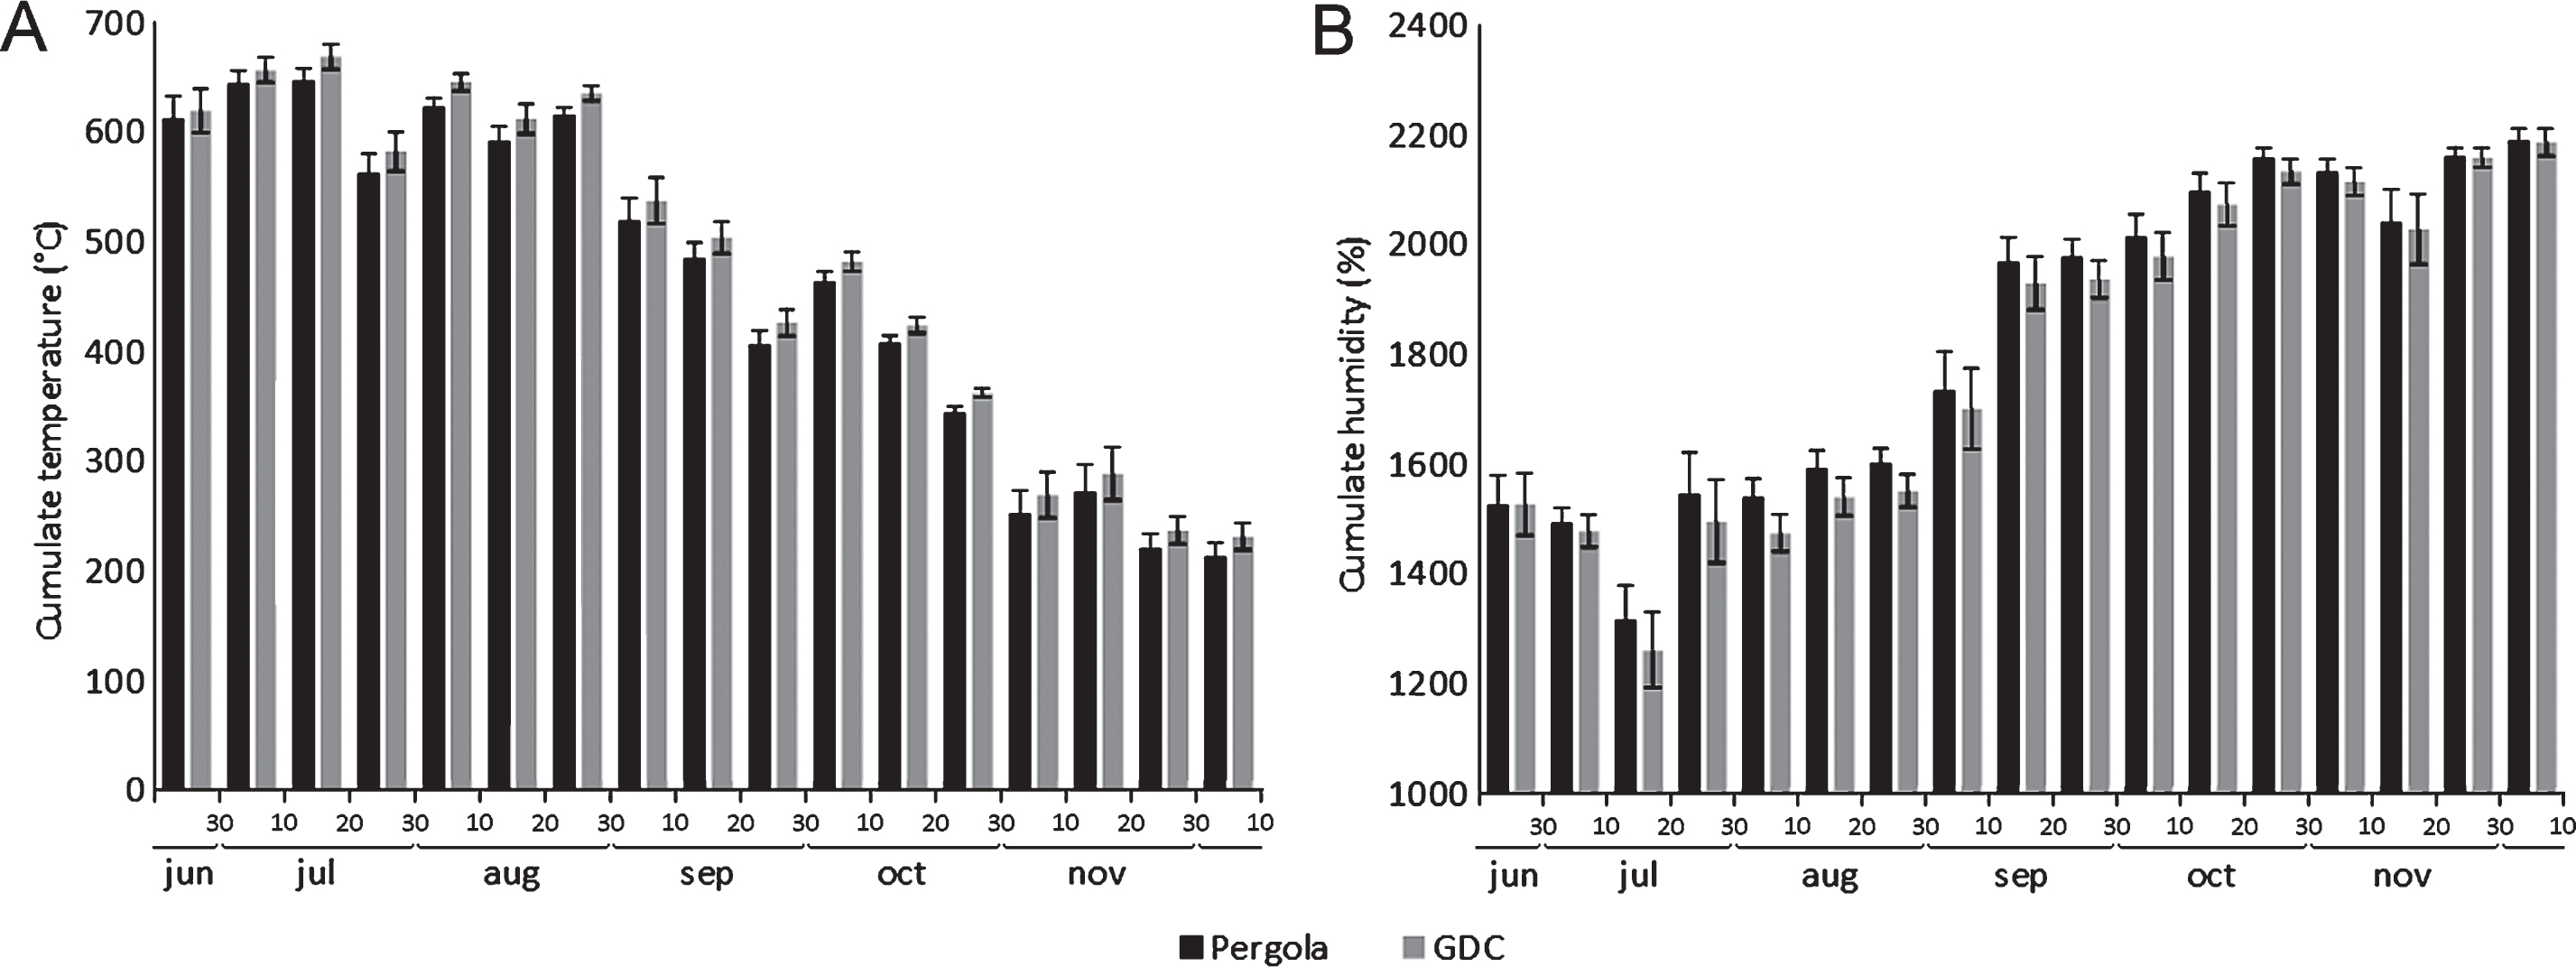
Fig.6
Bacterial canker symptoms development (A) and relative Pseudomonas syringae pv. actinidiae populations (control = 100%) (B) in potted A. deliciosa plants treated with forchlorfenuron (CPPU, 1 or 3 mL L–1) or 3,5,6-trichloro-2-pyridyloxyacetic acid (TPA, 20 or 40 mg L–1) 30, 15 or 7 days before inoculation. For each time point, different letters indicate significant differences according to Fisher’s LSD test (P < 0.05).
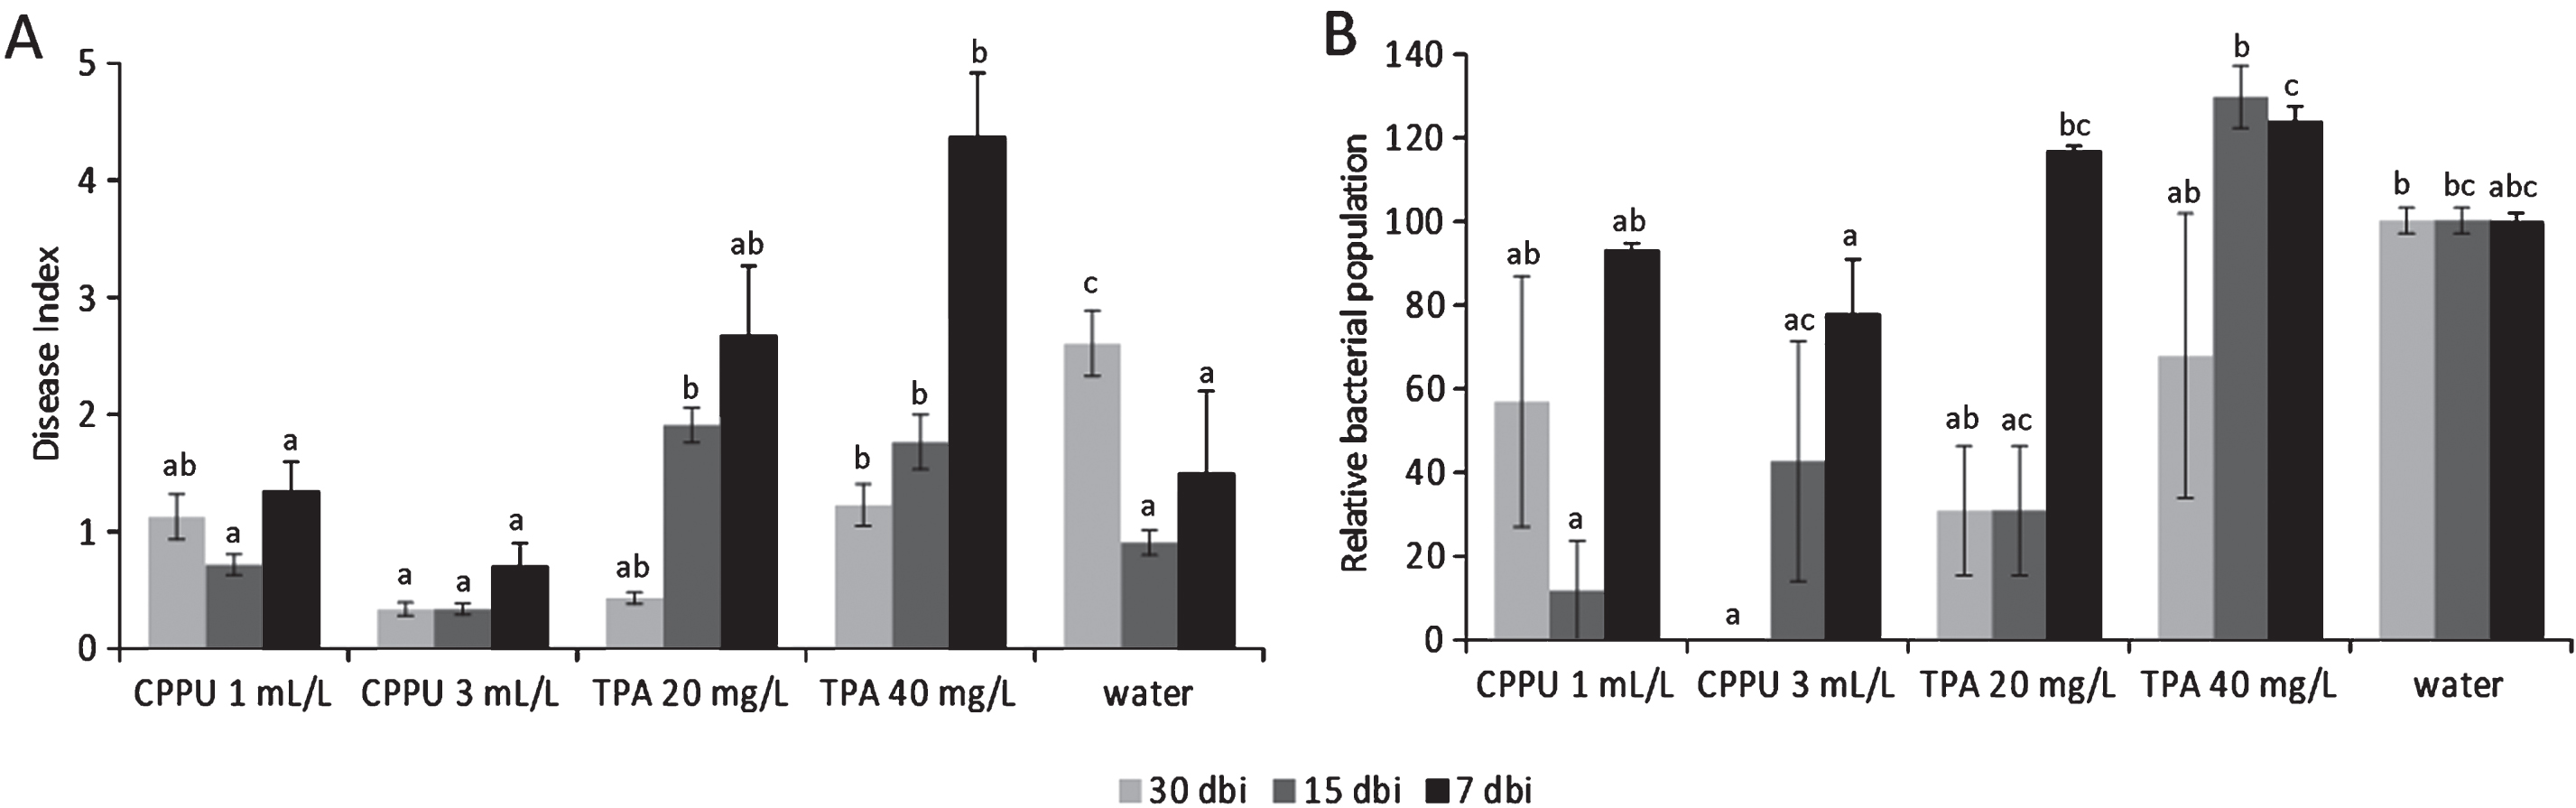
Fig.7
Ethylene emission rates from A. deliciosa cv. Hayward fruits taken from asymptomatic plants, plants showing bacterial canker symptoms, and canes from diseased plants where symptoms could be detected. Different letters indicate significant differences according to Fisher’s LSD test (P < 0.05).
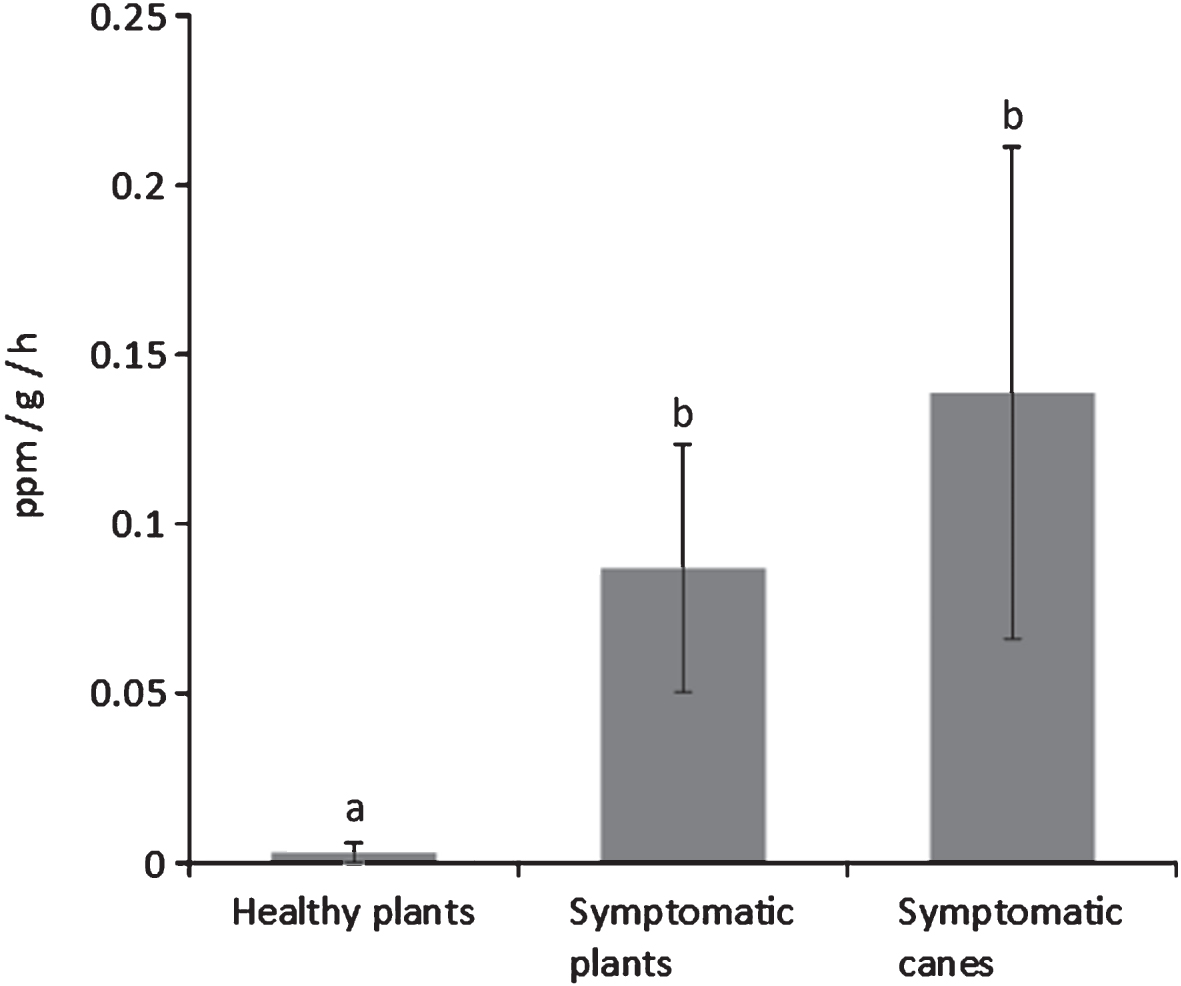
Table 1
Bacterial canker incidence and severity in relation to the time of pruning. Data are the average of 3 years (2012–2014) of observation
| Period | Phenological stage | Disease incidence (%) | Disease severity index |
| Early November | 5% leaf fall | 4.4±0.02 | 1.7 |
| Late November | 40–50% leaf fall | 6.7±0.04 | 2 |
| Early December | 95% leaf fall | 4.4±0.02 | 0.7 |
| Late December | 100 % leaf fall | 11.1±0.08 | 1.4 |
| January | Dormant wood | 2.2±0.02 | 1 |
| Early March | Bleeding sap | 13.3±0.04 | 3 |
Table 2
Effect of the pruning and training systems on canopy accessibility to water sprays on the upper and lower side of the canopy
| Month | Training system | Pruning system | VMD | |
| Over canopy | Under canopy | |||
| Mar | Pergola | Standard | XC | XC |
| Short | XC | XC | ||
| Apr | GDC | Standard | F | VF-F |
| Pergola | Standard | F-M | VF-F | |
| Short | VF-F | VF | ||
| May | GDC | Standard | M | VF-F |
| Pergola | Standard | F | F-M | |
| Short | F | F | ||
| Jun | Pergola | Standard | F | F |
| Short | F-M | F | ||
| Zero leaves | F | F | ||
| Sep | GDC | Standard | F | VF |
| Pergola | Standard | F | VF-F | |
| Short | M | F | ||
| Zero leaves | VF | VF | ||
Data are expressed according to the VMD (Volume Median Diameter of water drops) index: (VF) Very Fine: <145 μm drop diameter; (F) Fine: 145–225 μm; (M) Medium: 225–325 μm; (C) Coarse: 325–400 μm; (VC) Very Coarse: 400–500 μm; (XC) Extremely Coarse: >500 μm.
Table 3
Migration of P. syringae pv. actinidiae at different timings after stab-inoculation. The distances from inoculation point in acropetal and basipetal direction and the bacterial population size (in colony forming units per gram of fresh tissue, CFU/g) in the farthest tissue segments where it could be detected are indicated
| Days after inoculation | Apical migration | Basal migration | Roots | |||
| Distance | Population | Distance | Population | Distance | Population | |
| (cm) | (CFU/g) | (cm) | (CFU/g) | (cm) | (CFU/g) | |
| 7 | 0 | 2.6×10⁶ | 0 | 2.6×10⁶ | ||
| 14 | 2 | 6.5×10⁵ | 2 | 3.7×10⁵ | ||
| 21 | 2 | 3.7×10⁵ | 3 | 2.2×10⁵ | ||
| 120 | 15 | 7.2×10⁸ | 138 | 7.1×10⁷ | 143 | 1.7×10⁶ |
Table 4
Spread (in % of infected samples) and population size (in colony forming units per gram of fresh tissue, CFU/g) of P. syringae pv. actinidiae in different parts of self-rooted or grafted A. chinensis (cv. Jintao) plants
| Grafted plants | Self-rooted plants | |||
| Bacterial spread (%) | Population (CFU/g) | Bacterial spread (%) | Population (CFU/g) | |
| Shoots | 80% | (3.0±0.8)×108 | 80% | (2.6±0.8)×108 |
| Grafting point | 80% | (2.2±0.8)×108 | ||
| Roots | 100% | (4.3±1.1)×108 | 80% | (1.2±0.5)×108 |
| Radicles | 60% | (4.1±0.4)×108 | 40% | (4.9±0.1)×108 |
Table 5
Bacterial canker incidence, assessed by symptoms appearance, after Sitofex® and Maxim® commercial treatments. Differences are not statistically significant according to the Z test
| Disease incidence (%) | |||
| date | control | Sitofex® | Maxim® |
| 31/01 | 0 | 0 | 0 |
| 01/03 | 0 | 0 | 0 |
| 12/03 | 0 | 0 | 0 |
| 30/04 | 0 | 0 | 0 |
| 07/06 | 4 | 4 | 6 |
| 25/06 | 4 | 4 | 6 |
| 06/08 | 6 | 14 | 14 |
| 03/10 | 8 | 16 | 16 |
| 17/10 | 8 | 16 | 16 |
Table 6
Qualitative parameters of fruits from symptomatic (S) or asymptomatic (A) A. deliciosa cv. Hayward, A. chinensis cv. Hort16A or A. chinensis cv. Jintao plants, at harvest or after 2 or 4 months of cold storage. Data pairs marked with an asterisk (*) are significantly different according to Student’s t test (P < 0.05)
| Weight (g) | Skin IDA | Flesh IDA | Hue angle | Firmness (kg) | °Brix | Acidity (g/L) | |||
| Harvest | Hayward | A | 115±16 | 1.3±0.1 | 0.41±0.07 | 115±1 | 7.7±0.8 | 5.6±0.3 | 19.6±0.5 |
| S | 117±22 | 1.3±0.1 | 0.43±0.10 | 104±2* | 7.7±0.8 | 5.5±0.2 | 19.3±1.7 | ||
| Hort16A | A | 103±14 | 1.3±0.1 | 0.09±0.10 | 103±2 | 5.8±1.1 | 9.5±1.0 | 15.6±1.3 | |
| S | 113±19* | 1.3±0.2 | 0.00±0.10* | 107±7* | 5.4±1.3 | 11.4±1.9* | 16.7±0.6* | ||
| Jintao | A | 67±16 | 1.1±0.2 | 0.10±0.12 | 104±2 | 5.7±0.5 | 10.5±0.7 | 12.9±0.6 | |
| S | 89±17* | 1.0±0.2 | 0.03±0.08* | 106±3* | 5.4±0.5* | 10.9±1.3 | 13.2±0.5 | ||
| 2 months storage | Hayward | A | 112±14 | 1.4±0.2 | 0.26±0.06 | 116±1 | 6.8±0.5 | 9.6±0.6 | 15.5±0.8 |
| S | 109±23 | 1.4±0.2 | 0.42±0.07* | 116±1 | 7.1±0.7 | 9.7±0.4 | 16.7±0.5 | ||
| Hort16A | A | 102±14 | 1.4±0.1 | 0.00±0.03 | 104±2 | 6.1±0.9 | 16.3±0.7 | 11.1±1.0 | |
| S | 112±20* | 1.2±0.2* | 0.00±0.03 | 102±1* | 6.5±0.7 | 17.0±0.9 | 5.5±0.8* | ||
| Jintao | A | 82±14 | 1.1±0.2 | 0.06±0.09 | 105±2 | 5.4±0.5 | 12.9±0.4 | 13.4±0.3 | |
| S | 76±9 | 1.1±0.2 | 0.07±0.08 | 105±1 | 5.0±0.5 | 13.2±0.3* | 13.2±0.7 | ||
| 4 months storage | Hayward | A | 114±16 | 1.2±0.3 | 0.09±0.07 | 116±1 | 3.3±0.8 | 11.4±0.4 | 11.9±1.0 |
| S | 104±18* | 1.2±0.3 | 0.12±0.06* | 116±1 | 4.4±1.3* | 10.7±0.6* | 13.3±0.7 | ||
| Jintao | A | 73±15 | 1.1±0.2 | 0.02±0.10 | 104±2 | 2.3±0.5 | 13.9±0.6 | 9.8±0.5 | |
| S | 83±14* | 1.2±0.3 | 0.00±0.05* | 102±2* | 2.0±0.6 | 14.7±0.6* | 9.6±0.6 |
Table 7
Qualitative parameters of fruits from asymptomatic plants (A), infected and symptomatic plants (SP) or symptomatic branches of diseased plants (SB) of A. deliciosa cv. Hayward, at harvest, after two months in cold storage, or after cold storage plus one week of shelf life. Values followed by different letters are significantly different according to Fisher’s LSD test (P < 0.05)
| Weight (g) | Skin IDA | Flesh IDA | Hue angle | Firmness (kg) | °Brix | Acidity (g/L) | ||
| Harvest | A | 114±26a | 1.4±0.1a | 0.43±0.12a | 115±1 | 7.1±0.8a | 5.8±0.5a | 21.1±2.0 |
| SP | 113±27a | 1.4±0.1a | 0.36±0.11b | 115±1 | 7.0±0.8ab | 6.2±1.0b | 20.1±0.8 | |
| SB | 102±27b | 1.3±0.2b | 0.40±0.13ab | 115±1 | 6.7±0.8b | 5.9±0.8a | 21.5±0.7 | |
| Storage | A | 125±20a | 1.3±0.1a | 0.21±0.18 | 101±2a | 4.2±0.8 | 11.0±0.9a | 14.1±0.5a |
| SP | 124±28a | 1.4±0.1a | 0.21±0.09 | 103±2b | 4.7±0.7 | 11.7±1.3b | 13.2±0.5ab | |
| SB | 99±25b | 1.2±0.2b | 0.18±0.10 | 115±1c | 4.3±1.3 | 11.1±1.6ab | 12.6±0.4b | |
| Shelf life | A | 112±27 | 1.4±0.1a | 0.09±0.09a | 115±1 | 1.5±0.7 | 13.6±0.8a | 11.7±0.0a |
| SP | 114±27 | 1.4±0.1a | 0.13±0.11ab | 115±1 | 1.9±1.2 | 13.4±1.4a | 9.8±0.1ab | |
| SB | 104±27 | 1.3±0.1b | 0.15±0.11b | 115±1 | 1.5±0.9 | 12.1±1.5b | 8.0±0.1b |


