
Effects of passive and active modified atmosphere packaging conditions on quality parameters of minimally processed table grapes during cold storage
Abstract
BACKGROUND:
Table grape is a non-climacteric berry, sensitive to water loss and gray mold during postharvest storage.
OBJECTIVE:
To assess the effect of passive and active modified atmosphere packaging on quality parameters of minimally processed table grapes.
METHODS:
‘Red Globe’ minimally processed table grapes were dipped in a sodium hypochlorite solution and irradiated with ultraviolet-C, before being packaged in a rigid polypropylene boxes, sealed with a micro perforated polypropylene film (PP) or a continuous polyethylene film, with: a) 5% O2 + 15% CO2 + 80% N (PET1); b) 20% CO2 + air (PET2). Samples were stored at 5°C for 21 days plus and additional 6-day period at 20°C to simulate shelf-life.
RESULTS:
No chemical and sensory changes during storage occurred in fruit sealed in PP packages. The high in-package CO2 partial pressure which increased in PET1 and PET2 combined with the reduced concentration of O2, increased decay incidence, stimulated anaerobic respiration, hastened soluble sugars degradation, produced higher weight loss and altered sensory quality.
CONCLUSIONS:
Quality of minimally processed ‘Red Globe’ was better maintained in PP packaging where air-composition was not changed than in PET1 and PET2 where toxic levels of CO2 and reduced tension of O2 hastened quality loss and increased decay incidence.
1Introduction
Table grape is a non-climacteric berry with a low rate of physiological activity, very sensitive to water loss and gray mold (Botrytis cinerea) during postharvest handling and cold storage. Gray mold is the most aggressive postharvest disease, because of its ability to develop at low temperatures. Despite health hazard concerns and the great effort to find alternative means of control, the application of sulfur dioxide (SO2) immediately after packing [1–6] is still the standard practice to prevent gray mold.
Marketability of table grape may also be reduced by shatter, which is a physiological disorder leading to the loss of berries from the cap stem waterberry, which causes excessive softening and a watery and flabby texture in ripe grape, and rachis browning [7].
In the last decade consumers demand for fresh and high quality ready-to-eat products has increased exponentially, both for their uniform piece size and convenience as a nutritious snack alternative. Whole bunches of table grape are normally prepared for market in wooden, plastic or carton packages with paper strips separating bunches or also by individual wrapping of bunches in sponge or macro-perforated plastic bags [8]. Furthermore, table grape is particularly suitable to be minimally processed, as tissue injuries occurring during processing are quite limited. The product is, in fact, prepared either by pulling off the berries from the cap stem or by dividing a bunch in small clusters of few berries. Processed berries are then packaged in rigid plastic units or in plastic units wrapped within a polyolephinic film. The modified atmosphere created by the package prevents water loss, browning, and may significantly prolong the shelf-life [9, 10].
The aim of this work was to study the effects of a passive or active modified atmosphere packaging on quality parameters and decay incidence of minimally processed ‘Red Globe’ table grape during 21 days of cold storage plus 6 days at 20°C (shelf-life).
2Materials and methods
2.1Plant material
Red table grape (Red Globe) clusters were harvested from a 6-years-old commercial vineyard, located in Mazzarrone (37° 05’ N, 14° 34’ E, 128 m a.s.l., CT). Vines were grafted onto Ru 140 (V. berlandieri × V. rupestris) spaced 2.8 m × 2.8 m apart (1275 plants/ha) and trained to a “tendone” training system, covered with white net. The orchard received ordinary horticultural care in terms of fertilization, irrigation and soil management.
Red Globe table grape were hand-picked during the third week of September at commercially ripe stage (≥15.0°Brix), suitable for the fresh fruit market.
2.2Sample preparation and packaging
After harvest, Red Globe bunches were immediately transported to the laboratory and selected on the basis of uniform size, berry color, firmness, lack of diseases and greenish rachises. Each bunch was then cut with sanitized scissors to obtain samples of clusters each of about 200 g. After selection, clusters samples were dipped in a sodium hypochlorite solution (150 ppm active chlorine) for 5 min to control microbial spoilage. After dipping clusters were irradiated with ultraviolet-C (UV-C) following previous studies and commercial practices [11]. Grapes were placed in a single layer on the processing line and the selected UV-C dose (6.0±0.1 kJ/m2) was applied by establishing a specific exposure time (illumination steps of 2 min) at a fixed distance (60 cm) [12]. The fluence rate of the lamps at the level of the samples was 2.82±0.44 mW cm–2, measured with a Blak-Ray photometer (Ultra-Violet Products, Inc., San Gabriel, CA). Red table grapes were treated after harvest with ultraviolet-C light (UV-C) in combination with sodium hypochlorite solution, to check the effect of both treatments on quality and fungal decay of minimally processed table grapes.
At end of the UV-C treatment, each cluster was packaged in a 15×8 cm rigid polypropylene retail boxes and sealed with two different films: a) 30μm thick polypropylene film with laser micro perforations of 60μ diameter (O2 permeability: 2.500 ml m–2 d–1 atm–1 at 5°C) and b) 30μm thick polyethylene continuous film (O2 permeability: 1.300 ml m–2 d–1 atm–1 at 5°C).
The modified atmosphere in packages sealed with the micro-perforated film was achieved passively (PP), while initial atmosphere in boxes sealed with continuous films was actively modified by two different initial headspace gas compositions: 1) 5% O2 + 15% CO2 + 80% N (PET1) and 2) 20% CO2 + air (PET2). The sealed boxes were then stored at 5°C and 90% RH for 21 days followed by a 6-day retail at 20°C.
A total number of 135 sealed boxes (3 blocks×5 repl. ×3 treatments×3 storage periods) were evaluated for quality after storage on days 7, 14, 21 at 5°C. 30 additional boxes were stored at 5°C for weight loss evaluation during cold storage (10 boxes for treatments). At the end of the 21 days storage period another set of fruit (3 blocks×5 repl. ×3 treatments×2 storage periods) were left at 20°C for 6 days to simulate shelf-life conditions and evaluate for quality after 3 and 6 days at 20°C; 30 additional boxes were stored at 20°C for weight loss evaluation during the shelf-life (10 boxes for treatments) and 90 additional sealed boxes (3 boxes×3 treatments×10 judges) were evaluated by sensory analysis judges at the end of the shelf-life.
2.3Headspace gas composition
In-package O2 and CO2 partial pressures were measured, immediately before quality evaluation, using an O2 and CO2 portable analyzer (Checkpoint, Dansensor Italia, Segrate, Milano, Italy) after 7, 14, 21 days at 5°C and at 3 and 6 days during the shelf-life at 20°C using 15 packages for each treatment.
2.4Quality parameters: Firmness, soluble solids, titratable acidity, weight loss, decay and browning
For each treatment, 15 randomly chosen boxes were used. Berry analysis included: weight loss, total soluble solids content (TSS), juice pH and titratable acidity (TA), berry decay incidence and browning severity.
Total soluble solids content (TSS) was determined by a digital refractometer (Palette PR-32, Atago Co., Ltd); titratable acidity (TA) was measured by titration of 10 ml homogenized berry flesh juice with 0.1 N NaOH to an endpoint of pH 8.1 and expressed as the percentage of tartaric acid (mod. S compact titrator, Crison Instruments, Barcelona, Spain). Berry weight loss was calculated on 10 sealed boxes for each treatment (10 boxes×3 treatments), and expressed as the percentage reduction with respect to initial time.
Percentages of physical damage, decay caused by fungi and browning were calculated separately, during the shelf- life period after 21 days of storage at 0°C and 3 and 6 days at 20°C, by counting the number of rot berries; decay incidence was calculated as the percentage of rotten berries.
Flesh browning was assessed by measuring the extent of browned area on each fruit on the following scale: 0 = no browning; 1 = less than 1/4 browning; 2 = 1/4–1/2 browning; 3 = 1/2–3/4 browning; 4 = more than 3/4 browning. The browning index (BI) was calculated, using the following formula: [(1·N1 + 2·N2 + 3·N3 + 4·N4) · 100/(4 · N)], where N = total number of fruit measured and N1, N2, N3 and N4 were the number of fruit showing the different degrees of browning [13].
2.5Sensory evaluation
After 21 days of cold storage plus 6 days at 20°C (shelf-life), 3 sealed boxes for treatment (2 berries in each box) were evaluated by each of a ten judges trained panel that generated a list of descriptors in a few preliminary meetings. Sensory analysis was focused on firmness, crunchiness, juiciness, sweetness, sourness, off-flavor, off-odor and visual appearance of the berries [14]. The different descriptors were quantified using a ten point intensity scale where the digit 1 indicates the descriptor absence while the digit 10 the full intensity [15]. The order of presentation was randomized between judges. Water was provided for rinsing between samples.
2.6Total phenolics, total anthocyanins and antioxidant capacity
Grape samples were chopped into small sections and analyzed in the same day for each considered chemical parameter. Analytical grade products (Fluka and Sigma-Aldrich Chemie, Italy) were used without any purification. The relative standard deviation (RSD) for each triplicate analytical determination was also considered.
In order to evaluate the total phenolic amount 2 g of homogenized sample were added with 10 mL of pure ethanol. The extraction was made using a vortex mixer mod. RX3 for 60 seconds. The mixture was filtered and the filtrate was taken into a test tube. The Folin-Ciocalteau micro method of Waterhouse [16] was used to determinate the total phenolic content (TPC). 300μL of the filtrate were diluted in 4.8 ml of Milli-Q grade water and 300μL of Folin-Ciocalteau reagent was added. After 8 min, 900μL of 20% Na2CO3 solution was added and mixed. The absorbance values were measured at 765 nm using SHIMADZU UV mini- 1240 spectrophotometer after a chemical reaction time of 30 min at 40°C. A calibration curve of gallic acid (3, 4, 5- trihydroxybenzoic acid) was prepared in the concentration range from 0–50μg mL–1 and used as a standard. The results were given as mg gallic acid equivalent per g of fresh weight.
Antioxidant capacity was determined based on the ability of grape sample to scavenge free radical 2,2-diphenylpicrylhydrazyl (DPPH). DPPH free radical scavenging activity was determined using a modified method of Ohnishi [17] and Matthaus [18] 50μl of filtered grape juice were added to the same amount of DPPH solution (3 mM). Then 95% ethanol was added to final volume of 1 ml. The mixture was mixed thoroughly and allowed to stand in the dark for 10 min at room temperature. Absorbance values were then determined at 515 nm using the above mentioned spectrophotometer. The radical scavenging activity was expressed as% of inhibition considering A0 the absorbance of the control and A1 absorbance of the sample one [19].
Total anthocyanins amount in the extracts was determined according to the procedure described by, with some modifications. In order to achieve anthocyanins extraction, 25 ml of Ethanol:HCl 1.5 N (85:15) solution were added to 2 g of grape sample and allowed to stand at 4°C for one night. After extraction, the solution was filtered. The absorbance was measured using the above mentioned spectrophotometer at 530 and 657 nm. The formula (1) was used to compensate for the contribution of chlorophyll and its degraded products to the absorption at 530 nm. The anthocyanins content was expressed as milligrams of Cya-3-glucoside equivalent per 100 g fresh sample weight.
2.7Microbiological analysis
Microbiological analyses were carried out after 21 days of cold storage plus 3 days of shelf-life. Samples of 25 g (5 berries) from each sealed box and for each treatment (3 boxes×3 treatments) were obtained under sterilized conditions, homogenized in 225 mL of sterile distilled water and shaken for 30 min at 200 rpm on a rotary shaker. Serial dilutions were carried out, and 1 mL was added to plate count agar for mesophilic aerobic and for mold and yeast counts (Petrifilm Aerobic Count Plate, Laboratories 3M Sante, France). Samples were prepared in triplicate, and only counts of 30–300 colony forming units (CFU) were considered. All plates were incubated for3 days at 30°C.
2.8Statistical analysis
Data were submitted to one-way analysis of variance (ANOVA) and means were separated with Tukey’s test at P≤0.05. The statistical analysis was carried out using Systat 10 (Systat, USA).
3Results
3.1In-package gas composition
In-package CO2 increased during cold storage and even during the shelf-life period in all treatments (Fig. 1A). However, while in PP packages changes were very slight in cold storage and peaked to 2.7 kPa after 6 days at 20°C, in PET1 and PET2 samples the levels of CO2 increased dramatically since the first sampling date, with values in both treatments significantly higher than initially. At the end of cold storage the CO2 partial pressure was 33 and 41 kPa in PET1 and PET2, respectively, and further increased in shelf-life conditions with final values of 44 kPa in PET1 and 60 kPa in PET2. The in-package levels of O2 were complementary to CO2: in PP packages slightly declined with storage and shelf-life and ranged between 20.5 kPa and 19 kPa; while in PET1 and PET2 packages its partial pressure was always below 1 kPa (Fig. 1B).
3.2Decay and browning and weight loss
At the end of cold storage decay incidence was quite low in all treatments, with losses of about 1% in PP packages and around 3% in PET1 and PET2 ones. During the six days of shelf-life the percentage of rotted berries only slightly but not significantly increased (Fig. 2A). Rachis browning occurrence was rare, did not increase during shelf-life and was significantly higher in PET2 packages than in PP one, while its incidence did not significantly differ in PET1 from the other two treatments (Fig. 2B). Weight loss increased gradually in cold storage and suddenly when fruit were moved to -conditions, especially in PET1 and PET2 (Table 1). In particular, after 21 days at 5°C weight loss was 5.36% in PP packages against 10.37 and 12.17 of PET1 and PET2, but during the 6 days at 20°C losses peaked to 24.6% in PET2 and to 23.09% in PET1, while in PP packages the percentage of weight loss was slightly higher than 9% . Despite in both packages with continuous film, PET1 and PET2, losses were always much higher than in PP packages, differences between the two were always significant, even at the last sampling date when differed of only 1.53% (Table 1).
3.3Titratable acidity, total soluble solids, total phenols, total anthocyanins and antioxidant capacity
TSS did not change in PP packages while in cold storage and showed a slight, although significant, reduction only after 6 days at 20°C, when from the initial value of 16.7° Brix TSS decreased to 15.8° Brix (Table 1). In contrast, in PET1 and PET2 the reductions in TSS were marked and significant even from the first sampling time and continued at a faster rate during the shelf-life period, with final values of 13.6 and 12.4, respectively in PET1 and PET2 packages (Table 1). As a general trend, TSS seems to be slightly higher in PET1 packages than in PET 2 ones, but difference was significant only at the last sampling date.
Differently than TSS, TA was very stable over the whole course of the experiment and differences among treatments were never significant, apart after 14 days at 5°C, when values detected in PP packages were slightly but significantly higher than in PET2 ones (Table 1).
No significant changes occurred, between treatments, in terms of total phenols (Fig. 3A) and total anthocyanins content (Fig. 3B). The overall trend of total phenols seemed more stable or even stimulated in PP packages, with the exception of results of day 14 at 5°C. On the other hand, phenolics average content was generally lower in PET1 and PET2 packages, even if data at the end of cold storage, when the highest level of polyphenols was detected in PET1 packages, and at the end of shelf-life, when polyphenols were not different among all treatments, are not consistent with the overall trend.
The antioxidant capacity partially paralleled the changes in polyphenols; it was generally higher in PP packages, albeit in some cases it was lower or similar to the other treatments (Fig. 3C). Accordingly, differences between PET1 and PET2 were un-predictable and inconsistent.
3.4Sensory evaluation
Sensory evaluation was conducted only after 3 days of shelf-life. All descriptors had the highest scores in PP packages, with the exception of off-flavor and off-odor, which resulted higher in PET1 and PET2 packages than in PP ones (Fig. 4).
3.5Microbiological analysis
PP was the most effective packaging treatment in reducing mesophilic aerobic bacteria and yeast counts (Fig. 5). Microbiological contamination did not change in PET1 and PET2 packages for both kinds of microorganisms.
4Discussion
Water loss, stem browning and, above all, gray mold (Botrytis cinerea), are the main cause that reduce table grape marketability. Sulfur dioxide continue to be the most popular mean to control gray mold [7, 8], but its application is not conceivable on ready-to-eat table grapes that will be consumed within a few days from packaging and in most cases as soon as the package is opened. The world-wide effort to replace sulfur dioxide has brought about to different alternative means safer for consumers [21]. Controlled atmosphere storage is gaining more popularity than others means for the absence of residue. High levels of CO2 markedly reduce gray mold growth with a complete inhibition with levels above 20–25% [22]. Passive or active modified atmosphere packaging showed some potential for ready-to-eat table grape. In cv Italia, no remarkable differences were found in terms of appearance and marketable quality due to barrier films [23], while a significant reduction of decay after 7 days at 0°C followed by 4 days at 8°C plus 2 days at 20°C was found in ‘Superior seedless’ table grape sealed in a micro perforated polypropylene with in-package CO2 levels never exceeding 10 kPa [4]. Decay was completely suppressed in packages made with continuous polypropylene films where CO2 tension peaked to about 20 kPa [4]. However, in our study decay incidence was lowest in berries packed and sealed with micro perforated film; in this treatment, in-package gas composition was similar to air. A higher decay occured in active modified packages made with the continuous film, where in-package CO2 ranged between 25 and 40 kPa in cold storage and 35 and 60 kPa in shelf-life conditions.
High levels of CO2 can be phytotoxic, especially in combination with low levels of O2, particularly in sensitive species. Indeed, beneficial effects of a better control of pathogens by high levels of CO2 could be offset by CO2-induced injuries [9, 22].
In our experiment, the sanitizing effect of postharvest sodium hypochlorite combined with UV-C treatment, was very effective in preventing any gray mold infection. The high levels of in-package CO2 added no advantage in reducing decay, but its toxicity might injure the tissue, making the berries sealed in PET1 and PET2 more susceptible to decay than those sealed in PP.
Despite water loss is considered the main cause of stem and rachis browning [24, 25] other factors can significantly affect this disorder. Stem browning severity increased when ‘Red Globe’ grape was stored for 3 months at 0°C with levels of CO2 higher than 10 kPa [26]. In our study, despite all treatments were very effective in reducing browning severity, in accordance with the above cited ones, stem browning appeared rarely and slighter in PP samples than in PET1 and PET2 packages.
The most striking effect of continuous films was the shift from aerobic to anaerobic metabolism of berries, whose objectively measurable physiological consequences were the higher weight loss and TSS degradable rates. Water loss usually accounts for about 95–97% of total weight loss [27]. In this study, based on water transmission rate of the used films, expected weight loss had to be much higher in PP packages than in PET1 and PET2 ones, but the results were exactly the opposite. This can only be explained by a marked anaerobic activity, which occurred in samples sealed with the continuous film (PET1 and PET2). This hypothesis is supported by the composition the head-space of PET1 and PET2 packages, which, since the first sampling time done after 7 days at 5°C, showed levels of CO2 of 23–34 kPa that continuously increased with final values of 44–60 kPa. In contrast, O2 levels were always below 1 kPa. A further evidence that shows as the anaerobic metabolism might be the factor that mostly contributed to the higher weight loss of PET1 and PET2 packaged berries is given by the gradual but continuous decline in TSS which occurred in PET1 and PET2 berries, differently than in those packaged in PP film, which only at the last sampling showed a slight reduction in TSS with respect to harvest time. However, TA content was not affected either by the storage time or the type of package, most likely because the main available substrates were sugars and notorganic acids.
Phenolic compounds and anthocyanins determine the characteristics of color and taste in fruit, such as bitterness and astringency and have positively been correlated with fruit antioxidant capacity [28, 29]. Polyphenols levels and changes over storage can be affected by various factors, as storage temperature, interaction with other chemical compounds as well in-package gas composition [30]. A typical response to mechanical damages common to various fruits and vegetables is an increase in phenylalanine ammonio-lyase (PAL) activity which stimulates new synthesis of phenolic compounds that in turn may prevent pathogens’ attacks [31, 32]. However, the response and its magnitude depend on species, severity of mechanical damage and in-package gas composition. For example, significant increases of soluble phenolic acids such as chlorogenic or caffeic acid, associated with a PAL increase, were observed in carrots and in ‘Lollo Rosso’ lettuce after cutting and during the early days of storage in air at 4 to 5°C; on the other hand, phenolic synthesis was halted when samples were packaged in modified atmosphere enriched in CO2 (12% to 30%) with or without O2 (2%), or in an atmosphere containing 99% N2 [33, 34]. Accordingly, total phenols of ready-to-eat table grape cv Shahaneh berries were higher when single berries were prepared with the stem removed, than in a 4-berry cluster, because processing operations induced more damage in the former case, [35]. Our results showed a large variability in total phenols from one sampling date to the others. This might be a consequence of the intrinsic variability in chemical composition of table grape among bunches and even among berries of the same bunch, likely due to difference in ripening stage of individual berries [32], which might have overwhelmed the effect of the treatments. Nevertheless, the overall results showed a substantial stability of polyphenols in PP packages alongside with overall lower levels detected in PET1 and PET2 treatments, whose synthesis might be inhibited by the excessively high levels headspace CO2 [33, 34].
Anthocyanins content, as polyphenols, was very variable and did not show a clear effect of the treatments, although their overall level slightly increased with storage.
While low temperature is known to induce accumulation of anthocyanins in different fruit species [36, 37] included table grape [31], modified atmosphere technology does not seem to be a suitable tool for maintaining anthocyanins in fruit and vegetables [31, 34]. Yet, recently it was reported that sanitation treatments with ultraviolet light (UV-C, λ 254 nm, 30 to 510 W) effectively increased anthocyanin concentrations in products with high anthocyanin contents, such as red grapes [38]. It is, then, possible that the overall stability of anthocyanins, especially in PET1 and PET2 packages, might be the results of contrasting factors; the inhibitory effect of high levels of CO2, from one side, and the stimulating consequence of ultraviolet treatment and low storage temperatureon the other.
Changes in antioxidant capacity matched well with those of polyphenols, even if, as a general trend, it seemed to be slightly higher than polyphenols were in PP packages. In a previous study [35] the antioxidant capacity of ready-to-eat individual berries without stem increased sharply during the first week of storage, but declined at a higher rate than in a 4-berry cluster. The authors, in accordance with previous results with ready-to-eat avocados [39], attributed this behavior to an increased initial stress-induced antioxidant capacity in individual berries that subsequently declined faster for the more oxidative process involving wounded tissues. A general decreasing trend occurred over storage of ready-to-eat table grapes [31], and a positive correlation occurred between flavonoids and antioxidant capacity [35]. In contrast, in this study the antioxidant capacity matched better with total phenols than with total anthocyanins.
Berries sealed with PP films had the highest overall quality, since they were judged firmer, sweeter than PT1 and PET2, and always got a higher score for the other descriptor with the exception of off-flavor and off-odors. Nevertheless the overall sensory quality of PET1 and PET2 berries, despite markedly worse than PP one, would have been still acceptable, but for the high perception of fermentative volatiles which irremediably altered theeating quality.
Mesophilic microorganisms represent one of the most important indicators of food quality and their level is extensively used to assess microbiological quality and safety of ready-to-eat produce. It expresses the adequacy of temperature and sanitation control during processing, transport, and storage, and reveals potential sources of contamination during manufacture [40]. Our results showed an overall lower population both of mesophilic aerobic microorganisms and of yeast and mold in PP packages. However, even in PET1 and PET2 packages despite the anaerobic conditions, the overall microorganism population was similar to the load detected in other studies with table grape [41], never exceeding 105 cfu g–1, and below the safe quality limits established in Europe, which suggested in the range of 105–108 cfu g–1 [40].
5Conclusions
Objective of this study was to assess quality changes and decay incidence of ready-to-eat ‘Red Globe’ table grape using three different modified atmosphere packaging compositions. Indeed, PP packages, realized using a micro perforated film, rather than a “modified atmosphere packaging” was a “modified humidity packaging”, as in-package CO2 and O2 partial pressures were slightly altered with respect to air. In contrast, in-package gas compositions in PET1 and PET2 packages were markedly different due to the relatively high barrier to gas exchange of the used continuous film but also for the initial composition of gases used to achieve the PET1 and PET2 active modified atmosphere packaging.
PET1 and PET2 were tested to confirm previous results reported in other studies [4, 22, 32] on the effectiveness of high levels of CO2 to control decay incidence incited by Botrytis cinerea as feasible alternative to SO2 fumigations. Results showed that in-package gas composition of PET1 and PET2, with high levels of CO2 and very low concentrations of O2 did not reduce decay incidence as PP did more effectively. Moreover, despite the excessive length of the storage period and the relatively high temperatures both during cold storage and shelf-life conditions for ready-to-eat produce, samples sealed in PP packages accused lower qualitative changes related to chemical composition, visual appearance and eating quality. In contrast in PET1 and PET2 berries overall quality declined very quickly and fermentative metabolism replaced aerobic respiration even in cold storage as shown by the high rate of TSS degradation and excessive weight loss.
Therefore the overall results show that when a proper pre-harvest fungicide spray program is combined with a postharvest treatment with sodium hypochlorite associated with UV irradiation, grey mold growth can effectively be controlled in ready-to-eat ‘Red Globe’ berries and that a modified atmosphere packaging with high levels of CO2 and reduced concentration of O2, rather than reducing, may sustain pathogens’ growth and hastening quality loss. Similar results, in terms of grey mold control, were obtained in several studies with ozone treatments in storage room [42], but ozone penetration through the plastic cavity trays used in some experiments was partially inhibited because of the mycelial growth on the surface of the fruit in contact with the plastic [43]. Therefore additional research is needed to evaluate the impact of current commercial packages on the efficacy of ozone gas during coldstorage.
Considering that, differently than other fruit, table grape does not gain any beneficial physiological effects from an altered air gas composition and that transpiration rate is the major cause of marketable quality, provided an effective sanitizing treatment is given, we conclude that a “modified humidity packaging” contribute to maintain overall quality of ready-to-eat ‘Red Globe’ table grape better than modified atmosphere packaging systems where in-package gas composition is markedly altered with respect to air.
References
1 | Crisosto CH, Mitchell FG(2002) Postharvest handling systems: Table grapesKader AAPostharvest technology of horticultural crops, Publication 3311University of california357363 |
2 | Avissar I, Pesis E(1991) The control of postharvest decay in table grapes using acetaldehyde vapoursAnn Appl Biol118: 1229237 |
3 | Crisosto CH, Garner D, Crisosto G(2002) Carbon dioxide-enriched atmospheres during cold storage limit losses from Botrytis but accelerate rachis browning of ‘Redglobe’ table grapesPostharvest Biol Technol26: 181189 |
4 | Artés-Hernández EA, Artés F, Tomás-Barberán FA(2007) Enriched ozone atmosphere enhances bioactive phenolics in seedless table grapes after prolonged shelf lifeJ Sci Food Agric87: 5824831 |
5 | Archbold DD, Hamilton-Kemp TR, Clements AM, Collins RW(1999) Fumigating ‘Crimson Seedless’ table grapes with (E)-2-hexenal reduces mold during long-term postharvest storageHortSci34: 4705707 |
6 | Karabulut OA, Gabler FM, Mansour M, Smilanick JL(2004) Postharvest ethanol and hot water treatments of table grapes to control gray moldPostharvest Biol Technol34: 169177 |
7 | Crisosto, CH, Smilanick JL. Table Grapes. In: The Commercial Storage of Fruits, Vegetables, and Florist and Nursery Stocks, USDA Agriculture Handbook 66. http://www.ba.ars.usda.gov/hb66/grapeTable.pdf. Accessed 13 April 2015 |
8 | Mencarelli F, Bellincontro A, Di Renzo G. GRAPE: Post-harvest Operations – In Danilo Mejía editor. “Agricultural and Food Engineering Technologies Service”– Food and Agriculture Organization of the United Nations, 2005 |
9 | Kader AA, Zagory D, Kerbel EL(1989) Modified atmosphere packaging of fruits and vegetables CritRev Food Sci Nutr28: 130 |
10 | Martinez-Romero D, Guillen F, Castillo S, Valero D, Serrano M(2003) Modified atmosphere packaging maintains quality of table grapesJ Food Sci68: 18381843 |
11 | Freitas PM, López-Gálvez F, Tudela JA, Gil MI, Allende A(2015) Postharvest treatment of table grapes with ultraviolet-C and chitosan coating preserves quality and increases stilbene contentPostharvest Biol Technol105: 5157 |
12 | Allende A, Marín B, Buendía B, Tomás-Barberán F, Gil MI(2007) Impact of combined postharvest treatments (UV-C light gaseous O3, superatmospheric O2 and high CO2) on bioactive constituents and shelf-life of strawberriesPostharvest Biol Technol46: 201211 |
13 | Wang YS, Tian SP, Xu Y(2005) Effects of high oxygen concentration on pro- and anti-oxidant enzymes in peach fruit during post harvest periodsFood Chem91: 99104 |
14 | Valverde JM, Valero D, Martinéz-Romero D, Guillén F, Castillo S, Serrano M(2006) Novel edible coating based on aloe vera gel to maintain table grape quality and safetyJ Agric Food Chem53: 78077813 |
15 | Chervin C, Westercamp P, Monteils G(2005) Ethanol vapours limit Botrytis development over the postharvest life of table grapesPostharvest Biol Technol36: 319322 |
16 | Brand-Williams W, Cuvelier M, Berset C(1995) Use of a free radical method to evaluate antioxidant activityLebnsm Wiss Technol28: 2530 |
17 | Ohnishi M, Morishita H, Iwahashi H, Toda S, Shirataki Y, Kimura M, Kido R(1994) Inhibitory effects of chlorogenic acids on linoleic acid peroxidation and hemolysisPhytochem36: 579583 |
18 | Matthaus B(2002) Antioxidant activity of extracts obtained from residues of different oil seedsJ Agric Food Chem50: 34443452 |
19 | William B, Cuvelier E, Berset C(1995) Use of a free radical method to evaluate antioxidant activityLebnsm Wiss Technol28: 2530 |
20 | Rabino I, Mancinelli A(1986) Light, temperature, and anthocyanins productionJ Plant Physiol81: 922924 |
21 | Romanazzi G, Lichter A, Mlikota Gabler F, Smilanick J(2012) Recent advances on the use of natural and safe alternatives to conventional methods to control postharvest gray mold of table grapesPostharvest Biol Technol54: 118121 |
22 | Thompson AK. Controlled atmosphere storage of fruits and vegetables. CAB International, Wallingford, UK, 1998 |
23 | Del Nobile MA, Conte A, Scrocco C, Brescia I, Speranza B, Sinigaglia M, Perniola R, Antonacci D(2009) A study on quality loss of minimally processed grapes as affected by film packagingPostharvest Biol and Technol51: 2126 |
24 | Lecas M, Brillouet JM(1994) Cell wall composition of grape berry skinsPhytochemistry5: 512411243 |
25 | Lichter A, Kaplunov T, Zutchi Y, Alchanatis V, Ostrovsky V, Lurie S(2011) Physical and visual properties of grape rachis as affected by water vapor pressure deficitPostharvest Biol Technol59: 2533 |
26 | Crisosto CH, Smilanick JL, Dokoozlian NK(2001) Table grapes suffer water loss, stem browning during cooling delaysCalif Agric55: 3942 |
27 | Gaffney JJ, Baird CD, Chau KV(1985) Influence of airflow rate, respiration, evaporative cooling, and other factors affecting weight loss calculations for fruits and vegetablesTrans ASHRAE91: 690707 |
28 | Iriti M, Faoro F(2010) Bioactive Chemicals and Health Benefits of Grapevine ProductsWatson RR, Preedy VRBioactive foods in promoting health – fruits and vegetablesAcademic PressLondon, UK581620 |
29 | Kalt W(2001) Health functional phytochemicals of fruitHort Rev27: 269316 |
30 | Poyrazoglu E, Gökmen V, Artik N(2002) Organic acids and phenolic compounds in pomegranates (Punica granatum L.) grown in TurkeyJ Food Comp Anal15: 567575 |
31 | Romero I, Sanchez-Ballesta MT, Maldonado R, Escribano MI, Merodio C(2008) Anthocyanin, antioxidant activity and stress-induced gene expression in high CO2-treated table grapes stored at low temperatureJ Plant Physiol165: 522530 |
32 | Romero I, Caballero CF, Sanchez-Ballesta MT, Escribano MI, Merodio C(2009) Influence of the stage of ripeness on phenolic metabolism and antioxidant activity in table grapes exposed to different CO2 treatmentsPostharvest Biol Technol54: 118121 |
33 | Babic I, Amiot MJ, Nguyen-The C, Aubert S(1993) Changes in phenolic content in fresh ready-to-use shredded carrots during storageJ Food Sci58: 351356 |
34 | Gil MI, Castaner M, Ferreres F, Artes F, Tomas-Barberan FA(1998) Modified atmosphere packaging of minimally processed ‘Lollo Rosso‘ (Lactuca sativa): Phenolic metabolites and quality changesZ Lebensm Unters Forsch A206: 350354 |
35 | Shiri M, Ghasemnezhad M, Bakhshi D, Dadi M(2011) Changes in phenolic compounds and antioxidant capacity of fresh-cut table grape (Vitis vinifera) cultivar ‘Shahaneh’ as influence by fruit preparation methods and packagingAust J Crop Sci5: 1215151520 |
36 | Rapisarda P, Lo Bianco M, Pannuzzo P, Timparo N(2008) Effect of cold storage on vitamin C, phenolics and antioxidant activity of five orange genotypes (Citrus sinensis (L.) Osbeck)Postharvest Biol. Technol49: 348354 |
37 | Tsao R, McCallum J(2010) Chemistry of flavonoidsDe la Rosa LA, Alvarez-Parrilla E, Gonzàlez-Aguilar GAFruit and vegetable phytochemicals: Chemistry, nutritional value and stabilityWiley-BlackwellSingapore131153 |
38 | Cantos E, Espin JC, Tomas-Barberan FA(2001) Postharvest induction modeling method using UV irradiation pulses for obtaining resveratrol-enriched table grapes: A new functional fruitJ Agric Food Chem49: 50525058 |
39 | Plaza L, Sánchez-Moreno C, De Pascual-Teresa S, De Ancos B, Cano MP(2009) Fatty acids, sterols, and antioxidant activity in minimally processed avocados during refrigerated storageJ Agric Food Chem57: 32043209 |
40 | Barth M, Hankinson TR, Zhuang H, Breidt F(2009) Microbiological spoilage of fruits and vegetablesSperber WH, Doyle MPCompendium of the microbiological spoilage of foods and beverages, food microbiology and food safetyspringer science+business media135183 |
41 | Valero D, Valverde JM, Martìnez-Romero D, Guillìen F, Castillo S, Serrano M(2006) The combination of modified atmosphere packaging with eugenol or thymol to maintain quality, safety and functional properties of table grapesPostharvest Biol Technol41: 317327 |
42 | Sarig P, Zahavi T, Zutkhi Y, Yannaf S, Lisker N, Ben-Arie R(1996) Ozone for control of post-harvest decay of table grapes caused by Rhizopus stoloniferPhysiological and Molecular Plant Pathol48: 403415 |
43 | Palou L, Crisosto CH, Smilanick JL, Adaskaveg JE, Zoffoli JP(2002) Effects of continuous 0.3 ppm ozone exposure on decay development and physiological responses of peaches and table grapes in cold storagePostharvest Biol Technol24: 3948 |
Figures and Tables
Fig.1
Changes in CO2 (A) and O2 (B) in packages of ready-to-eat grape sealed in a microperforated polypropylene film (PP) or a continuous polyethylene film with an initial modified atmosphere of 20% CO2 + 80% N (PET1) or 5% O2 + 15% CO2 + air (PET2). For each storage time histograms with unlike letters are significantly different at P < 0.05 according to the Tukey’s test. Vertical bars are the standard deviations (n = 15).
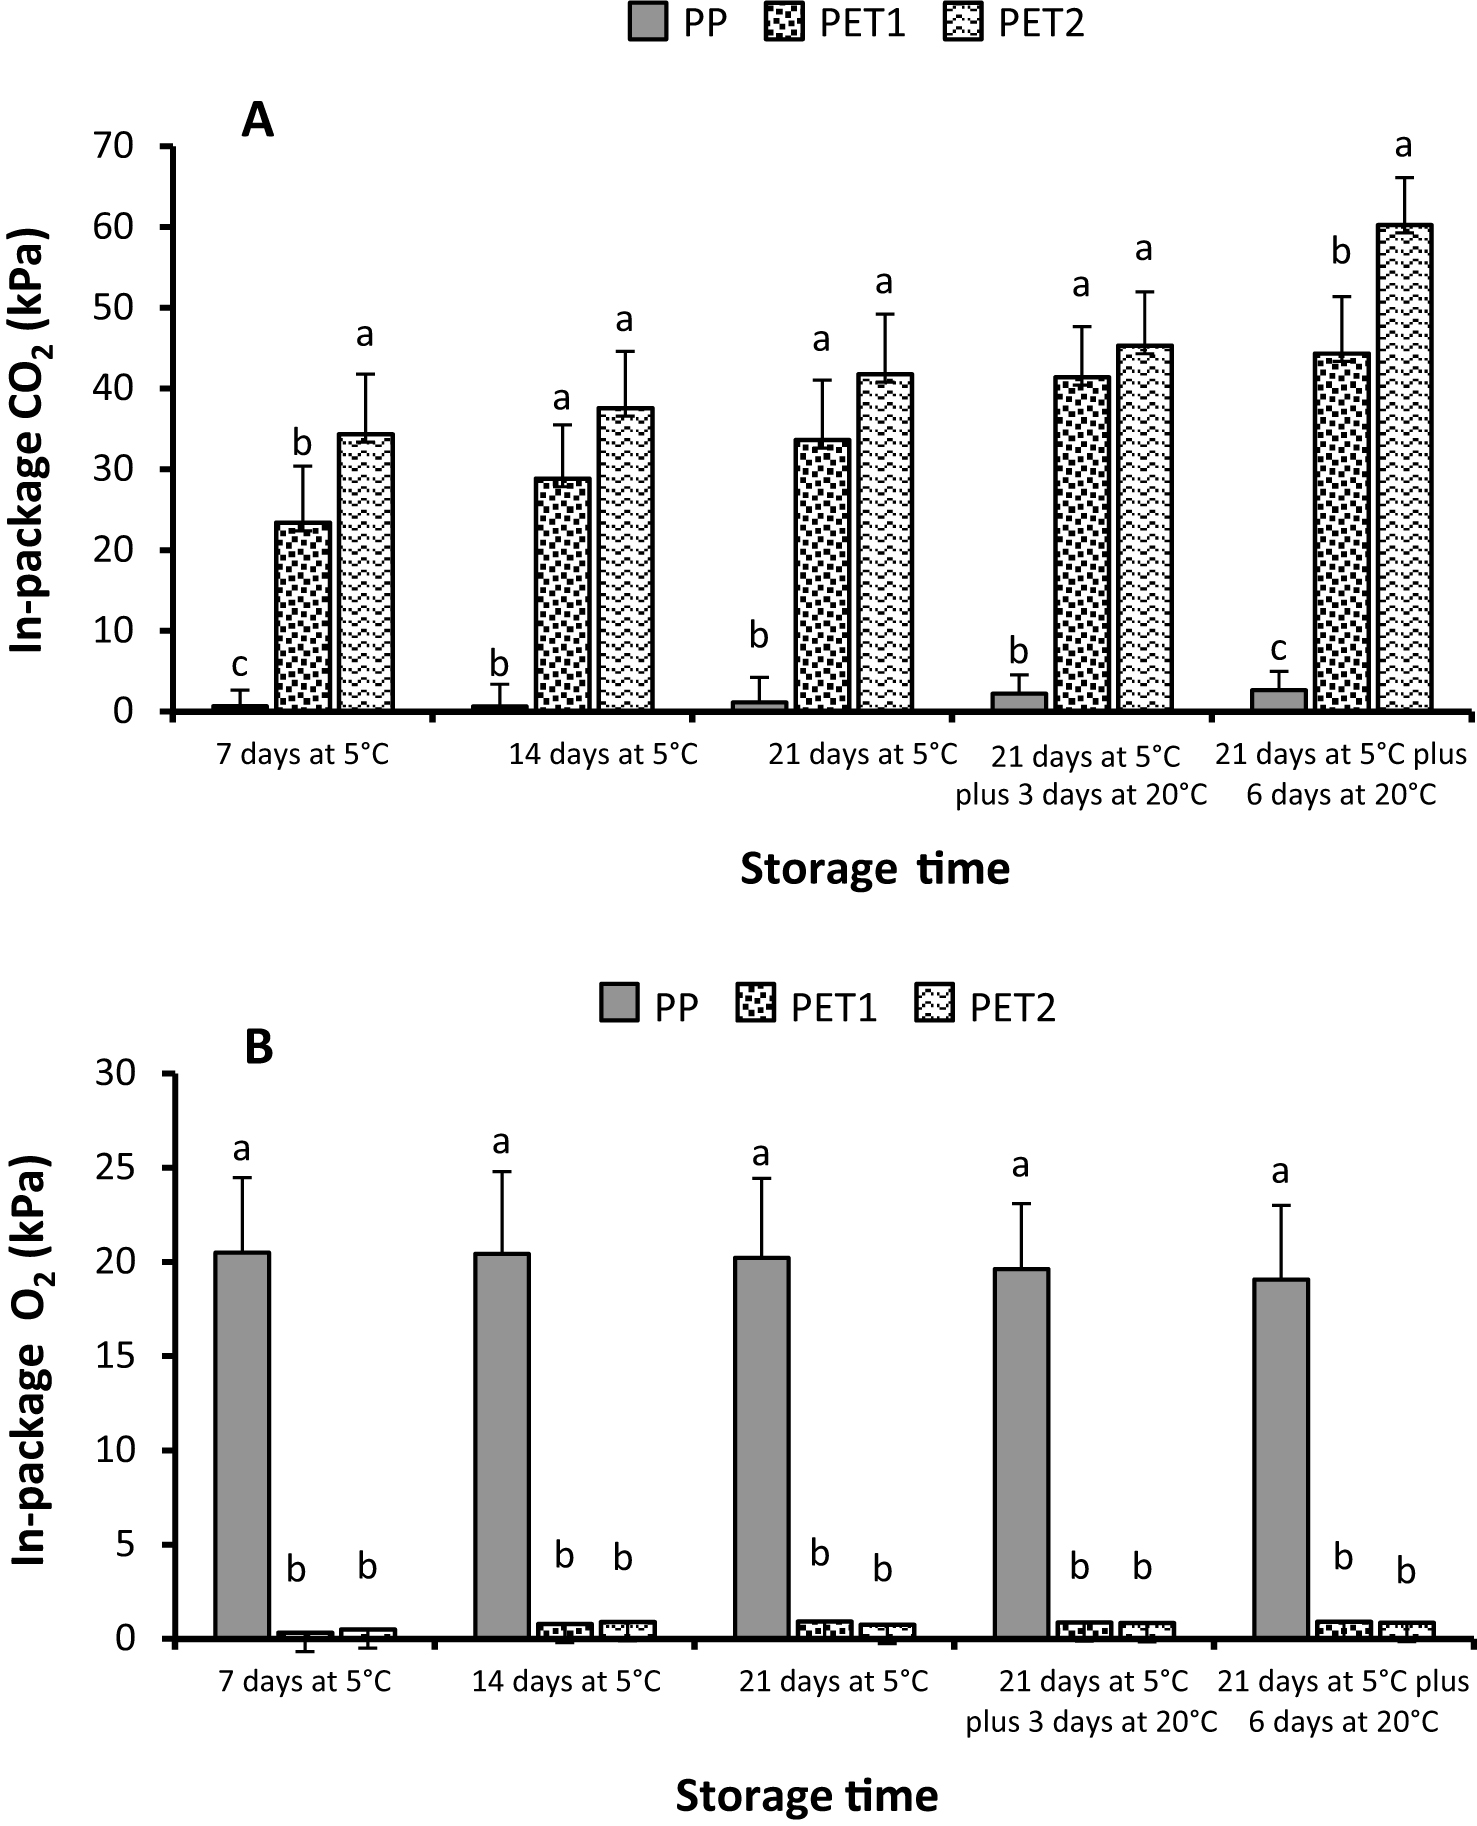
Fig.2
Decay (A) and browning (B) rates of minimally processed grape berries sealed with microperforated polypropylene film (passive MAP) (PP), with a continuous polyethylene film (active MAP: 20% CO2+ 80% N (PET1)) and with a continuous polyethylene film (active MAP: 5% O2+ 15% CO2+ air (PET2)) after 21 day storage at 5°C plus 3 days at 20°C. Data are Mean±S.E (n = 15). Column values marked with different letters are significantly different (P≤0.05).
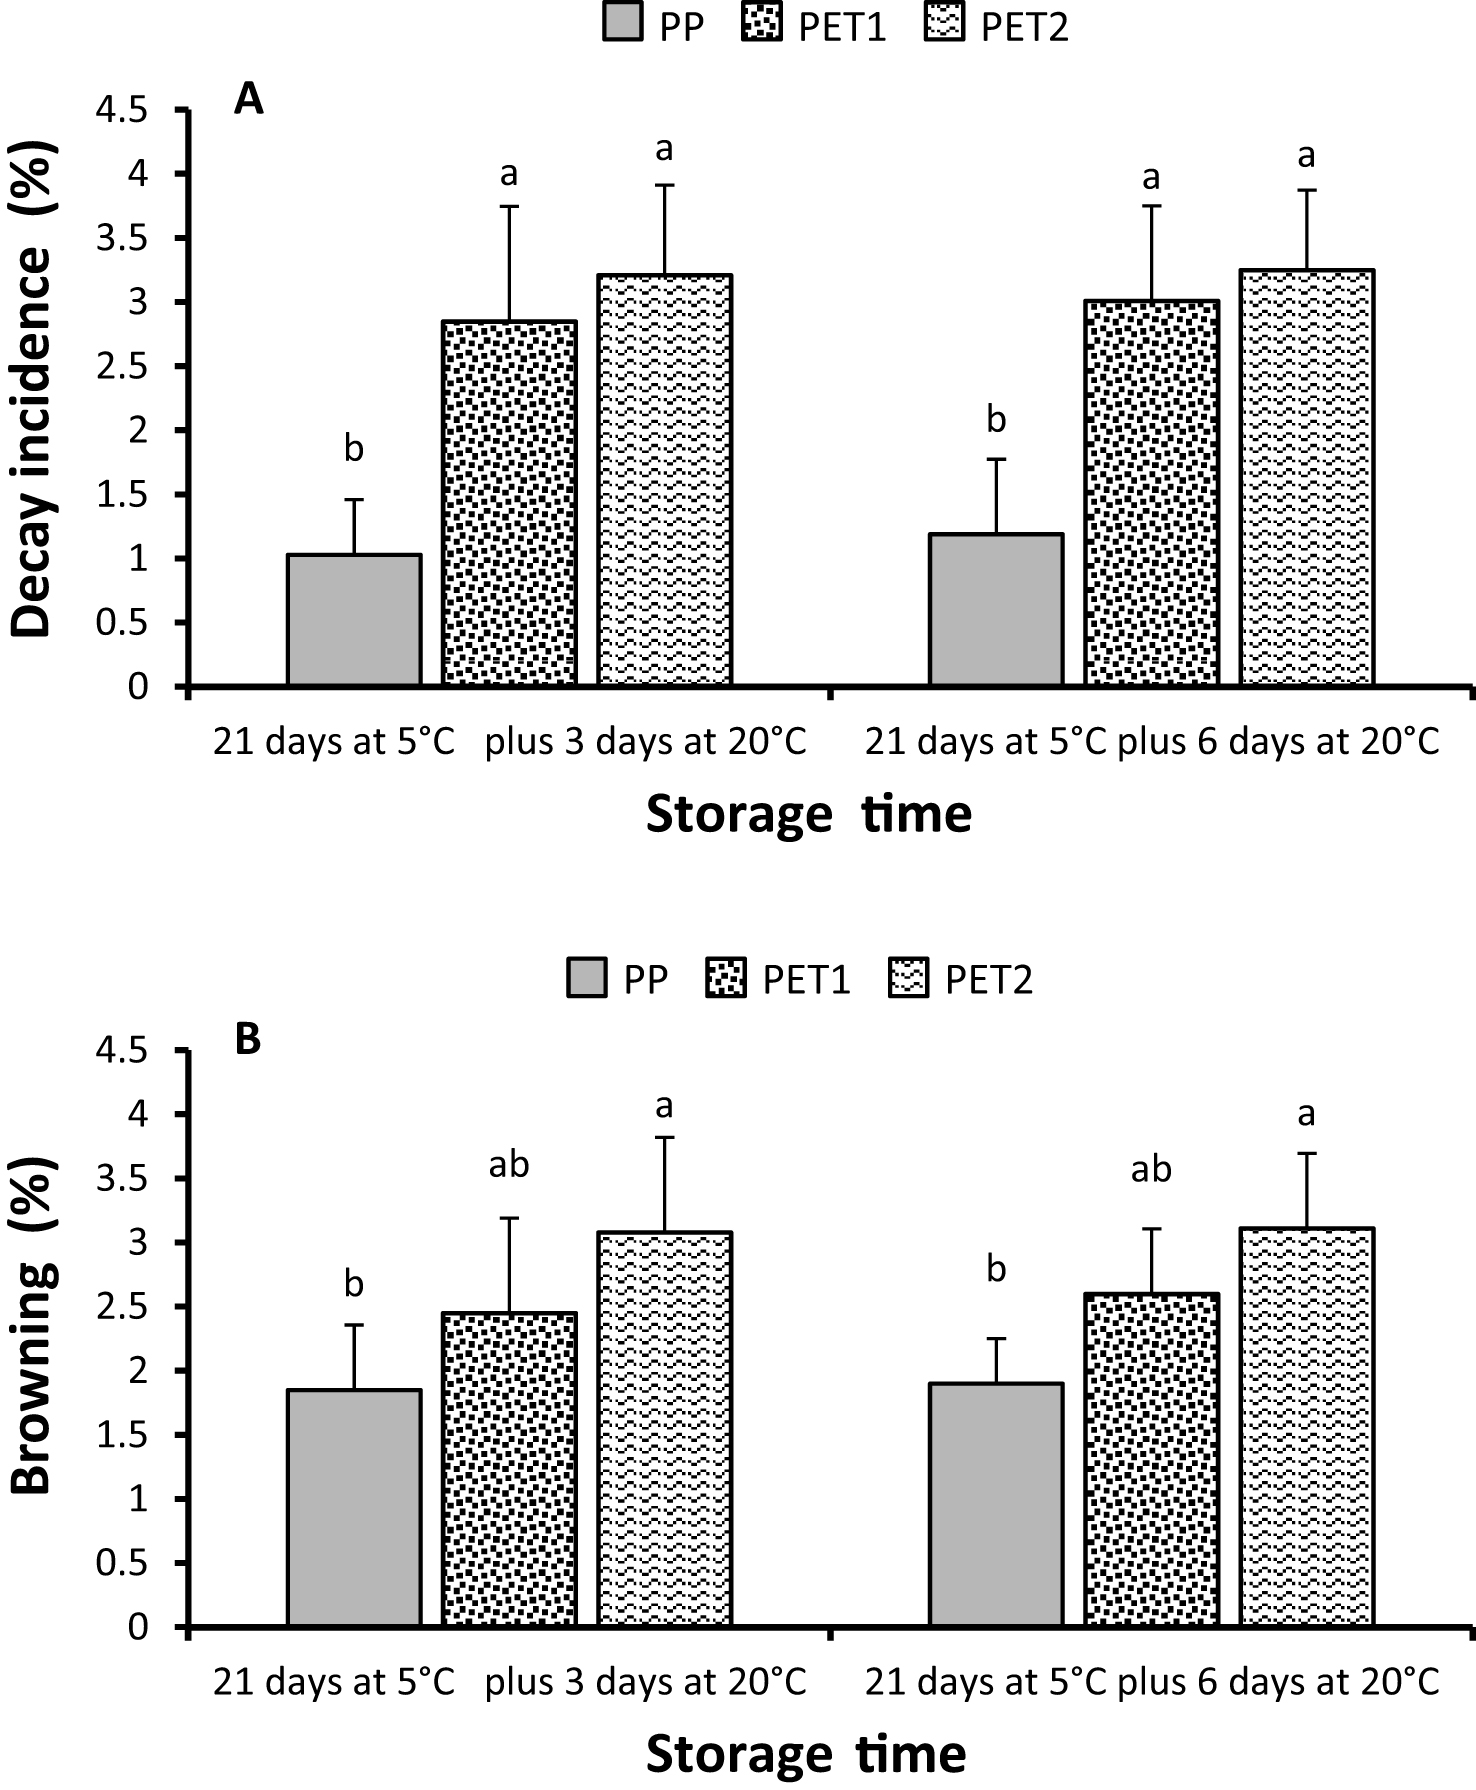
Fig.3
Changes in total phenols (A), total anthocyanins (B) and antioxidant capacity (C) in ready-to-eat grape sealed in a microperforated polypropylene film (PP) or a continuous polyethylene film with an initial modified atmosphere of 20% CO2+ 80% N (PET1) or 5% O2+ 15% CO2+ air (PET2). For each storage time histograms with unlike letters are significantly different at P < 0.05 according to the Tukey’s test. Vertical bars are the standard deviations (n = 15).
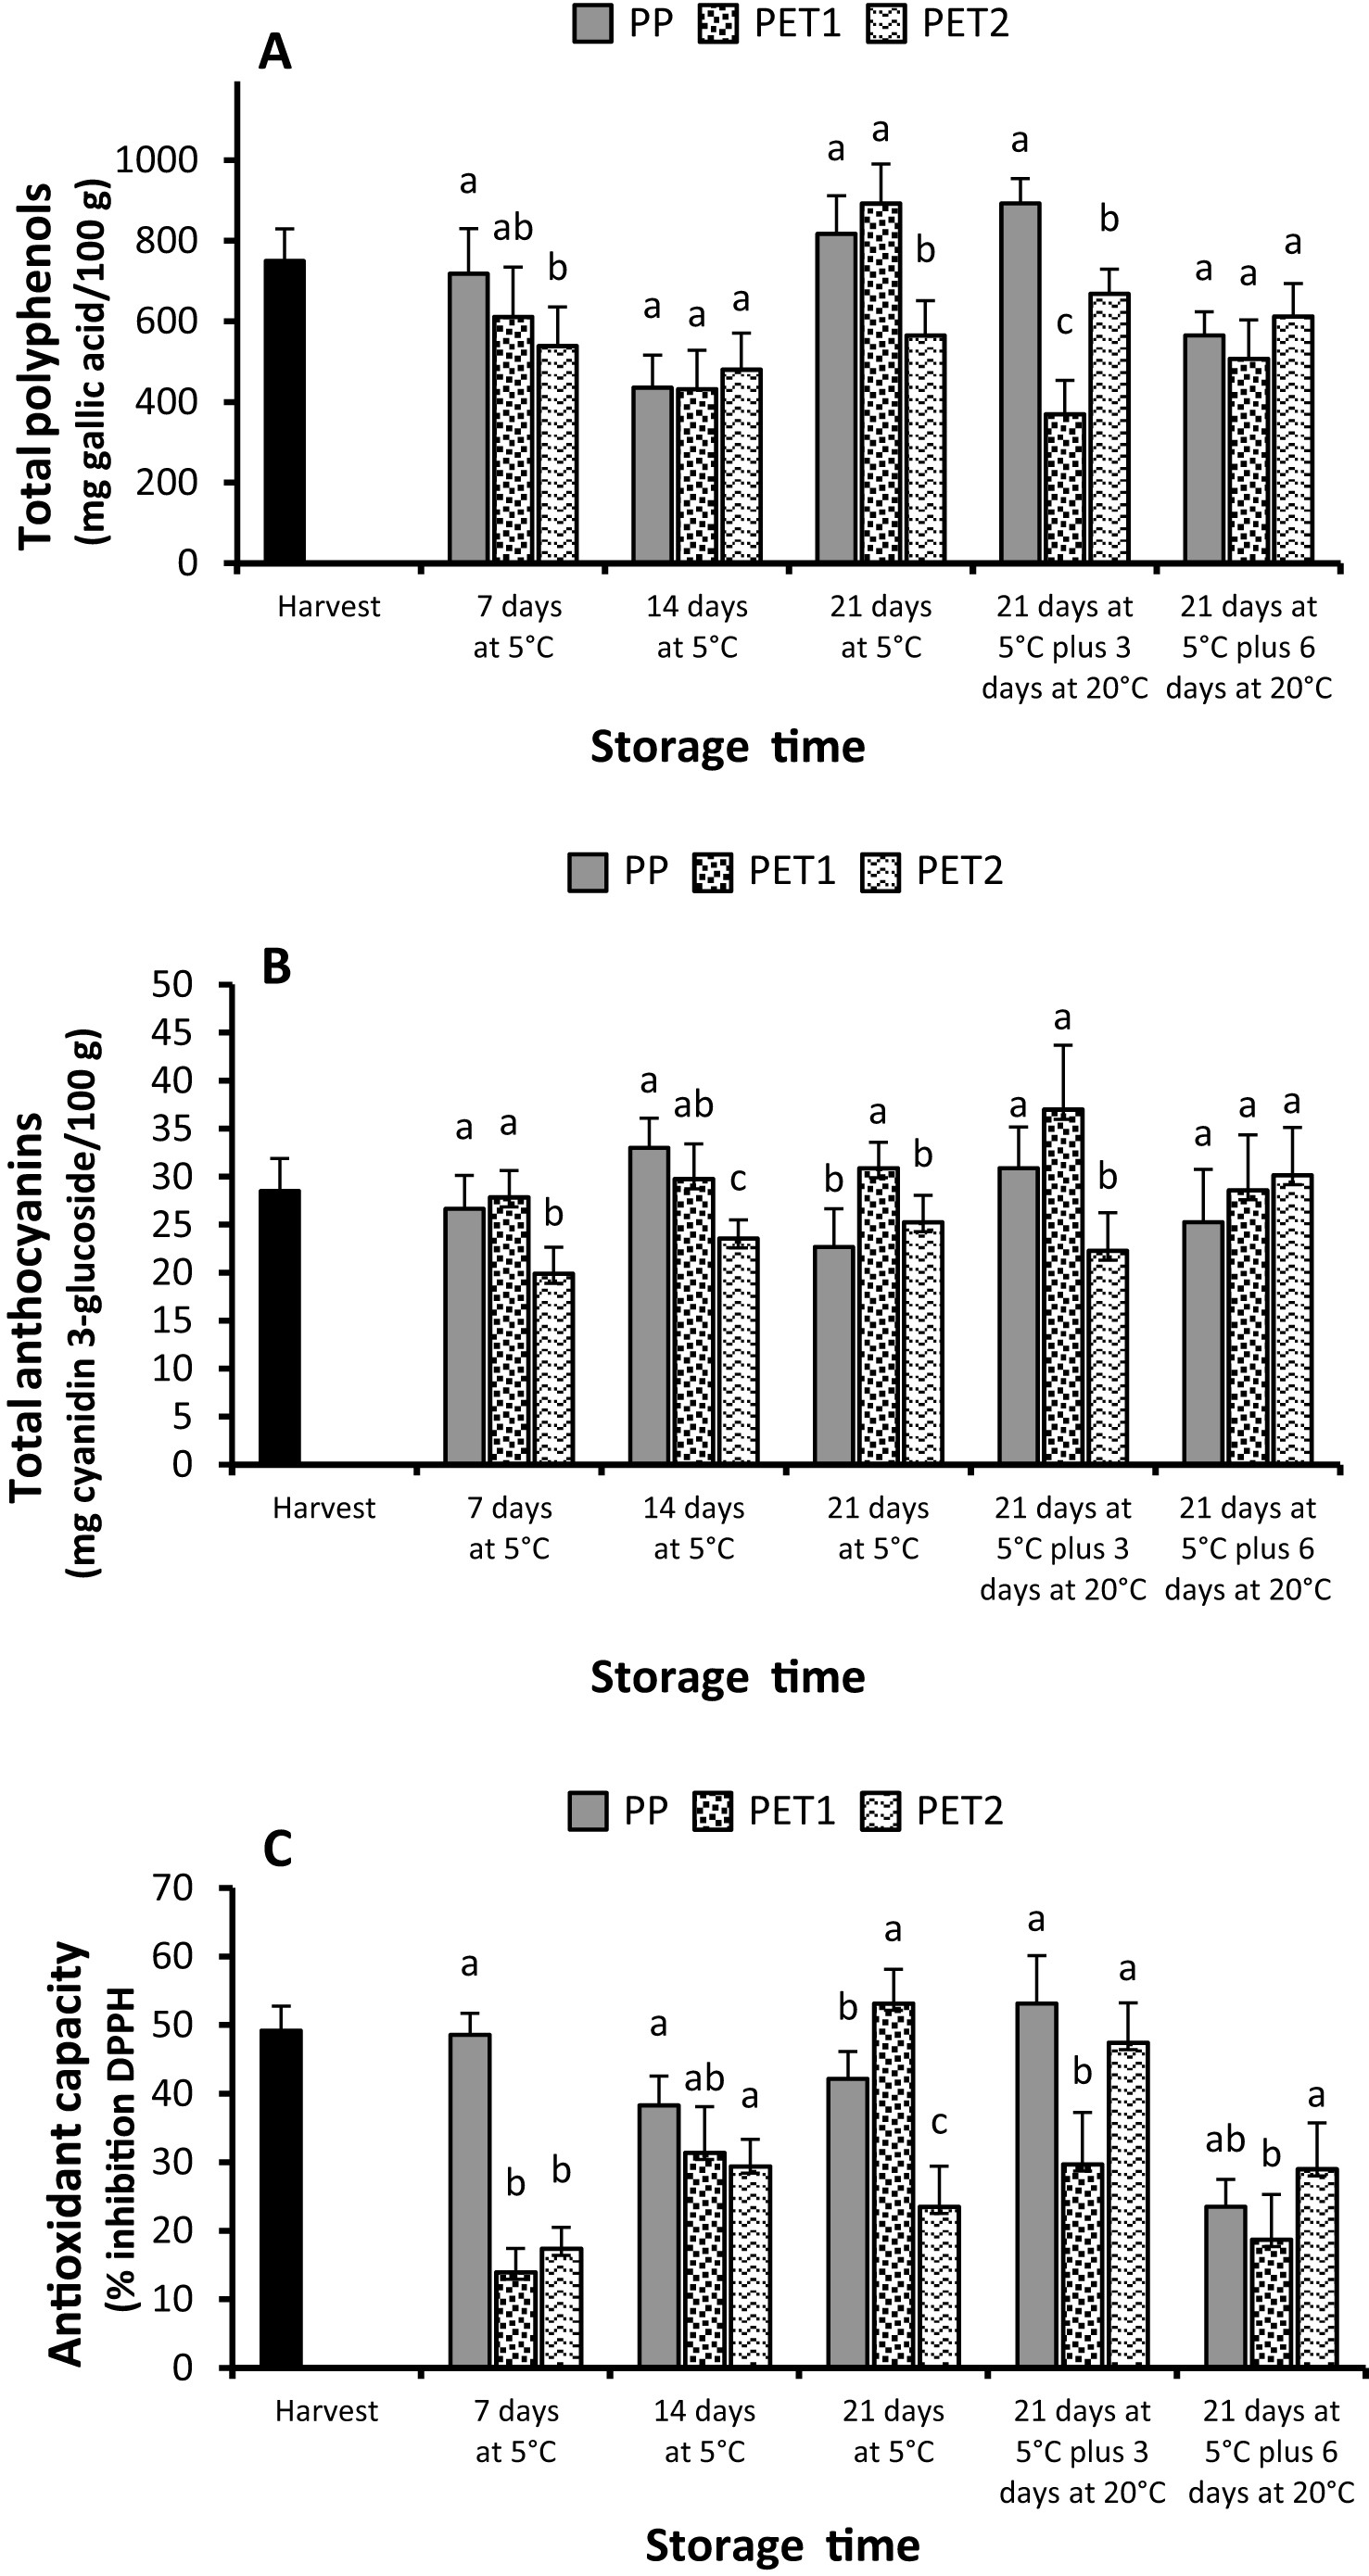
Fig.4
Scores for the sensory analysis of minimally processed grape berries sealed with microperforated polypropylene film (passive MAP) (PP), with a continuous polyethylene film (active MAP: 20% CO2+ 80% N (PET1)) and with a continuous polyethylene film (active MAP: 5% O2+ 15% CO2+ air (PET2)) after 21 days of cold storage at 5°C plus 3 days at 20°C (shelf-life). Data are means±S.E. (n = 50). Column values marked with different letters are significantly different (P≤0.05).
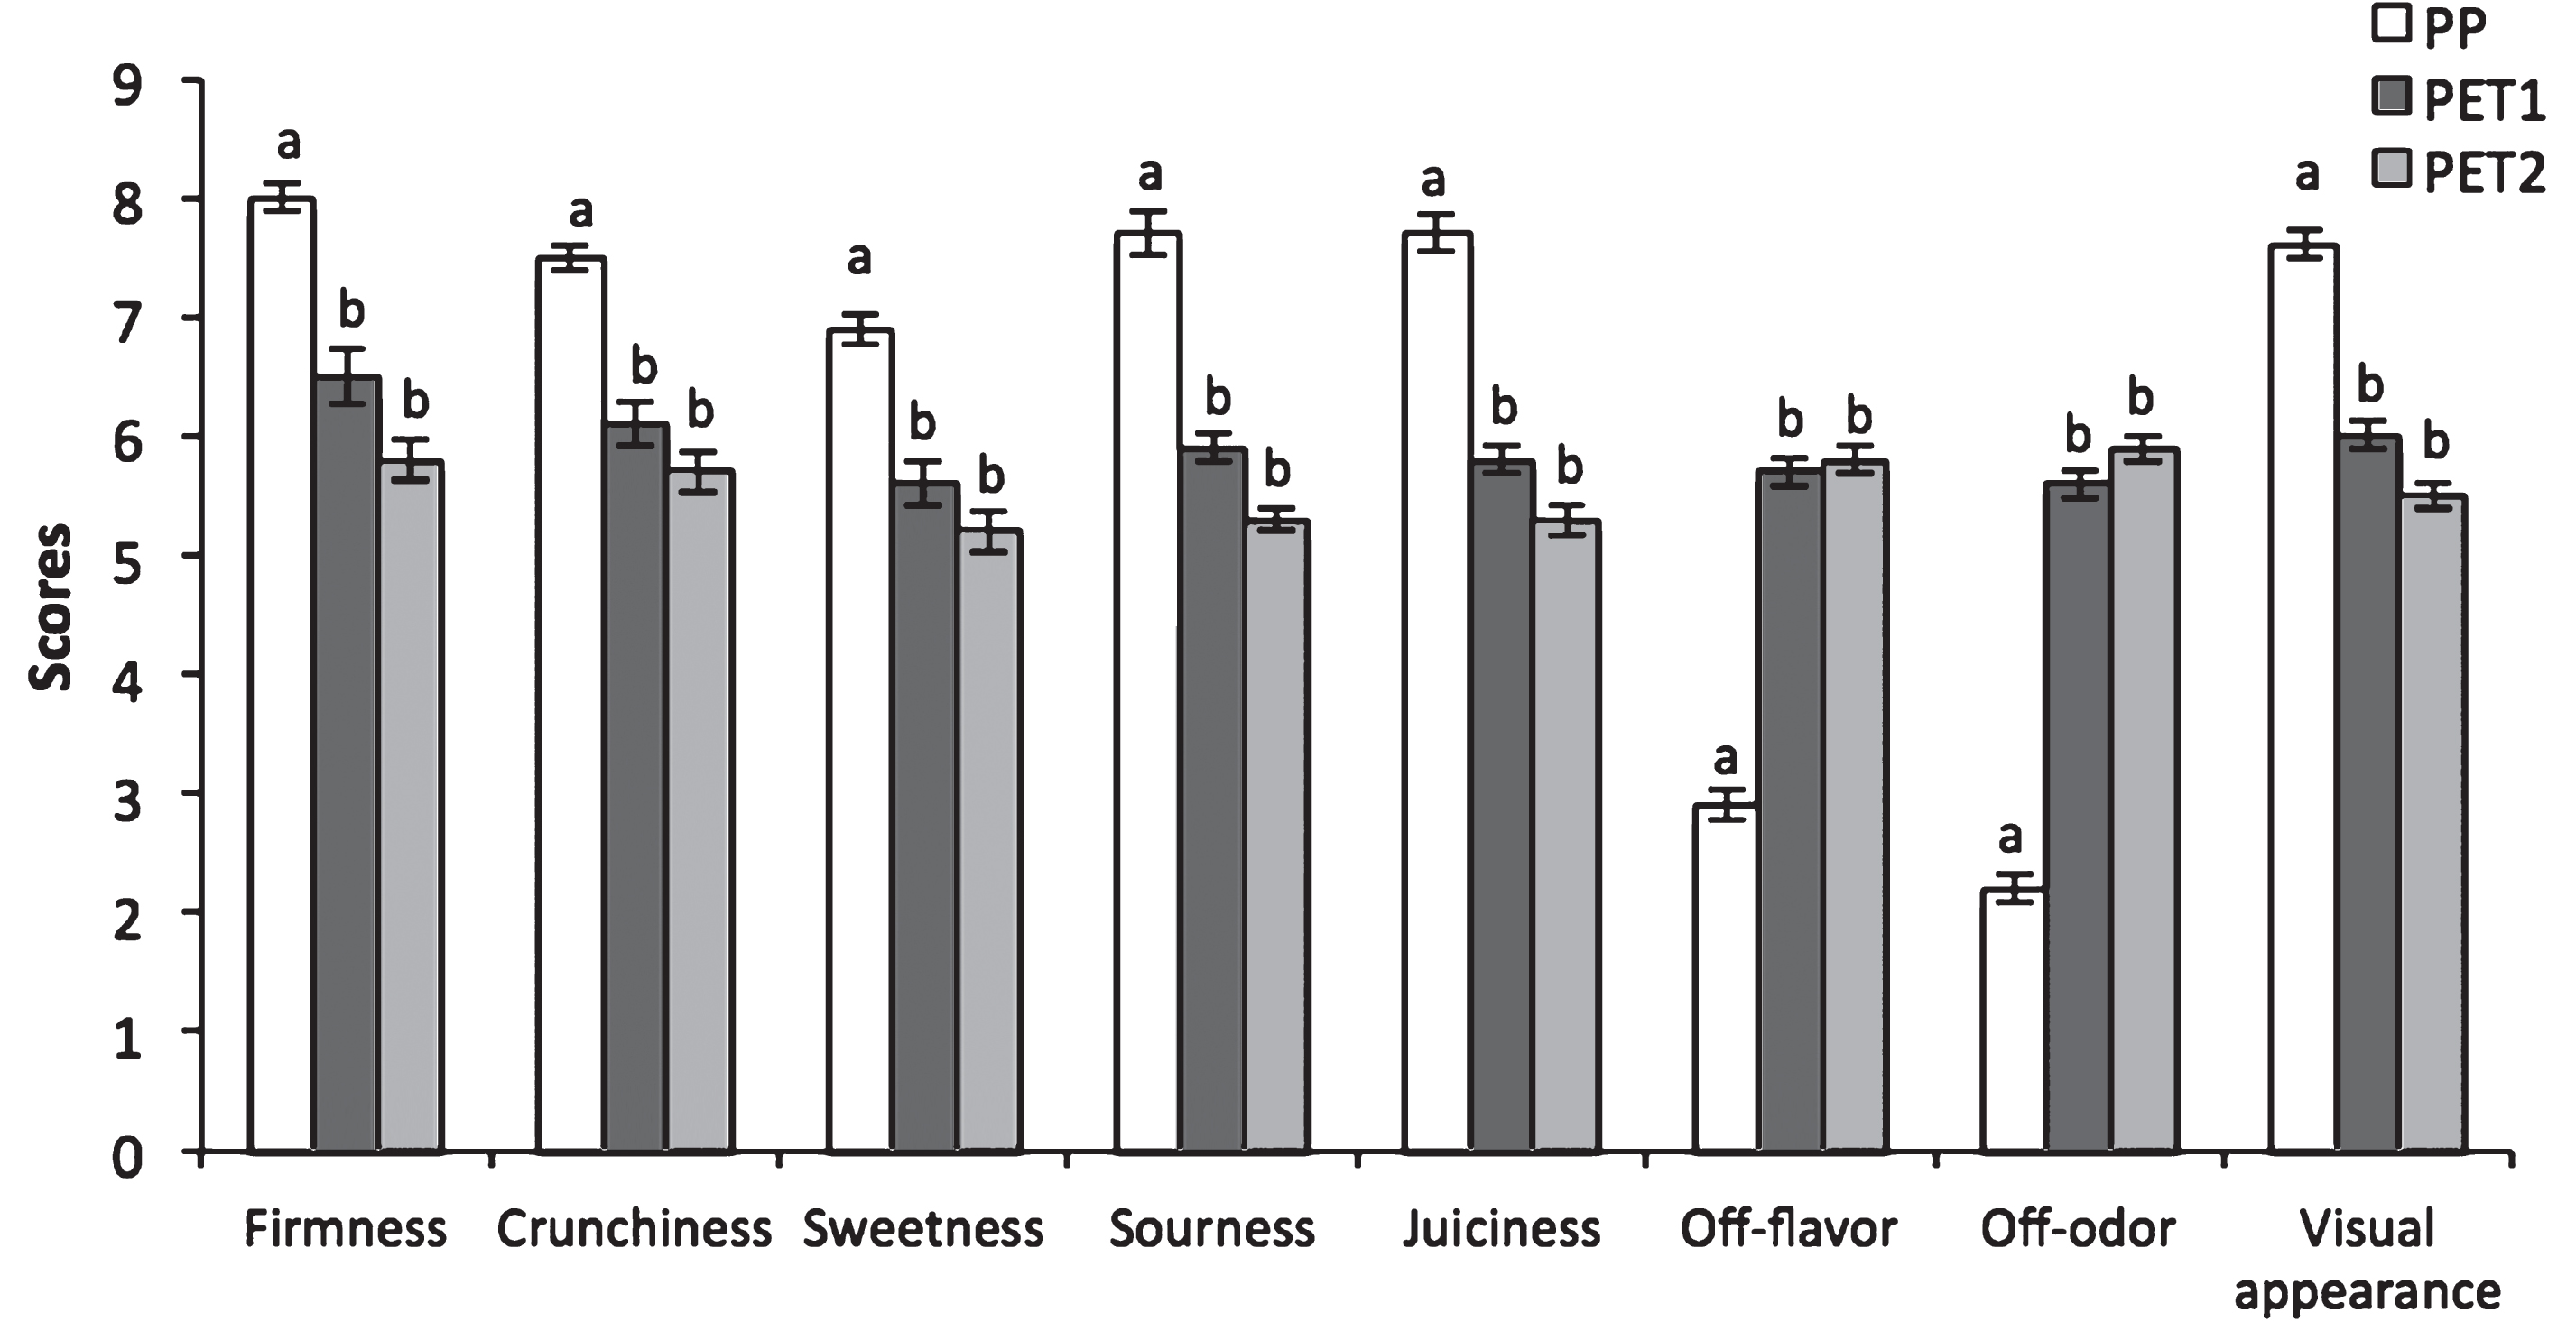
Fig.5
Mesophilic aerobic and yeast and mold counts in minimally processed grape berries sealed with microperforated polypropylene film (passive MAP) (PP), with a continuous polyethylene film (active MAP: 20% CO2+ 80% N (PET1) and a continuous polyethylene film (active MAP: 5% O2+ 15% CO2+ air (PET2)) after 21 day storage at 5°C plus 3 days at 20°C. Data are Mean±S.E (n = 5). Column values marked with different letters are significantly different within the same treatment (P≤0.05).
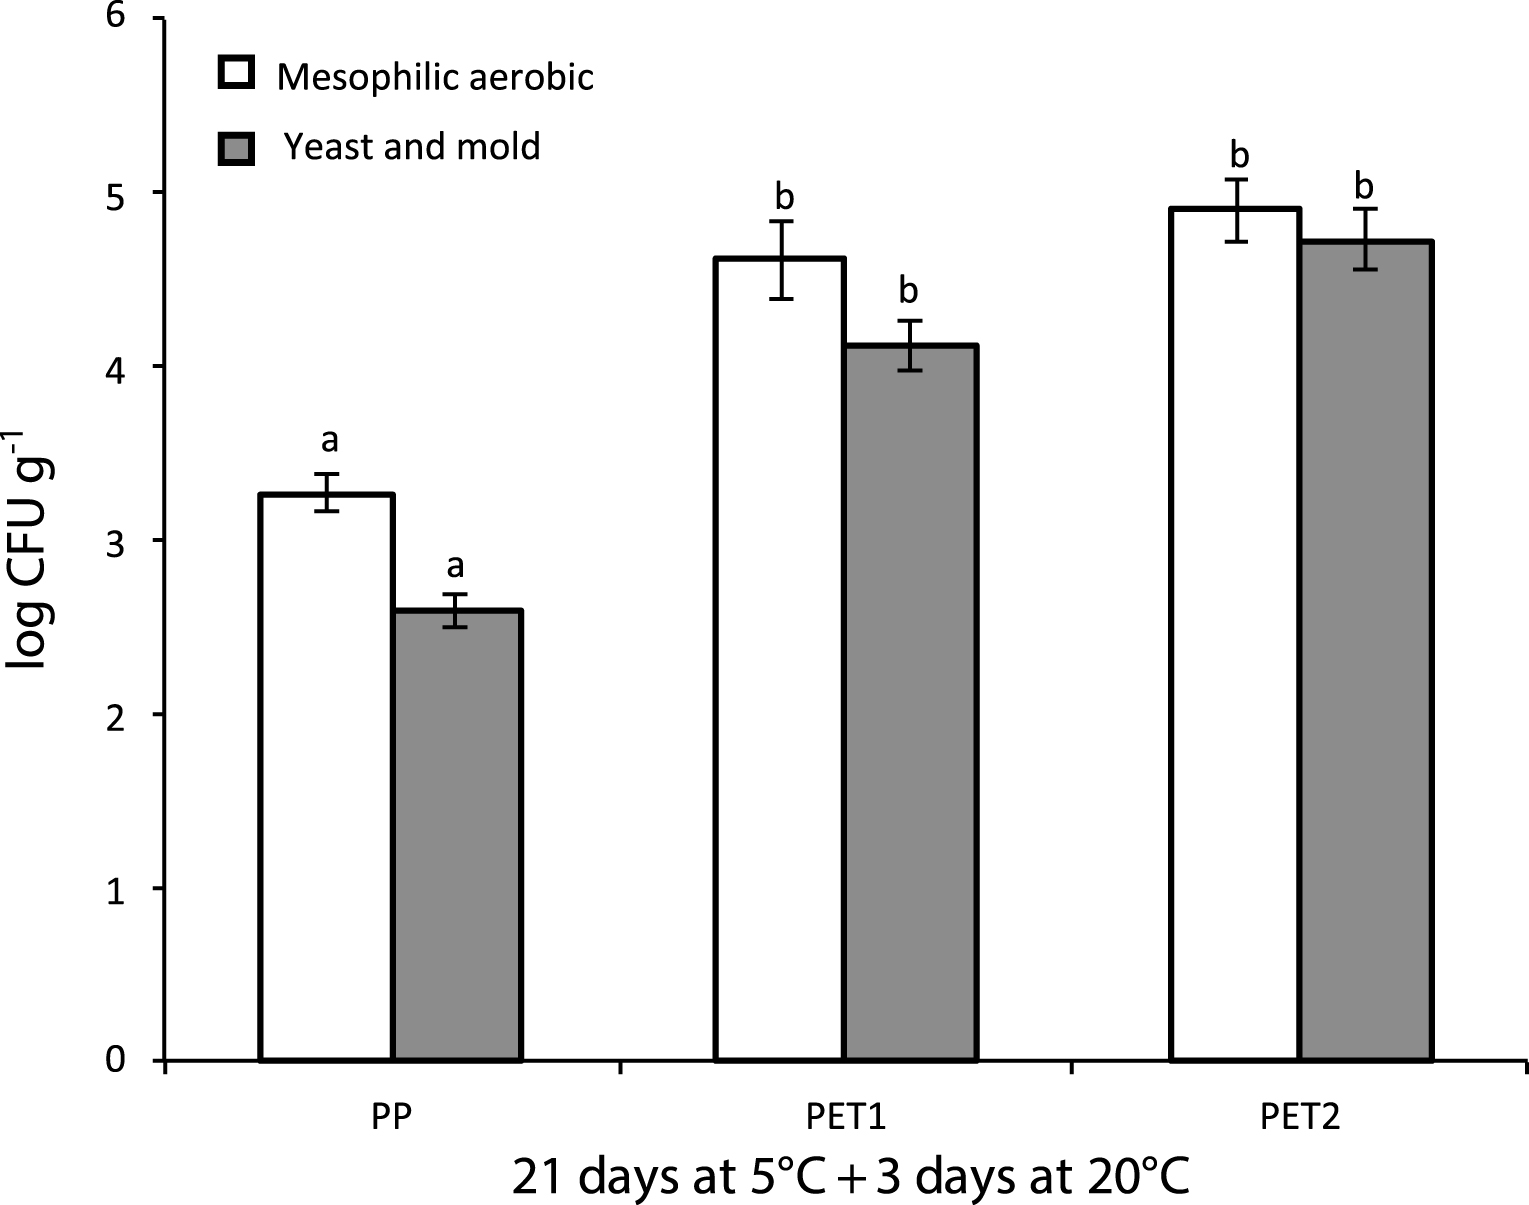
Table 1
Changes in titratable acidity, total soluble solids and weight loss in ready-to-eat grape sealed in a microperforated polypropylene (PP) film or a continuous polyethylene film under active modified atmosphere with 20% CO2+ 80% N (PET1) or 5% O2+ 15% CO2+ air (PET2)
| Treatments | Weight loss (%) | Total soluble solids (° Brix) | Titratable acidity (% tartaric acid) |
| Harvest | |||
| 16.7±0.59 | 3.5±0.23 | ||
| 7 days at 5°C | |||
| PP | 0.83±0.039 c | 16.5±0.62 a | 3.5±0.21 a1 |
| PET1 | 5.60±0.078 b | 15.7±0.61 b | 3.5±0.21 a |
| PET2 | 5.90±0.195 a | 15.8±0.82 b | 3.7±0.27 a |
| 14 days at 5°C | |||
| PP | 1.97±0.117 c | 16.2±0.47 a | 3.7±0.16 a |
| PET1 | 5.82±0.112 b | 15.1±0.66 b | 3.6±0.22 ab |
| PET2 | 6.70±0.035 a | 14.7±0.74 b | 3.4±0.25 b |
| 21 days at 5°C | |||
| PP | 5.36±0.039 c | 16.2±0.55 a | 3.8±0.18 a |
| PET1 | 10.37±0.312 b | 14.4±0.58 b | 3.8±0.20 a |
| PET2 | 12.17±0.273 a | 14.1±0.70 b | 3.8±0.23 a |
| 21 days at 5°C plus 3 days at 20°C | |||
| PP | 6.90±0.310 c | 16.1±0.39 a | 3.4±0.13 a |
| PET1 | 15.44±0.660 b | 14.2±0.59 b | 3.6±0.19 a |
| PET2 | 18.11±0.390 a | 13.4±0.66 b | 3.3±0.22 a |
| 21 days at 5°C plus 6 days at 20°C | |||
| PP | 9.36±0.552 c | 15.8±0.43 a | 3.4±0.14 a |
| PET1 | 23.09±0.980 b | 13.6±0.51 b | 3.4±0.17 a |
| PET2 | 24.62±0.431 a | 12.4±0.62 c | 3.5±0.21 a |
1For each storage time means in columns followed by unlike letters are significantly different according to the Tukey’s test at P < 0.05. Each mean is followed by the standard deviation (n = 15).


