
Optimization of ultrasound-assisted extraction of anthocyanins from lowbush blueberries (Vaccinium Angustifolium Aiton)
Abstract
BACKGROUND:
A considerable body of evidence has associated the consumption of blueberries to health-related benefits, mainly because of their anthocyanin content. The extraction of these compounds could contribute to their application in functional foods and value-added products.
OBJECTIVE:
In this study, we investigated the ultrasound-assisted extraction (UAE) of anthocyanins from lowbush blueberries in a bench-scale system.
METHODS:
Two statistical design methods, namely full factorial and Box-Behnken, were used for the screening and optimization of the variables that significantly affect the UAE of anthocyanins. Extraction temperature, time, solvent concentration (acidified ethanol), and solvent to solid ratio were selected to determine higher anthocyanin extraction (assessed by the pH-differential method).
RESULTS:
When evaluated by response surface methodology, solvent to solid ratio and solvent concentration had a significant effect on UAE followed by ultrasound bath temperature. The mathematical model indicated that the highest anthocyanin extraction would be obtained with 60% acidified ethanol, solvent to solid ratio of 50 mL/g, at 65°C for 11.5 min.
CONCLUSION:
Ultrasound-assisted extraction was shown to be an effective method of extracting total anthocyanins from Nova Scotia lowbush blueberries. A statistical model to predict optimum conditions for extraction was developed using a Box Behnken design.
1Introduction
Recent reports suggest that anthocyanins are a main contributors to the health benefits associated with the consumption of fruits and vegetables [1], such as the inhibition of cancer cell growth [2, 3], improvement of atherosclerotic and diabetic conditions [4], prevention of cell death and cardiomyocyte hypertrophy induced by norepinephrine [5], and improvement of depressive symptoms [6, 7]. Blueberries are one of the richest sources of anthocyanins, making them a potential candidate for use in supplements and functional ingredients.
Several blueberry cultivars have a wide range of anthocyanins, including compounds that are specific for each cultivar [8]. Blueberry anthocyanins are mostly glycosidic anthocyanins and small portion of acylated anthocyanins [9]. Ballinger et al. [10] identified 14 different anthocyanin compounds in ripe highbush blueberries in 1970 followed by identifying 15 more anthocyanin compounds [11]. These compounds were combination of cyanidin, delphinidin, malvidin, peonidin, and petunidin which are aglycone anthocyanidins. Similar studies confirms that the most common anthocyanins in blueberries are the monoarabinosides, monoglucosides and monogalactosides of cyanidin (Cy), petunidin (Pt), peonidin (Pn), delphinidin (Dp) and malvidin (Mv) [12]. Wu and Prior [13] studied the anthocyanin compounds in lowbush blueberries which cyanidin 3-glucoside, delphinidin 3-glucoside, and malvidin 3-glucoside had the highest concentration.
The type of solvent is one of the most frequently investigated variables in the process of extracting of bioactive compounds from fruits and vegetables. Alcohol solvents have been mostly used for the extraction of phenolic compounds from natural sources. Although methanol has been reported as the most effective solvent, ethanol is preferred as the next best organic solvent for extraction of anthocyanin compounds from blueberries for use in food applications [14, 15].
The increased interest in plant-derived bioactive compounds has contributed to the development of efficient new methods to maximize their extraction and reduce energy consumption, processing time, and costs [16]. Traditional techniques used to obtain anthocyanins from different plant sources are often time consuming and can lead to their degradation [16–19]. In this context, ultrasound-assisted extraction (UAE) is a promising technique for the extraction of high-value molecules from natural sources [20–22]. UAE has been used for the extraction of many bioactive compounds from fruits and vegetables with higher efficiency than conventional methods. For instance, the extraction of phenolic compounds from orange peel was investigated. It was reported that UAE resulted in significantly higher yield in a shorter time than solvent extraction at the same temperature and ethanol concentration, which would contribute to a reduction in the energy input to the system [23]. Similar results were observed with grape mash [24] and black chokeberry fruits [25].
The objective of this study was to investigate and determine the optimal conditions for the UAE of anthocyanins from lowbush blueberries. Two statistical designs were used: a) full factorial design (for screening) and b) Box-Behnken design (for optimization). The screening stage consisted of determining the significant variables that affect the UAE, followed by the optimization of these variables by response surface methodology. Lastly, we provide a model to predict the total anthocyanin content for the optimized conditions.
2Material and methods
2.1Plant material
Fresh lowbush blueberries (V. angustifolium Aiton) representing a single biological sample, were kindly donated by Glenmore Farms, Middle Musquodoboit, NS, Canada. The berries were transferred to Dalhousie University, stored in a freezer at –16°C for 24 h and kept at –35°C prior to freeze-drying. Freeze dried samples were stored in a desiccator at –16°C until further analysis.
2.2Chemicals
Hydrochloric acid was purchased from EM Science (Darmstadt, HE, Germany). Glacial acetic acid, anhydrous sodium acetate, Folin phenol reagent 2.0 N, reagent alcohol, and potassium chloride were purchased from Fisher Scientific (Ottawa, ON, Canada). Sodium carbonate was purchased from VWR (Radnor, PA, USA).
2.3Ultrasound-assisted extraction (UAE) of phenolic compounds
Blueberries were first freeze-dried to a moisture content of <0.5% . Prior to the extraction, freeze-dried blueberries were ground (particle size <1 mm) and then mixed with acidified ethanol (1% acetic acid, v/v) according to the experimental design condition under study.
For each extraction, a specific mass of blueberry powder was mixed with 10 ml of solvent (from 20% ethanol to 100% ethanol) in a 15 ml tube, at ratios that ranged from 10 mg/L to 50 mg/L (as specified by the experimental design). The samples were incubated in an ultrasound bath at temperatures that ranged from 25°C to 65°C, for 3 min to 20 min. Details of the combinations of conditions were dictated by the design of the experiment which is explained in Section 2.5 and presented in Table 2 (Factorial) and Table 3 (Box Behnken) design.
The extractions were conducted in an ultrasound bath (Branson B2510DTH, Danbury, CT, USA), with fixed frequency (40 kHz) and power (100 W). The ultrasound bath temperature was adjustable to temperatures from 25°C to 65°C. After extraction, the samples were centrifuged at 1640×g for 20 min at 4°C. The supernatant was removed and filtered through a 0.45-μm syringe filter. The filtered extracts were stored in a freezer at −16°C until analysis.
2.4Determination of total anthocyanin content (TAC)
The TAC of the filtered extracts was determined according to the pH-differential method [26]. Absorbance was measured at 520 and 700 nm using a Genesys 10 S UV-Vis spectrophotometer (Thermo Scientific, Madison, WI, USA) and results were expressed as mg cyanidin-3-glucoside equivalents (C3G) per g of blueberries (on a dry weight basis). Distilled water was used as a blank at both wavelengths.
2.5Experimental design and data analysis
In this study, a full factorial design followed by a Box-Behnken design was used. Initially, the full factorial design was applied to screen the variables (or factors) and their ranges that significantly influenced the UAE of anthocyanins (at p < 0.05). The significant variables were then optimized using Box-Behnken design. Minitab ® 17.1.0 (Minitab Inc., PA, USA) was employed to generate the full factorial design matrix and data analysis, whereas Design–Expert ® 9 (Stat-Ease, Inc., Minneapolis, MN, USA) was used for Box-Behnken design.
2.5.1Factorial design for screening of variables
A two-level (2k) factorial design was created to identify the main variables affecting the UAE of anthocyanins from lowbush blueberries. Four factors in two levels (–1 and +1) were selected and labeled as follows: extraction temperature (x1), extraction time (x2), ethanol concentration (x3), and solvent to solid ratio (x4). The range selected for each variable is presented in Table 1.
The variables were screened in 16 runs in duplicate according to the design matrix presented in Table 2, and the response was measured as TAC. The results were fitted to a first-order equation, as follows:
(1)
2.5.2Box-Behnken design for optimization of UAE conditions
A Box-Behnken design was applied to optimize the significant variables determined by the full factorial design and maximize the anthocyanin extracted. Each significant factor was studied at three levels (−1, 0, 1). Variables were optimized in 27 runs conducted in triplicate (Table 3). Experimental data were fitted to a second-order polynomial model according to the following Equation [27]:
(2)
In both designs, the adequacy of the models was assessed by the lack of fit, coefficient of determination (R2), and p-value obtained from the analysis of variance (ANOVA).
3Results and discussion
3.1Full factorial design for screening of variables
A full factorial design (24) consisting of 16 runs was applied to identify the significant variables (p < 0.05) that affect the UAE of anthocyanins from lowbush blueberries. Results indicated that all variables evaluated contributed significantly to UAE, in addition to the interaction terms of time-solvent concentration and solvent concentration-ratio (Table 4). The analysis of variance also showed that the model for TAC was highly significant (p < 0.0005), whereas lack of fit was not significant, which implies that the model fitted the experimental results and could be used for further analysis. Another indication of the model fitting is the small standard error of the regression (S). The R2 indicated that approximately 88.63% of the variance about the mean was explained by the fitted model. The linear equation for full factorial design containing significant variables was:
(3)
For this reason, all the variables (and ranges) used in factorial design were used for optimization by Box-Behnken design.
3.2Box-Behnken design for optimization of UAE conditions
A Box-Behnken design was used for the optimization of the variables that significantly affect the UAE of anthocyanins. The analysis of variance indicated that the model was highly significant (p < 0.0005) and the lack of fit was not significant (p = 0.155), indicating that the model fitted the experimental data. Among the variables investigated, extraction temperature (x1), solvent concentration (x3), and solvent to solid ratio (x4) were significant parameters influencing the response (measured as TAC), in addition to a quadratic (x3 2) and an interaction temperature-solvent concentration (x1x3) terms. For this reason, a simplified model including significant terms could be expressed as follows:
(4)
The model had a small standard error of the regression (S = 0.90) and it could explain approximately 83% of the variance about the mean. A surface plot of TAC versus extraction temperature and solvent concentration is presented in Fig. 1. In the present study, the extraction of anthocyanins was reduced in pure ethanol compare to the ethanol-water mixture, which corroborates the results in the literature [14, 28]. It was reported that acidified mixtures of alcohol and water were more efficient for extraction of active compounds in comparison to equivalent mono-component solvent solution [15, 29, 30].
The model shown in Equation 4 predicts an optimal TAC of 15.87 mg/g, compared to the experimentally obtained TAC of 13.22 mg/g at the same conditions (60% solvent concentration, solvent to solid ratio 50 mg/L, temperature of 65°C) as shown in Table 3.
The highest level of anthocyanin content was achieved at solvent concentration of 60% . As the solvent concentration exceeded 60% , the anthocyanin concentration decreased. This effect could be attributed to changes in the solvent polarity, thus affecting the solubility of anthocyanin compounds. Ethanol as an organic solvent has the capability of dissolving polar and nonpolar compounds. However, water with higher polarity than ethanol is able to dissolve polar compounds more effectively. Since non-polar compounds do not have the required energy to overcome the strong hydrogen bonds among water molecules, molecules with covalent bond have less solubility in water [31, 32]. Reducing the ethanol content of the extraction solvent lowers solvent costs and waste. In a different study, investigating the optimization of the extraction of phenolic compounds from quinoa seeds and reported that 50% ethanol resulted in three times higher extraction yield than pure water [25].
Solvent to solid ratio also had a significant effect on the UAE of anthocyanins, which could indicate that if this ratio is too small there would not be enough solvent to fully extract the bioactives. The solubility of different molecules depends on the intermolecular forces between solute and solvent. In general, a larger volume of solvent can dissolve the compounds more effectively regardless of the solvent used. A high concentration gradient between the solid material and the solvent is the driving force during mass transfer, leading to the improvement of the extraction [32–34]. However, increased solvent to solid ratio can lead to higher processing costs. As a result, a suitable ratio should be selected to extract the anthocyanins from the plant material. Tao et al. [35] described that the optimum extraction of anthocyanins from wine lees was achieved by using 50 mL/g of solvent to solid ratio, which is in agreement with our results.
By increasing the ultrasound bath temperature from 25°C to 65°C in our study, total anthocyanin content increased significantly. Higher temperature can help disrupting the solid surface of the fruits, resulting in enhancement of solubility of extracted compounds. On the other hand, extreme increases in ultrasound bath temperature can result in anthocyanin degradation [33]. Tao et al. [35] showed that the maximum anthocyanin yield from grape lees was obtained at ultrasound bath temperature of 60°C, which corroborates our results.
Our results for TAC are in good agreement with those reported in the literature (Table 5). The TAC determined in this study roughly ranged from 0.85 to 1.98 mg C3G/g fresh weight (FW). Our blueberries were dried to a consistent 3.3% moisture content, and the TAC converted to a FW basis using an assumed initial moisture content of 85% which was found in the literature [41]. The TAC of various blueberry varieties, including highbush (V. corymbosum L.) and lowbush was measured in 1999. Anthocyanin content of frozen lowbush blueberries were extracted with extraction solvent of methanol, formic acid and water after leaving for 60 min to equilibrate. It was reported that TAC of lowbush blueberries ranged from 0.95 to 2.55 mg/g FW, whereas that of highbush variety ranged between 0.832-2.5 mg/g FW [42]. In another study, 87 highbush blueberry cultivars were studied. Blueberry samples were added to an equal volume of acetonitrile containing acetic acid at room temperature. The anthocyanin content varied almost 4 times between some cultivars and the mean TAC was 0.95 mg C3G/g FW [43]. Using different varieties, Sellappan et al. [40] reported that the average TAC of rabbiteye and southern highbush blueberries were 1.13 and 0.84 mg C3G/g FW, respectively. In their study frozen whole fruit was ground to paste and anthocyanin content was extracted with a solvent of methanol, ascorbic acid, and HCL. Among the rabbiteye blueberry varieties evaluated, Climax had the highest concentration of anthocyanins (1.97 mg C3G/g FW), confirming the results by You et al. [44].
To the best of our knowledge, this is the first study describing the optimization of UAE of anthocyanins from lowbush blueberries using acidified ethanol as solvent. Thus, there are no equivalent studies for direct comparison. However, UAE with acidified ethanol for extraction of anthocyanins from blackberry (cultivar Cacanska Bestrna) was investigated. The highest TAC obtained was 13.8 mg C3G/g DW [45]. In comparison, the highest TAC obtained in our study was 13.22 mg C3G/g DW for optimal extraction conditions of 65°C for 11.5 min with 60% ethanol using a 50 mL/g solvent to solid ratio.
4Conclusion
The UAE of anthocyanin from lowbush blueberries was investigated, considering ultrasound bath temperature, time, solvent concentration, and solvent to solid ratio as variables. The optimal conditions for total anthocyanins were identified through a Box-Behnken design within the current experimental range. Surface and contour plots in RSM were effective for estimating the effect of four independent variables (extraction temperature, extraction time, solvent concentration and solvent to solid ratio). TAC ranged from 5.7 to 13.22 mg C3G/ g DW (0.85 to 1.98 mg C3G/ g FW) which is comparable or higher than values found in the literature. Thus, lowbush blueberries can be considered as a potential source for antioxidants and pigments, and UAE is an effective extraction method.
Acknowledgements
The authors are grateful to the National Council for Research and Development (CNPq – Brazil) and the Natural Sciences and Engineering Research Council (NSERC) of Canada for financial support.
References
1 | Norberto S, Silva S, Meireles M, Faria A, Pintado M, Calhau C(2013) Blueberry anthocyanins in health promotion: A metabolic overviewJ Func Foods5: 415181528 |
2 | Adams LS, Phung S, Yee N, Seeram NP, Li L, Chen S(2010) Blueberry phytochemicals inhibit growth and metastatic potential of MDA-MB-231 breast cancer cells through modulation of the phosphatidylinositol 3-kinase pathwayCancer Res70: 935943605 |
3 | Seeram NP, Adams LS, Zhang Y, Lee R, Sand D, Scheuller HS(2006) Blackberry, black raspberry, blueberry, cranberry, red raspberry, and strawberry extracts inhibit growth and stimulate apoptosis of human cancer cells in vitro J Agric Food Chem54: 2593299339 |
4 | Grace MH, Ribnicky DM, Kuhn P, Poulev A, Logendra S, Yousef GG(2009) Hypoglycemic activity of a novel anthocyanin-rich formulation from lowbush blueberry, Vaccinium angustifolium AitonPhytomed16: 5406415 |
5 | Louis XL, Thandapilly SJ, Kalt W, Vinqvist-Tymchuk M, Aloud BM, Raj P(2014) Blueberry polyphenols prevent cardiomyocyte death by preventing calpain activation and oxidative stressFood and Func5: 817851794 |
6 | Krikorian R, Shidler MD, Nash TA, Kalt W, Vinqvist-Tymchuk MR, Shukitt-Hale B(2010) Blueberry Supplementation Improves Memory in Older AdultsJ Agric Food Chem58: 739964000 |
7 | Wu X, Beecher GR, Holden JM, Haytowitz DB, Gebhardt SE, Prior RL(2004) Lipophilic and hydrophilic antioxidant capacities of common foods in the United StatesJ Agric Food Chem52: 1240264037 |
8 | Vrhovsek U, Masuero D, Palmieri L, Mattivi F(2012) Identification and quantification of flavonol glycosides in cultivated blueberry cultivarsJournal of Food Composition and Analysis25: 1916 |
9 | Yousef GG, Brown AF, Funakoshi Y, Mbeunkui F, Grace MH, Ballington JR(2013) Efficient quantification of the health-relevant anthocyanin and phenolic acid profiles in commercial cultivars and breeding selections of blueberries (Vaccinium s)J Agric Food Chem61: 2048064815 |
10 | Ballinger W, Maness E, Kushman L(1970) Anthocyanins in ripe fruit of the highbush blue-berry, Vaccinium corymbosum LJournal of the American Society of Horticultural Science95: 283285 |
11 | Ballinger W, Maness E, Kushman L, Galletta G(1972) Anthocyanins of ripe fruit of a pink-fruited hybrid of highbush blueberries, Vaccinium- Corymbosum-L.L.J Am Soc Hort Sci97: 3381 |
12 | Kader F, Rovel B, Girardin M, Metche M(1996) Fractionation and identification of the phenolic compounds of highbush blueberries (Vaccinium corymbosum, L.)Food Chem55: 13540 |
13 | Wu X, Prior RL(2005) Systematic identification and characterization of anthocyanins by HPLC-ESI-MS/MS in common foods in the United States: Fruits and berriesJ Agric Food Chem53: 725892599 |
14 | Spigno G, Tramelli L, De Faveri DM(2007) Effects of extraction time, temperature and solvent on concentration and antioxidant activity of grape marc phenolicsJ Food Eng81: 1200208 |
15 | Barnes JS, Nguyen HP, Shen S, Schug KA(1216) General method for extraction of blueberry anthocyanins and identification using high performance liquid chromatography–electrospray ionization-ion trap-time of flight-mass spectrometryJ Chromat A2347284735 |
16 | Ghitescu R, Volf I, Carausu C, Bühlmann A, Gilca IA, Popa VI(2015) Optimization of ultrasound-assisted extraction of polyphenols from spruce wood barkUltrason Sonochem22: 535541 |
17 | Jun X(2009) Caffeine extraction from green tea leaves assisted by high pressure processingJ Food Eng94: 1105109 |
18 | Kothari V, Gupta A, Naraniwal M(2012) Comparative study of various methods for extraction of antioxidant and antibacterial compounds from plant seedsJ Nat Rem12: 2162173 |
19 | Loginova K, Vorobiev E, Bals O, Lebovka N(2011) Pilot study of countercurrent cold and mild heat extraction of sugar from sugar beets, assisted by pulsed electric fieldsJ Food Eng102: 4340347 |
20 | Hemwimol S, Pavasant P, Shotipruk A(2006) Ultrasound-assisted extraction of anthraquinones from roots of Morinda citrifoliaUltrason Sonochem13: 6543548 |
21 | Japón-Luján R, Luque-Rodríguez J, De Castro ML(1108) Dynamic ultrasound-assisted extraction of oleuropein and related biophenols from olive leavesJ Chromat A17682 |
22 | Szentmihályi K, Vinkler P, Lakatos B, Illés V, Then M(2002) Rose hip (Rosa canina L.) oil obtained from waste hip seeds by different extraction methodsBioresour Technol82: 2195201 |
23 | Khan MK, Abert-Vian M, Fabiano-Tixier A, Dangles O, Chemat F(2010) Ultrasound-assisted extraction of polyphenols (flavanone glycosides) from orange (Citrus sinensis L.) peelFood Chem119: 2851858 |
24 | Lieu LN(2010) Application of ultrasound in grape mash treatment in juice processingUltrason Sonochem17: 1273279 |
25 | D’Alessandro LG, Dimitrov K, Vauchel P, Nikov I(2014) Kinetics of ultrasound assisted extraction of anthocyanins from Aronia melanocarpa (black chokeberry) wastesChem Eng Res Design92: 1018181826 |
26 | Giusti MM, Wrolstad RE(2003) Acylated anthocyanins from edible sources and their applications in food systemsBiochem Eng J14: 3217225 |
27 | Maran JP, Manikandan S, Thirugnanasambandham K, Nivetha CV, Dinesh R(2013) Box–Behnken design based statistical modeling for ultrasound-assisted extraction of corn silk polysaccharideCarbohydr Polym92: 1604611 |
28 | Dong J, Liu Y, Liang Z, Wang W(2010) Investigation on ultrasound-assisted extraction of salvianolic acid B from Salvia miltiorrhiza rootUltrason Sonochem17: 16165 |
29 | Yilmaz Y, Toledo RT(2006) Oxygen radical absorbance capacities of grape/wine industry byproducts and effect of solvent type on extraction of grape seed polyphenolsJ Food Comp Anal19: 14148 |
30 | Rostagno MA, Palma M, Barroso CG(2003) Ultrasound-assisted extraction of soy isoflavonesJ Chromat A1012: 2119128 |
31 | Lai J, Wang H, Wang D, Fang F, Wang F, Wu T(2014) Ultrasonic Extraction of Antioxidants from Chinese Sumac (Rhus typhina L.) Fruit Using Response Surface Methodology and Their CharacterizationMolecules19: 790199032 |
32 | Cacace J, Mazza G(2003) Optimization of extraction of anthocyanins from black currants with aqueous ethanolJ Food Sci68: 1240248 |
33 | Tao Y, Sun D(2015) Enhancement of food processes by ultrasound: A reviewCrit Rev Food Sci Nutr55: 4570594 |
34 | Li H, Chen B, Yao S(2005) Application of ultrasonic technique for extracting chlorogenic acid from Eucommia ulmodies Oliv. (E. ulmodies)Ultrason Sonochem12: 4295300 |
35 | Tao Y, Wu D, Zhang Q, Sun D(2014) Ultrasound-assisted extraction of phenolics from wine lees: Modeling, optimization and stability of extracts during storageUltrason Sonochem21: 2706715 |
36 | Lohachoompol V, Mulholland M, Srzednicki G, Craske J(2008) Determination of anthocyanins in various cultivars of highbush and rabbiteye blueberriesFood Chem111: 1249254 |
37 | Chen H, Camire ME(1997) Recovery of anthocyanins, pectin, and dietary fiber from cull lowbush blueberriesJ Food Qual20: 3199209 |
38 | Cho MJ, Howard LR, Prior RL, Clark JR(2004) Flavonoid glycosides and antioxidant capacity of various blackberry, blueberry and red grape genotypes determined by high-performance liquid chromatography/mass spectrometryJ Sci Food Agric84: 1317711782 |
39 | Moyer RA, Hummer KE, Finn CE, Frei B, Wrolstad RE(2002) Anthocyanins, phenolics, and antioxidant capacity in diverse small fruits: Vaccinium, Rubus, and RibesJ Agric Food Chem50: 3519525 |
40 | Sellappan S, Akoh CC, Krewer G(2002) Phenolic compounds and antioxidant capacity of Georgia-grown blueberries and blackberriesJ Agric Food Chem50: 824322438 |
41 | Bastin, S., & Henken, K. Water Content of Fruits and Vegetables. Cooperative extension service. University of Kentucky, College of Agriculture. 1997 |
42 | Kalt W, McDonald J, Ricker R, Lu X(1999) Anthocyanin content and profile within and among blueberry speciesCan J Plant Sci.79: 4617623 |
43 | Ehlenfeldt MK, Prior RL(2001) Oxygen radical absorbance capacity (ORAC) and phenolic and anthocyanin concentrations in fruit and leaf tissues of highbush blueberryJ Agric Food Chem49: 522222227 |
44 | You Q, Wang B, Chen F, Huang Z, Wang X, Luo PG(2011) Comparison of anthocyanins and phenolics in organically and conventionally grown blueberries in selected cultivarsFood Chem125: 1201208 |
45 | Ivanovic J, Tadic V, Dimitrijevic S, Stamenic M, Petrovic S, Zizovic I(2014) Antioxidant properties of the anthocyanin-containing ultrasonic extract from blackberry cultivar “Čačanska Bestrna”Industrial Crops and Products53: 274281 |
Figures and Tables
Fig.1
Surface plot of TAC vs. solvent concentration and temperature. In this graphic representation, the other two factors were kept constant at their center point (time 11.5 minutes and solvent to solid ratio of 30 ml/g).
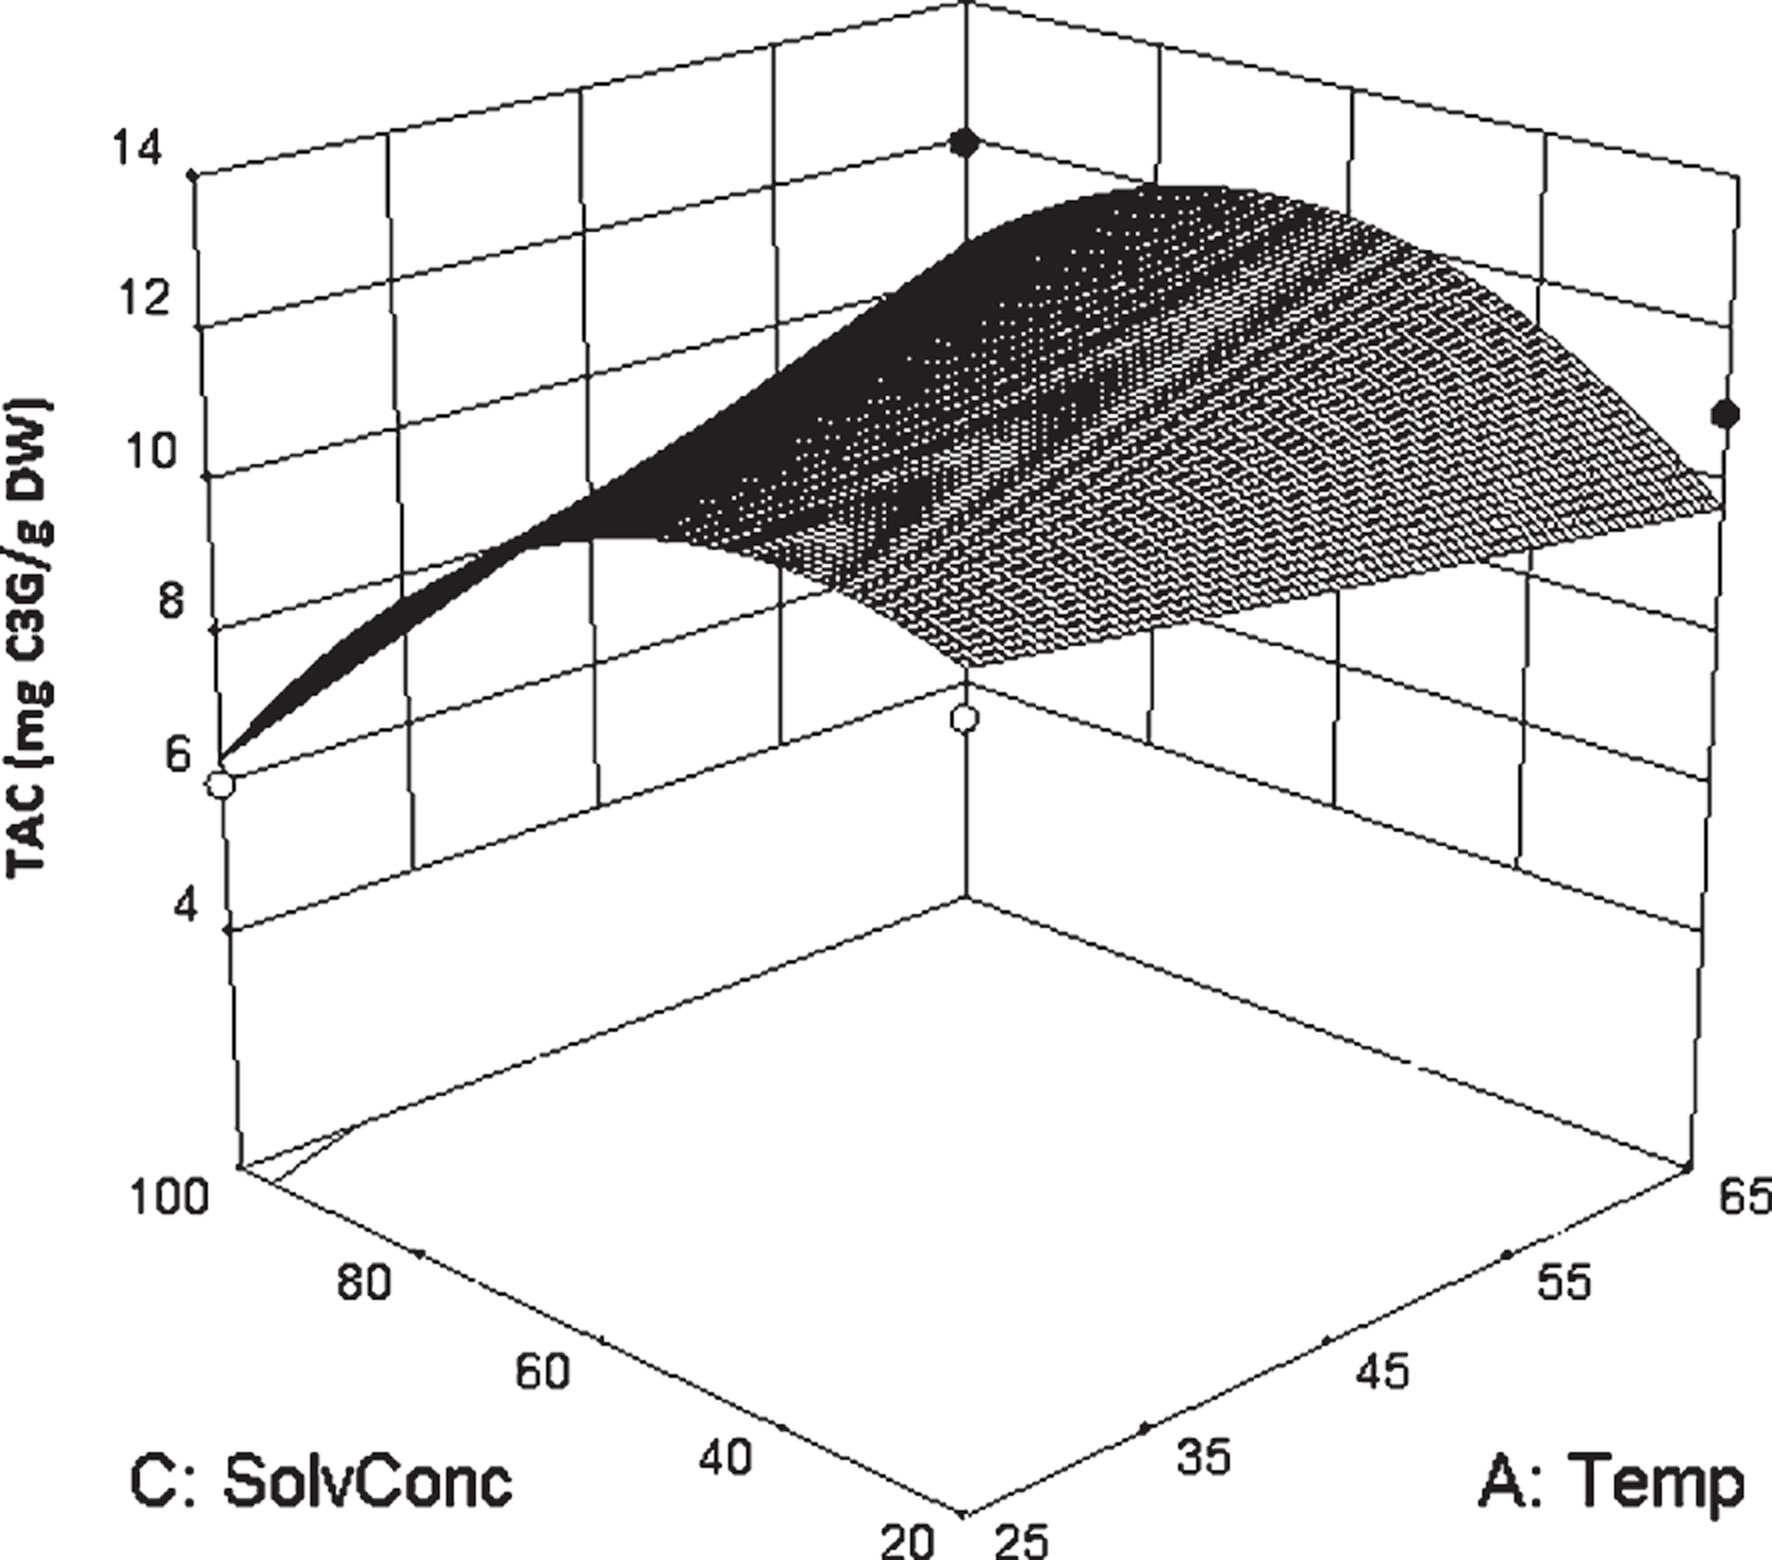
Table 1
Independent variables and ranges selected for full factorial design
| Independent variables | Coded symbols | Levels | |
| −1 | 1 | ||
| Extraction temperature (°C) | x1 | 25 | 65 |
| Extraction time (min) | x2 | 3 | 20 |
| Solvent concentration (% ) | x3 | 20 | 100 |
| Solvent to solid ratio (mL/g) | x4 | 10 | 50 |
Table 2
Full factorial design matrix with coded variables and experimental results (response measured as TAC)
| Runa | x1 | x2 | x3 | x4 | y (TAC, mg/g) |
| 1 | 25 | 3 | 20 | 10 | 7.46 |
| 2 | 25 | 3 | 20 | 50 | 10.59 |
| 3 | 25 | 3 | 100 | 10 | 3.17 |
| 4 | 25 | 3 | 100 | 50 | 7.18 |
| 5 | 25 | 20 | 20 | 10 | 7.84 |
| 6 | 25 | 20 | 20 | 50 | 10.94 |
| 7 | 25 | 20 | 100 | 10 | 4.01 |
| 8 | 25 | 20 | 100 | 50 | 10.11 |
| 9 | 65 | 3 | 20 | 10 | 9.89 |
| 10 | 65 | 3 | 20 | 50 | 12.01 |
| 11 | 65 | 3 | 100 | 10 | 5.01 |
| 12 | 65 | 3 | 100 | 50 | 9.46 |
| 13 | 65 | 20 | 20 | 10 | 10.19 |
| 14 | 65 | 20 | 20 | 50 | 11.76 |
| 15 | 65 | 20 | 100 | 10 | 9.88 |
| 16 | 65 | 20 | 100 | 50 | 12.50 |
Note: aRun number was used for identification purposes only and does not indicate the order in which the experimental runs were conducted.
Table 3
Box-Behnken design matrix and experimental results
| Runa | x1 | x2 | x3 | x4 | y (TAC, mg/g) |
| 1 | 25 | 3 | 60 | 30 | 11.95 |
| 2 | 65 | 3 | 60 | 30 | 12.89 |
| 3 | 25 | 20 | 60 | 30 | 11.50 |
| 4 | 65 | 20 | 60 | 30 | 12.12 |
| 5 | 45 | 11.5 | 20 | 10 | 9.04 |
| 6 | 45 | 11.5 | 100 | 10 | 5.68 |
| 7 | 45 | 11.5 | 20 | 50 | 10.56 |
| 8 | 45 | 11.5 | 100 | 50 | 10.84 |
| 9 | 25 | 11.5 | 60 | 10 | 10.25 |
| 10 | 65 | 11.5 | 60 | 10 | 9.32 |
| 11 | 25 | 11.5 | 60 | 50 | 12.43 |
| 12 | 65 | 11.5 | 60 | 50 | 13.22 |
| 13 | 45 | 3 | 20 | 30 | 10.34 |
| 14 | 45 | 20 | 20 | 30 | 10.95 |
| 15 | 45 | 3 | 100 | 30 | 7.77 |
| 16 | 45 | 20 | 100 | 30 | 8.50 |
| 17 | 25 | 11.5 | 20 | 30 | 10.40 |
| 18 | 65 | 11.5 | 20 | 30 | 10.94 |
| 19 | 25 | 11.5 | 100 | 30 | 6.01 |
| 20 | 65 | 11.5 | 100 | 30 | 11.97 |
| 21 | 45 | 3 | 60 | 10 | 10.40 |
| 22 | 45 | 20 | 60 | 10 | 9.02 |
| 23 | 45 | 3 | 60 | 50 | 12.70 |
| 24 | 45 | 20 | 60 | 50 | 12.10 |
| 25 | 45 | 11.5 | 60 | 30 | 12.12 |
| 26 | 45 | 11.5 | 60 | 30 | 11.57 |
| 27 | 45 | 11.5 | 60 | 30 | 11.39 |
Note: aRun number was used for identification purposes only and does not indicate the order in which the experimental runs were conducted.
Table 4
Analysis of variance for the full quadratic model of TAC
| Full factorial design | |||||
| Source | df | SS | MS | F-value | p-value |
| Model | 6 | 226.73 | 37.79 | 32.48 | <0.0005 |
| x1 | 1 | 47.09 | 47.09 | 40.48 | <0.0005 |
| x2 | 1 | 19.42 | 19.42 | 16.69 | <0.0005 |
| x3 | 1 | 46.91 | 46.91 | 40.33 | <0.0005 |
| x4 | 1 | 91.87 | 91.87 | 78.97 | <0.0005 |
| x2x3 | 1 | 14.85 | 14.85 | 12.76 | 0.001 |
| x3x4 | 1 | 06.60 | 6.60 | 5.67 | 0.025 |
| Error | 25 | 29.08 | 1.16 | ||
| Lack-of-fit | 9 | 15.97 | 1.77 | 2.17 | 0.085 |
| S | 1.08 | R2 (adjusted) | 0.8590 | ||
| R2 | 0.8863 | R2 (predicted) | 0.8137 | ||
| Box-Behnken design | |||||
| Model | 5 | 80.77.92 | 16.15 | 20.11 | <0.0005 |
| x1 | 1 | 5.23 | 5.23 | 6.51 | 0.019 |
| x3 | 1 | 10.94 | 10.94 | 13.62 | 0.001 |
| x4 | 1 | 27.42 | 27.42 | 34.13 | <0.0005 |
| x3 2 | 1 | 29.83 | 29.83 | 37.13 | <0.0005 |
| x1x3 | 1 | 7.34 | 7.34 | 9.14 | 0.006 |
| Error | 21 | 16.87 | 0.80 | ||
| Lack-of-fit | 19 | 16.58 | 0.87 | 6.03 | 0.152 |
| S | 0.90 | R2 (adjusted) | 0.7861 | ||
| R2 | 0.8272 | R2 (predicted) | 0.6157 | ||
Note: S – standard error of the regression; R2 – regression coefficient.
Table 5
TAC reported in literature for different blueberry varieties
| Plant | Extraction method | Anthocyanin Content | Reference |
| Highbush | HPLC-grade methanol/water/acetic acid | 5.8 to 9.6 mg/g DW | [36] |
| Rabitteye | HPLC-grade methanol/water/acetic acid | 10.1 to 13.7 mg g DW | [36] |
| Lowbush | Methanol/water/formic acid | 0.65 mg/g FW | [37] |
| Highbush | Methanol/water/formic acid | 1.435 to 8.227 mg/kg | [38] |
| Highbush | Acetone/water | 0.73 to 4.30 mg/g fresh-frozen fruit | [39] |
| Rabbiteye | Methanol/HCL | 0.12 to 1.97 mg/g FW | [40] |
| Highbush | Methanol/HCL | 0.35 to 1.29 mg/g FW | [40] |


