
‘Fuentepina’ and ‘Amiga’, two new strawberry cultivars: Evaluation of genotype, ripening and seasonal effects on quality characteristics and health-promoting compounds
Abstract
BACKGROUND:
Strawberries are widely consumed in the world and an important source of health-promoting compounds, such as polyphenols. The nutritional quality as well as the phytochemical composition of strawberry fruits are known to be strongly influenced by genetic, environmental factors, ripeness at harvest, and storage conditions.
OBJECTIVE:
The nutritional quality and the phytochemical content of two new strawberry cultivars, namely ‘Fuentepina’ and ‘Amiga’, were evaluated. These novel cultivars were compared with ‘Camarosa’ and ‘Candonga’, the two most extended cultivars in Spain, and with ‘Primoris’, an emerging one.
METHODS:
The influence of genotype, stage of ripening and season on different properties as colour, firmness, acidity, soluble solids content, antioxidant capacity, and polyphenols profile were evaluated.
RESULTS:
Results showed significant effects of genotype, stage of ripening and season on the majority of the measured parameters. Thirty nine phenolic compounds were tentatively identified. Anthocyanins were the most abundant class of polyphenols in ‘Amiga’, ‘Candonga’, ‘Camarosa’ and ‘Primoris’ cultivars while more flavan-3-ols were recorded in ‘Fuentepina’.
CONCLUSIONS:
‘Fuentepina’ strawberries stand out for their pleasant flavour as a result of a high sugar/acid ratio and ‘Amiga’ strawberries may offer potential as a new promising cultivar due to its high firmness, good sugar/acid ratio and high content of phytochemicals.
1Introduction
Strawberries (Fragaria × ananassa, Duch.) are one of the most popular berries in Europe, with a wide consumer base. More than 4.3 million tons of strawberries were produced worldwide in 2011 [1], Spain being the largest producer in Europe and the third largest in the world. Strawberries represent a rich source of micronutrients,such as minerals, vitamin C, folate and phenolic compounds. They contain a complex (poly)phenolic profile consisting mainly of a mixture of flavonoids (anthocyanins and flavonols) and hydrolysable tannins (ellagitannins and gallotannins) along with phenolic acids (hydroxycinnamic and hydroxybenzoic acids) and condensed tannins (proanthocyanidins) [2, 3]. Polyphenols are important antioxidants that exhibit a remarkably high scavenging activity toward chemically generated radicals [4, 5]. Among the phytochemicals occurring in strawberries, it is important to highlight pelargonidin-3-O-glucoside which is the major anthocyanin in all strawberry varieties [6]. Another important group of phenolic compounds are ellagitannins, which are present in only a few other berries and nuts [7]. However, in general terms, the nutritional quality and the phytochemical composition of berry fruits are known to be strongly influenced by genetic [8–11] and environmental factors [2, 12–15], including the weather, cultivation method, ripeness at harvest and storage conditions [16].
In addition, it has been reported that environmental changes may affect each cultivar differently [15, 17]. It is interesting to assess the quality of strawberries and their phenolic compound content in different years and thus evaluate how new cultivars are affected by environmental conditions. This assessment could be useful for breeding programs, as it may help select those cultivars that are more susceptible to environmental conditions. In addition to genetic and environmental effects, the stage of ripening at harvest is an important factor to be considered, since it determines postharvest life and final strawberry quality.
The aim of this study was to characterize five strawberry cultivars: ‘Fuentepina’ and ‘Amiga’, two new cultivars obtained from the Spanish public breeding program; ‘Camarosa’ and ‘Candonga’, the most important commercial cultivars in Spain (with around 65–70% of the total cultivated area in Spain in 2010 and 2011); and ‘Primoris’, as an example of an emerging cultivar developed in recent years (representing 4% of the total cultivated area in Spain in 2011) [18, 19]. Moreover, in this study, changes in the physico-chemical and nutritional quality (firmness, colour, soluble solid content, acidity, antioxidant activity and phenolic compounds) of those cultivars were considered in two different seasons (2010 and 2011) and in two different stages of ripening (nearly ripe and ripe), both of which were suitable for consumption.
2Materials and methods
2.1Strawberry material
Strawberry fruits (Fragaria × ananassa, Duchesne) from five cultivars, ‘Camarosa’, ‘Candonga’, ‘Fuentepina’, ‘Amiga’ and ‘Primoris’, were grown in conventional culture in “El Cebollar”, IFAPA’s experimental station, located at Moguer (37°16’N, 6°50’W; Huelva, Spain). All the cultivars were grown under the same conditions and in the same field to minimize the effect of environmental and agronomic factors. Details regarding the culture system, irrigation and fertilization are described in Dominguez-Morales [20].
The new strawberry cultivars were obtained from the Spanish public breeding program, ‘Amiga’ [21] and ‘Fuentepina’ [22]. The fruits were harvested in two years (2010, 2011) to study the seasonal effect. Selected fruits were those free from physical damage and fungal infection. Strawberries were divided into two groups: ripe fruits (red) and nearly ripe fruits (nearly red) [8] to study the effect of ripening. Both stages of ripening were considered as suitable for consumption.
2.2Colour
Colour measurements of the fruit surface were carried out with a colorimeter (Konica Minolta CR400). There were two determinations for each strawberry, on two opposite sides of its equatorial diameter. L* (lightness), a* (redness-greenness), and b* (yellowness-blueness) were recorded. The hue angle [arctan (b*/a*)] and chroma (a*2+b*2)1/2 were calculated. Fruit colour values were an average of 15 strawberry measurements.
2.3Firmness
Firmness was measured as the maximum penetration force (N) reached during tissue breakage and determined with a 5 mm diameter flat probe. Penetration depth was 5 mm, and the cross-head speed was 5 mm/s using a TA-XT Plus Texture Analyzer (Stable Micro Systems, Godalming, UK). Strawberries were sliced into halves, and each half was measured in their equatorial zone. Fruit firmness values were an average of 15 strawberry measurements.
2.4Soluble solid content (SSC) and acidity
The strawberries were cut into small pieces, wrapped in cheesecloth and squeezed by hand; the juice was used to measure acidity and SSC. The acidity of the samples was assessed using a titrator (Mettler Toledo model T70, Mettler Toledo AG, Analytical, Schwerzenbach, Switzerland) and titrated to pH 8.1 using 0.1 M NaOH. The titrable acidity was expressed as a percentage of citric acid. The SSC was determined with an Atago RX-1000 digital refractometer (Atago Co. Ltd., Tokyo, Japan) and was expressed in brix degrees (°Brix).
2.5Antioxidant capacity: FRAP and DPPH assays
Freeze-dried strawberry fruits (0.3 g) were extracted with 15 ml acetone:water (60:40 v/v). The mixtures were then centrifuged at 5000 rpm for 5 min at 4°C. The supernatants were transferred to vials, stored at –80°C, and later used to analyse antioxidant capacity (DPPH and FRAP).
The FRAP assay was carried out as described by Benzie and Strain [23] with some modifications. To prepare the FRAP reagent, a mixture of 0.1 M acetate buffer (pH = 3.6), 10 mM TPTZ in 40 mM HCl, and 20 mM ferric chloride (10:1:1, v/v/v) was made. A volume of 3.9 ml of FRAP reagent was mixed with 0.1 ml of the previously diluted extract. After 5 hours, the signal obtained at 510 nm was measured using a spectrophotometer (Shimadzu UV 2401 PC) and compared with a known concentration range of similarly prepared Trolox standards. The results were expressed as micromoles of Trolox equivalents per gram of dry weight of strawberries (μmol TE/g DW).
DPPH radical scavenging activity was measured according to the technique reported by Brandwilliams et al. [24]. 100μl of the previously diluted extract was mixed with 1.9 ml of methanolic solution of DPPH (absorbance 1.1). Twenty hours later, absorbance was measured at 515 nm by means of a spectrophotometer (Shimadzu UV 2401 PC), using a methanolic solution of Trolox, at different concentrations, as a control. The results were expressed as micromoles of Trolox equivalents per gram of dry weight of strawberries (μmol TE/g DW).
2.6HPLC-DAD-FD analysis
Phenolic compounds were extracted from 0.5 g of freeze-dried strawberry powder in 15 ml of acetone:water (60:40 v/v). The mix was homogenized using an Ultraturrax (IKA T25) for 1 min and then the extracts were sonicated for 15 min in an ultrasonic bath. The homogenates were then centrifuged at 5000 rpm for 15 min at 4°C. Each extract was concentrated with a nitrogen flow at low temperature (35°C). The volume of the extract (aqueous residue) was made up to 5 ml with 10% methanol in water. The final extracts were filtered through a 0.45μm polyethersulfone filter before they were analysed by HPLC.
The phenolic extracts were analysed on a HPLC system (Perkin Elmer) equipped with a photodiode array (Perkin Elmer) and fluorescence (Jasco) detectors. Chromatographic separation was performed on 250×4.6 mm, 5μm particle size reversed phase C18 column and a guard column (3 cm). The solvents were formic acid in water (1% v/v) (A) and methanol (B). The gradient consisted of 5% B for 5 min, 5–45 min 5–80% B, 45–50 min 80–100% B and 50–60 min 100% B at a flow rate of 0.4 ml/min. The injection volume was 20μl and the column temperature was set at 40 °C.
Spectral data for all peaks were accumulated in the range 190–700 nm and chromatograms were recorded at 260, 320, 360 and 520 nm for simultaneous monitoring of the different groups of phenolic compounds. The excitation and emission wavelengths of the fluorescence detector were set at 290 and 320 nm, respectively. Compounds were identified according to retention time and UV-Vis, fluorescence and mass spectra. Anthocyanins were quantified as pelargonidin-3-O-glucoside equivalents (at 520 nm); flavonols as kaempferol-3-O-glucoside equivalents (at 360 nm); hydroxycinnamic acids (at 320 nm except cinnamoyl-glucose at 280 nm) as p-coumaric acid equivalents (at 320 nm); ellagic acid derivatives and ellagitannins as ellagic acid equivalents (at 260 nm); and catechin and proanthocyanidins were quantified in (–)catechin and proanthoycianidin dimer B equivalents, respectively, using fluorescencepeak areas.
2.7HPLC-MS analysis
A Varian 1200 L liquid chromatograph equipped with reversed-phase column (150 mm × 2.1 mm, 3μm, C18) thermostated at 35°C was used for the HPLC-MS analysis. The mobile phase consisted of two solvents: water-formic acid (99.9/0.1, v/v) (A) and acetonitrile: methanol (75/25, v/v). The gradient condition was 0–20 min, 5–100% B. The flow rate was 0.2 ml/min and the injection volume was 8μl. Nitrogen was used as the nebulizing gas at a pressure of 50 psi. The MS data were acquired in positive and negative ionization mode. The full scan covered the mass range from m/z 80–1200.
2.8Statistical analysis
Statistical analyses were performed using Statistix software (version 9.0). Values are given as means. The data were subjected to analysis of variance (ANOVA), followed by a mean comparison using a least significant difference (LSD) test. Differences at P < 0.05 were considered to be statistically significant.
3Results and discussion
3.1Identification and quantification of phenolic compounds in strawberry cultivars
A total of 39 phenolic compounds were tentatively identified on the basis of their UV-Vis, fluorescence and MS spectra. Figure 1A represents the HPLC-DAD chromatogram at 280 nm and Fig. 1B shows the HPLC-FD profile of ‘Camarosa’ strawberry extract. The HPLC-DAD analysis of the five strawberry cultivars studied allowed the characterization of 21 compounds and the HPLC-FD analysis the characterization of 18 additional compounds, labelled from 1 to 39 based on the elution order in the chromatogram (Table 1).
Four anthocyanins were identified: cyaniding-3-O-glucoside (Cy-3-gluc) (peak 22), pelargonidin-3-O-glucoside (Pg-3-gluc) (peak 27), pelargonidin-3-rutinoside (Pg-3-rut) (peak 29) and pelargonidin-3-acetylglucoside (Pg-3–ac) (peak 35). Pg-3-gluc was the main anthocyanin in all the cultivars studied as others have previously reported [8, 25]. All the anthocyanins detected had been previously reported in strawberries [25–27].
In all of the extracts of the strawberry cultivars analysed, 18 flavan-3-ols were detected and quantified. Five peaks were observed for dimers of proanthocyanidins (4, 5, 6, 9 and 26), five for trimers (peaks 1, 7, 13, 20 and 30), seven for tetramers (peaks 11, 12, 14, 17, 24, 25 and 28) and a monomer of catechin (peak 10).
The flavonols detected (peaks 32, 37, 38 and 39) were quercetin-3-glucuronide, kaempferol-3-glucuronide, kaempferol-3-malonylglucoside and kaempferol-3-acetylglucoside.
In all of the extracts of the strawberry cultivars analysed, four hydroxycinnamic acid derivate peaks (15, 18, 23 and 36) were detected and quantified. Peaks 15 and 18 correspond to two p-coumaroylhexoses, peak 23 to ferulic acid hexose and peak 36 to cinnamoyl-glucose. All these compounds have been previously described in strawberries [2, 8, 13].
Two ellagic acid deoxyhexoside (peaks 33 and 34), two bis-HHDP-glucoside (peaks 2 and 3), a HHDP-galloyl-glucose (peak 8), three galloyl-bis-HHDP glucose (peaks 16, 19 and 31) and the ellagitannin sanguiin H6 (peak 21) were tentatively identified.
The concentration of all the phenolic compounds identified in each strawberry cultivar, the stage of ripening and season are presented in the Table 2.
3.2Effect of genetic factors
All the parameters evaluated were affected by genetic. Colour is probably the most important appearance attribute in strawberries, caused mostly by anthocyanin accumulation. ‘Fuentepina’ strawberries showed significantly higher lightness (L* = 41.5), hue angle (h = 36.6) and chroma (C* = 55.4), thus being less dark and dull red (Table 3). In contrast, ‘Camarosa’, showed the lowest L* (33.1), h (29.4) and C* (42.8) values. ‘Camarosa’ was the cultivar with the darkest red strawberries and the highest anthocyanin concentration (Table 4). In the case of ‘Amiga’ there was not a good correlation between its colour values and anthocyanin concentration. ‘Amiga’ showed intermediate values in the colour parameters studied (Table 3) and registered the highest anthocyanin concentration, together with ’Camarosa’ (Table 4). These findings could be explained by the different anthocyanins profile for each cultivar and its individual concentrations. As the Table 2 shows, ‘Amiga’ cultivar showed a low concentration of cyanidins and a high concentration of pelargonidins.
The pH is another important factor in anthocyanin colour, a low vacuolar pH promoting an orange-red colour in anthocyanins. Thus the pH and the specific anthocyanin profile of ‘Amiga’ could explain the intermediate colour parameter values in this cultivar.
Strawberry firmness differed strongly among genotypes. ‘Amiga’ was the firmest cultivar (8.7 N), followed by ‘Primoris’ (7.6 N) and ‘Candonga’ (6.9 N), whereas ‘Camarosa’ (6.1 N) and ‘Fuentepina’ (5.7 N) cultivars were the softest ones.
‘Fuentepina’ was the richest genotype in soluble solids (9.5 °Brix) while ‘Camarosa’ and ‘Amiga’ were the cultivars with the lowest soluble solid content (Table 3). In our study the SSC of the ‘Camarosa’ cultivar (8.4 °Brix) was slightly higher than the results reported by others [9, 10] (7.2 and 7.1 °Brix, respectively). These differences could be associated with environmental conditions as well as growing practices.
‘Camarosa’ and ‘Candonga’ showed the highest acidity value (0.93 and 0.90% citric acid, respectively) and ‘Fuentepina’ reported the lowest (1.5 fold difference approx.). The results showed that the most important commercial cultivars in Spain (‘Camarosa’ and ‘Candonga’) recorded the highest acidity values. Acidity in these cultivars is above the maximum titratable acidity for acceptable flavour quality of strawberries (0.8% ) [28]. It should be noted that the strawberries from the new cultivars (‘Fuentepina’ and ‘Amiga’) registered lower acidity, a quality attribute that is being strongly demanded by consumers.
The SSC/acidity ratio also showed significant differences between cultivars. ‘Fuentepina’ had the highest SSC/acidity ratio (14.8), followed by ‘Primoris’ (12.4) and ‘Amiga’ (11.8), whereas the lowest values were measured for the cultivars ‘Camarosa’ (9.2) and ‘Candonga’ (10.0). The low SSC/acidity ratio and consequent poor flavour of strawberries from ‘Camarosa’ and ‘Candonga’, the current commercial cultivars, could explain why they are rejected by consumers since sugar to organic acid ratio is a major parameter of strawberry taste [29].
‘Camarosa’ and ‘Amiga’ were the cultivars with the highest antioxidant capacity (Table 3); ‘Fuentepina’ showed no significant differences in its antioxidant capacity (DPPH assay) compared with the remaining cultivars studied (except for ‘Camarosa’). Polyphenols and vitamin C are primarily responsible for the antioxidant capacity in strawberries [2, 6]. ‘Fuentepina’ had the lowest polyphenol concentration, which was not the case, however, of its antioxidant capacity, which suggests that this cultivar could be richer in other antioxidant compounds, such as vitamin C.
The polyphenolic composition of strawberries varies significantly with each genotype [8, 9, 25]. The total phenolic content (TPC), calculated as the sum of individual compounds, in the strawberry cultivars studied varied from 2555 to 4634μg/g DW (Fig. 2). ‘Camarosa’ contained significantly the highest concentration of phenolic compounds while ‘Fuentepina’ had the lowest (Fig. 2).
Anthocyanins were the most abundant class of polyphenols for all the strawberry cultivars studied except ‘Fuentepina’ (in this cultivar the most abundant class of polyphenols were flavan-3-ols) (Fig. 2). Their contribution to the TPC ranged from 28% (‘Fuentepina’) to 63% (‘Camarosa’). ‘Fuentepina’ had the lowest total anthocyanin concentration and ‘Camarosa’ and ‘Amiga’ the highest, with ‘Candonga’ and ‘Primoris’ showing intermediate concentrations of these pigments (Table 4). Pg-3-gluc, was the predominant anthocyanin in all the strawberry cultivars studied (Table 2), as previously reported by other authors [2, 8, 25, 26, 30], followed by Pg-3-rut and Cy-3-gluc. ‘Primoris’ was the only cultivar not following that rule, showing higher Cy-3-gluc levels than Pg-3-rut. Pg-3-ac was a minor pigment with concentrations below 1% of the total anthocyanin content in all the cultivars. Low levels of acylated anthocyanins were also previously reported in Spanish strawberry cultivars [25, 30]. The percentages found in ‘Camarosa’ are similar to those described by other authors [25, 30, 31].
The flavan-3-ols group had the highest contribution to the TPC in ‘Fuentepina’ cultivar (31.3% ) and the second highest for the rest of the cultivars (Fig. 2). However, quantitatively, ‘Fuentepina’ was not the cultivar with the highest concentration of this type of compounds (Table 4). The total proanthocyanidin concentration (as sum of dimers, trimers and tetramers of proanthocyanidins) (567–821μg/g DW) was in line with the levels found by de Pascual-Teresa et al. [32]. Catechin was the most abundant flavan-3-ol for all the cultivars analysed in this study.
Hydroxycinnamic acid derivatives were the third most abundant group of phenolic compounds in all the strawberry cultivars studied except ‘Fuentepina’ (second most abundant) (Fig. 2), contributing to the TPC of 8.5% in ‘Amiga’ up 31% in ‘Fuentepina’. p-coumaroil hexose was the predominant hydroxicinnamic acid derivative. The concentrations found for these compounds were in accordance with previous studies in strawberries [8, 33].
The flavonol content varied from 98-99μg/g DW in ‘Candonga’ and ‘Fuentepina’ to 195μg/g DW in ‘Amiga’. This group of compounds comprised between 2.6–5% of the total content of phenolics. Quercetin-3-O-glucuronide was the main flavonol in the samples studied, which was in agreement with the findings of other authors [25, 34].
The total conjugated forms of ellagic acid concentrations in the strawberry cultivars were between 96μg/g DW (‘Candonga’) and 170μg/g DW (‘Camarosa’). This group of compounds represented between 2.5% and 5.5% of the TPC in the cultivars studied. Sanguiin H6 was the predominant ellagitanin in all the cultivars. The concentration of other main compounds such as ellagic acid deoxyhexoside was low (19–37μg/g DW), similar to the values reported by other authors [27].
3.3Effect of ripening
Loss of firmness increases during strawberry ripening due to the depolymerisation and solubilisation of pectins [35]. In keeping with that, the nearly ripe strawberries from all the cultivars were significantly firmer (Table 3). It should be highlighted that this loss of firmness for the cultivars characterized for the first time in this work (‘Fuentepina’ and ‘Amiga’) was less severe (14% ) than for the remaining cultivars, in particular ‘Camarosa’ and ‘Primoris’ (21% approx.).
Regarding colour, all genotypes showed that ripe fruits were significantly redder (lower h angle values) duller (lower C*) and darker (lower L*) than nearly ripe fruits (Tables 3 and 5), which is consistent with the data reported by other authors [36–38]. The soluble solid concentration increased with ripeness, while the acidity decreased (Table 3), which is consistent with the previously published data [8, 14, 15, 36].
Measured by FRAP assay, the fruit’s antioxidant capacity decreased during ripening (Table 3), which is consistent with previous findings [15]. However when this was measured by the DPPH method no significant differences were found between both ripening stages. These differences could be linked to the different chemical reactions that the methods are based on.
The total anthocyanin concentration significantly increased with increasing ripeness in all the cultivars (Table 4) which is consistent with previous findings in strawberries [8, 14, 15]. The total anthocyanins concentration in ripe strawberries was 1.16–1.52 fold higher than in nearly ripe ones. However, the anthocyanin profile of each cultivar showed no differences during ripening. This indicates that there is a characteristic anthocyanin profile for each cultivar as previously described by Aaby et al. [8]. The concentration of flavan-3-ols decreased with increasing ripeness in all the cultivars except ‘Primoris’ in 2011 (Table 2). Aaby et al. [8] found the catechin concentration decreased in cv. Blink during ripening but was not altered in other strawberry cultivars. Fait et al. [39] found procyanidins accumulated mainly in the early stages of receptacle development.
In general, no significant differences in flavonols content were found during ripening (Table 4). The changes during ripening in the total flavonol contents were ambiguous, as previously reported [8]. ‘Camarosa’ showed a higher flavonol concentration in nearly ripe strawberries than in ripe ones in 2011, while ‘Amiga’, ‘Candonga’, and ‘Primoris’ showed the opposite trend in 2010. The other cultivars had a similar flavonol concentration in both stages of ripening (Table 2). Fait et al. [39] found that derivates of the flavonols, kaempferol and quercitin were present at all stages with varying substitutions. They established that the glucuronide derivates of flavonols were only detected in the receptacle from the medium green to the turning stage. In contrast, kaempferol-malonylhexose was detected predominantly in the achenes mainly in late stages of development, while kaempferol-acetylhexose was detected only at the mature red stage of the receptacle. In our study, all the derivates of flavonols were present in both stages and the differences found between cultivars were due to changes in the quercetin-3-O-glucuronide concentration.
In general, the concentration of hydroxycinnamic acid derivates was significantly higher in ripe strawberries than in nearly ripe ones, which is in line with previous results [8, 33, 40]. The accumulation of phenolic acids has been associated with an enhanced phenolic compound concentration since these compounds serve as precursors for the various branches of the phenylpropanoid pathway and the metabolism of phenolic compounds [39]. The concentration of conjugated forms of ellagic acid was constant during ripening. In this way, similar concentrations of ellagic acid and ellagitannins during ripening were previously described [8, 40]. However, other authors have described a decrease in the concentration of ellagic acid in fully-ripe strawberries [14, 41].
This study found that total phenol concentration increased during ripening. This can be associated with a large increase in anthocyanins and, to a lesser extent, with an increase in hydroxycinnamic acid derivates. Montero et al. [42] demonstrated a sharp decrease in the total phenol concentration occurred during ripening (first stages of fruit development) after the fruit set and then, at the final stage of ripening, a slight increase in the concentration of these compounds was observed due to an accumulation of anthocyanins [43]. Those results demonstrate a two-phase pattern of expression of the phenylpropanoid pathway genes: they are active in the early green stages, less so in the white phase, and increasingly active again during the turning stage of strawberry fruit development. Fait et al. [39] found the accumulation of different classes of secondary metabolites varied during the development and ripening of strawberries: tannins during early development, and phenolic acids, flavanols and anthocyanins during ripening.
3.4Seasonal effect
The environment also plays an important role in determining fruit composition and therefore, in its quality. All the evaluated parameters were significantly influenced by the year of harvest (Tables 3 and 4). However, not all the cultivars were affected by environmental conditions in either the same way or to the same extent (Tables 2 and 5).
Generally, the strawberries from ‘Amiga’, ‘Candonga’ and ‘Primoris’ cultivars were firmer in 2010 than in 2011. ‘Fuentepina’ fruits showed the opposite trend, while ‘Camarosa’ strawberries showed little difference between years. Regarding acidity, significantly higher concentrations were observed in 2010 for ‘Amiga’, ‘Candonga’ and ‘Primoris’ cultivars, while the fruits from ‘Camarosa’ and ‘Fuentepina’ cultivars showed no significant differences. The SSC and ratio showed higher values for strawberries harvested in 2011 than those harvested in 2010.
The antioxidant activity (FRAP and DPPH) of the fruits was notably higher in 2010.
Most of the phenolic compounds were influenced by the environmental conditions (Table 4). A significant interaction effect between cultivar and season was observed in most of the phenolic compounds, indicating the need to evaluate the new cultivars over several years.
The strawberries harvested in 2011 showed higher concentrations of anthocyanins and hydroxycinnamic acid derivates. In contrast, the content of flavonols, flavan-3-ols, ellagic acid conjugates and total phenols was higher in strawberries grown in 2010.
To identify a possible influence of environmental conditions on the phenolic composition of strawberries, data about temperature, solar radiation, humidity and total precipitacion were used from the period of time between 25 and 5 days previous to harvest (DPH) (Table 6). These data are based on the duration of different phenological stages during fruit maturation (25 days) and the final phenological stage of maturation in the region (5 days).
The main differences observed between both years were for accumulated rainfall during 25 DPH and for the temperature and solar radiation registered 5 DPH (Table 6). The accumulated rainfall during 25 DPH in 2011 was 20% higher than in 2010. Additionally, in 2011 the temperatures and solar radiation recorded during the 5 DPH were higher (28% and 16% , respectively). Regarding phenolic composition, the content of flavonols, flavan-3-ols and conjugated forms of ellagic acid were higher in strawberries harvested in 2010, when the accumulated rainfall was lower. Pineli et al. [44] found rain influenced negatively the content of catechins, flavonols and total ellagic acid but this was not the case for anthocyanins. Phenolic compounds, together with vitamin C, are primarily responsible for the antioxidant power of strawberries [2, 6]. Thus, the high antioxidant activity measured in the strawberries harvested in 2010 is consistent with the higher polyphenol concentration found for that season.
In contrast, higher levels of anthocyanins and hydroxycinnamic acid derivates were measured in the strawberries harvested in 2011. Using a PLS regression model, Pineli et al. [44] found a direct relationship between temperature and hours of sunlight in the last 5 days before harvest and the content of anthyocyanins.
4Conclusions
‘Fuentepina’ fruits were lighter red and showed the lowest values in health-promoting compounds. However, the most outstanding feature of this cultivar was its excellent flavour as a result of a very high sugar/acid ratio. ‘Amiga’ had high anthocyanins, polyphenol concentrations and antioxidant capacity. Moreover, this was the firmest variety, a highly valued characteristic for postharvest preservation because softening is a major factor limiting the storage and shelf-life of strawberries. Additionally, ‘Amiga’ strawberries not only stand out for their good qualities, such as low acidity and high firmness, but also for their high content of health-promoting compounds. These quality attributes make this cultivar a good option for production and commercialisation. This new cultivar had qualities that were superior to those of ‘Camarosa’ cultivar, which registered high acidity and low firmness. Therefore ‘Amiga’ could be a good alternative to ‘Camarosa’ and a strong competitor to ‘Candonga’.
Ripeness and season had a significant effect on the quality parameters and on the content of health promoting compounds of strawberry fruits.
Ripe strawberries showed lower acidity and firmness, and higher SSC, anthocyanin and total phenol concentrations than nearly ripe strawberries.
Moreover, this study also demonstrated year-to-year variability in the quality attribute parameters and health-promoting compounds of each cultivar; thus, accurately assessing the nutritional quality of fruit from new genotypes requires longer periods of evaluation.
Acknowledgments
The authors are grateful to the staff at “El Cebollar”, IFAPA’s experimental station, for supplying the strawberries samples. Dr. Pradas would like to thank the Instituto Nacional de Investigación y Tecnología Agraria y Alimentaria (INIA) for the PhD fellowship. Our thanks also go to the Tecnología Postcosecha e Industria Agroalimentaria Laboratory group in IFAPA “Alameda del Obispo” for their support.
References
1 | FAOSTAT. FAO Statistical Database. 2011 [updated 14 october 2011]. Available online: http://www.faostat.fao.org/ |
2 | Fernandes VC, Domingues VF, De Freitas V, Delerue-Matos C, Mateus N(2012) Strawberries from integrated pest management and organic farming: Phenolic composition and antioxidant propertiesFood Chemistry134: 419261931 |
3 | Giampieri F, Alvarez-Suarez JM, Mazzoni L, Romandini S, Bompadre S, Diamanti J(2013) The potential impact of strawberry on human healthNatural Product Research27: 4-5448552013/03/01 |
4 | de la Peña Moreno F, Monagas M, Blanch G, Bartolomé B, Ruiz del Castillo M(2010) Enhancement of anthocyanins and selected aroma compounds in strawberry fruits through methyl jasmonate vapor treatmentEuropean Food Research and Technology230: 6989999 |
5 | Giampieri F, Alvarez-Suarez J, Mazzoni L, Forbes-Hernandez T, Gasparrini M, Gonzàlez-Paramàs A(2014) Polyphenol-rich strawberry extract protects human dermal fibroblasts against hydrogen peroxide oxidative damage and improves mitochondrial functionalityMolecules19: 677987816 |
6 | Giampieri F, Tulipani S, Alvarez-Suarez JM, Quiles JL, Mezzetti B, Battino M(2012) The strawberry: Composition, nutritional quality, and impact on human healthNutrition28: 1919 |
7 | Clifford MN, Scalbert A(2000) Ellagitannins – nature, occurrence and dietary burdenJournal of the Science of Food and Agriculture80: 711181125 |
8 | Aaby K, Mazur S, Nes A, Skrede G(2012) Phenolic compounds in strawberry (Fragaria x ananassa Duch.) fruits: Composition in 27 cultivars and changes during ripeningFood Chemistry132: 18697 |
9 | Capocasa F, Scalzo J, Mezzetti B, Battino M(2008) Combining quality and antioxidant attributes in the strawberry: The role of genotypeFood Chemistry111: 4872878 |
10 | Kafkas E, Kosar M, Paydas S, Kafkas S, Baser KHC(2007) Quality characteristics of strawberry genotypes at different maturation stagesFood Chemistry100: 312291236 |
11 | Gündüz K, Özdemir E(2014) The effects of genotype and growing conditions on antioxidant capacity, phenolic compounds, organic acid and individual sugars of strawberryFood Chemistry155: 0298303 |
12 | Mikulic-Petkovsek M, Schmitzer V, Slatnar A, Stampar F, Veberic R(1064) Composition of Sugars, Organic Acids, and Total Phenolics in 25 Wild or Cultivated Berry SpeciesJournal of Food Science77: 10C1064C1070 |
13 | Määttä-Riihinen KR, Kamal-Eldin A, Törrönen AR(2004) Identification and Quantification of Phenolic Compounds in Berries of Fragaria and Rubus Species (Family Rosaceae)Journal of Agricultural and Food Chemistry52: 2061786187 |
14 | Pineli LDD, Moretti CL, dos Santos MS, Campos AB, Brasileiro AV, Cordova AC(2011) Antioxidants and other chemical and physical characteristics of two strawberry cultivars at different ripeness stagesJournal of Food Composition and Analysis24: 11116 |
15 | Tulipani S, Marzban G, Herndl A, Laimer M, Mezzetti B, Battino M(2011) Influence of environmental and genetic factors on health-related compounds in strawberryFood Chemistry124: 3906913 |
16 | Alvarez-Suarez JM, Mazzoni L, Forbes-Hernandez TY, Gasparrini M, Sabbadini S, Giampieri F(2014) The effects of pre-harvest and post-harvest factors on the nutritional quality of strawberry fruits: A reviewJournal of Berry Research4: 1110 |
17 | Josuttis M, Carlen C, Crespo P, Nestby R, Toldam-Andersen T, Dietrich H(2012) A comparison of bioactive compounds of strawberry fruit from Europe affected by genotype and latitudeJournal of Berry Research2: 27395 |
18 | Medina-Mínguez JJ, Miranda L, Soria C, López-Aranda JM, Domínguez PRAEA Resultados de los ensayosde variedades comerciales de fresa. Campaña 2009/2010. Junta de Andalucía. instituto deInvestigación y Formación Agraria y Pesquera. Consejería de Agricultura y Pesca ed 2011 |
19 | Medina-Mínguez JJ, Méndez E, Soria C, López-Aranda JM, Domínguez PRAEA Resultados de los ensayos de variedades comerciales de fresa. Campaña 2010/2011. Junta de Andalucía. Instituto de Investigación y Formación Agraria y Pesquera. Consejería de Agricultura y Pesca ed 2011 |
20 | Domínguez-Morales P. Evaluación agronómica de selecciones avanzadas del programa nacional de mejora genética (Fragaria x ananassa Duch.) en diferentes sistemas de cultivo y valoración de parámetros de calidad del fruto [PhD Thesis]. Córdoba (Spain): Universidad de Córdoba; 2012 |
21 | Soria C, Sánchez-Sevilla JF, Ariza MT, Gálvez J, López-Aranda JM, Medina JJ(2008) ‘Amiga’StrawberryHortScience43: 3943944 |
22 | Soria C, Medina JJ, Domínguez P, Ariza MT, Miranda L, Villalba R(2010) ‘Fuentepina’ strawberryHortScience45: 3448450 |
23 | Benzie IFF, Strain JJ(1996) The ferric reducing ability of plasma (FRAP) as a measure of “antioxidant power”: TheFRAP assayAnalytical Biochemistry239: 17076 |
24 | Brandwilliams W, Cuvelier ME, Berset C(1995) Use of a free-radical method to evaluate antioxidant activityFood Science and Technology-Lebensmittel-Wissenschaft & Technologie28: 12530 |
25 | Buendia B, Gil MI, Tudela JA, Gady AL, Medina JJ, Soria C(2010) HPLC-MS analysis of proanthocyanidin oligomers and other phenolics in 15 strawberry cultivarsJournal of Agricultural and Food Chemistry58: 739163926 |
26 | Aaby K, Skrede G, Wrolstad RE(2005) Phenolic composition and antioxidant activities in flesh and achenes of strawberries (Fragaria ananassa)Journal of Agricultural and Food Chemistry53: 1040324040 |
27 | Kajdzanoska M, Petreska J, Stefova M(2011) Comparison of different extraction solvent mixtures for characterization of phenolic compounds in strawberriesJournal of Agricultural and Food Chemistry59: 1052725278 |
28 | Kader AA(1999) Fruit maturity, ripening, and quality relationshipsInternational symposium on effect of preharvest and postharvest factors on storage of fruit203208 |
29 | Perkins-Veazie P(2010) Growth and ripening of strawberry fruit. Horticultural Reviews267297John Wiley & Sons, Inc |
30 | Lopes da Silva F, Escribano-Bailon MT, Perez Alonso JJ, Rivas-Gonzalo JC, Santos-Buelga C(2007) Anthocyanin pigments in strawberryLwt-Food Science and Technology40: 2374382 |
31 | Hernanz D, Recamales AF, Meléndez-Martínez AJ, González-Miret ML, Heredia FJ(2007) Assessment of the differences in the phenolic composition of five strawberry cultivars (Fragaria x ananassa Duch.) grown in two different soilless systemsJournal of Agricultural and Food Chemistry55: 518461852 |
32 | de Pascual-Teresa S, Santos-Buelga C, Rivas-Gonzalo JC(2000) Quantitative analysis of flavan-3-ols in Spanish foodstuffs and beveragesJournal of Agricultural and Food Chemistry48: 1153315337 |
33 | Mahmood T, Anwar F, Abbas M, Saari N(2012) Effect of maturity on phenolics (Phenolic acids and flavonoids) profile of strawberry cultivars and mulberry species from PakistanInternational Journal of Molecular Sciences13: 445914607 |
34 | Cordenunsi BR, Genovese MI, do Nascimento JRO, Hassimotto NMA, dos Santos RJ, Lajolo FM(2005) Effects of temperature on the chemical composition and antioxidant activity of three strawberry cultivarsFood Chemistry91: 1113121 |
35 | Villarreal NM, Bustamante CA, Civello PM, Martínez GA(2010) Effect of ethylene and 1-MCP treatments on strawberry fruit ripeningJournal of the Science of Food and Agriculture90: 4683689 |
36 | Ornelas-Paz JD, Yahia EM, Ramirez-Bustamante N, Perez-Martinez JD, Escalante-Minakata MD, Ibarra-Junquera V(2013) Physical attributes and chemical composition of organic strawberry fruit (Fragaria x ananassa Duch, Cv.Albion) at six stages of ripeningFood Chemistry138: 1372381May |
37 | Shin Y, Ryu JA, Liu RH, Nock JF, Watkins CB(2008) Harvest maturity, storage temperature and relative humidity affect fruit quality, antioxidant contents and activity, and inhibition of cell proliferation of strawberry fruitPostharvest Biology and Technology49: 2201209 |
38 | Mazur SP, Nes A, Wold AB, Remberg SF, Martinsen BK, Aaby K(2014) Effects of ripeness and cultivar on chemical composition of strawberry (Fragaria x ananassa Duch.) fruits and their suitability for jam production as a stable product at different storage temperaturesFood Chemistry146: 412422Mar |
39 | Fait A, Hanhineva K, Beleggia R, Dai N, Rogachev I, Nikiforova VJ(2008) Reconfiguration of the achene and receptacle metabolic networks during strawberry fruit developmentPlant Physiology148: 2730750Oct |
40 | Olsson ME, Ekvall J, Gustavsson K-E, Nilsson J, Pillai D, Sjöholm I(2004) Antioxidants, low molecular weight carbohydrates, and total antioxidant capacity in strawberries (Fragaria x ananassa): Effects of cultivar, ripening, and storageJournal of Agricultural and Food Chemistry52: 924902498 |
41 | Williner MR, Pirovani ME, Güemes DR(2003) Ellagic acid content in strawberries of different cultivars and ripening stagesJournal of the Science of Food and Agriculture83: 8842845 |
42 | Montero TM, Molla EM, Esteban RM, LopezAndreu FJ(1996) Quality attributes of strawberry during ripeningScientia Horticulturae65: 4239250 |
43 | Aharoni A, O’Connell AP(2002) Gene expression analysis of strawberry achene and receptacle maturation using DNA microarraysJournal of Experimental Botany53: 37720732087 |
44 | Pineli LdLdO, Moretti CL, Rodrigues JSQ, Ferreira DB, Chiarello MD(2012) Variations in antioxidant properties of strawberries grown in Brazilian savannah and harvested in different seasonsJournal of the science of food and agriculture92: 4831838 |
Figures and Tables
Fig.1
Chromatograms for strawberry cv. Camarosa. A) HPLC-DAD chromatogram obtained at 280 nm. B) HPLC-FD chromatogram. Peaks numbers refer to Table 1.
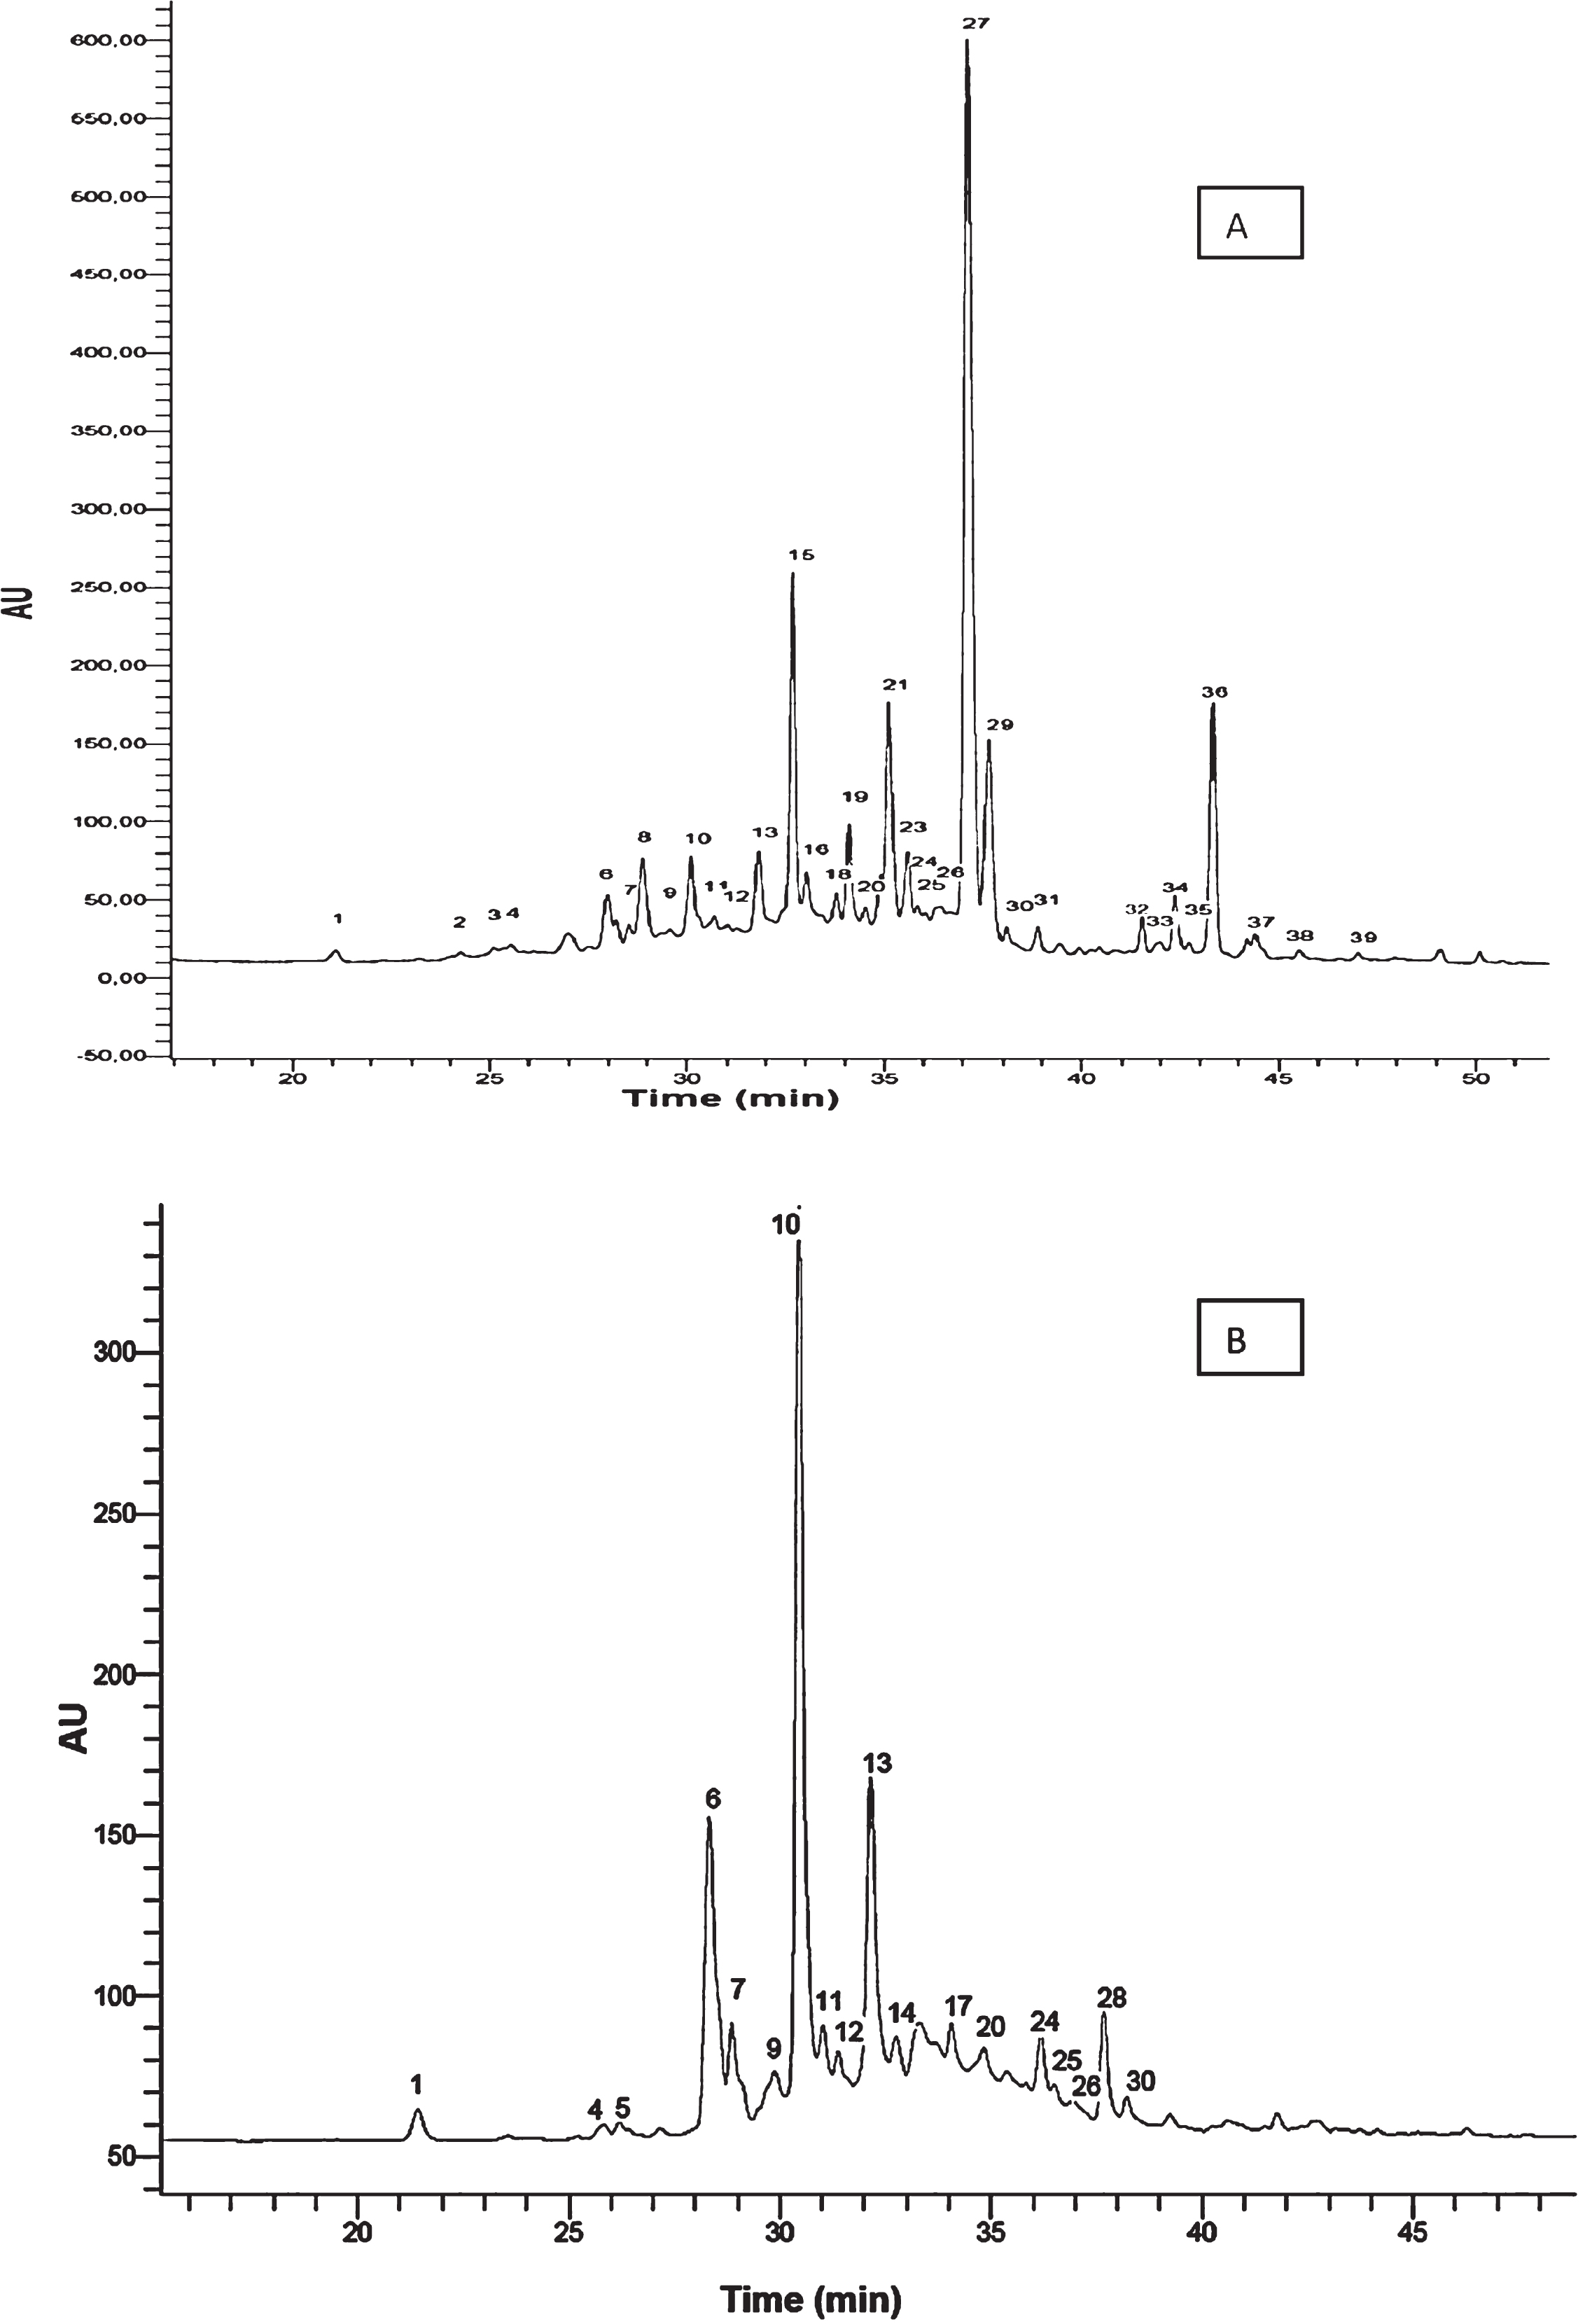
Fig.2
Comparative of concentrations (μg/g DW) of total phenolic compounds (anthocyanins, flavan-3-ols, flavonols, hydroxycinnamic acid derivates and conjugated forms of ellagic acid) in different strawberry cultivars. Data are an average of years (2010 and 2011) and stages of ripening (nearly ripe and ripe).
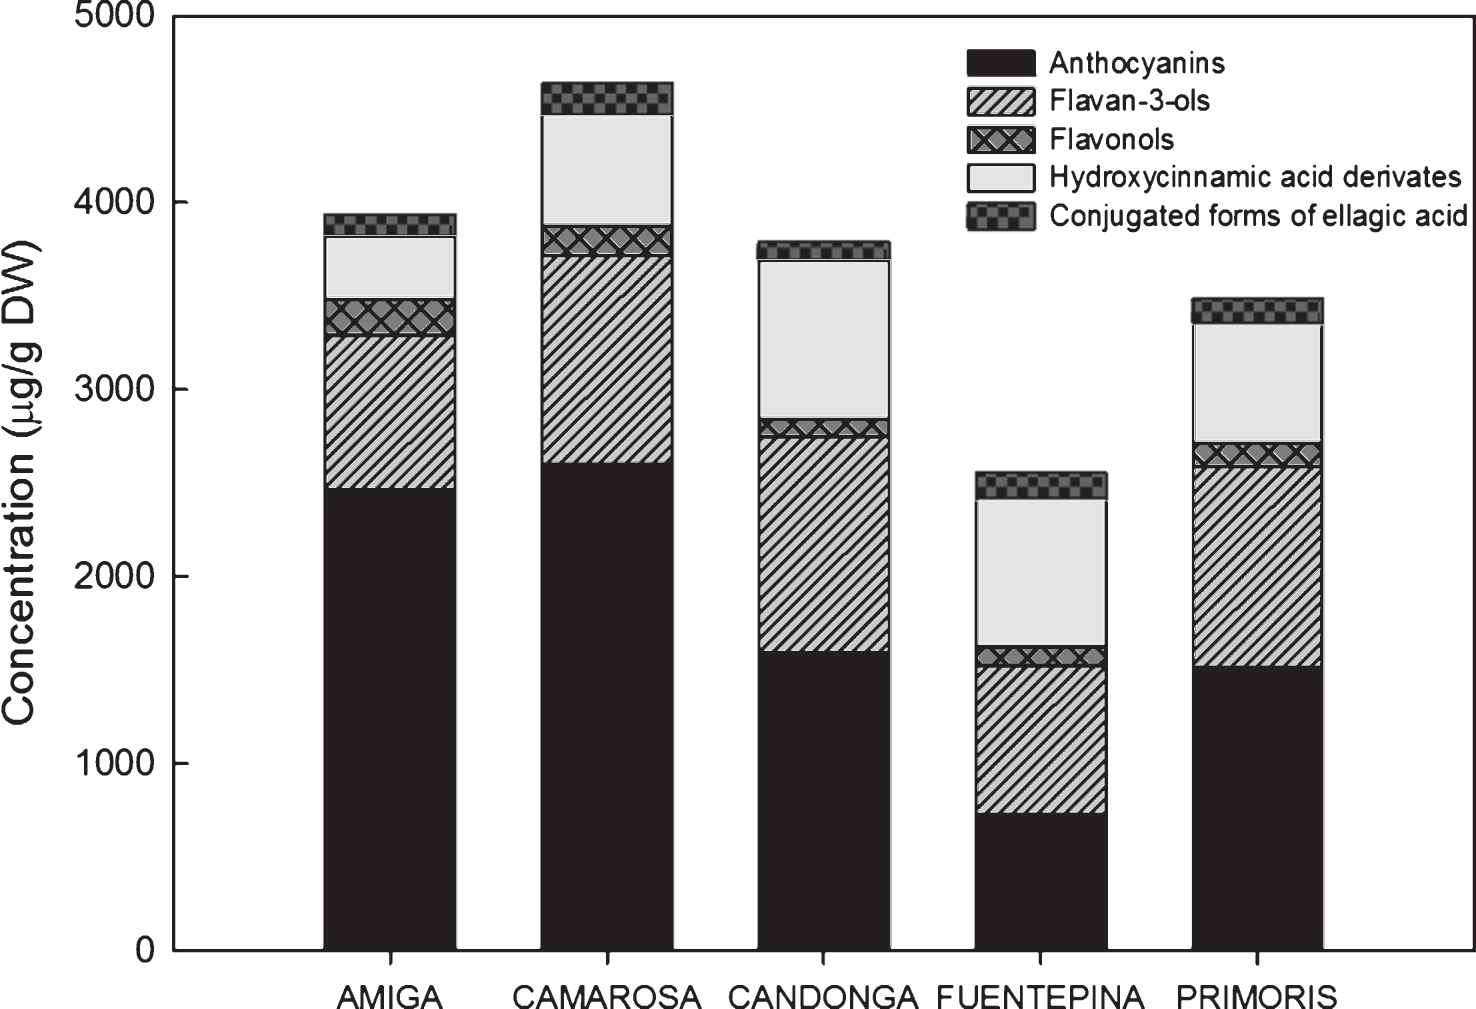
Table 1
Maximum wavelength of absorbance and MS of the phenolic compounds detected in the strawberry cultivars studied (‘Amiga’, ‘Camarosa’, ‘Cangonda’, ‘Fuentepina’ and ‘Primoris’)
| # Peak | Compound | λmax (nm) | m/z [M]+ | Cultivars |
| Anthocyanins | ||||
| 22 | Cyanidin-3-O-glucoside | 518, 282 | 449 | AM, CM, CG, FP, PR |
| 27 | Pelargonidin-3-O-glucoside | 504, 430sh, 330sh, 278 | 433 | AM, CM, CG, FP, PR |
| 29 | Pelargonidin-3-O-rutinoside | 504, 428sh, 332sh, 278 | 579 | AM, CM, CG, FP, PR |
| 35 | Pelargonidin-3-acetylglucoside | 506, 430 h, 332sh, 278 | 475 | AM, CM, CG, PR |
| m/z [M-H]– | ||||
| Flavan-3-ols | ||||
| 1 | Proanthocyanidin trimer | 278, 234 | 865 | AM, CM, CG, FP, PR |
| 4 | Proanthocyanidin dimer | 278, 234 | 577 | AM, CM, CG, FP, PR |
| 5 | Proanthocyanidin dimer | 278, 234 | 577 | AM, CM, CG, FP, PR |
| 6 | Proanthocyanidin dimer | 278, 234 | 577 | AM, CM, CG, FP, PR |
| 7 | Proanthocyanidin trimer | 278, 234 | 865 | AM, CM, CG, FP, PR |
| 9 | Proanthocyanidin dimer | 278, 234 | 561 | AM, CM, CG, FP, PR |
| 10 | Catechin | 278, 234 | 289 | AM, CM, CG, FP, PR |
| 11 | Proanthocyanidin tetramer | 278, 234 | 1153 | AM, CM, CG, FP, PR |
| 12 | Proanthocyanidin tetramer | 278, 234 | 1153 | AM, CM, CG, FP, PR |
| 13 | Proanthocyanidin trimer | 278, 234 | 865 | AM, CM, CG, FP, PR |
| 14 | Proanthocyanidin tetramer | 278, 234 | 1153 | AM, CM, CG, FP, PR |
| 17 | Proanthocyanidin tetramer | 278, 234 | 1153 | AM, CM, CG, FP, PR |
| 20 | Proanthocyanidin trimer | 278, 234 | 849 | AM, CM, CG, FP, PR |
| 24 | Proanthocyanidin tetramer | 278, 234 | 1137 | AM, CM, CG, FP, PR |
| 25 | Proanthocyanidin tetramer | 278, 234 | 1137 | AM, CM, CG, FP, PR |
| 26 | Proanthocyanidin dimer | 278, 234 | 561 | AM, CM, CG, FP, PR |
| 28 | Proanthocyanidin tetramer | 278, 234 | 1137 | AM, CM, CG, FP, PR |
| 30 | Proanthocyanidin trimer | 278, 234 | 865 | AM, CM, CG, FP, PR |
| Flavonols | ||||
| 32 | Quercetin-3-glucuronide | 356, 300sh, 256 | 477 | AM, CM, CG, FP, PR |
| 37 | Kaempferol-3-glucuronide | 348, 266 | 461 | AM, CM, CG, FP, PR |
| 38 | Kaemperol-3-malonylglucoside | 348, 290sh, 266, 234 | 533 | AM, CM, CG, FP, PR |
| 39 | Kaempferol-3-acetylglucoside | 352, 266 | 489 | AM, PR |
| Hydroxycinnamic acid derivates | ||||
| 15 | p-coumaroylhexose | 316, 236 | 325 | AM, CM, CG, FP, PR |
| 18 | p-coumaroylhexose | 316, 236 | 325 | AM, CM, CG, FP, PR |
| 23 | Ferulic acid hexose | 448, 352sh, 312sh, 248sh | 449 | AM, CM, CG, FP, PR |
| 36 | Cinnamoyl-glucose | 283 | 355 [M+COO]– | AM, CM, CG, FP, PR |
| Conjugated forms of ellagic acid | ||||
| 2 | Bis-HHDP-glucoside | 234 | 783 | AM, CM, FP |
| 3 | Bis-HHDP-glucoside | 234 | 783 | AM, CM, CG, FP, PR |
| 8 | HHDP-galloyl-glucose | 286 | 633 | AM, CM, CG, FP, PR |
| 16 | Galloyl-bis-HHDP-glucose | 236, 256sh | 935 | AM, CM, CG, FP, PR |
| 19 | Galloyl-bis-HHDP-glucose | 236, 256sh | 935 | AM, CM, CG, FP, PR |
| 21 | Sanguiin H6 | 234, 266sh | 934 [M–2H]2– | AM, CM, CG, FP, PR |
| 31 | Galloyl-bis-HHDP-glucose | 236, 256sh | 935 | CM, CG |
| 33 | Ellagic acid deoxyhexoside | 372, 250 | 447 | AM, CM, CG, FP, PR |
| 34 | Ellagic acid deoxyhexoside | 372, 250 | 447 | CM, FP, PR |
sh- shoulder AM- amiga; CM- camarosa; CG- candonga; FP- fuentepina; PR- primoris.
Table 2
Concentration of all phenolic compounds identified in nearly ripe and ripe strawberries from the cultivars ‘Amiga’, ‘Camarosa’, ‘Candonga’, ‘Fuentepina’ and ‘Primoris’ in 2010 and 2011
| AMIGA | CAMAROSA | CANDONGA | FUENTEPINA | PRIMORIS | ||||||||||||||||
| 2010 | 2011 | 2010 | 2011 | 2010 | 2011 | 2010 | 2011 | 2010 | 2011 | |||||||||||
| Nearly ripe | Ripe | Nearly ripe | Ripe | Nearly ripe | Ripe | Nearly ripe | Ripe | Nearly ripe | Ripe | Nearly ripe | Ripe | Nearly ripe | Ripe | Nearly ripe | Ripe | Nearly ripe | Ripe | Nearly ripe | Ripe | |
| Anthocyanins | 1732 | 2208 | 2834 | 3080 | 1696 | 2553 | 2795 | 3360 | 1017 | 1743 | 1510 | 2094 | 606 | 639 | 666 | 994 | 1085 | 1564 | 1447 | 1967 |
| Cyanidin-3-O-glucoside | 25 | 34 | 4 | 18 | 118 | 168 | 161 | 175 | 65 | 115 | 74 | 122 | 5 | 8 | 9 | 16 | 76 | 122 | 85 | 137 |
| Pelargonidin-3-O-glucoside | 1524 | 1938 | 2571 | 2783 | 1320 | 1976 | 2209 | 2647 | 852 | 1414 | 1280 | 1746 | 551 | 576 | 600 | 899 | 970 | 1373 | 1298 | 1739 |
| Pelargonidin-3-O-rutinoside | 183 | 236 | 255 | 279 | 258 | 401 | 421 | 527 | 100 | 214 | 156 | 216 | 50 | 55 | 57 | 79 | 39 | 69 | 64 | 76 |
| Pelargonidin-3-acetylglucoside | – | – | 4 | – | – | 8 | 4 | 11 | – | – | – | 10 | – | – | – | – | – | – | – | 15 |
| Flavan-3-ols | 896 | 880 | 904 | 619 | 1171 | 1128 | 1230 | 930 | 1581 | 1171 | 1073 | 808 | 922 | 696 | 855 | 722 | 1332 | 1286 | 822 | 844 |
| Catechin | 299 | 298 | 234 | 139 | 395 | 335 | 368 | 231 | 467 | 349 | 323 | 211 | 282 | 203 | 251 | 189 | 501 | 469 | 248 | 249 |
| Proanthocyanidin dimer | 262 | 240 | 212 | 149 | 319 | 271 | 315 | 206 | 416 | 310 | 293 | 204 | 248 | 179 | 213 | 178 | 364 | 355 | 200 | 190 |
| Proanthocyanidin trimer | 174 | 183 | 273 | 188 | 281 | 322 | 313 | 305 | 353 | 322 | 265 | 254 | 226 | 194 | 237 | 224 | 264 | 264 | 239 | 267 |
| Proanthocyanidin tetramer | 161 | 159 | 185 | 143 | 176 | 200 | 234 | 188 | 345 | 190 | 192 | 139 | 166 | 120 | 154 | 131 | 203 | 198 | 135 | 138 |
| Flavonols | 221 | 244 | 163 | 163 | 157 | 155 | 195 | 123 | 90 | 144 | 86 | 74 | 71 | 85 | 113 | 128 | 116 | 177 | 89 | 140 |
| Quercetin-3-glucuronide | 134 | 139 | 45 | 48 | 94 | 87 | 113 | 60 | 56 | 96 | 54 | 50 | 35 | 49 | 68 | 81 | 66 | 99 | 44 | 78 |
| Kaempferol-3-glucuronide | 78 | 94 | 93 | 94 | 45 | 51 | 59 | 48 | 27 | 37 | 24 | 18 | 30 | 31 | 37 | 40 | 35 | 54 | 30 | 40 |
| Kaemperol-3-malonylglucoside | 9 | 8 | 19 | 16 | 18 | 17 | 23 | 15 | 7 | 11 | 8 | 6 | 6 | 5 | 8 | 7 | 15 | 24 | 14 | 17 |
| Kaempferol-3-acetylglucoside | – | 3 | 6 | 5 | – | – | – | – | – | – | – | – | – | – | – | – | – | – | – | 5 |
| Hydroxycinamic acid derivates | 167 | 246 | 353 | 467 | 474 | 578 | 650 | 765 | 670 | 801 | 840 | 997 | 526 | 606 | 513 | 670 | 415 | 558 | 687 | 682 |
| p-coumaroylhexose | 85 | 132 | 183 | 302 | 341 | 433 | 483 | 560 | 472 | 592 | 684 | 878 | 419 | 496 | 407 | 564 | 297 | 420 | 562 | 550 |
| Cinnamoyl-glucose | 52 | 77 | 119 | 122 | 101 | 105 | 127 | 153 | 181 | 184 | 131 | 87 | 96 | 99 | 96 | 92 | 100 | 109 | 106 | 107 |
| Ferulic acid hexose | 30 | 37 | 51 | 43 | 32 | 40 | 40 | 52 | 17 | 25 | 25 | 32 | 11 | 11 | 10 | 14 | 18 | 29 | 19 | 25 |
| Conjugated ellagic acids | 94 | 128 | 142 | 110 | 150 | 177 | 178 | 174 | 127 | 138 | 68 | 56 | 171 | 105 | 170 | 121 | 178 | 188 | 76 | 87 |
| Bis HHDP glucoside | 1 | 6 | 8 | 23 | 3 | 3 | 5 | 7 | – | 2 | – | 4 | – | – | 3 | 2 | – | 1 | 3 | 3 |
| HHDP galloyl glucose | – | 5 | 13 | 25 | – | 10 | 5 | 14 | – | 9 | – | – | – | 2 | – | 3 | – | 1 | 6 | 4 |
| Galloyl bis HHDP glucose | 14 | 17 | 19 | 9 | 42 | 42 | 42 | 34 | 43 | 29 | 17 | 10 | 23 | 8 | 23 | 11 | 24 | 25 | 1 | 5 |
| Sanguiin H6 | 58 | 70 | 52 | 22 | 72 | 83 | 88 | 83 | 65 | 70 | 35 | 28 | 128 | 76 | 118 | 81 | 131 | 130 | 47 | 57 |
| Ellagic acid deoxyhexoside | 21 | 30 | 49 | 31 | 33 | 39 | 38 | 36 | 19 | 28 | 16 | 14 | 20 | 19 | 26 | 24 | 23 | 31 | 19 | 18 |
Units μg/g DW.
Table 3
Influence of cultivar, ripeness and season on colour parameters (lightness, hue and chroma), firmness, acidity, soluble solid content, ratio and antioxidant capacity (FRAP and DPPH) in strawberries
| L* | h | C | Firmness | Acidity | SSC | Ratio | FRAP | DPPH | |
| Significancea | |||||||||
| Cultivar (C) | *** | *** | *** | *** | *** | *** | *** | *** | * |
| Ripeness (R) | *** | *** | *** | *** | *** | *** | *** | ** | ns |
| Season (S) | *** | *** | *** | ** | *** | * | *** | *** | *** |
| C × R | * | * | * | ns | ns | ns | ns | ns | * |
| C × S | *** | *** | *** | *** | *** | ns | *** | ** | ns |
| R × S | * | ns | *** | ns | ns | ns | ns | ns | ns |
| C × R × S | * | * | * | ns | ** | ns | * | ns | ns |
| Valuesb | |||||||||
| Cultivar | |||||||||
| ‘Amiga’ | 36.4 d | 33.7 b | 48.9 b | 8.7 a | 0.72 b | 8.1 d | 11.8 b | 249 a | 277 b |
| ‘Camarosa’ | 33.1 e | 29.4 d | 42.8 c | 6.1 d | 0.93 a | 8.4 cd | 9.2 c | 265 a | 310 a |
| ‘Candonga’ | 37.5 c | 32.3 c | 49.1 b | 6.9 c | 0.90 a | 8.8 b | 10.0 c | 228 b | 265 b |
| ‘Fuentepina’ | 41.5 a | 36.6 a | 55.4 a | 5.7 d | 0.64 c | 9.5 a | 14.8 a | 221 b | 279 b |
| ‘Primoris’ | 39.4 b | 34.0 b | 49.4 b | 7.6 b | 0.73 b | 8.7 bc | 12.4 b | 222 b | 280 b |
| Ripeness | |||||||||
| Nearly ripe | 39.2 a | 35.7 a | 50.7 a | 7.7 a | 0.83 a | 8.4 b | 10.7 b | 245 a | 288 |
| Ripe | 36.0 b | 30.7 b | 47.6 b | 6.4 b | 0.74 b | 9.0 a | 12.6 a | 229 b | 276 |
| Season | |||||||||
| 2010 | 38.1 a | 34.7 a | 50.8 a | 7.3 a | 0.84 a | 8.6 b | 10.7 b | 271 a | 337 a |
| 2011 | 37.1 b | 31.7 b | 47.5 b | 6.8 b | 0.73 b | 8.9 a | 12.6 a | 203 b | 227 b |
aLevel of significance:*p≤0.05,**p≤0.01,***p≤0.001, ns- non significant.bAverage values. Values with different letters are significantly different (p≤0.05) as determined through LSD test. Firmness (N), acidity (% citric acid), SSC (°Brix), ratio (SSC/acidity), FRAP and DPPH (μmol TE/g DW).
Table 4
Influence of cultivar, ripeness and season on anthocyanins, flavan-3-ols, flavonols, hydroxycinnamic acid derivates, conjugated forms of ellagic acid and total phenols in strawberries
| Anthocyanins | Flavan-3-ols | Flavonols | Hydroxycinnamic acid derivates | Conjugated ellagic acids | Total phenols | |
| Significancea | ||||||
| Cultivar (C) | *** | *** | *** | *** | *** | *** |
| Ripeness (R) | *** | *** | ns | *** | ns | *** |
| Season (S) | *** | *** | * | *** | ** | *** |
| C × R | ns | * | * | ns | ns | ns |
| C × S | * | *** | *** | * | *** | *** |
| R × S | ns | ns | * | ns | ns | ns |
| C × R × S | ns | ns | ns | ns | ns | ns |
| Valuesb | ||||||
| Cultivar | ||||||
| ‘Amiga’ | 2463 a | 824.6 b | 195.1 a | 333.4 c | 118.4 bc | 3934 b |
| ‘Camarosa’ | 2599 a | 1115 a | 157.6 b | 591.6 b | 170.0 a | 4634 a |
| ‘Candonga’ | 1590 b | 1159 a | 98.4 d | 844.0 a | 95.5 c | 3784 bc |
| ‘Fuentepina’ | 724 c | 798.7 b | 99.3 d | 791.7 a | 141.4 ab | 2555 d |
| ‘Primoris’ | 1513 b | 1071 a | 129.6 c | 639.8 b | 131.7 b | 3486 c |
| Ripeness | ||||||
| Nearly ripe | 1538 b | 1079 a | 129.4 | 573.2 b | 135.3 | 3455 b |
| Ripe | 2017 a | 908 b | 142.6 | 706.9 a | 127.4 | 3903 a |
| Season | ||||||
| 2010 | 1483 b | 1106 a | 145.3 a | 535.2 b | 144.7 a | 3942 a |
| 2011 | 2072 a | 880.7 b | 126.6 b | 744.9 a | 118.0 b | 3415 b |
aLevel of significance:*p≤0.05,**p≤0.01,***p≤0.001, ns- non significant.bAverage values. Values with different letters are significantly different (p≤0.05) as determined through LSD test. Units: μg/g.
Table 5
Colour parameters (Lightness (L*), chroma (C*) and hue(h)), firmness, acidity, soluble solid content (SSC), ratio (SSC/acidity) and antioxidant capacity (FRAP and DPPH) in nearly ripe and ripe strawberries from the cultivars ‘Amiga’, ‘Camarosa’, ‘Candonga’, ‘Fuentepina’ and ‘Primoris’ in 2010 and 2011
| L* | h | C* | Firmness | Acidity | SSC | Ratio | FRAP | DPPH | ||
| 2010 | ||||||||||
| AMIGA | Nearly ripe | 36.3 ± 0.2 | 35.8 ± 0.1 | 49.1 ± 1.2 | 10.5 ± 0.8 | 0.84 ± 0.01 | 7.5 ± 0.4 | 8.9 ± 0.4 | 292 ± 4 | 306 ± 33 |
| Ripe | 33.4 ± 0.7 | 32.8 ± 2.0 | 46.5 ± 1.8 | 9.0 ± 0.1 | 0.81 ± 0.05 | 8.4 ± 0.7 | 10.3 ± 1.0 | 279 ± 26 | 357 ± 19 | |
| CAMAROSA | Nearly ripe | 36.9 ± 1.3 | 35.3 ± 1.1 | 48.3 ± 0.2 | 6.8 ± 0.2 | 0.89 ± 0.01 | 7.9 ± 0.4 | 9.2 ± 0.1 | 289 ± 4 | 383 ± 28 |
| Ripe | 32.5 ± 1.2 | 28.1 ± 1.3 | 43.9 ± 0.6 | 5.4 ± 0.6 | 0.93 ± 0.05 | 8.4 ± 0.2 | 9.1 ± 0.7 | 279 ± 28 | 326 ± 22 | |
| CANDONGA | Nearly ripe | 39.4 ± 1.8 | 35.3 ± 0.6 | 51.6 ± 1.3 | 7.9 ± 0.5 | 1.06 ± 0.08 | 8.5 ± 0.4 | 8.0 ± 0.9 | 272 ± 25 | 289 ± 88 |
| Ripe | 37.3 ± 0.3 | 32.4 ± 1.6 | 49.9 ± 2.4 | 7.0 ± 0.2 | 0.89 ± 0.08 | 9.5 ± 0.5 | 10.7 ± 0.6 | 258 ± 20 | 328 ± 35 | |
| FUENTEPINA | Nearly ripe | 42.4 ± 0.6 | 37.3 ± 0.8 | 57.8 ± 0.6 | 5.3 ± 0.2 | 0.63 ± 0.04 | 9.0 ± 0.1 | 14.2 ± 0.6 | 258 ± 17 | 364 ± 12 |
| Ripe | 41.5 ± 1.1 | 36.3 ± 0.9 | 57.0 ± 0.8 | 4.4 ± 0.5 | 0.61 ± 0.03 | 9.4 ± 0.4 | 15.4 ± 0.9 | 234 ± 12 | 315 ± 21 | |
| PRIMORIS | Nearly ripe | 42.1 ± 1.4 | 39.0 ± 1.6 | 53.3 ± 0.1 | 9.6 ± 2.4 | 0.96 ± 0.15 | 8.3 ± 0.1 | 8.7 ± 1.3 | 281 ± 53 | 360 ± 18 |
| Ripe | 39.5 ± 1.1 | 35.0 ± 1.4 | 50.5 ± 2.0 | 6.9 ± 0.1 | 0.73 ± 0.07 | 8.9 ± 0.3 | 12.4 ± 1.7 | 270 ± 57 | 344 ± 25 | |
| 2011 | ||||||||||
| AMIGA | Nearly ripe | 41.0 ± 1.0 | 37.2 ± 0.3 | 53.8 ± 0.4 | 8.1 ± 0.9 | 0.66 ± 0.05 | 7.8 ± 0.0 | 11.8 ± 0.8 | 224 ± 5 | 229 ± 34 |
| Ripe | 34.9 ± 0.4 | 28.9 ± 0.3 | 46.3 ± 0.6 | 7.0 ± 0.1 | 0.56 ± 0.08 | 8.9 ± 0.4 | 16.2 ± 1.9 | 201 ± 5 | 216 ± 24 | |
| CAMAROSA | Nearly ripe | 33.2 ± 1.6 | 30.4 ± 1.5 | 40.7 ± 0.9 | 6.8 ± 0.1 | 1.06 ± 0.01 | 8.1 ± 0.1 | 7.6 ± 0.1 | 274 ± 1 | 287 ± 10 |
| Ripe | 30.0 ± 0.4 | 23.8 ± 0.9 | 38.5 ± 0.9 | 5.4 ± 0.3 | 0.85 ± 0.02 | 9.2 ± 0.5 | 10.8 ± 0.6 | 220 ± 8 | 243 ± 9 | |
| CANDONGA | Nearly ripe | 39.1 ± 0.4 | 33.6 ± 1.3 | 50.2 ± 1.3 | 7.2 ± 0.3 | 0.88 ± 0.09 | 8.5 ± 0.5 | 9.7 ± 0.4 | 195 ± 14 | 231 ± 3 |
| Ripe | 34.3 ± 0.9 | 27.9 ± 1.2 | 44.8 ± 0.8 | 5.8 ± 0.4 | 0.78 ± 0.05 | 8.9 ± 0.4 | 11.5 ± 1.3 | 186 ± 25 | 212 ± 15 | |
| FUENTEPINA | Nearly ripe | 43.0 ± 0.8 | 40.0 ± 1.1 | 54.4 ± 0.5 | 7.0 ± 0.8 | 0.67 ± 0.05 | 9.9 ± 0.4 | 14.8 ± 1.7 | 201 ± 1.5 | 230 ± 5 |
| Ripe | 39.1 ± 0.3 | 32.9 ± 1.1 | 52.2 ± 1.1 | 6.1 ± 0.4 | 0.65 ± 0.03 | 9.7 ± 0.7 | 15.0 ± 1.9 | 193 ± 21 | 205 ± 19 | |
| PRIMORIS | Nearly ripe | 39.0 ± 0.4 | 33.0 ± 0.2 | 47.6 ± 0.2 | 7.5 ± 0.1 | 0.63 ± 0.04 | 8.8 ± 0.1 | 13.9 ± 1.1 | 167 ± 11 | 203 ± 16 |
| Ripe | 37.1 ± 1.1 | 29.0 ± 1.2 | 46.1 ± 1.2 | 6.6 ± 0.4 | 0.61 ± 0.04 | 8.9 ± 0.4 | 14.7 ± 0.9 | 172 ± 14 | 212 ± 15 |
Average values ± standard deviation. Firmness (N), acidity (% citric acid), SSC (°Brix), ratio (SSC/acidity), FRAP and DPPH (μmol TE/g DW).
Table 6
Temperatures (mean, maximum and minimum), solar radiation, humidity and accumulated rainfall averages for 25 and 5 days previous to harvest for 2010 and 2011. Data are from the closest meteorological station located in Moguer (37° 14’ 29” N, 06° 48’ 03” W)
| 25 DPH | 5 DPH | |||
| 2010 | 2011 | 2010 | 2011 | |
| T mean (°C) | 17.8 | 17.3 | 16.0 | 20.5 |
| T max (°C) | 23.4 | 23.0 | 20.9 | 29.3 |
| T min (°C) | 12.4 | 12.2 | 10.1 | 12.8 |
| Solar radiation (MJ/m2 day) | 24.4 | 20.4 | 23.9 | 27.7 |
| Humidity mean (% ) | 70.0 | 77.2 | 73.3 | 62.1 |
| Accumulated Rainfall (mm) | 68.4 | 82.5 | 2.6 | 0.2 |
DPH – days previous to harvest.


