
Combining wearable physiological and inertial sensors with indoor user localization network to enhance activity recognition
Abstract
Thanks to the pervasiveness of smart technologies, researchers could aggregate data and investigate user’s activities thus to deliver personalized home-care services. Activity recognition system have been widely developed, however some challenges still need to be addressed. This paper presents a system where information on body movement, vital signs and user indoor location are aggregated to improve the activity recognition. The system was tested in a realistic environment with a total of 3279 instances acquired from ten healthy users. These results encouraged the use of this approach in activity recognition applications, indeed, the overall accuracy values are satisfactory increased.
1.Introduction
Recent survey shows that more than the 50% of worldwide people live in urban area (3.3 billion) and this percentage is destined to increase reaching 5 billion by 2030 [45]. This rapid growth in urban populations is causing a variety of technical, demographical and societal challenges. Nowadays, the majority of industrialized nations are facing significant complications regarding the quality and cost of various health-care and well-being services. Often service models include strict coperations between different stakeholders, such as end-users, caregivers, service providers, healthcare organizations, developers, manifactures, governative entities, etc., which require to be harmoniously integrated and coordinated between them. ICT and robotic technologies have the potential to improve the quality of services, optimizing care processes and reinforcing the benefits for end-users [41,46].
In the last years, advances in intelligent environmental sensors has led to a rapid increase in smart home and wearable technologies. Recently, CCS Insight has updated its outlook on the future market of wearable devices, indicating that it expects 411 million smart wearable devices to be sold in 2019. In this context, pervasive and Smart technology leads toward future personalized health-care services based on humans’ preferred activities and behaviors. Particularly, monitoring people during daily living, apart from recognizing emergency situations, will allow them to maintain a healthy lifestyle and to prevent anomalies [6]. Advances in pervasive IoT technology have seen the development of a wide variety of sensors that are useful for gathering information about human activities. Thanks to their miniaturization, Inertial Measurement Units (IMUs) could be placed over different parts of the body or the hand according to the kind of the selected activities [9].
The scientific and technological objective in activity recognition field is to recognize human physical activities from data collected through different sensors and combined with different strategies [47]. For instance, data on eye blink frequency and head motion patterns can be combined to distinguish different types of high level activities [19]. Recently, commercial smartwatches [36] and inertial rings were used to recognize commonly daily gestures [28]. Galvanic Skin Response was used to identify physiological arousal, especially when combined with heart rate and heart rate variability [40]. Electrocardiogram and blood signals were used to improve recognition accuracy of common activities (i.e.standing, sitting, lying, walking) [49]. Since the first scientific work on activity recognition system date back’s to the late ’90s [15], there are still many challenges and motivations which lead the researches in this field [20]; such as the balance between the type of intrusive sensors used, the measured attributes, the complexity of the algorithm and the system accuracy [38]. Other barriers are related to the different standard used in this applications. Moreover, it is worth to mention that, it is difficult to obtain the real-life variability of human pose in a controlled environment like a laboratory; thus it is important to acquire data in a realistic environment thus to reduce the laboratory artifacts [16].
In this context, the novel contributions of this work is to investigate and demonstrate the effectiveness of using three data sources to improve the accuracy of activity recognition with respect to the most common state-of-the-art approaches available in literature, that use combinations of only two data sources (mostly inertial/localization and inertial/vital signals) as summarized in Table 1. We should note that the focus of this work is to evaluate the effect of location enhancement in recognizing a set of most commons daily activities. Indeed, in order to corroborate the analysis, we present also the performance of the system without the user location which act as a baseline to discuss the influence of the location-based system.
Table 1
Summary of data sources of relevant related works
| Authors | Body movement | Vital signs | User location | |
| In-home | Out-of-home | |||
| Dionisi et al. [8] | x | x | ||
| Pärkkä et al. [32] | x | x | ||
| Lara et al. [24] | x | x | ||
| Reddy et al. [34] | x | x | ||
| Di Francesco et al. [7] | x | |||
| Zhu et al. [51] | x | x | ||
| Wang et al. [48] | x | |||
| Sharma et al. [37] | x | |||
| Filippoupolitis et al. [13] | x | x | ||
| Ishimaru et al. [19] | x | |||
| Hong et al. [18] | x | x | x | |
| Our work | x | x | x | |
2.Related works
Several research activities were performed over the last years in the field of activity recognition. Many solutions were designed and tested with the use of IMUs placed on the body as reported in some recent review papers [23,29]. Other researches combined data from different sources to improve the overall accuracy. For instance, Pärkkä et al. [32] aggregated a total of 22 signals including accelerometer, vital sign and environmental sensors to verify whether these sources of sensors can improve the activity recognition. Nevertheless, the presented system was very obtrusive because it required an high number of sensors on subjects. Centinela system combined acceleration data with vital signs to achieve highly accurate activity recognition [24]. Indeed, physiological signal could provide information on user physiological status during a specific activity, since it could change according with the activity performed [37].
In literature there are some available database [42–44] which can be used for activity recognition purpose. However, the use of this benchmark dataset are strictly related to a fixed sensor configuration and, often, they are filtered and clean [16].
Nevertheless, for the best of our knowledge, few literature works use IMUs, physiological signal and localization devices. The concept behind the location-enhanced activity recognition is to use the user location as a feature for the system. Recently, Global Positioning System (GPS) data was used to recognize outdoor high-level activities in which a person is engaged and to determine the relationship between activities and locations that were important to the user [38]. Reddy et al. [34] used accelerometers and GPS data to determine what an individual is doing when outside: whether the user was stationary, walking, running, biking or in motorized transport with an accuracy of 93.6%. Di Francesco et al. [7] used build-in smartphone GPS to collect information of out-of-home activity in schizophrenic patients. Liao et al. [25] increased the accuracy level of activity recognition by using information related to the most significant places estimated with embedded GPS installed in smart-phone. Their system used hierarchically structured conditional random fields to generate a consistent model of a person’s activities and places.
Nevertheless, GPS cannot receive signals in the majority of indoor environments or provide room level location [21]. This is problematic as most elderly people spend a lot of time inside their home performing different type of activities related to the free time, to the domestic work and to the personal hygiene [12]. Particularly, some of those activities could be correlated with particular rooms or places of the house [31]. In this sense, the location of the users within a home could represent an advantage which could increase the accuracy of the system. A confirmation of the crucial role represented by indoor localization data in activity recognition is also highlighted by the EvAAL11 initiative, which aims at establishing benchmarks and evaluation metrics for comparing Ambient Assisted Living solutions [33].
As stated from literature evidences, the user indoor location could be estimated by means of different technologies: cameras, infrared, ultrasound, ZigBee, Radio-Frequency Identification, Bluetooth [4,26]. For the best or our knowledge, few works have fused the information on indoor user location with wearable systems to increase the performance of the recognition tasks. Filippoupolitis et al. [13] used smartwatch acceleration data and BLE network to estimate indoor user location to recognize eight different activities usually performed by a technical support staff member such as typing, scanning, installing or assembling. Nevertheless, it is important to focus the attention also on daily activities to identify potential dangerous situation which can occur during daily life. Zhu et al. [51] presented an activity recognition system which fused together information on user location and human motion to identify the activities usually performed in a house. However, the authors used a complex camera-based capture system to estimate the user location which is not easy to install in a real house because of the lower portability, high cost and high system obtrusiveness. Wang et al. [48] presented a location-oriented activity identification at home through the use of existing WiFi access points and WiFi devices (i.e. smart tv, desktop computer, thermostat, refrigerators). However, this system was mainly designed for and tested with a single occupant at home, and it was strictly correlated with the stable position of the furniture. Hong et al. [18] used a localization system based on radio tomographic imaging, physiological data and acceleration data. During the test, they did not give any restrictions to avoid laboratory artifacts. After the data collection, the authors analyzed the video and extract relevant information regarding 7 different activities: standing up, sitting down, lying down, walking, bending, bicycling, and falling.
3.Study design
This work integrates wearable sensors, able to monitor the cardiac activity (electrocardiogram – ECG), the body posture and the acceleration of the low-back and an environmental localization network capable to estimate the user location. This localization network is designed to locate multiple-users in different environments. It is implemented exploiting both range-free and range-based localization methods [3].
Additionally this work aims to test the system in realistic environments with a number of events and participants, comparable with other public dataset and works [24,39,43,44]. In order to achieve the proposed goal, a strict methodology has been applied to recognize eight common daily activities. Particularly, in this work, we compare the results of three supervised machine learning methods commonly used in activity recognition tasks (Decision Tree, Support Vector Machine and Artificial Neural Network) to compare the results with other works present in literature. For each algorithm, two different models (with and without the information on user location) are used to appropriately compare the performance.
Moreover this paper aims to test the robustness of the classification models due to the inter- and intra-subjects variability which could affect the results of the recognition task. In this context, we propose two different analysis: the first one aims to test the efficacy of the system in managing the intra-subject variation through k-cross-fold validation to limit the over-fitting issues; the second approach aims to investigate how the information on user location could help in managing the presence of “unknown” subjects and, for these reasons, we evaluate its performance by using the “Leave-One-Subject-Out” (LOSO) cross-validation approach.
The rest of the paper is organized as follows: Section 4 aims to describe the methodology used in this work, including also sensors, experimental settings and data analysis. Section 7 and Section 8 presents and discusses the results obtained; finally Section 9 concludes the paper.
4.System description
The proposed system for daily activity recognition includes three layers: the hardware, the communication and the data processing. The hardware layer is composed of two wearable sensors (placed on the chest and on the low back) and a localization network [11] (Fig. 1).
Fig. 1.
The system architecture is composed of three layers. Particularly, the hardware includes three sensors (namely IMU, BH3 and localization network) and the data processing module includes 4 main components.
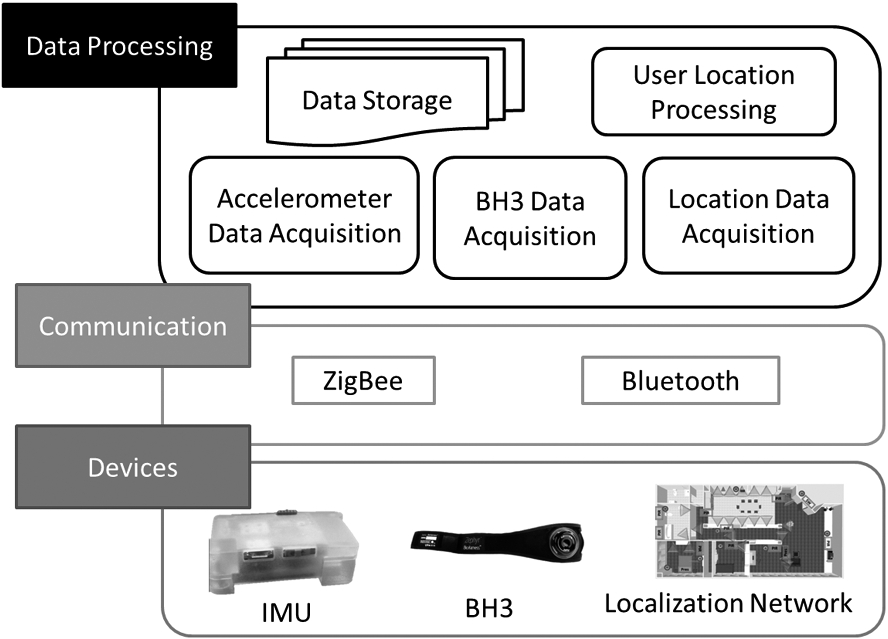
Concerning the hardware layer, Zephyr BioHarness™3 (BH3) is a Bluetooth chest belt capable of monitoring ECG. The ECG signal is sampled at 250 Hz. Moreover, the BH3 is able to collect other signals such as acceleration (3-axis) and posture information with a frequency of 50 Hz. The customer inertial sensor (IMU) is a 9-axis inertial system (3-axis accelerometer, a 3-axis gyroscope and a 3-axis magnetometer) able to collect data at a frequency of 50 Hz. The dimensions of the sensor used in this study are equal 4.5 × 3 × 1.5 cm; however, thanks to the advance in the miniaturization of IMUs, in the future, this kind of sensors can be integrated in commons clothes and accessories like belt or ring [10]. The data is filtered on-board with a fourth-order low-pass digital Butterworth filter with a 5 Hz cut-off frequency. The core of this device is represented by the iNEMO-M1 system on board (STMicroelectronics, Italy) with a Cortex-M3 family microcontroller. Further detailed information are available in [35].
The wireless localization network is designed for estimating the user position with an in-room granularity [3]. It is composed of a ZigBee Coordinator (ZC), a Data Logger (DL), a wearable Mobile Node (MN) and a set of ZigBee Anchors (ZAs). The wearable MN periodically sends messages at 1 Hz to all ZAs within one communication hop. It computes the user location by observing the Received Signal Strength (RSS) of the messages exchanged between the radios. Each ZA computes the RSS as the ratio between the received and transmitted electromagnetic power on the received messages and transmitted this value to the DL. ZAs are instrumented with 60 degrees sectorial antennas and installed in fixed position in the home environment. These antennas are introduced to improve the signal to noise ratio of the RSS observations over the selected areas of interest for the user localization. An omnidirectional antenna for data transmission is embedded into the MN, to reduce the sensitivity of the localization system to the user rotations.
Fig. 2.
The Localization Network in the Domocasa Lab experimental site (Italy). Specific markers represent the position of each wireless board. Red squares identify the presence sensors, colored circles the environmental sensors measuring temperature, light and humidity, a blue cone highlighted the position and orientation of the connected sectorial antenna for each anchor devoted to the user localization [3].
![The Localization Network in the Domocasa Lab experimental site (Italy). Specific markers represent the position of each wireless board. Red squares identify the presence sensors, colored circles the environmental sensors measuring temperature, light and humidity, a blue cone highlighted the position and orientation of the connected sectorial antenna for each anchor devoted to the user localization [3].](https://content.iospress.com:443/media/ais/2018/10-4/ais-10-4-ais493/ais-10-ais493-g002.jpg)
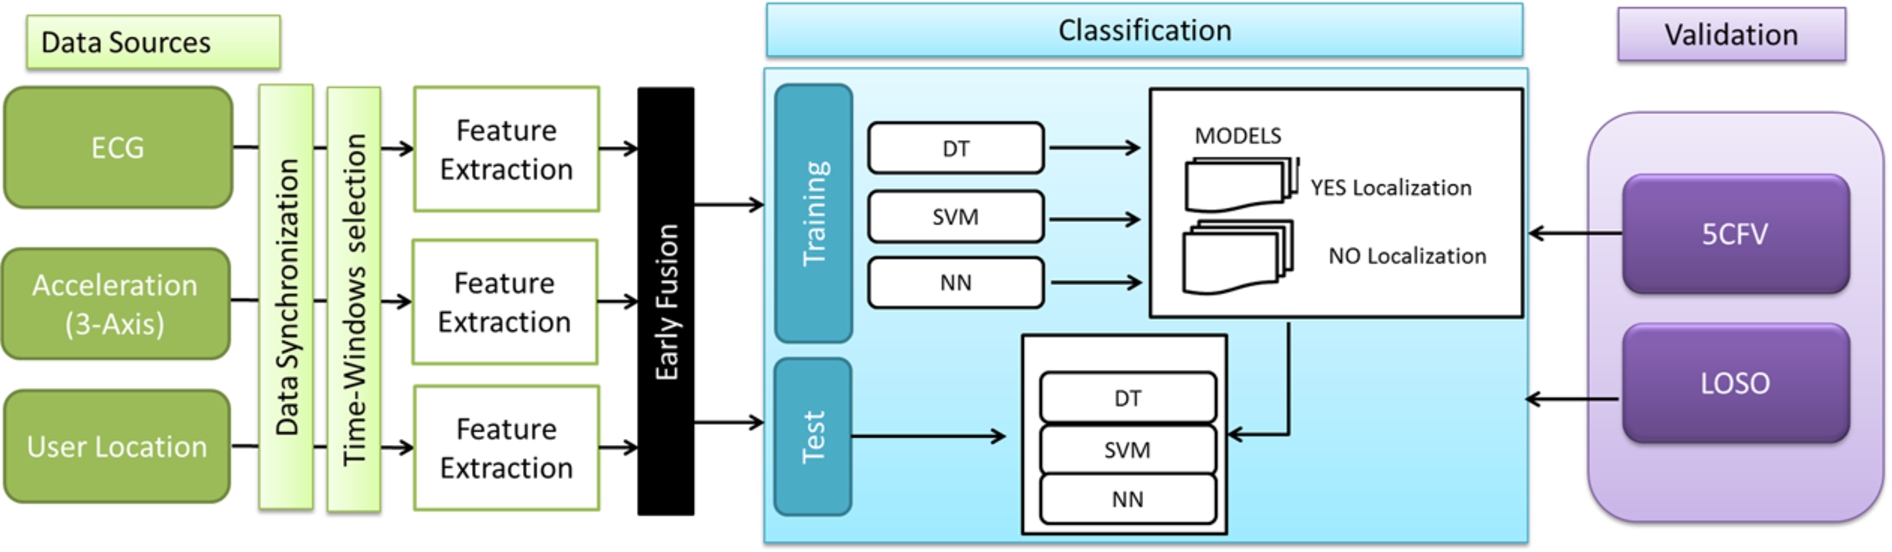
Fig. 3.
Data Analysis logic flowchart.
The anchors are installed on walls and inside the furniture to monitor the most accessed or interesting areas of the rooms and achieve an in-room localization accuracy (Fig. 2). Particularly, the experimental set-up has nine ZAs in the kitchen, two in the bathroom, four in the double bedroom and two in the living room. The overall sensor density is approximately 0.1 device/m2, but the density is higher in the most accessed areas like the kitchen (0.23 device/m2), the bathroom (0.25 device/m2) and the bedroom (0.20 device/m2) (Fig. 5). The entire localization system needs two calibration procedures: the first to extract the RSS path loss (PL) and the other to set area detection boundaries in front of the antennas. The RSSI Path Loss (PL) is modeled as in equation (1) from [50], where
The RSS is sampled by the installer, wearing the MN and standing on ten different fixed positions in front of the antenna. The positions are 25 cm apart from each other on the antenna front line, and 50 RSS samples are collected on each point to estimate the indoor PL. Slope m and d parameters are estimated for each ZA implementing a linear fitting.
Table 2
Features extracted from the system. Acc means accelerometer
| Sensors | Signals | Sampling rate | Feature extracted | Total number |
| Customer Inertial Sensor | Acc | 50 Hz | M, RMS, MAD, SD, VAR for each axis | 15 |
| BH3 | Acc | 50 Hz | M, RMS, MAD, SD, VAR for each axis | 15 |
| ECG | 250 Hz | RRM, RRSD, BPM | 3 | |
| Localization network | – | 1 Hz | Micro-Area | 1 |
| Total | 64 |
The RSSI observations collected during the calibration of the range based localization method are plotted respect to the relative distance between anchor and MN. The RSS recorded at 2 m from each anchor is used as threshold and MN is associated to the area belonging to the anchor that observed an RSS greater than its threshold.
As regards the data processing layer, a PC collects all the data for post analysis by means of four different software modules (Fig. 1). The ECG data acquisition module is able to collect data from BH3 and it is implemented using SDK Zephyr developer kit. Another module is able to collect data from the customer inertial sensors. The last two modules have been implemented to collect RSS data from the DL and to compute the user location with in-room granularity. The user location processing module is based on a sensor fusion approach implemented by means of a Kalman Filter (KF). The system was accounted for a meter-level localization accuracy (mean localization error 0.98 m) as reported in [3].
5.Activity recognition
5.1.Signal pre-processing
The accelerometer data consist of the following attributes: timestamp and acceleration value along x, y and z. Whereas, the physiological data consist of ECG value and timestamp, and the user position data reports the user location estimated by the User Location Processing module with the relative timestamp. As concerns the data analysis on body acceleration, we consider the accelerometer of BH3 as data source for the chest movement and the IMU for the low back movement.
Firstly, the data were pre-processed and conveniently filtered to reduce the noise. Particularly, as concern the accelerometer data acquired from BH3, a fourth-order low-pass digital Butterworth filter was applied with a 5 Hz cut-off frequency. Whereas, ECG data were filtered with a fourth-order band-pass digital Butterworth filter with a 0.05 Hz and 60 Hz cut-off frequencies in order to properly reject the disturbance [1]. Then, since the ECG data required approximately 30 s from the beginning of each acquisition to stabilize, the first samples were cut to reduce the ECG noise and then synchronized by means of the timestamp.
5.2.Feature extraction
These signals were divided with a time-windows length of 7 s, furthermore, an overlapping windows-time of 50% had been chosen to handle transitions more accurately (Fig. 3). Then, they were subsequently processed to extract the following features (Table 2):
– Accelerometer sensors – the signals were analysed to extract for each axes
– ECG signal – the ECG signal was analysed to compute the inter-beats (RR) interval as the time intervals between consecutive heart beats and practically measured in the signal from the beginning of a QRS complex to the beginning of the next QRS complex. From RR signal three different features were extracted: the mean RR value (RRM), the standard deviation (RRSD) and the number of heart beat for minute (BPM).
– User location – the last feature of this dataset was represented by the user location which indicate the micro-area where the activity was performed.
In the literature [47], there are two main fusion strategies that can be used to combine features from multi-modal data. The first-one, namely early fusion, aims to combine the data at feature level thus to create an unique feature vector which represent the final instance. The other strategy, called late fusion, combined the data at decision level, it combines the scores of each modality at high level to obtain the final decision score. In this work, we consider the first approach, thus we combine the features from the three date sources at this level of the analysis. A total of 3279 instances were computed. Each instance is composed of a total of 64 features as summarized in Table 2. As shown in Fig. 4, five activities account for more than 12%, whereas SK is the activity with the lower percentage of instances.
Fig. 4.
Activity class distribution.
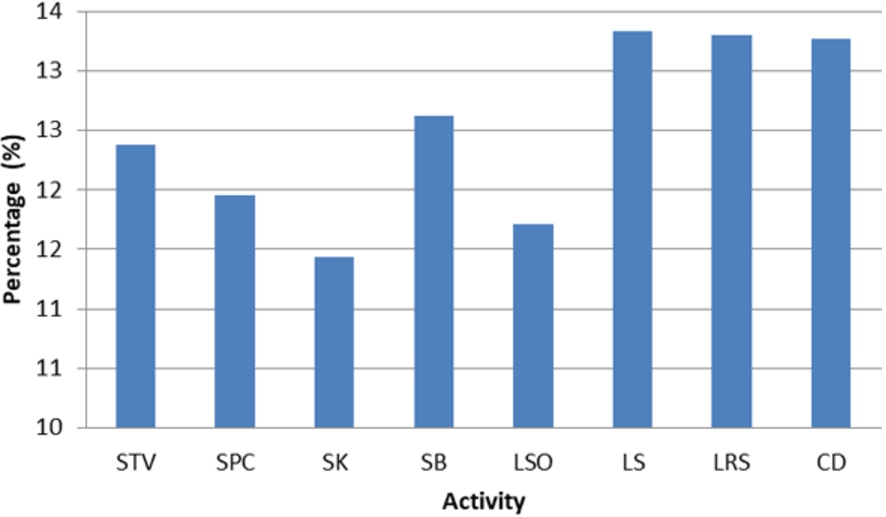
Table 3
Experimental protocol
| Acronym | Name | Description | Location |
| SPC | Work at the PC desk | The user is sitting at the desk in the studio working on his PC | Study Room |
| STV | Sit on the sofa, watching TV | The user is sitting on the sofa, watching TV | Living Room |
| LSO | Lay on the sofa | The user is lying/resting on the sofa (supine), watching TV | Living Room |
| LS | Lay in the bed | The user is lying (supine) in the bed | Bedroom |
| LRS | Lay in the bed | The user is lying in the bed (on his right side) | Bedroom |
| SK | Sit at kitchen table | The user is sitting at the kitchen table, reading the newspaper | Kitchen |
| SB | Sit on the water closet | The user is sitting on the water closet, reading the newspaper | Bathroom |
| CD | Clean the dishes | The user is standing at the kitchen sink, drying the dishes. He tooks a plate from the sink, dries it, and place it in the plate rack | Kitchen |
5.3.Classification
As state from literature evidence, many supervised classification algorithms had been employed in activity recognition tasks [23]. In this work, three common supervised machine learning algorithms are applied to adequately compare the recognition tasks. All these models were computed using the machine learning toolbox of Matlab® 2012:
– Decision Tree (DT) – The Classification Tree is wider used in the activity recognition tasks. In this work we used a build-in function of machine learning toolbox of Matlab based on a Classification and Regression Tree model.
– Support Vector Machine (SVM) – Support Vector Machines algorithm only classify data into two classes. Therefore in this work we used a “multiclass support vector machine” developed by Mishra A. [27] and adapted by Neuburger C. [30] which solve the problems by decomposing the problem into several two class problems. Particularly, in this work, we choose a third-order polynomial function for the kernel to build the models.
– Artificial Neural Network (NN) – They are quite commonly used in supervised prediction techniques. In this work we used a built-in Matlab function to build feedforward neural network with back propagation algorithm with 5 neurons in the hidden layer that allows to minimize the error adjusting the weight of the link.
For each algorithm two different classification models were built to evaluate if user localization could improve the accuracy, one model included the information on the user position and the other one not (Fig. 3). The analysis without the information on user location was used as a baseline to estimate the benefit of using a location-based approach.
5.4.Validation
Two different analysis are proposed to validate the models considering the intra- and inter-subjects variation. In the former, we use the “5 Cross-Fold validation” (5CFV) technique to evaluate the models reducing the over-fitting problems. In this approach, the dataset was partitioned into 5 randomly chosen subsets (or folds) of roughly equal size. One subset was used to train the model, the other subset was used to test the model. In the latter, the models were tested by means of the “leave-one-subject-out” (LOSO) cross fold validation. The training dataset was built by using 9 subjects, whereas the test set included one “unknown” subject. By using this approach we can estimate how the model is robust when unseen data occurs.
Accuracy, precision, F-Measure, sensitivity, specificity metrics and kappa statistic were used to estimate the effectiveness of the models [22,24] and to compare the performance of the three algorithms used for both approaches. For the evaluation of LOSO approaches, these parameters were computed considering the overall confusion matrix. In order to overcome the different distribution of the activities (Fig. 4) the confusion matrices were normalized to the total number of instances for each class. As described in [14] the difference percentage was used to quantitatively estimate the improvements between the two models (with or without the information on user position).
6.Data collection
According with statistic evidences [12] we defined an operative protocols which includes a significant representative of the typical day activities as described in our previous work [14] where we presented an initial proof of concept tested with three subjects. Particularly, 8 daily activities had been selected as described in Table 3.
Table 4
Classifier Performances (N = without the user location feature, Y = with the user location feature)
| Validation | Classifiers | Models | Sensitivity | Precision | Accuracy | F-Measure | Specificity | Kappa |
| 5CFV | DT | N | 0.917 | 0.924 | 0.913 | 0.921 | 0.987 | 0.900 |
| Y | 0.999 | 0.999 | 0.999 | 0.999 | 1.000 | 0.999 | ||
| SVM | N | 0.995 | 0.995 | 0.995 | 0.995 | 0.999 | 0.995 | |
| Y | 0.999 | 0.999 | 0.999 | 0.999 | 1.000 | 0.999 | ||
| NN | N | 0.832 | 0.839 | 0.830 | 0.835 | 0.972 | 0.806 | |
| Y | 0.909 | 0.917 | 0.908 | 0.913 | 0.986 | 0.894 | ||
| LOSO | DT | N | 0.550 | 0.535 | 0.542 | 0.543 | 0.946 | 0.476 |
| Y | 0.924 | 0.925 | 0.925 | 0.925 | 0.989 | 0.915 | ||
| SVM | N | 0.538 | 0.533 | 0.533 | 0.536 | 0.944 | 0.467 | |
| Y | 0.834 | 0.872 | 0.832 | 0.852 | 0.980 | 0.808 | ||
| NN | N | 0.473 | 0.421 | 0.467 | 0.445 | 0.939 | 0.391 | |
| Y | 0.853 | 0.867 | 0.854 | 0.860 | 0.983 | 0.833 |
These selected activities aim to underline how user location could increase the accuracy of the activity recognition tasks. For instance, four different activities (SPC, STV, SK, and SB) presented equal body posture but they were usually performed in different places. Even LS and LSO activity presented the same body posture and similar physiological parameters, but they were performed in two different rooms.
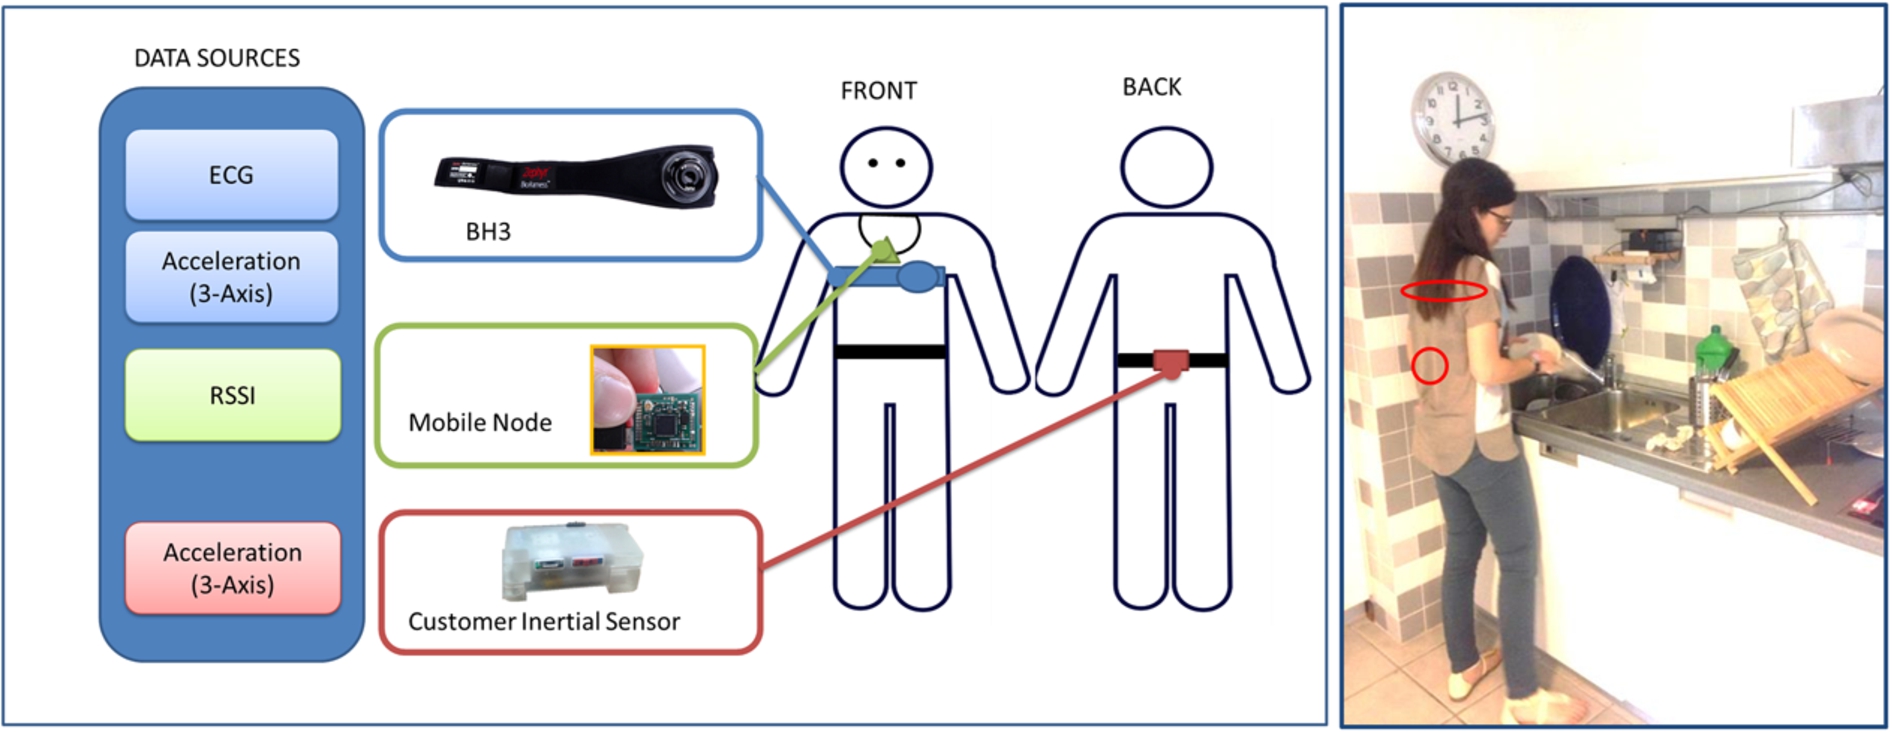
This experimental protocol was realistically tested in the Domocasa Lab (Peccioli, Italy), which reproduces a fully furnished apartment of 200 m2. The apartment was instrumented with user localization network as previously described. All the participants were asked to wear the sensors and the MN for user position and to perform each activity in the specified room for a total of 3 mins as described in Table 3 for a total of 24 minutes of data streaming. The start and final time of each activity was manually labelled. The participants were free to perform each activity as they would do if they were at home, neither suggestions or restrictions were imposed.
Fig. 5.
The user was asked to wear the sensors (the BH3, the Customer Inertial sensor and the mobile node) and to perform each activity for a total of 3 min.
6.1.Participants
Ten voluntary healthy young subjects (6 male, 4 female) with a mean age of 30.0 years (standard deviation: 3.4, range: 25–35) and mean Body Mass Index (BMI) of 22.9 (standard deviation: 2.4, range: 19.4–26.0) participated on purpose in this study. Among tested subjects, 3 were smokers, 1 was occasional smokers, and 6 were no smokers. Participants completed the experimental session in the Domocasa lab of Scuola Superiore Sant’Anna located in Peccioli (Pisa, Italy). Written informed consent was obtained from all the participants before starting the tests.
7.Results
The complete analysed dataset included a total of 3279 instances. Generally, the performance of the models without the information on the user location is lower than the performance obtained with the other model. The complete results are depicted in Table 4.
Fig. 6.
The F-Measure of the three models obtained with 5CFV and LOSO approaches over the different activities included in the protocol.
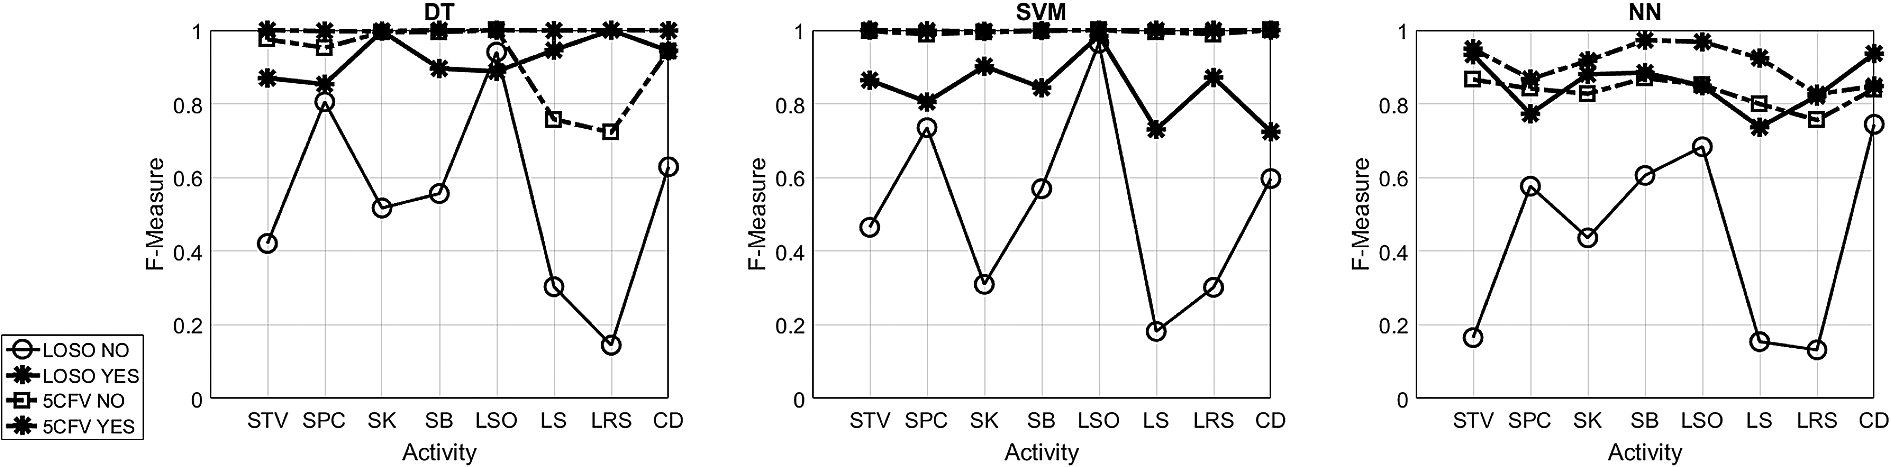
The first analysis was conducted considering 5 Cross-Fold Validation techniques and the results are aligned with our preliminary work [14]. These results are used as a benchmark to compare the performance of the recognition task in case of unknown subject. The accuracy and the F-Measure for the DT and SVM models are > 0.920 (Table 4). Consequently, in this case, the information on user location improves the performance even if only slightly. Particularly, as concern the DT algorithm,we can find the highest increase in sensitivity value for LS activity (from 0.935 to 1.000). For SVM algorithms, the two models present comparable performance. On the contrary, for the NN model, the accuracy increases from 0.830 to 0.908 (9.32%) (Table 3) and the sensitivity is incremented for several activities. In particular, the activity with the highest increase in the sensitivity value is SB (from 0.958 to 0.998).
Fig. 7.
Confusion matrix for the two models obtained with LOSO approach. The values are normalized respect to the total number of instance for each class and they are expressed in percentage.
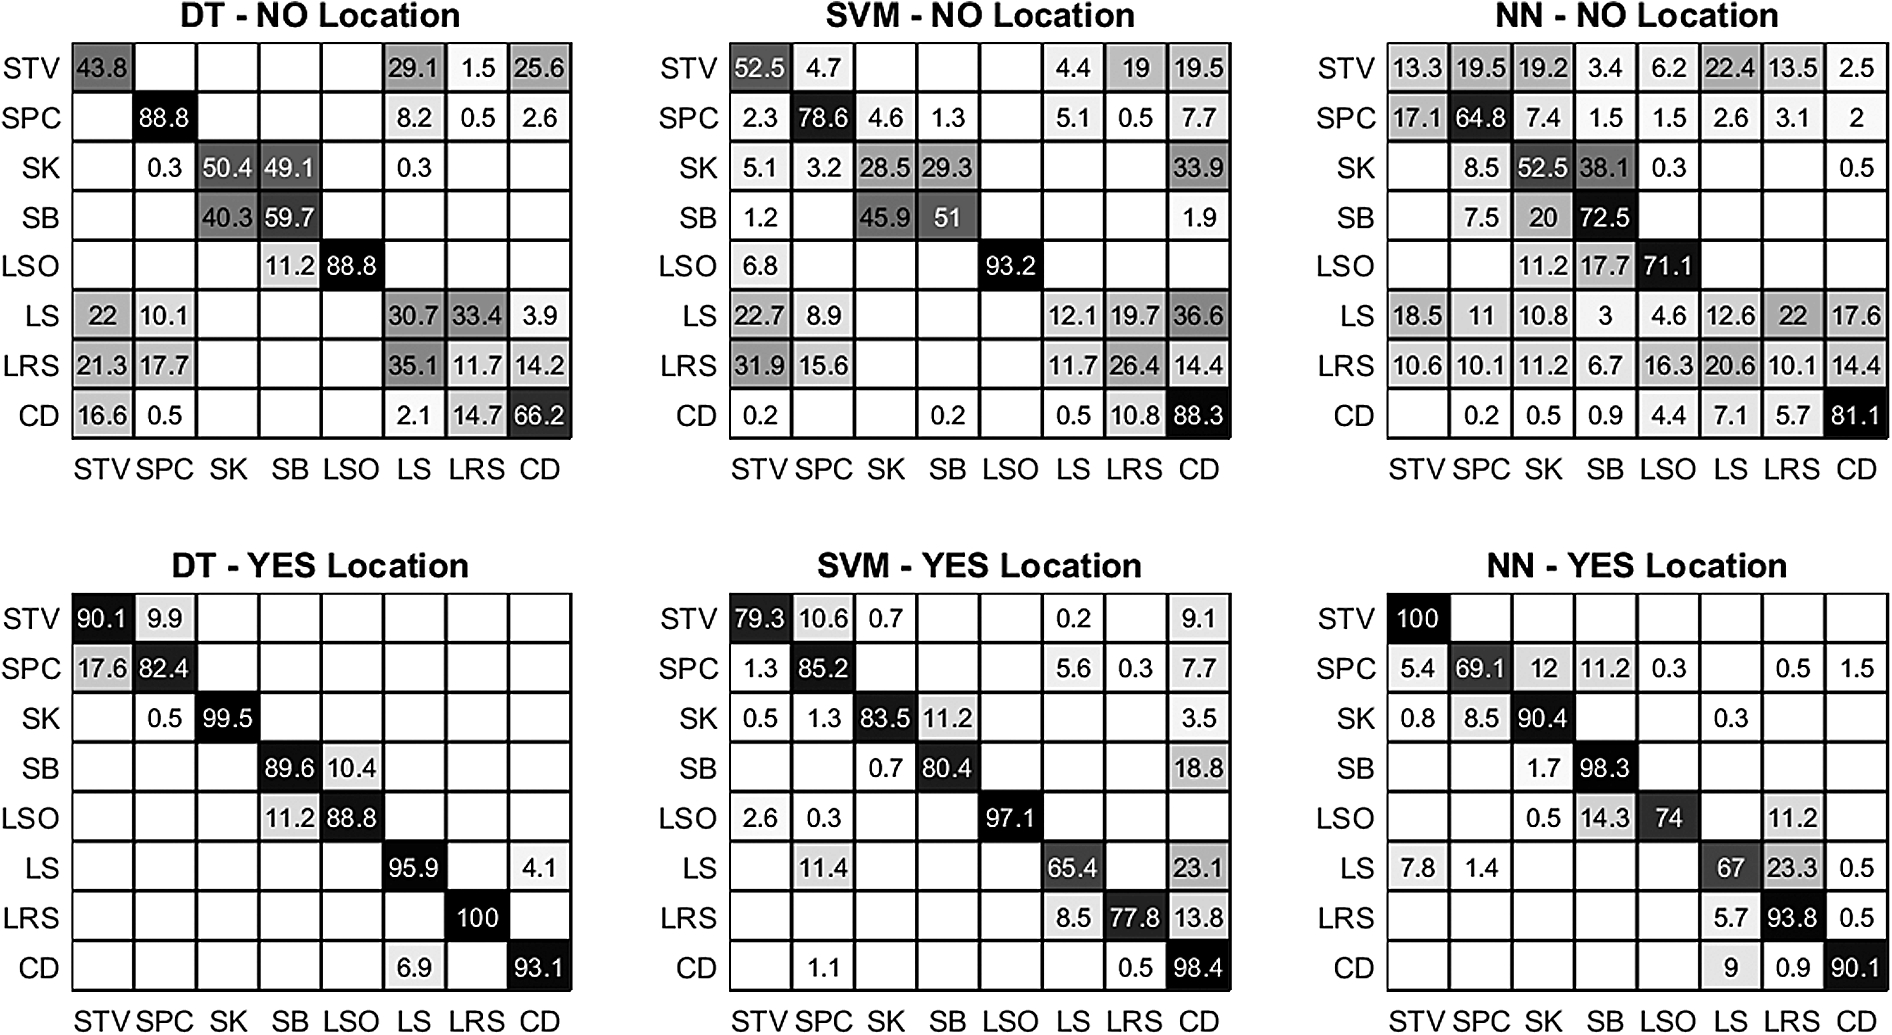
As concern the LOSO approach, it is worth to say that the information on user location reduce the influences of the variability on the recognition of a specific activity (see Table 4). There is a lot of variability in the performance of the activities (Fig. 7). Indeed, the participants were set free to act in a natural way, consequently they assumed different body postures for the same activity. LSO, LRS, CD are the activities with highest inter-subject variability. However, the location-based analysis seems to improve the robustness of the model (Fig. 7).
Particularly, the NN shows the highest difference percentages, in fact the accuracy is increased from 0.467 to 0.854 (83.07%), whereas the F-measure is increased from 0.445 to 0.860 (93.28%). Similarly, also other parameters are significantly increased. The SVM and the DT models present comparable improvement. The accuracy is increased of 55.98% (from 0.533 to 0.832) for the SVM and 70.83% (from 0.542 to 0.925) for the DT. Similar results has been obtained also for the sensitivity and precision, respectively, the differences percentage are equal to 68.03% (from 0.550 to 0.924) and to 72.81% (from 0.535 to 0.925) for DT and to 54.95% (from 0.538 to 0.834) and to 63.54% (from 0.533 to 0.872) respectively for SVM.
Particularly, as concerns the DT models the performance are considerably improved for all activities (Fig. 6). The activities with the higher improvements for sensitivity measure are LRS (from 0.145 to 1.000), LS (from 0.303 to 0.946), and STV (from 0.421 to 0.870). Whereas SPC and LSO have similar performances in terms of F-Measure, particularly they have higher precision in the model without the user location respect to the other one.
Multi-class SVM presents similar results to DT. As regards the F-Measure, the activities with the higher improvements are LS (from 0.182 to 0.730), the SK (from 0.301 to 0.871) and, LRS (from 0.301 to 0.870). Similarly to DT performance, SPC and LSO present comparable performance (Fig. 6).
As regard the performance of NN models, F-measure is significantly improved by the information on user location as depicted in Fig. 6. Particularly, the activities with the higher improvements are STV (from 0.165 to 0.933), LS (from 0.154 to 0.737) and LRS (from 0.132 to 0.821).
8.Discussion
The main goal of the paper was to investigate whether the location-based approach can enhance the recognition of typical day activity. In this sense, the results show that the information on user location, which is an invariant of the system respect to the subject, makes the activity recognition more robust. Indeed, the accuracy are significantly improved by using this location-based approach (Table 4).
As regard the intra-subject analysis (5CFV), NN benefits most from the localization-based approach (Table 4). SVM and DT cannot take full advantage of location information, indeed the results are slightly increased. However, the results without the user location are comparable with other similar work [2] where SVM classified Sitting, Standing and Laying down activities with a precision of 0.97, 0.90 and 1.00 respectively.
On the contrary, for the LOSO analysis, the location-based approach could enhance the management of unknown subject as underlined by the increment for all the evaluation parameters. Table 4 illustrates that DT has the highest recognition performance (Accuracy = 0.925), but the NN is the algorithm which benefits the most from the localization network.
As regard the two analysis without the user location, the LOSO approach has lower performance because of the high variability which affect the data, as confirmed by the confusion matrix reported in Fig. 7. The worst recognized activity are STV, LRS and LS for the three algorithms (Fig. 6).
Additionally, LS and LRS, STV and SPC, SB and SK are often mutually confused in the model without the user location (Fig. 7). STV activity is often confused with LS and CD activities. In these cases the location of the users provides valuable information to discriminate this couple of activities. It is important to notice that, in this experimental setting we consider one accelerometer placed on the chest and one on the low back and CD and STV have the same requirement in terms of chest posture. Moreover, the user were asked to act in natural way, thus often they were relaxed on the sofa assuming different posture while they were performing STV activity. These aspects influences a lot the variability of the data. Indeed, one of the major drawback of public datasets is that they were acquired in simulating the environment, thus the data are often “clean” of artifacts. Other public datasets [42] were more focus on other activity i.e. running, walking and sitting, thus we consider other common activities and poses of daily living.
In this work, the participants were asked to act in a natural way, as they would do in their home, no particular restrictions were applied. This choice was made to make the test more realistic and reduce the “laboratory” artifacts. In the reality, nobody will tell you how you have to relax on your sofa or how to sit at your PC desk. Consequently, as you imagine, there is a lot of variability on the body postures that a single participants can assume, just think on the way that you are sitting on the sofa watching TV, or you are lying on the bed. Additionally, vital signs (like ECG), because of their nature, are affected of intra- and inter-subject variations [17]. The peculiarity of this work is to perform the activity in a real house with real furniture, not in a simulated environment. For instance, the action relaxing on the sofa was acquired using a chair, but the user could assume different body posture depending on the chairs (chair, sofa) [5].
IoT and connected devices are becoming more common in our daily life. Technology is ready to be used by citizens during daily life. This means that there is a lot of available information which could be potentially included in the analysis. In this work user localization was used as an example, but other activity recognition models can be generated including other type of information which come from the pervasive use of connected devices and personal devices [47].
However, this work presents some limitations which will be addressed in future improvements of the analysis. Particularly, the data acquisition was performed in a living lab, even the participants were asked to act in a natural way, some artifacts due to the settings could affect the movement and the vital sign. Future improvements of the system should envisage the user of a real setting, where the user is free to move in order to reduce the laboratory artifacts and manages real data. Additionally, an improvement of the protocol should include other common more dynamic daily activities like walking, ascending/descending stairs, running and eating performed by young and older subject in order to analyse how a single activity could change according with the age. Additionally, future works are planned in order to built a more versatile dataset which include other activities performed in the different rooms. This analysis will be conducted to investigate also the outputs of the system when a transition occurs between two activities. Furthermore, the evaluation of the impact of using different localization systems, or the same system with different accuracy in positioning could be an interesting future activities.
9.Conclusion
In this work, we proposed an activity recognition framework for indoor environments, composed of a portable user localization network and wearable sensors.
Our experimental results have shown that there is a clear improvement in the performance of our system in managing unknown subjects when localization network data are used, particularly, DT exhibits the highest performance gain when using user location feature. The localization-based approach reduces the errors due to inter-subject variability. As concern the intra-subject analysis the extent to which the location information can be advantageous depends on the type of classifier. NN benefits more from the fusion of localization data rather than the other two. Furthermore, the presented system has been tested in a realistic environment with ten young experimenters. These results are promising and encourages the use of this approach in activity recognition applications.
Further investigation should include other supervised machine learning algorithms which are commonly used in this research field and further analysis should be performed in order to test the algorithms for a real time applications.
Notes
1 Evaluating AAL Systems through Competitive Benchmarking, official website: http://evaal.aaloa.org/.
Acknowledgements
This work was supported by the European Community’s 7th Framework Program (FP7-ICT-2011) under grant agreement No. 288899 (Robot-Era Project) and by DAPHNE project (REGIONE TOSCANA PAR FAS 2007–2013, BANDO FAS SALUTE 2014, CUP J52I16000170002).
References
[1] | M. Ahlstrom and W. Tompkins, Digital filters for real-time ECG signal processing using microprocessors, IEEE Transactions on Biomedical Engineering 9: ((1985) ), 708–713. doi:10.1109/TBME.1985.325589. |
[2] | D. Anguita, A. Ghio, L. Oneto, X. Parra and J.L. Reyes-Ortiz, A public domain dataset for human activity recognition using smartphones, in: ESANN, (2013) . |
[3] | M. Bonaccorsi, L. Fiorini, F. Cavallo, A. Saffiotti and P. Dario, A cloud robotics solution to improve social assistive robots for active and healthy aging, International Journal of Social Robotics 8: ((2016) ), 1–16. doi:10.1007/s12369-015-0335-6. |
[4] | R.F. Brena, J.P. García-Vázquez, C.E. Galván-Tejada, D. Muñoz-Rodriguez, C. Vargas-Rosales and J. Fangmeyer, Evolution of indoor positioning technologies: A survey, Journal of Sensors 2017: ((2017) ), 2630413. |
[5] | C. Chen, R. Jafari and N. Kehtarnavaz, Utd-mhad: A multimodal dataset for human action recognition utilizing a depth camera and a wearable inertial sensor, in: Image Processing (ICIP), 2015 IEEE International Conference on, IEEE, (2015) , pp. 168–172. doi:10.1109/ICIP.2015.7350781. |
[6] | D.J. Cook, M. Schmitter-Edgecombe and P. Dawadi, Analyzing activity behavior and movement in a naturalistic environment using smart home techniques, IEEE journal of biomedical and health informatics 19: (6) ((2015) ), 1882–1892. doi:10.1109/JBHI.2015.2461659. |
[7] | S. Difrancesco, P. Fraccaro, S.N. van der Veer, B. Alshoumr, J. Ainsworth, R. Bellazzi and N. Peek, Out-of-home activity recognition from GPS data in schizophrenic patients, in: Computer-Based Medical Systems (CBMS), 2016 IEEE 29th International Symposium on, IEEE, (2016) , pp. 324–328. doi:10.1109/CBMS.2016.54. |
[8] | A. Dionisi, D. Marioli, E. Sardini and M. Serpelloni, Autonomous wearable system for vital signs measurement with energy-harvesting module, IEEE Transactions on Instrumentation and Measurement 65: (6) ((2016) ), 1423–1434. doi:10.1109/TIM.2016.2519779. |
[9] | L. Dipietro, A.M. Sabatini and P. Dario, A survey of glove-based systems and their applications, IEEE Transactions on Systems, Man, and Cybernetics, Part C (Applications and Reviews) 38: (4) ((2008) ), 461–482. doi:10.1109/TSMCC.2008.923862. |
[10] | D. Esposito and F. Cavallo, Preliminary design issues for inertial rings in Ambient Assisted Living applications, in: Instrumentation and Measurement Technology Conference (I2MTC), 2015 IEEE International, IEEE, (2015) , pp. 250–255. doi:10.1109/I2MTC.2015.7151274. |
[11] | R. Esposito, L. Fiorini, R. Limosani, M. Bonaccorsi, A. Manzi, F. Cavallo and P. Dario, Supporting active and healthy aging with advanced robotics integrated in smart environment, in: Optimizing Assistive Technologies for Aging Populations, (2015) , pp. 46–77. |
[12] | European Commission, Eurostat, “How European Spends their time”, 2004, Accessed: 2016-09-08. |
[13] | A. Filippoupolitis, W. Oliff, B. Takand and G. Loukas, Location-enhanced activity recognition in indoor environments using off the shelf smart watch technology and BLE beacons, Sensors 17: (6) ((2017) ), 1230. doi:10.3390/s17061230. |
[14] | L. Fiorini, M. Bonaccorsi, S. Betti, P. Dario and F. Cavallo, User indoor localisation system enhances activity recognition: A proof of concept, in: Proceedings of Forum Italiano of Ambient Assisted Living 2016 – 2016, LNEE, Springer International Publishing, (2017) . |
[15] | F. Foerster, M. Smeja and J. Fahrenberg, Detection of posture and motion by accelerometry: A validation study in ambulatory monitoring, Computers in Human Behavior 15: (5) ((1999) ), 571–583. doi:10.1016/S0747-5632(99)00037-0. |
[16] | H. Gjoreski, S. Kozina, M. Gams, M. Lustrek, J.A. Álvarez-García, J.-H. Hong, A.K. Dey, M. Bocca and N. Patwari, Competitive live evaluations of activity-recognition systems, IEEE Pervasive Computing 14: (1) ((2015) ), 70–77. doi:10.1109/MPRV.2015.3. |
[17] | R. Harris and S. Steare, A meta-analysis of ECG data from healthy male volunteers: Diurnal and intra-subject variability, and implications for planning ECG assessments and statistical analysis in clinical pharmacology studies, European journal of clinical pharmacology 62: (11) ((2006) ), 893–903. doi:10.1007/s00228-006-0194-z. |
[18] | J.-H. Hong, J. Ramos, C. Shin and A.K. Dey, An activity recognition system for ambient assisted living environments, in: International Competition on Evaluating AAL Systems Through Competitive Benchmarking, Springer, (2012) , pp. 148–158. |
[19] | S. Ishimaru, K. Kunze, K. Kise, J. Weppner, A. Dengel, P. Lukowicz and A. Bulling, In the blink of an eye: Combining head motion and eye blink frequency for activity recognition with Google glass, in: Proceedings of the 5th Augmented Human International Conference, ACM, (2014) , p. 15. |
[20] | E. Kim, S. Helal and D. Cook, Human activity recognition and pattern discovery, IEEE Pervasive Computing 9: (1) ((2010) ), 48–53. doi:10.1109/MPRV.2010.7. |
[21] | P.J. Krenn, S. Titze, P. Oja, A. Jones and D. Ogilvie, Use of global positioning systems to study physical activity and the environment: A systematic review, American journal of preventive medicine 41: (5) ((2011) ), 508–515. doi:10.1016/j.amepre.2011.06.046. |
[22] | J.R. Landis and G.G. Koch, The measurement of observer agreement for categorical data, Biometrics 33: ((1977) ), 159–174. doi:10.2307/2529310. |
[23] | O.D. Lara and M.A. Labrador, A survey on human activity recognition using wearable sensors, IEEE Communications Surveys and Tutorials 15: (3) ((2013) ), 1192–1209. doi:10.1109/SURV.2012.110112.00192. |
[24] | Ó.D. Lara, A.J. Pérez, M.A. Labrador and J.D. Posada, Centinela: A human activity recognition system based on acceleration and vital sign data, Pervasive and mobile computing 8: (5) ((2012) ), 717–729. doi:10.1016/j.pmcj.2011.06.004. |
[25] | L. Liao, D. Fox and H. Kautz, Location-based activity recognition, Advances in Neural Information Processing Systems 18: ((2006) ), 787. |
[26] | A. Loveday, L.B. Sherar, J.P. Sanders, P.W. Sanderson and D.W. Esliger, Technologies that assess the location of physical activity and sedentary behavior: A systematic review, Journal of medical Internet research 17: (8) ((2015) ), e192. doi:10.2196/jmir.4761. |
[27] | A. Mishra, Multiclass – SVM Matlab toolbox, Accessed: 2016-09-08. |
[28] | A. Moschetti, L. Fiorini, D. Esposito, P. Dario and F. Cavallo, Recognition of daily gestures with wearable inertial rings and bracelets, Sensors 16: (8) ((2016) ), 1341. doi:10.3390/s16081341. |
[29] | S.C. Mukhopadhyay, Wearable sensors for human activity monitoring: A review, IEEE sensors journal 15: (3) ((2015) ), 1321–1330. doi:10.1109/JSEN.2014.2370945. |
[30] | C. Neuburger, Multiclass – SVM Matlab toolbox, Accessed: 2016-09-08. |
[31] | Q. Ni, A.B. García Hernando and I.P. de la Cruz, The elderly’s independent living in smart homes: A characterization of activities and sensing infrastructure survey to facilitate services development, Sensors 15: (5) ((2015) ), 11312–11362. doi:10.3390/s150511312. |
[32] | J. Parkka, M. Ermes, P. Korpipaa, J. Mantyjarvi, J. Peltola and I. Korhonen, Activity classification using realistic data from wearable sensors, IEEE Transactions on information technology in biomedicine 10: (1) ((2006) ), 119–128. doi:10.1109/TITB.2005.856863. |
[33] | F. Potortì, S. Park, A.R. Jiménez Ruiz, P. Barsocchi, M. Girolami, A. Crivello, S.Y. Lee, J.H. Lim, J. Torres-Sospedra, F. Seco et al., Comparing the performance of indoor localization systems through the EvAAL framework, Sensors 17: (10) ((2017) ), 2327. doi:10.3390/s17102327. |
[34] | S. Reddy, M. Mun, J. Burke, D. Estrin, M. Hansen and M. Srivastava, Using mobile phones to determine transportation modes, ACM Transactions on Sensor Networks (TOSN) 6: (2) ((2010) ), 13. doi:10.1145/1689239.1689243. |
[35] | E. Rovini, D. Esposito, C. Maremmani, P. Bongioanni and F. Cavallo, Empowering patients in self-management of Parkinson’s disease through cooperative ICT systems, in: Optimizing Assistive Technologies for Aging Populations, (2015) , p. 251. |
[36] | S. Sen, V. Subbaraju, A. Misra, R.K. Balan and Y. Lee, The case for smartwatch-based diet monitoring, in: Pervasive Computing and Communication Workshops (PerCom Workshops), 2015 IEEE International Conference on, IEEE, (2015) , pp. 585–590. doi:10.1109/PERCOMW.2015.7134103. |
[37] | N. Sharma and T. Gedeon, Objective measures, sensors and computational techniques for stress recognition and classification: A survey, Computer methods and programs in biomedicine 108: (3) ((2012) ), 1287–1301. doi:10.1016/j.cmpb.2012.07.003. |
[38] | M. Shoaib, S. Bosch, O.D. Incel, H. Scholten and P.J. Havinga, A survey of online activity recognition using mobile phones, Sensors 15: (1) ((2015) ), 2059–2085. doi:10.3390/s150102059. |
[39] | J. Sung, C. Ponce, B. Selman and A. Saxena, Unstructured human activity detection from rgbd images, in: Robotics and Automation (ICRA), 2012 IEEE International Conference on, IEEE, (2012) , pp. 842–849. doi:10.1109/ICRA.2012.6224591. |
[40] | T.B. Tang, L.W. Yeo and D.J.H. Lau, Activity awareness can improve continuous stress detection in galvanic skin response, in: SENSORS, 2014 IEEE, IEEE, (2014) , pp. 1980–1983. doi:10.1109/ICSENS.2014.6985421. |
[41] | G. Turchetti, S. Micera, F. Cavallo, L. Odetti and P. Dario, Technology and innovative services, IEEE pulse 2: (2) ((2011) ), 27–35. doi:10.1109/MPUL.2011.940428. |
[42] | UCI – Machine Learning Repository, Accessed: 2017-02-08. |
[43] | UCI – Heterogeneity Activity Recognition Data Set, Accessed: 2017-02-08. |
[44] | UCI – Activity Recognition from Single Chest-Mounted Accelerometer Data Set, Accessed: 2017-02-08. |
[45] | United Nation Population Found (2015), Accessed: 2017-02-08. |
[46] | F. Cavallo, M. Aquilano, M. Bonaccorsi, R. Limosani, A. Manzi, M.C. Carrozza and P. Dario, Improving Domiciliary Robotic Services by Integrating the ASTRO Robot in an AmI Infrastructure, Springer, (2014) . https://www.scopus.com/inward/record.uri?eid=2-s2.0-84927133461&doi=10.1007%2f978-3-319-02934-4_13&partnerID=40&md5=1a85b9c5506e8647d0010879e502d2a0. doi:10.1007/978-3-319-02934-4_13. |
[47] | M. Vrigkas, C. Nikou and I.A. Kakadiaris, A review of human activity recognition methods, Frontiers in Robotics and AI 2: ((2015) ), 28. doi:10.3389/frobt.2015.00028. |
[48] | Y. Wang, J. Liu, Y. Chen, M. Gruteser, J. Yang and H. Liu, E-eyes: Device-free location-oriented activity identification using fine-grained wifi signatures, in: Proceedings of the 20th Annual International Conference on Mobile Computing and Networking, ACM, (2014) , pp. 617–628. |
[49] | Z. Wang, C. Zhao and S. Qiu, A system of human vital signs monitoring and activity recognition based on body sensor network, Sensor Review 34: (1) ((2014) ), 42–50. doi:10.1108/SR-12-2012-735. |
[50] | K. Whitehouse, C. Karlof and D. Culler, A practical evaluation of radio signal strength for ranging-based localization, ACM SIGMOBILE Mobile Computing and Communications Review 11: (1) ((2007) ), 41–52. doi:10.1145/1234822.1234829. |
[51] | C. Zhu and W. Sheng, Realtime recognition of complex human daily activities using human motion and location data, IEEE Transactions on Biomedical Engineering 59: (9) ((2012) ), 2422–2430. doi:10.1109/TBME.2012.2190602. |


