
A Petri net oriented approach for advanced building energy management systems
Abstract
Sustainability is one of the main goals to pursue in several aspects of everyday life; the recent energy shortage and the price raise worsen this problem, especially in the management of energy in buildings. As the Internet of Things (IoT) is an assessed computing paradigm able to capture meaningful data from the field and send them to cloud infrastructures, other approaches are also enabled, namely model-based approaches. These methods can be used to predict functional and non-functional properties of Building Energy Management Systems (BEMS) before setting up them. This paper aims at bridging the gap between model-based approaches and physical realizations of sensing and small computing devices. Through an integrated approach, able to exploit the power of different dialects of Petri Nets, this paper proposes a methodology for the early evaluation of BEMS properties as well as the automatic generation of IoT controllers.
1.Introduction
Guaranteeing sustainability in buildings, transportations, and food industries for the ten billion humans who are expected in the 2080s is one of the greatest challenges of the next years [29]. The present work focuses on buildings, which have a dedicated point in the United Nations (UN) 2030 agenda, i.e., the 11-th, Sustainable Cities and Communities. Such agenda considers among its aims the following target: [11.3] By 2030, enhance inclusive and sustainable urbanization and capacity for participatory, integrated and sustainable human settlement planning and management in all countries [30].
To accomplish these goals, international organizations are rolling out funding ambitious research programs to start public-private research projects which should propose proper technologies. An example is constituted by Pillar II of the European Union (EU)’s Horizon Europe programme, titled “Global Challenges and European Industrial Competitiveness”. The 5-th cluster of such pillar is dedicated to Climate, Energy and Mobility, considering in one of the last calls, the following challenges: Efficient, sustainable and inclusive energy use (explicitly addressed building-oriented topics), Demand response in energy-efficient residential buildings, Renewable-intensive, energy positive homes, and Smarter buildings for better energy performance.
The one of Building Energy Management System (BEMS) represents an emerging and promising set of methodologies, techniques, and technologies to solve the sustainability problems of buildings. BEMS aims to pursue the lowest energy consumption during the building lifecycle: this is an important objective considering the amount of time everyone spends within buildings, and the consequent energy consumption. This importance dramatically grew up during these last years when COVID-19 pandemic reshaped our relationships with houses, schools, offices, and other buildings.
While Building Automation Systems (BASs) can be considered as a building-oriented Supervisory Control And Data Acquisition (SCADA) systems, BEMSs are more similar to energy supervisors and can use BASs to ensure energy sustainability. To build this controlling infrastructure and to take proper decisions on the energy flows inside a building, a dense network of sensors is necessary: Internet Of Things (IoT) is an enabling technology that needs custom devices programmed with ad-hoc software.
One of the challenges this paper addresses, is related to software engineering in BEMSs. As these systems are complex, made of heterogeneous interacting parts, there is a considerable demand for methodologies able to conjugate the traditional engineering processes of the energy industry with the complexity of computer-based sensors and data-driven approaches. Furthermore, to tame the great number of involved sensors, and the dynamism of the possible situations BEMSs could deal with, model-based approaches can summarize the meaningful aspects of the systems into models. Such models are then used to predict in advance the impact of considered counteractions on the real system.
This paper proposes a model-driven methodology to pursue the following objectives:
– to define an energy model for buildings to be dynamically generated and analysed by BEMS;
– to define model transformations from high-level plants of a building to the energy model;
– to generate C code from the model to be uploaded to IoT devices;
– to consider the effects of the data acquired by the system on the model itself.
Model-to-Model (M2M) transformations should be then defined to guarantee the automatic generation of model artifacts from others, while Model-to-Text (M2T) transformations are used to generate code from models. To these aims, the well-known formalisms of Petri Nets (PNs) and their dialects are used. In particular: Fluid Stochastic Petri Nets (FSPNs) are an extension of PNs that can model continuous variables by fluid places [14], Input-Output Place-Transition Petri Nets (IOPTPNs) are instead an extension oriented to embedded systems, supported by a toolset including code generators [13]. The present work combines the unique features of both the PN dialects into a unified methodology oriented to early features evaluation and code generation.
This work constitutes an original extension of an already published work [10]. Regarding the cited paper and to the state of the art, the original contributions of this paper are:
1. the definition of an overall model able to take into account the interactions of users, devices, building structures and energy control logic;
2. the definition of a methodology, applicable during the design phase (by using high-level modelling) as well as during the realization and deployment phase (using code generation techniques);
3. the combination of model-based and data-driven methods to improve the quality of resulting models.
The rest of the paper is organized as follows: Section 2 demonstrates the originality of the paper by reviewing the state-of-the-art; Section 3 presents the approach from a high-level perspective; Section 4 describes the models used in the paper and frames them into the presented approach. Section 5 shows the feasibility of the approach by an example. Section 6 ends the paper, presenting future work and open research challenges.
2.Related work
In this section, both a review of the related scientific papers (in Section 2.1) and some basic information on FSPNs (Section 2.2) are reported.
2.1.Review of the scientific literature
BEMS received significant attention from the scientific community. Authors in [1] made in 2021 a systematic review of the scientific literature on BEMS; this paper detects some functions that are attributed to BEMS: the functions and the relative frequencies are in Table 1.11
Table 1
BEMS function and relative frequencies
| Function | Relative frequency |
| Monitor | 10.53% |
| Estimate | 5.26% |
| Predict | 9.47% |
| Control | 14.74% |
| Manage | 16.84% |
| Analyse | 14.74% |
| Optimize | 9.47% |
From these papers, the authors extract several lessons learned and future research challenges. Among the others, they are worth mentioning: simulation models are useful to monitor and predict energy demand, IoT can be successfully used to collect energy usage, there is a need to enhance the estimation and prediction related BEMS since they have achieved the least energy saving rates with about 10%; control or optimize related ones perform better.
Another interesting perspective on the research on BEMS is reported in [26]. This document is one of the results of the SmartBuilt4EU project22 that surveys several EU-level public funded projects researching on the next-generation BEMS. In addition, SmartBuilt4EU is strongly related to the last developments of the Smart Readiness Indicator (SRI), i.e., a common EU scheme introduced in 2018 in the European Energy Performance of Buildings Directive (EPBD) for rating the smart readiness of buildings [28]. The SRI usually refers to seven “impact criteria” (e.g., Energy Efficiency; Health, Well-Being and Accessibility; Energy Flexibility and Storage) and seven “domains” (e.g., heating, lighting, electricity, electric vehicle charging). According to this document, the projects mainly related to the theme of this paper are:
– BIM2TWIN – Digital twin platform for efficient construction management, related to the construction of a platform for the definition of a Digital Twin (DT) of a smart building (https://bim2twin.eu/);
– BIM4REN – Building Information Modelling based tools & technologies for fast and efficient renovation of residential buildings, which puts the usage of Building Information Modellings (BIMs) at the centre of an approach for the definition of smart buildings (https://bim4ren.eu/);
– EPC4SES – EPC based Digital Building Twins for Smart Energy Systems, where model-based prediction applications are implemented from real data (https://epc4ses.eu/);
– Sim4Blocks – Simulation Supported Real Time Energy Management in Building Blocks, where optimization software prototypes and interfaces for flexible operations of BEMSs are developed and tested (https://sim4blocks.eu/).
As the present paper is centred on the usage of modelling approaches for the evaluation, monitoring and prediction in BEMS, other papers are reviewed, according to their relevance regarding the presented one. Fanti et al. propose a PN model for BEMS control [6]; the model is then improved by proposing a First Order Hybrid Petri Net (FOHPN) model in [7]. In [24], a State Machine (SM) model is proposed for control. PNs are also used to find failures in smart grids [5]. In [21], a simulation conceptual framework is defined to support different above-mentioned phases, from evaluation to analysis. An optimization approach based on soft computing techniques is proposed in [23]. Other papers – considering evolutionary computing techniques in the optimization of energy management in the home and smart grid domains – are [8,33].
Many simulation tools, which analyze energy consumption, have been developed. In [16] the authors describe a framework for the interaction of common home devices and appliances to control and monitor energy consumption. The tool shows the estimated consumption to the customer with the related costs allowing him/her to adopt a better strategy for energy and cost reductions. Choosing an optimal energy consumption policy can also be pursued by transferring this responsibility to a device within a Smart Home. GridLab-D33 and EnergyPlus [31] are two existing tools, which examine the energy consumption with the focus on heat generation and thermal load of a building, considered as the main energy-consuming activity. The Smart Home Simulator introduces the capability to model a smart home configuration, to set the energy workloads and to allow monitoring such home appliances [2].
Other approaches tackled with model-based methods to evaluate energy consumption properties in other hybrid systems: in [22], the authors use PNs in combination with fuzzy logic to model and evaluate the energy profiles of hybrid electric vehicles; the authors in [27] approach to the modelling and the evaluation of prosumer-based microgrids be means of PNs. In both the papers, there is no usage of a PN dialect enabling and easy modelling of hybrid systems while the focus is set on the control.
This review of the scientifically relevant papers confirms the originality of the contributions of the present paper:
– even if some approaches are present in the literature, modelling BEMSs and energy related systems by means of PNs, this paper is original in approaching the problem by (a) tackling with a global model taking into account different elements from users to the building, (b) using a formalism specific for hybrid systems (i.e., FSPNs);
– the existing approaches do not claim to define a model-driven methodology supporting since the early phases and all along a system lifecycle;
– there is a general separation in the literature between model-based and data-driven approaches while this paper introduces some elements linking these aspects together.
2.2.The FSPN formalism
FSPNs are a type of mathematical formalism used to represent and analyse systems that involve concurrent processes and the flow of fluid resources. It is an extension of the traditional PNs, mainly used for discrete event systems. In a PN, the basic elements are places, which represent resources or states, and transitions, which represent processes or events that consume or produce resources. The flow of resources between places is represented by arcs, which connect the places to transitions. In addition to these elements, the FSPN formalism also includes fluid places, used to model continuous variables, and fluid arcs, used to change such quantities continuously in time.
FSPNs can be used to understand how a system behaves under different conditions and to identify bottlenecks or other issues that may impact the performance of the system also in the presence of random or probabilistic behaviour. Transitions in FSPNs are associated with probability distributions, which describe the likelihood of a transition occurring at a given time. This allows for the modelling of systems with uncertain or unpredictable behaviour, such as those involving queues or delays. The presence of fluid places and arcs allows FSPNs to model hybrid systems with both discrete and continuous variables in a more natural way with respect to simpler formalisms as PNs and Markov Chains (MCs).
3.The proposed approach
This section aims at presenting the overall approach. The objective is pursued first by defining a reference architecture taken from the literature and enriching it with original elements (see Section 3.1). Then, in Section 3.2, it is suggested how the latter architecture can impact the development of the software of the BEMS.
3.1.A BEMS reference architecture
This subsection wants to summarize the main contributions present in the literature through a BEMS reference software architecture. This architecture is a synthesis, made in this paper, on the base of the Building Energy Management Open Source Software (BEMOSS) initiative, described in [18]. The architecture is depicted in Fig. 1.
Fig. 1.
A BEMS reference architecture.
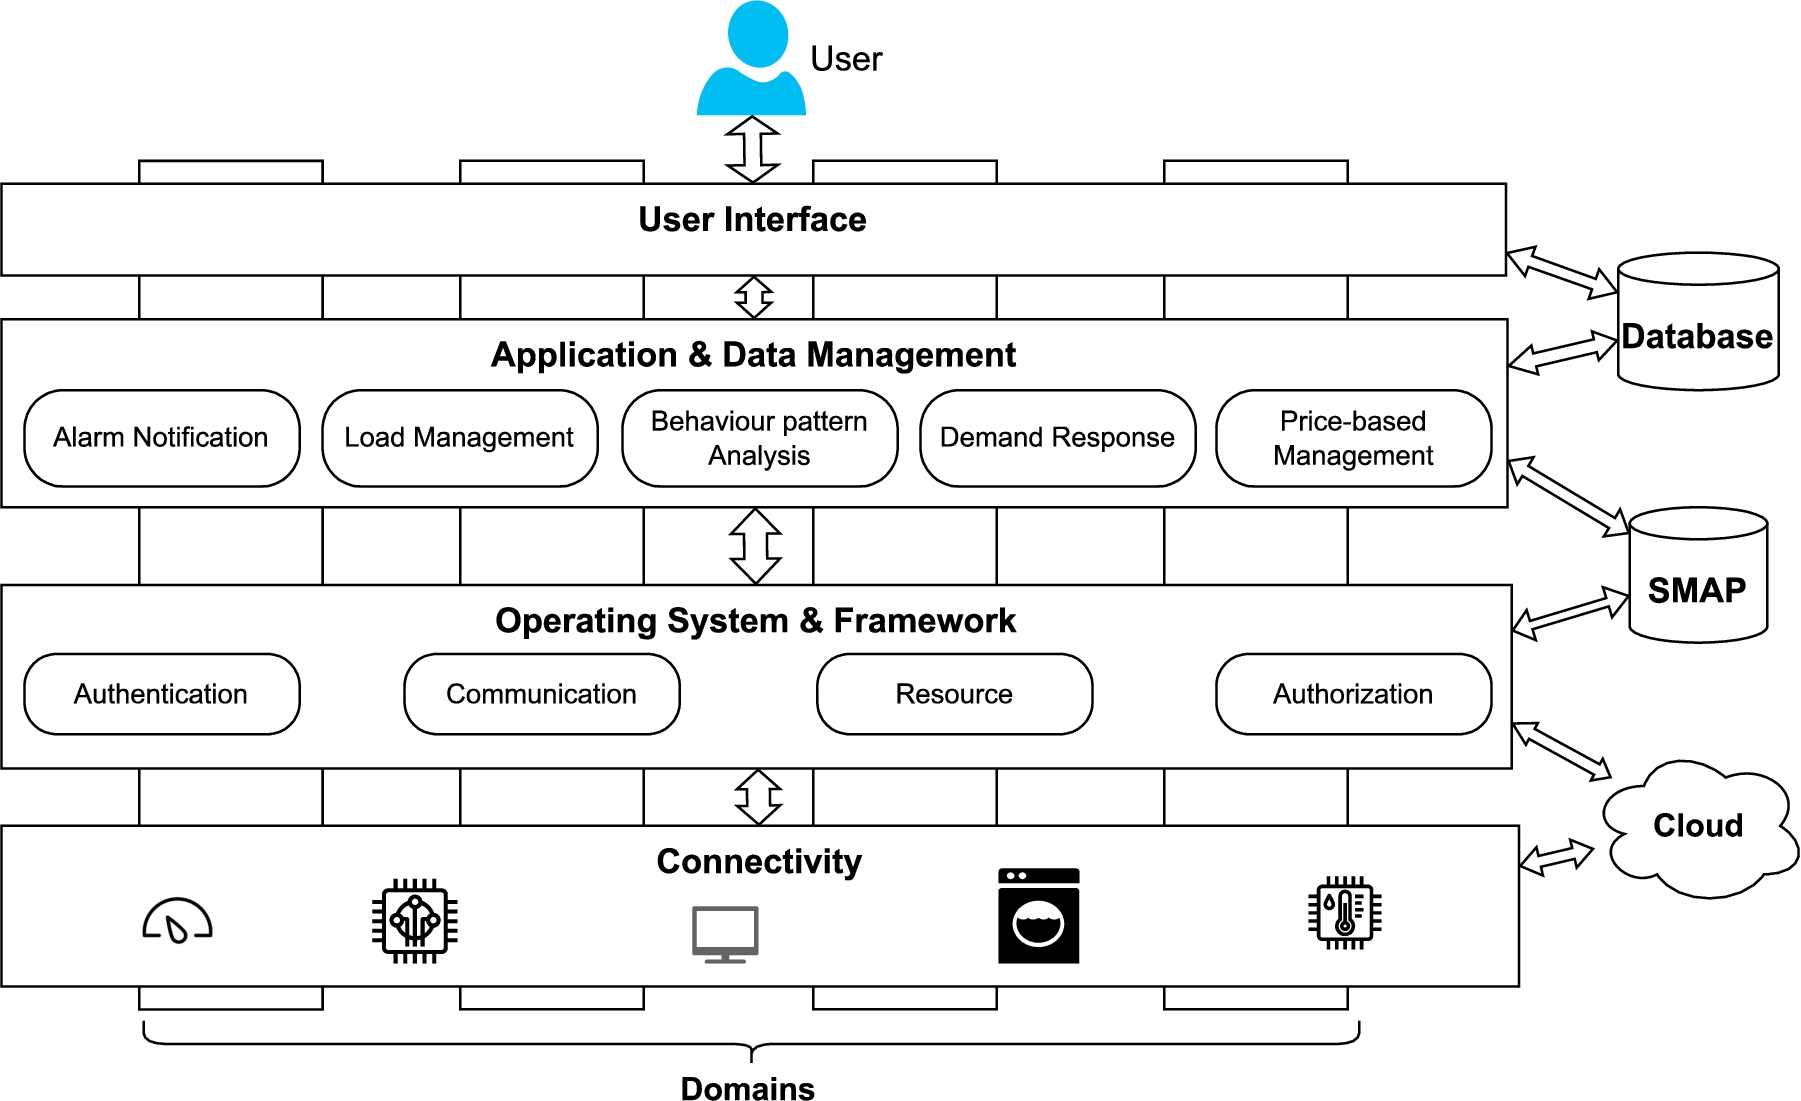
The architecture considers four layers: User Interface, Application & Data Management, Operating System & Framework, and Connectivity layer communication with each other directly and through shared databases. Some functions provided by these layers are: Alarm Notification, Load Management, Price-based Management, Authentication, Resource Management, etc. About shared data, there are: (1) a Database, containing user-level information as User profile, Device UI Device Information, etc.; (2) a Time Series Repository (SMAP) containing time series of monitored variables, e.g., temperature, real-time pricing, etc; (3) cloud-related sources of data, e.g., weather forecasting, energy prices, etc. All the layers and the provided functions work in different domains, e.g., heating, lighting, electricity, and electric vehicle charging.
For simplicity, this paper focuses on Price-based Management: this notwithstanding, BEMS-related function may be not the only one involved in the process. As a consequence of this hypothesis, Price-based Management leads the System Designer to the workflow, as it is described in Section 3.2. Other scenarios are possible, according to the specific index chosen to match/optimize: a further discussion is reported in Section 6.
On the base of this reference architecture, Fig. 2 depicts the proposed approach considering actors and high-level artefacts.
Fig. 2.
A model-driven BEMS architecture.
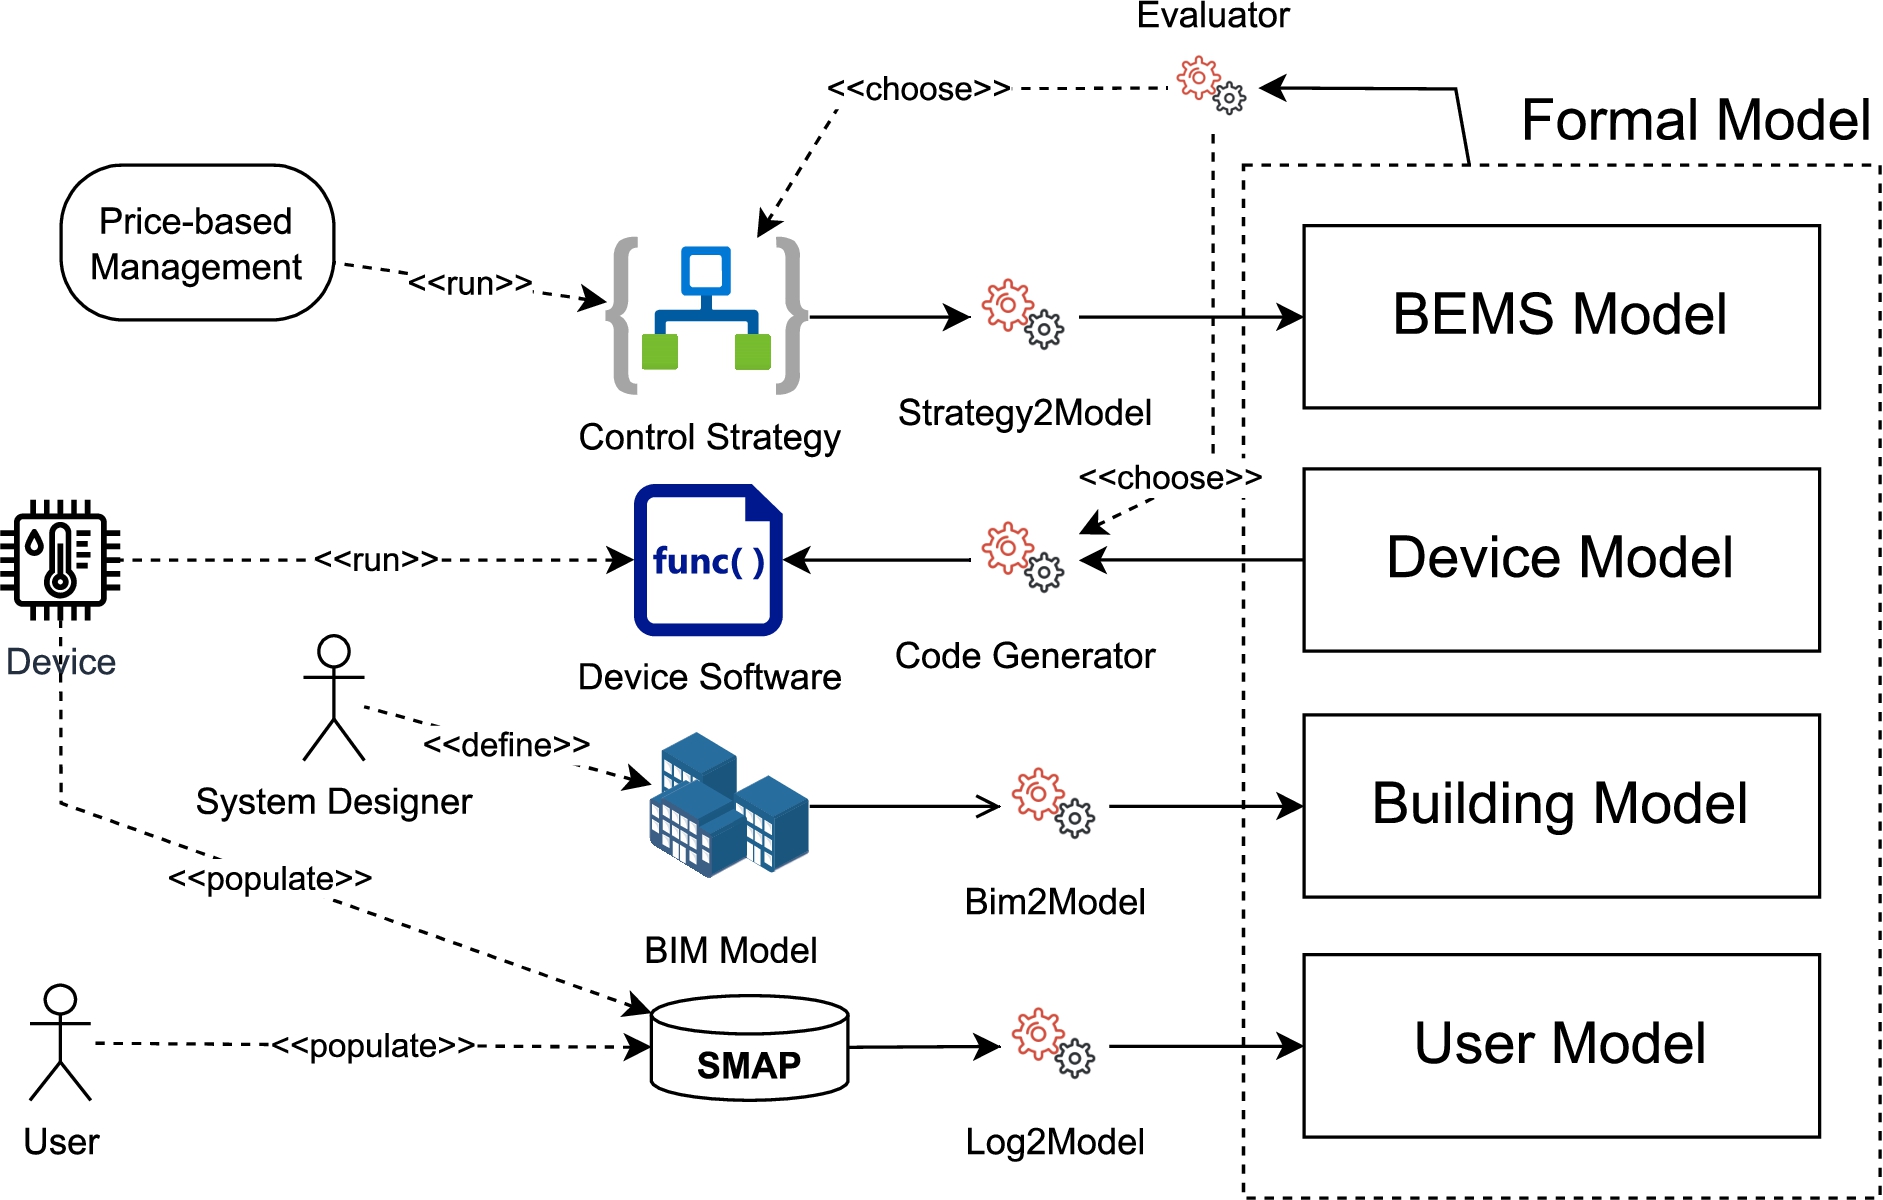
The actors are: the Price-based Management function of the BEMS; the Device, which continuously senses the variables to monitor, both physical (e.g., energy consumption, temperature), and immaterial (e.g., energy price); the User, who lives/works in the building; and the System Designer, who has the objective of building a BEMS respecting the required features. For what concerns the high-level artefacts, they are: the Control Strategy, which is the business rule determining how the involved function (Price-based Management, in this case) reacts to the changes in both the usage of the building and in the market conditions; the Device Software, controlling the logic of sensing and communication from the device to the upper layers of the BEMS; the BIM model, describing not only the physical structure of the rooms of the buildings, but also the locations of the sensing devices and the actuators (e.g., Heating, Ventilation and Air Conditioning (HVAC) pumps); the SMAP repository, containing both the data concerning the user (i.e., the User Profile) and the variable evolution series, captured by the sensing devices. Furthermore, the approach introduced in this paper, adds some original elements.
Formal Models: | there are four different PNs models in this approach. The User Model represents the behaviour of the user and the habits reflected not only by his/her preferences but also by the usage patterns of building appliances and facilities (i.e., the charging habit of the electrical vehicle and/or simply his/her presence in the building during the winter period). The Building Model represents the actual consumption of energy of the entire building/house and/or other meaningful variables (the amount of spent money, the temperature of the rooms, etc.). The Device Model, representing in PNs the acquisition and communication logic of the devices (i.e., how many samples per hour and if there is some alarm threshold on the monitored variable). The BEMS model, summarizing the contributions of all the above-mentioned models and describing in PN the control (price-based) strategy enacted by the BEMS. |
Bim2Model: | this tool is responsible of transforming the BIM model into the PN Building Model. Some details on this mapping are provided in Section 4.2. |
Log2Model: | this tool takes in input the log of the usage information of the considered devices from the SMAP dataset and generates from this the PN User Model, representing the user behaviour. To this aim, the model is updated with actual information coming from the field. Details are in Section 4.1. |
Strategy2Model: | this tool translates the high-level control strategy adopted by the involved BEMS functions into the PN BEMS Model. The details of the translation are given in Section 4.4. |
Evaluator: | since the models have the objective to quantitatively evaluate the fulfilment of the non-functional requirements (e.g., on cost saving, energy consumption, user comfort) and/or to optimize the algorithms’ parameters according to the considered indices, a quantitative evaluation of the composed model is necessary. External existing tools are available according to the specific PN dialects that are chosen; the solution techniques and the solvers are discussed in Section 4. |
Code Generator: | this tool takes the control logic of the device, tuned after the evaluation phase, and generates from this the source code of the software to run on the device. Details are in Section 4.3. |
3.2.The software life-cycle
In the framework of the above proposed approach, a design and development methodology is also suggested, giving to the software engineer a practical tool for running the proposed methods. The reader should consider that these activities are not strictly conducted during the design phase, drawing a separating line between a system’s design and operation phase. This approach should be seen as a tool operating inside a broader evolutionary software approach where software could be subject to modifications and improvements during the system operations. More in the detail, such workflows can be described from three different perspectives:
– System Designer:
1. he/she is responsible for providing a BIM model;
2. the designer chooses some initial User Profile as well as Control Strategy, and Device Logic;
3. starting from these four different artefacts, the designer transforms them into the four parts of the Formal Model;
4. an evaluation/optimization phase is run by the designer to find the fitting/the best solution regarding final requirements;
5. once this phase is completed, a proper Control Strategy and a device logic are chosen. The logic is automatically translated into C code to run on the device (the Device Software).
– User/Device:
6. once the building is ready for living in, the User uses available appliances populating the SMAP repository;
7. the sensing devices, by executing the code generated in the previous iteration, populates SMAP. The SMAP is populated with time series describing the monitored variables.
– BEMS functions:
8. periodically, the BEMS re-evaluates the selected control strategy by selecting a new one and restarting the process from point 3.
4.Technical details
This section is devoted to showing specific model structures and enabling techniques to build the tools defined in Section 3. The specific language chosen to represent such models is the FSPN formalism, due to its ability to manage discrete and continuous variables in the same graphical way.
Another important working hypothesis is made on the considered BEMS domain. For the simplicity, this paper focuses on HVAC. Due to this choice, temperature is a sensitive variable for this model. In other cases, more complex variables could be monitored as the basis of the calculation of the comfort indices – e.g., charging time in the electric car charging processes.
4.1.User model
Before discussing the generation of the User Model from the data contained in the SMAP, let us make some consideration on the data. According to our proposed architecture, as well as to the reference architecture of BEMOSS reported in Section 3.1, both sensing devices and user activities populate the database. The first set of actors dumps in the dataset the events related to the activation of the electrical appliances in the building (HVAC equipment in this case). The second set of actors (i.e., the users) injects in the SMAP the events related to the presence of people in the physical facilities. An excerpt of such event logs is reported in Listing 1. Valuable fields of the log are: the timestamp, the kind of the event, the itemId that identifies the involved item (e.g., room, lightbulb, HVAC device), the measure of the involved variable, and the id of the actor producing the log entry (the caseId).
Listing 1.
Example of the SMAP event log.
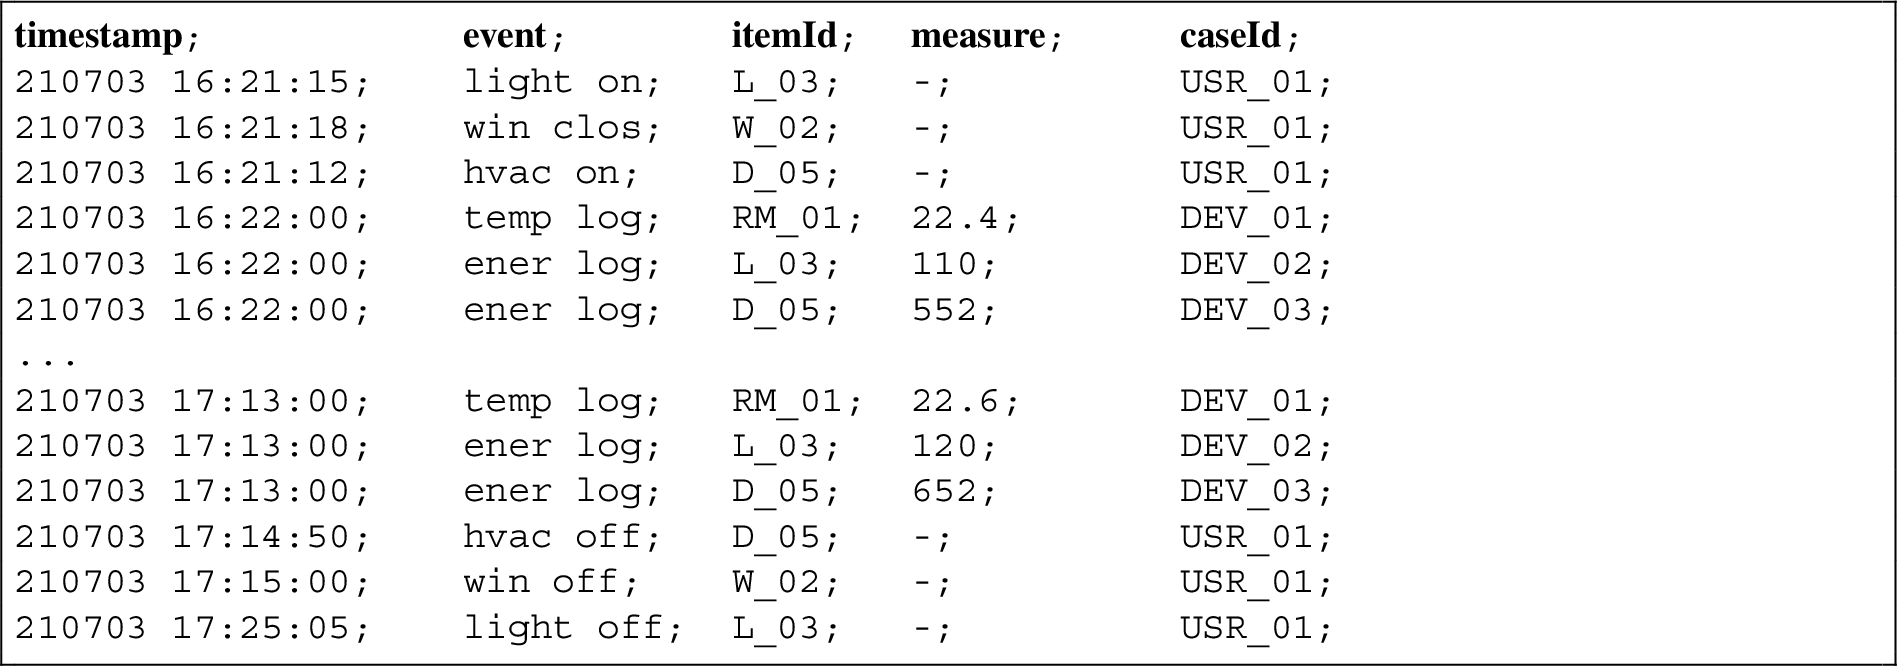
Fig. 3.
User model (from alpha miner).
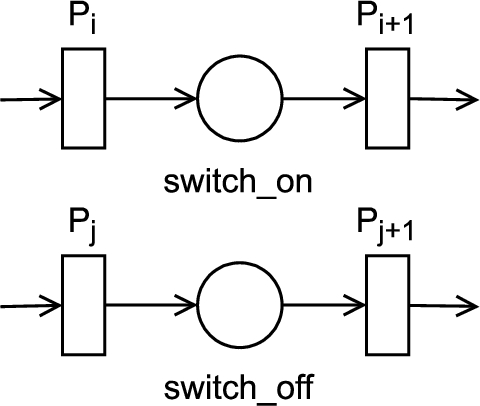
Fig. 4.
User model (refined).
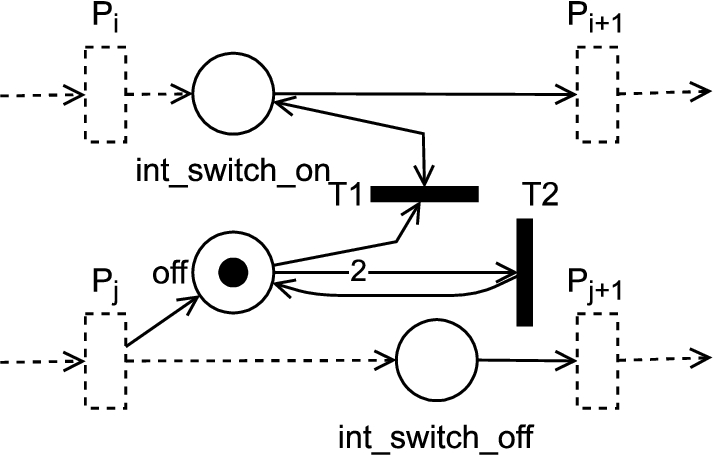
The generation of the User Model from the logs contained in the SMAP is made by exploiting the well-known technique of the Process Mining (PM) [32]. PM has demonstrated in more than a decade to be a versatile, mathematically well-founded, and industry-mature body of knowledge, techniques, and tools for the extraction of a business process from event data. Among the PM algorithms proposed in the literature, the Prime Miner algorithm has been chosen in this paper [3]. This algorithm is an evolution of the well-known Alpha Miner, overcoming some limitations and generating a more compact model. The Prime Miner generates a PN model where the events are transformed into transitions; Fig. 3 represents a generic situation present in the extracted model.
By analysing the event log, the Alpha Miner algorithm detects, as an example, the presence of two threads, one switching on an electrical appliance (i.e.,
A brief discussion about the capture and the generation of the SMAP dataset is due: in PM approaches, the presence of a caseId is needed to group together events that refer to a single system usage. In the considered architecture, it is easy to suppose that devices are easy to be identified; as regards the users, it is reasonable to suppose that many interactions may be done intermediated by some sort of smart devices (e.g., a simple application running on a smartphone), allowing the users in interacting with the building in a simplified and secure way. On the other hand, the authors are aware that the application of PM in Cyber-Physical Systems (CPSs) can be affected by unavailability or by the partial availability of interaction session identifiers [34]. In this case, one of the most widespread techniques is the application of methods able to label with a proper value of caseId those events where such information is not present [9].
4.2.Building model
The Building Model is generated by the Bim2Model tool on the basis of the information and the data contained in the BIM Model. The aim of the building model is to make explicit the relationships between the significant monitored variables according to the physical environment. An example, related to the HVAC domain, is constituted by the changes in the temperature of a room according to the natural ventilation, the shape of the room, the temperature of the adjacent rooms, and all the other impacting causes. The details of the transformation are not formalized in this paper, while Fig. 5 summarizes the mapping between BIM constructs and the FSPN elements.
Fig. 5.
The BIM model to building model mapping.
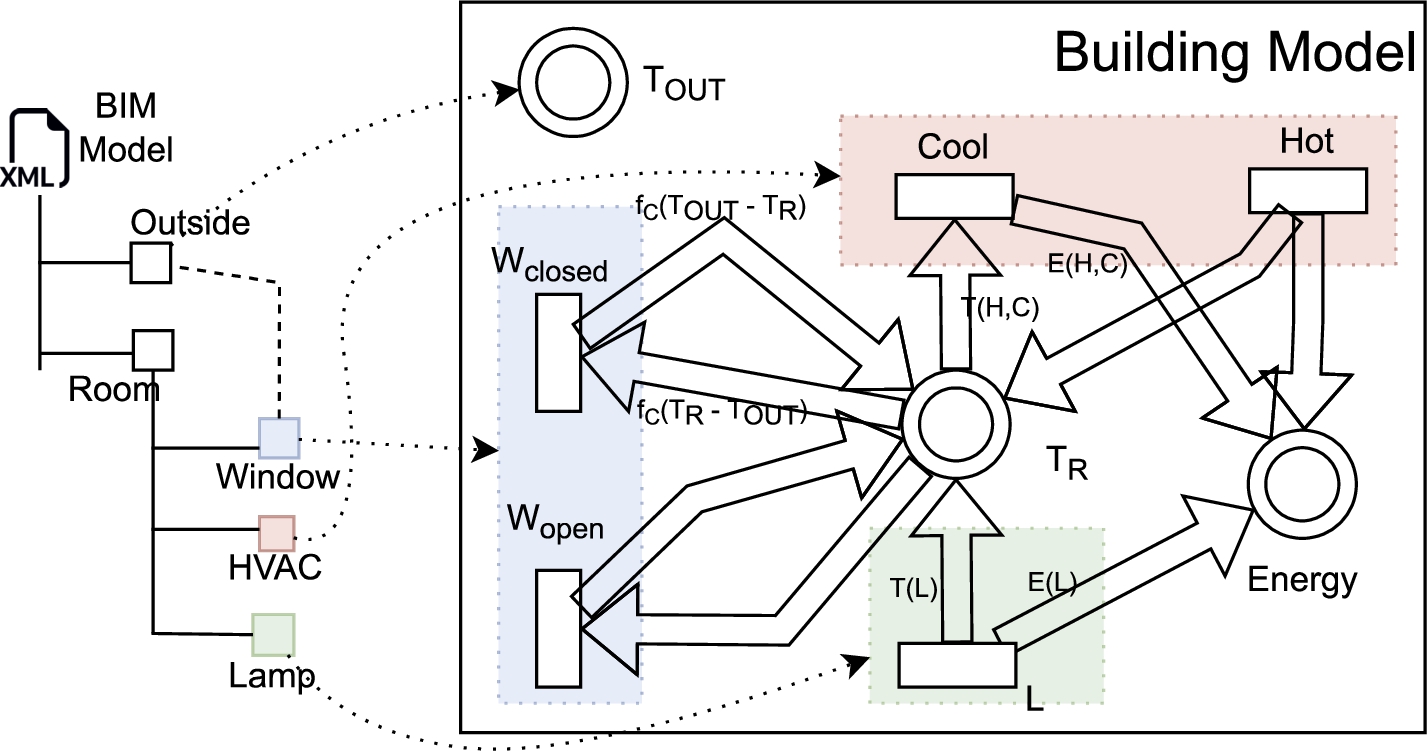
On the left of the figure, an example tree of a BIM Model, represented by a high-level view of a eXtensible Markup Language (XML) tree: the model represents a flat, having a room connected to the outside by a window. In
– The Window is translated into a pair of transitions:
Such function computes the temperature transferred in the time unit according to the difference of the temperatures of the two rooms. In particular, when– The Lamp generates one transition (L), related to both the effects that the lamp has on the energy and the temperature in the room.
– The HVAC equipment produces the most complex effects since, when on, such equipment can be set in different modes (for the sake of simplicity, we consider just two different modes: cool and hot), each of those having both energy and thermal effects. In the
Even if the presented mapping is very simple, it summarizes the main possible cases. Of course, other physical variables could be added according to the national regulations and user preferences. It seems possible that the same reasoning could be applied to variables as humidity, air pollution, presence of specific substances as
4.3.Device model
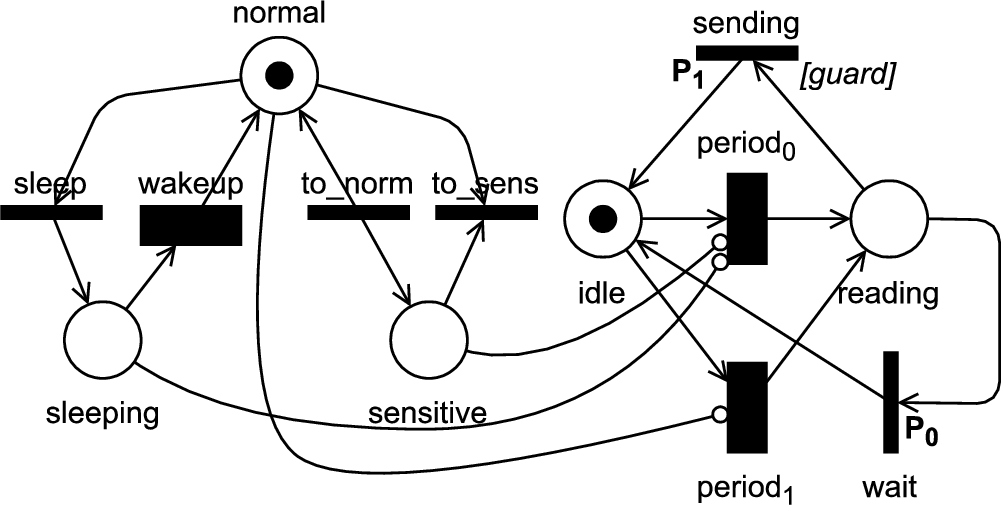
Regarding the Device Model, let us start from the general sensing-computation-communication pattern that characterizes IoT devices [36]. To this aim, we can imagine a library of possible behaviours that could be adapted to the different specific sensor architectures. Figure 6 and Fig. 7 reports two of these behaviours.
Fig. 6.
Device model (basic).
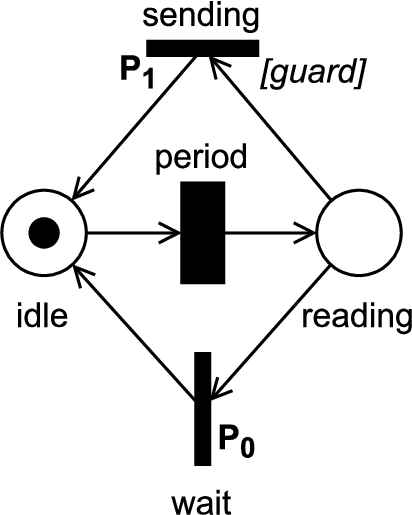
Fig. 7.
Device model (advanced).
More in the details, the PN model in Fig. 6 reports the very basic schema of a device in
For clarity, the models here reported are expressed in the FSPN formalism. To be more precise, the approach considers IOPTPNs and their supporting tools, which explicitly address input-output mechanisms and code generation procedures. The schemes present in the library also consider the transformation of such models into IOPTPN models and the, the generation of source code. Details on the formalisms, the generation techniques and toolsets are in [13].
4.4.BEMS model
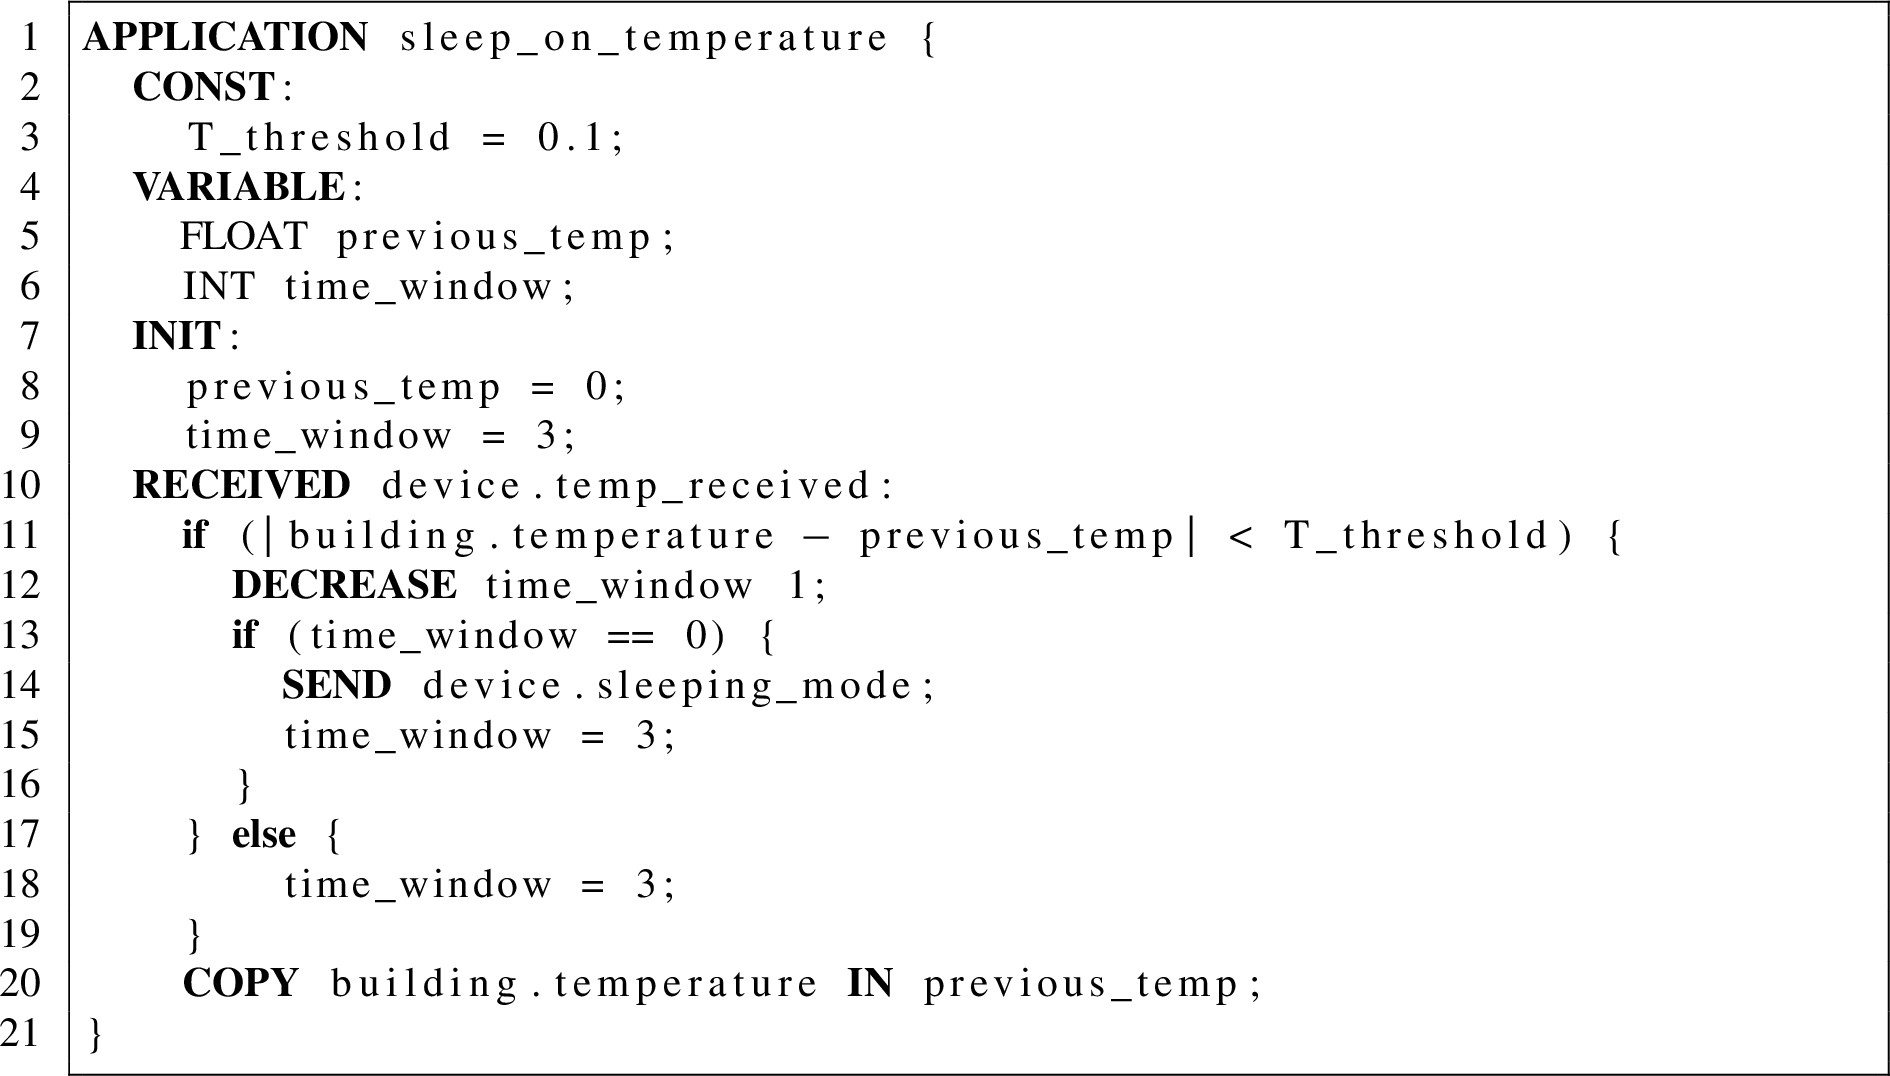
The process of generating a FSPN model from the Control Logic starts from describing the adopted formalism to express such a program. In this paper, as in [10], we adopt a pseudo language – named Smart Meter Programming Language (SMPL) – originally used to describe control logic of Smart Meter (SMt). In the cited paper, the generation of a FSPN model from a SMPL program is automated by the smpl2fspn M2M.
In this paper, we extend SMPL to adapt it to the different scenario here considered. In [10], SMPL just considered classical control applications, structured as infinite loops; in this paper, as sensors/device models are structured according to such a paradigm (see Section 4.3), we consider an
Listing 2.
Example of SMPL program
![Generated FSPN model [10].](https://content.iospress.com:443/media/ais/2023/15-3/ais-15-3-ais230065/ais-15-ais230065-g010.jpg)
A control logic expressed in SMPL is structured in this way:
– the
– the
– the
– the
Some possible instructions that can be used in both the
The translations in FSPN snippets of some constructs used in this example are already considered in [10]. However, Fig. 8 reports the FSPN model generated by the example just described.
Table 2
From SMPL constructs to FSPN subnets
| FSPN block | SMPL lines of code | Comment |
| A | 11, 17, 19 | The IF-ELSE construct is translated by the well-known choice PN pattern with two transitions enabled by guards that are one the negation of the other. |
| B | 12 | The immediate transition of the block drains a token from the |
| C | 15 | When a token is put in the place of the block, the transition with the higher priority ( |
| D | 18 | See block C. |
| E | 13, 16 | See block A. |
| F | 14 | Sending a message means to let the transition of the block fires. |
| G | 20 | Since the original content of previous_temp could be higher or lower than the new value to copy contained in |
4.5.Model structuring and evaluation
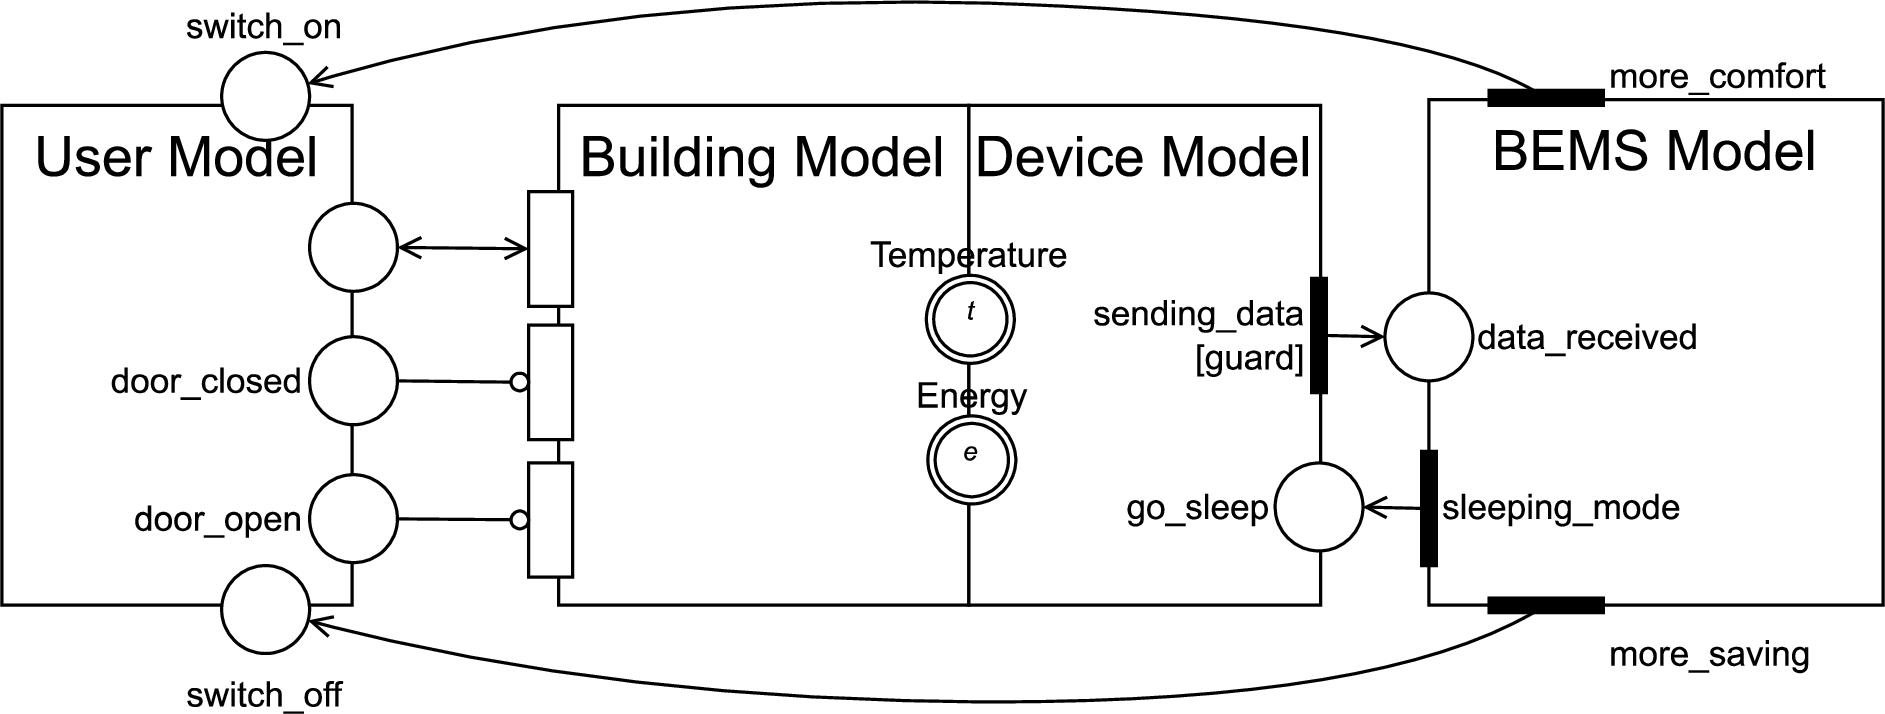
Figure 9 reports further details on the four PN models, in particular their interactions among each other.
The PN structuring problem has been exhaustively studied in the literature: in this paper, we use the results of many of such studies, which are summarized and classified in [12]. There are two used PN structuring mechanisms: place/transition superposition, where two or more places (or transitions) are shared among different submodels [4], and message-passing invocation, obtained by adding arcs from transitions in a submodel to places into another submodel. More specifically, the following interactions are present.
– From User Model to Building Model: a variant of message-passing invocation with inhibitor arcs is present; this variant is studied and reported in a recent paper [35]. In this scenario, the User Model has some places whose markings enable/disable some transition in the Building Model: this is the case of a door state – which is an action related to the user behaviour – that affects the thermal contribution the door gives to the room. A similar situation is related to the enabling (input/output arcs) from a place of the User model to a transition of the Building Model).
– From Building Model to Device Model: the PN models of the Device Models read the environmental monitored variables; in this case, the place superposition mechanism in adopted on the fluid places related to such variables.
– From Device Model to BEMS Model: in this case, the asynchronous message passing mechanism is considered as the one reported in Sibertin-Blanc’s cooperative networks [25]. The Device Model plays as a message sender on the firing of specific transitions (i.e., sending_data in the example), on the other side, the BEMS model has a place where the presence of a token represents that a message has been sent and, hence, it can be used to further computation (the place in the example is data_received).
– From BEMS Model to Device/User Model: these two cases report the same kind of interactions of the previous case (message passing mechanism).
For what concerns the evaluation of the composed FSPN model, the complexity of the model itself – in particular, the presence of more than one fluid place – does not allow the application of analytical exact solution algorithms, as they are reported in [14]. The only way to solve the model is by using simulation-based algorithms, as described in [15].
Fig. 9.
The formal model overall structure.
5.A sample application
To show the capabilities of the proposed approach, the presentation of a small case study is here reported. To achieve this objective, some comparisons are made between the results of simulation runs. The comparisons considers both the energy consumption and the temperature profile. Three main situations are considered:
1. evaluating the effectiveness of an automated smart control by comparing it with the case of no control;
2. evaluating the effect of the different seasons and climate conditions on the effectiveness of a control logic (simulating them in winter and in summer);
3. using the approach to tune some parameter values by means of sensitivity analysis.
Before discussing of the simulation runs, four different artifacts are supposed to be available for this illustrative case.
– The BIM Model, here simplified by the floor plan in Fig. 10: this schema considers the example of a small office where two adjacent rooms communicate by
Table 3 defines energy/thermic related parameters of the considered equipment/structure.
Fig. 10.
The case study floor plan.
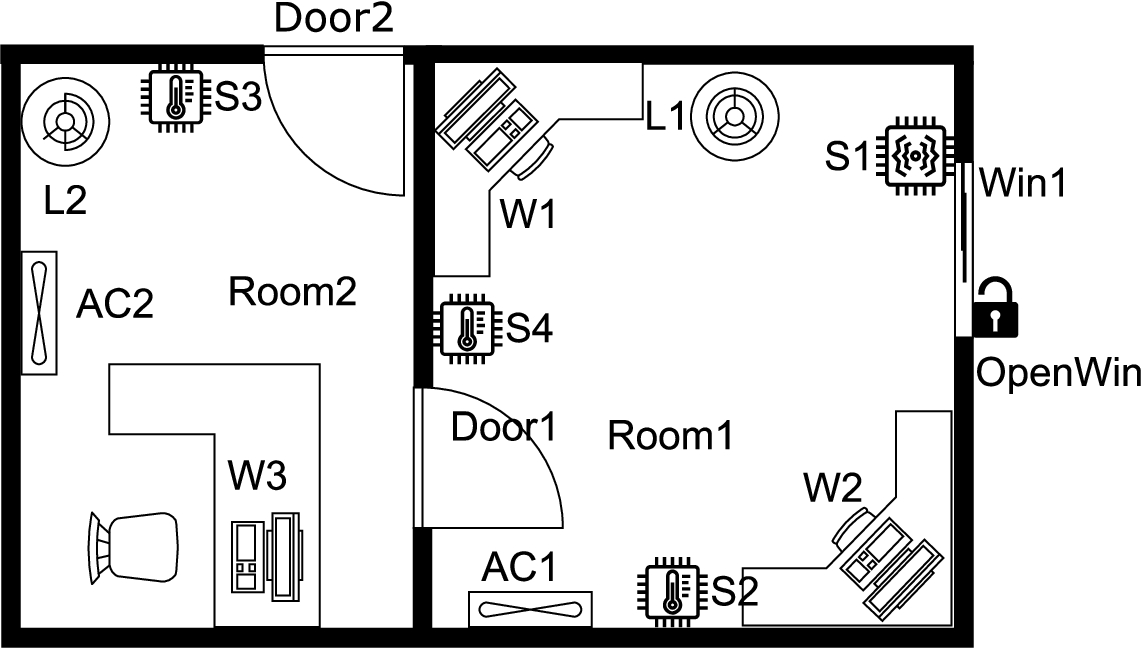
Table 3
Proposed example building parameters
Parameter Description Value Transmittance coefficient of an open window 5 W/m2/K Transmittance coefficient of a closed window 0.5 W/m2/K Transmittance coefficient of an open door 5 W/m2/K Transmittance coefficient of a closed door 0.5 W/m2/K Absorbed power of a workstation 100 W Added temperature of a switched on workstation 0.05 K Absorbed power of a LED lamp 200 W Added temperature of a switched on LED lamp 0.1 K A Area of a window 1 m2 – The example SMAP repository is not reported in an extended way; however, we consider two users interacting with the building objects. This interaction is ruled by a set of parameters that are reported in Table 4.
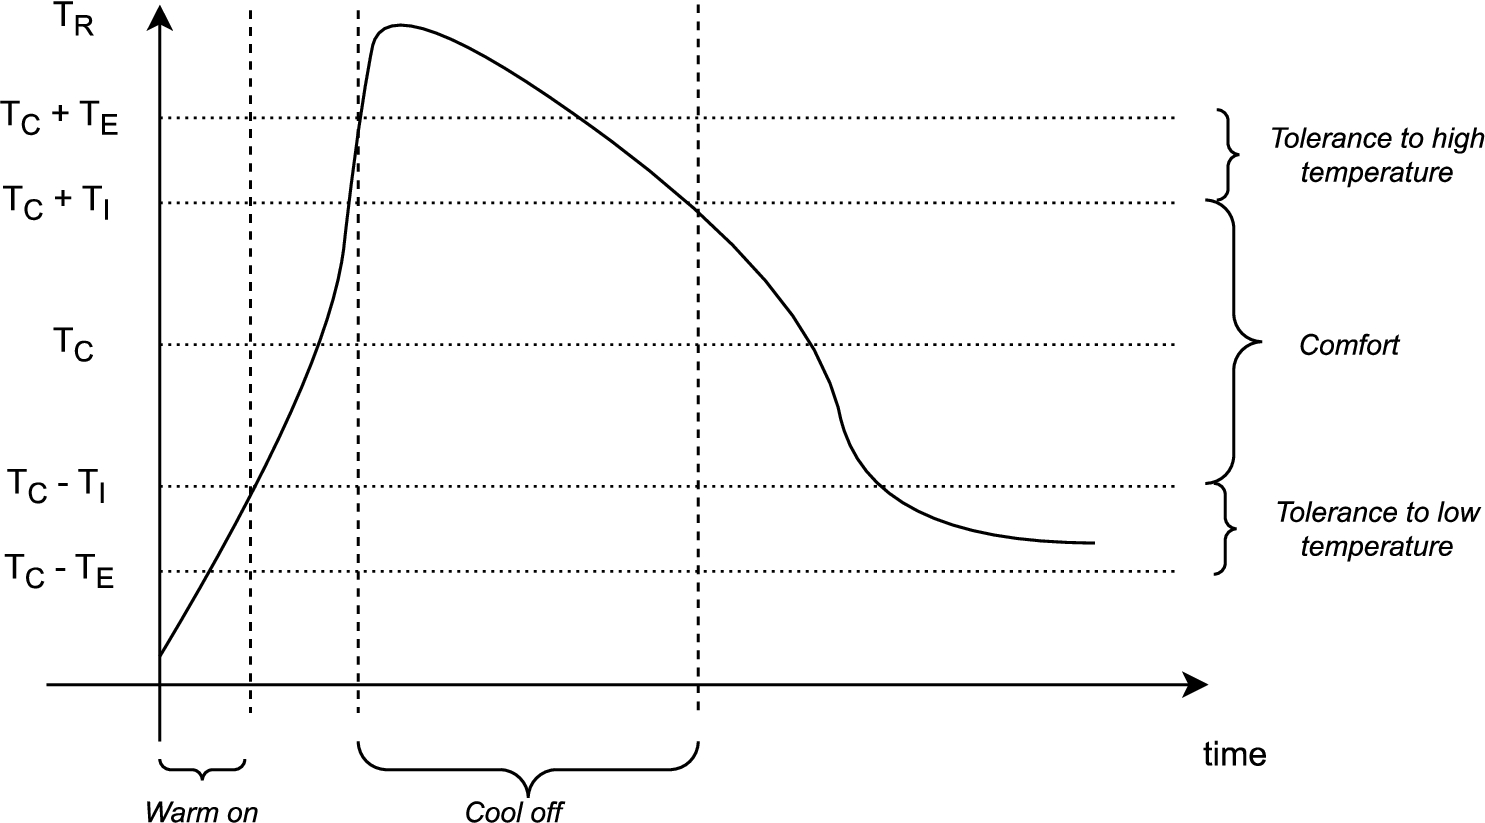
The first six parameters represent times and are expressed in hours. The three last parameters capture the thresholds of the temperature that a mean user uses to guarantee him/her comfort. The activation/deactivation of a HVAC is governed by the following rules. Given
These rules are also explained by the sample plot reported in Fig. 11. The plot represents on the x-axis time and on the y-axis∗ an HVAC is used to warm on the room if
∗ an HVAC is switched off from warming if
∗ an HVAC is used to cool off the room if
∗ an HVAC is switched off from cooling if
Table 4
Proposed example user parameters
Parameter Description Value Changeroom Mean time to enter/exit in a room 2 hr Opening Mean interval between an opening/closing event of a door or a window 0.5 hr Lighton Mean time to switch on a lamp 0.5 hr Lightoff Mean time to switch off a lamp 2 hr Workon Mean time to switch on a workstation 0.1 hr Workoff Mean time to switch off a workstation 1 hr Comfort temperature 21°C Temperature defining the upper/lower bound of the comfort zone 3°C Temperature defining the upper/lower bound of the tolerance zones 7°C Fig. 11.
Plot describing the activation/deactivation pattern of HVAC.
– The model of the sensing behaviour of the sensing devices. The models considered are related to the simplest of the two cases presented (i.e., the model in Fig. 6). Table 5 reports the considered parameters and their values (expressed in hours).
Table 5
Proposed example device parameters
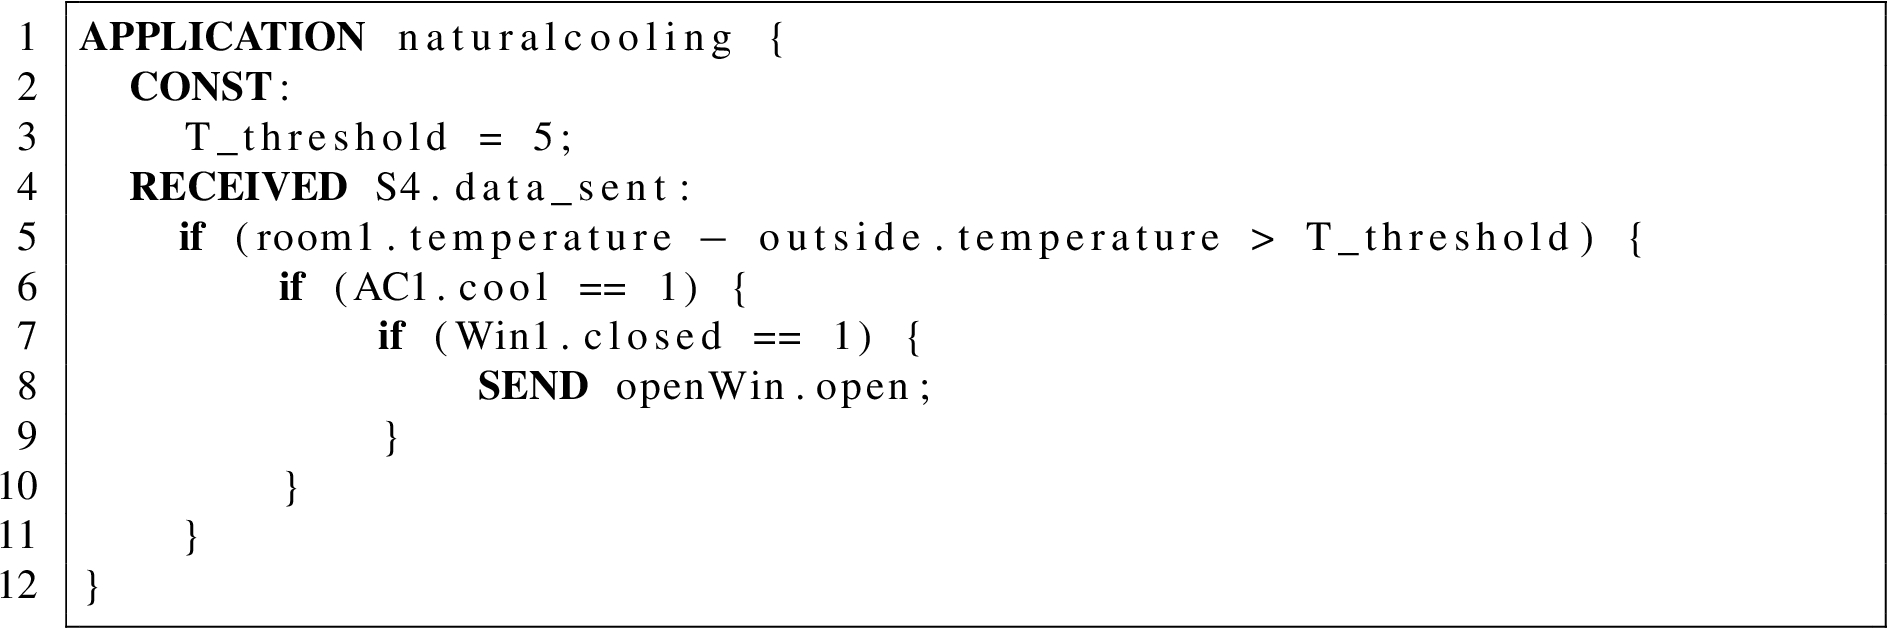
Parameter Description Value Sample period of 0.0016 hr Sample period of 0.083 hr Sample period of 0.16 hr Sample period of 0.16 hr – The Control Logic describes the case of a procedure blocking the cooling
Listing 3.
Control logic of the case study
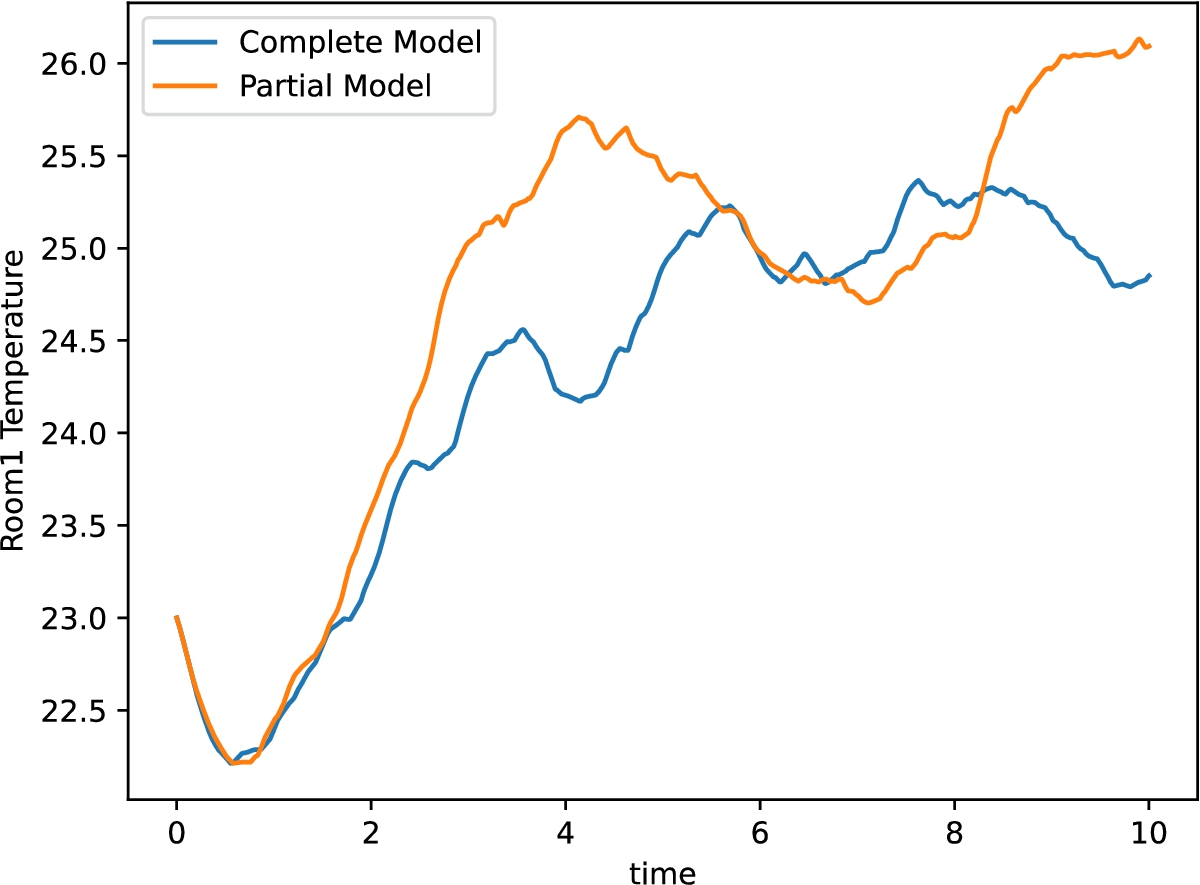
To achieve the aim of this section, two different variants of the model are considered: the Complete Model and the Partial Model.
The Complete Model is constituted by all the four modules previously described. By applying the described methodology, an overall FSPN model is generated, and implemented according to the tool described in [14]. The model counts 36 places, 66 transitions, 201 arcs. To this aim, it is not graphically represented: the whole model as well as the replication package for the reported simulations are at https://github.com/stefanomarrone/bems-evaluation. The Partial Model is obtained starting from the Complete Model and deleting the BEMS model module and it represents the case of the absence of an energy controller in the building.
The comparison between the two models is necessary to fulfil the first objective of this section (i.e., evaluating the impact of the presence of a smart control logic). This evaluation is made in two different operative scenarios, built to fulfil the second objective: the winter and summer scenarios. Both the mean values of the temperature in
All the simulations are executed on a laptop equipped with an eight-core Intel® Core™ i7-8565U CPU @ 1.80 GHz with 16 MB of memory. The following simulation parameters are chosen: the simulated time is 10 hours, the time step of the simulation time is about 3 seconds, the number of simulations per experiment is 50, and the confidence level is 0.1.
Simulation during winter The experiment is run with the initial temperature conditions of
Fig. 12.
Consumed energy (winter scenario).
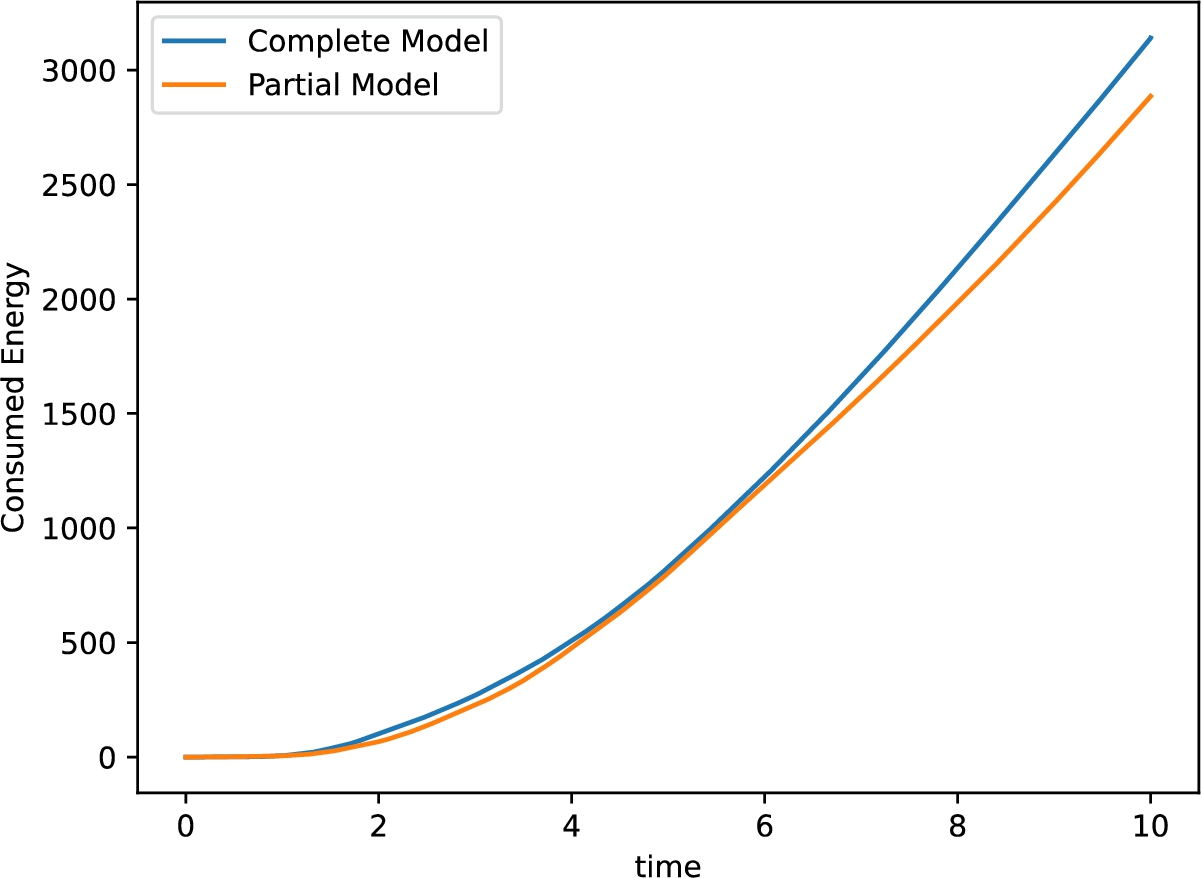
Fig. 13.
Temperature of
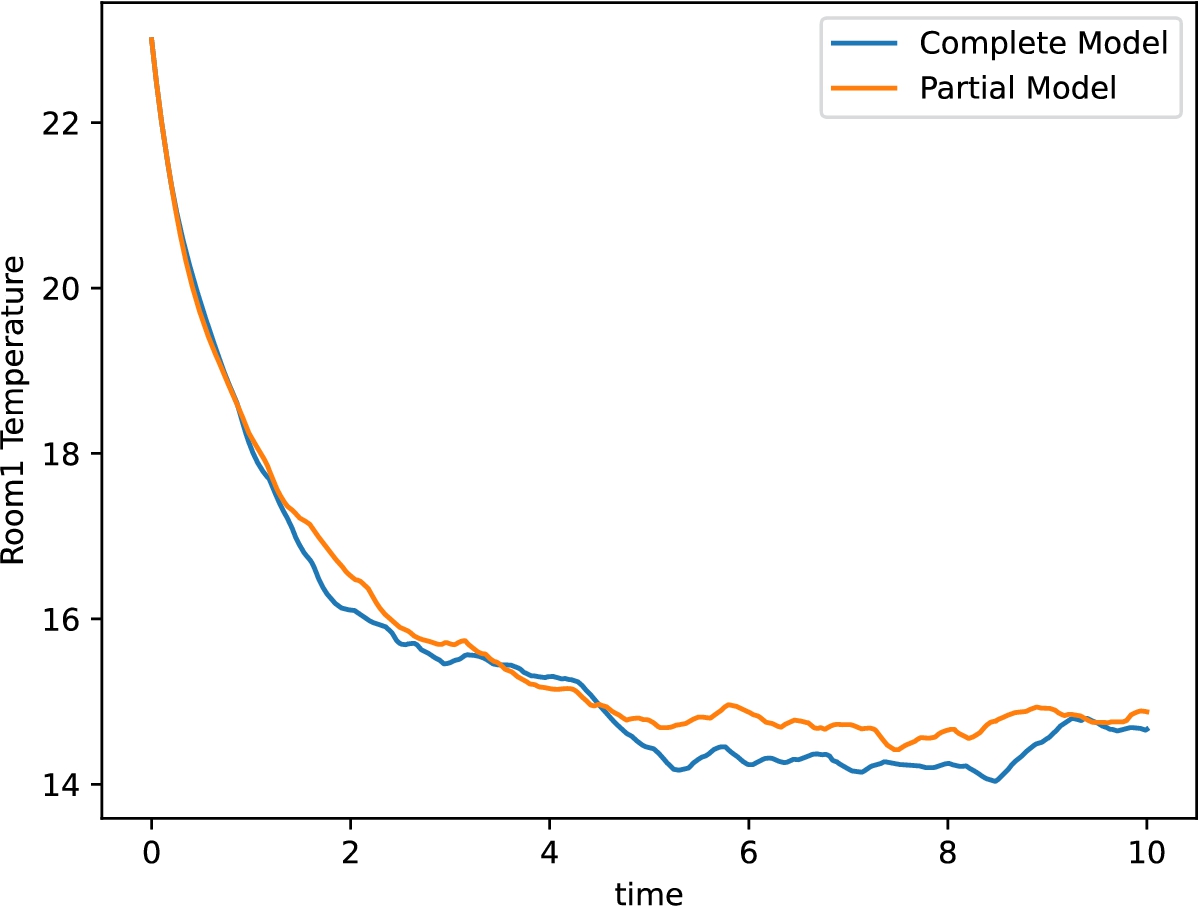
In this case, the simulation reveals that, while the two configurations reach the same level of comfort, there is no advantage of using the Complete Model. This is caused by the fact that we are operating in winter when the cooling of the room is helped by the low environmental temperature.
Simulation during summer In this scenario, the temperature of the outside is set to 30°C. Figure 14 and Fig. 15 respectively report the graphical behaviour of consumed energy and the temperature of
Fig. 14.
Consumed energy (summer scenario).
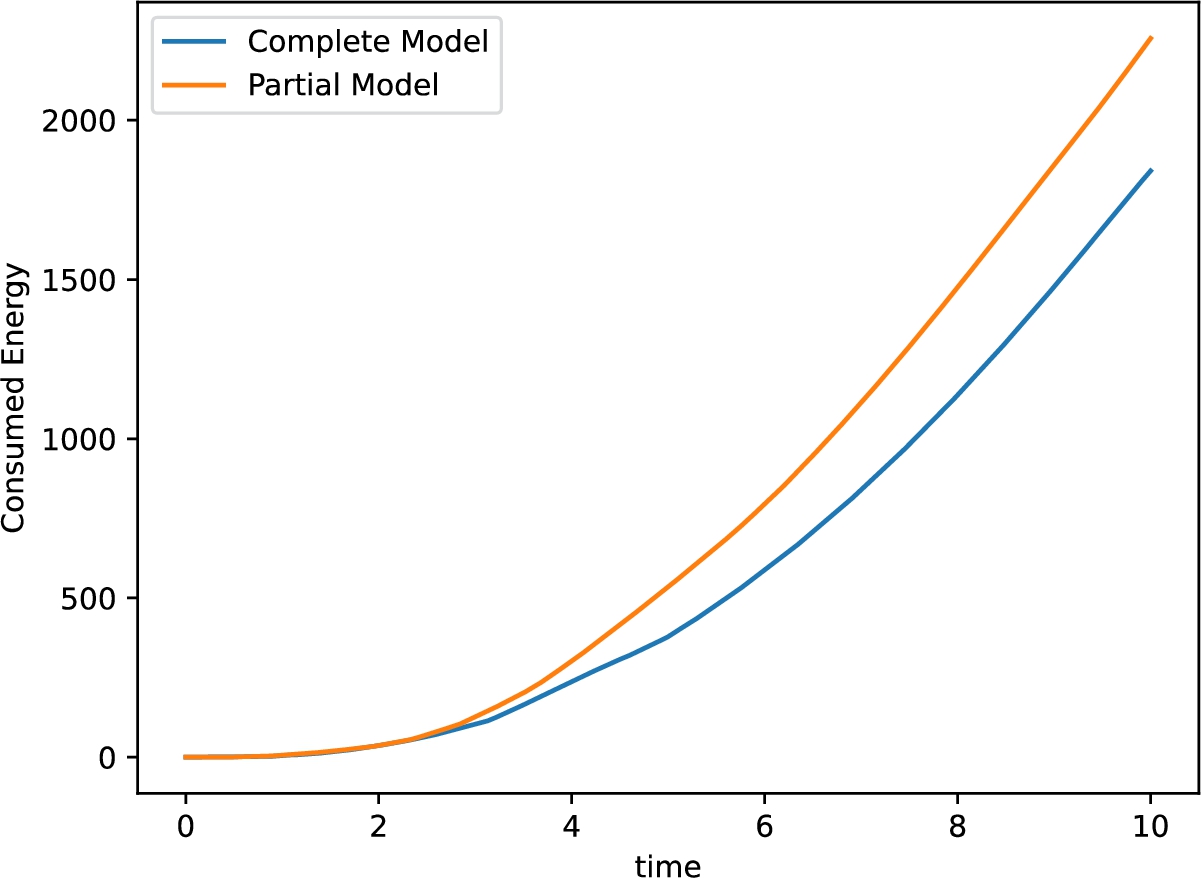
Fig. 15.
Temperature of
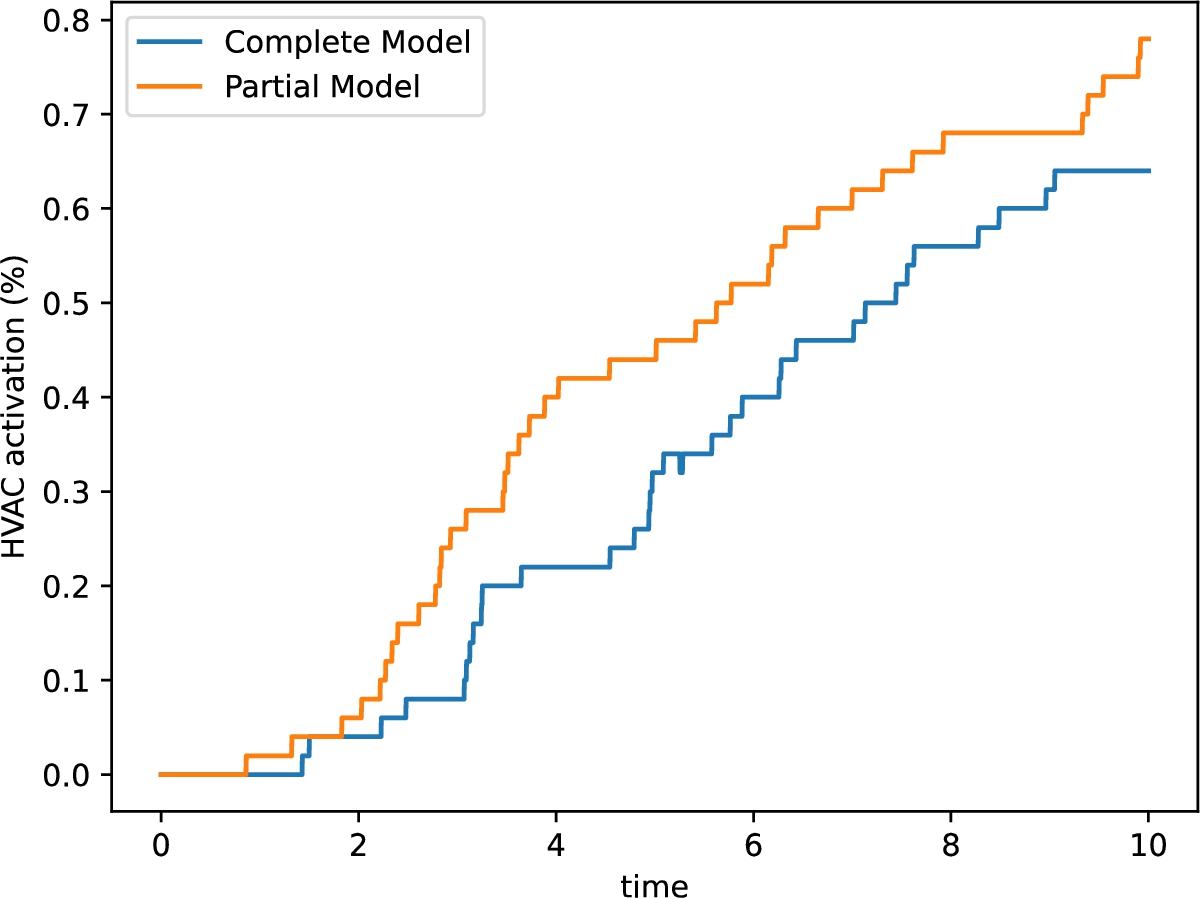
First, there is a meaningful saving of energy with the Complete Model regarding the Partial Model. The advantage is also witnessed by the capability of the Complete Model to guarantee also a more comfortable temperature in the room. In addition to the presented plots, and to understand the reason for this double advantage, Fig. 16 reports the mean number of activations of the
Fig. 16.
Mean number of
Sensitivity analysis The last kind of analysis aims at demonstrating that this tool can be used to understand the impact of the different parameter values on the temperature and on the energy consumption, supporting the BEMS designer to tune better the systems.. These analyses consider only the Complete Model. Two illustrative cases are proposed.
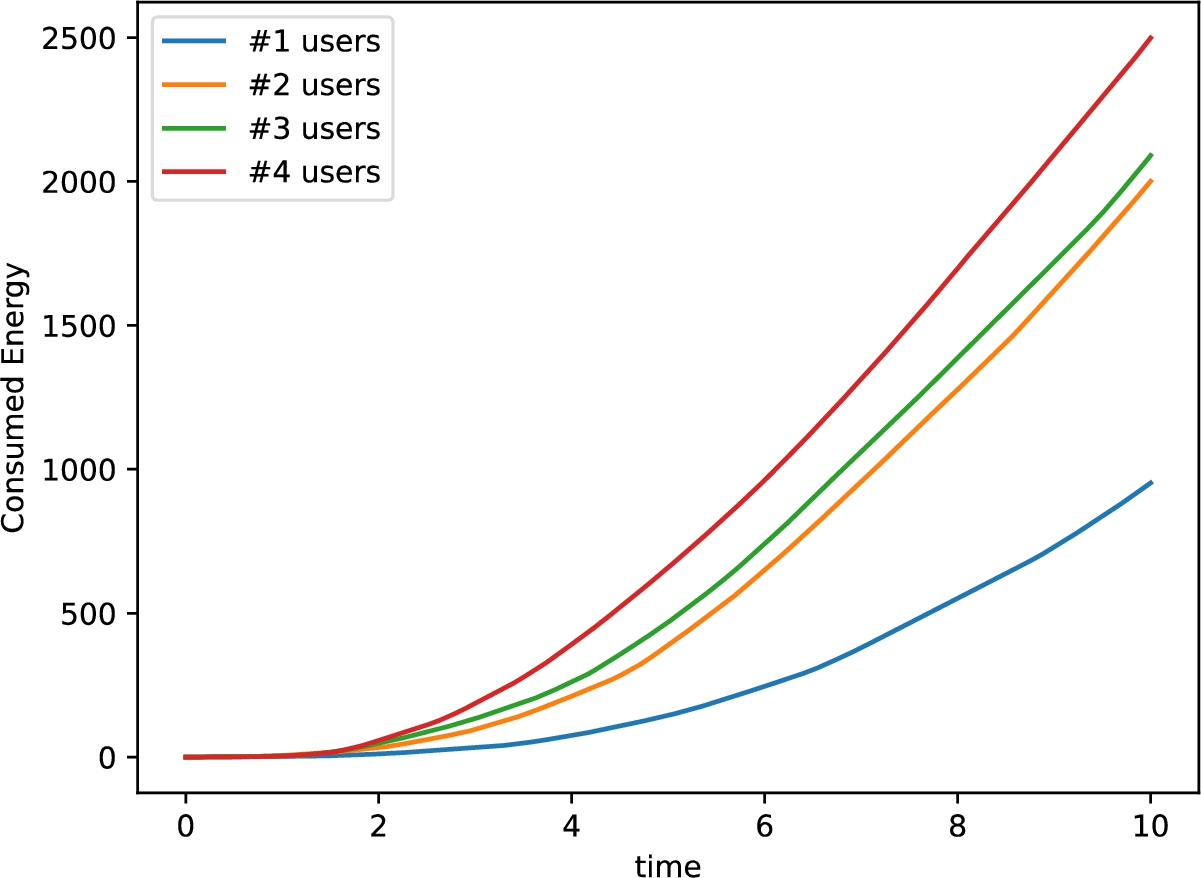
Figure 17 shows the impact of the number of the users populating the interested rooms (from 1 to 4), to the energy consumption. As the plot reveals, there is a big step between the case of a single user and the case of two or more users; instead, the differences among two, three or more users are less meaningful with respect to the first one.
Fig. 17.
Sensitivity analysis w.r.t. present users.
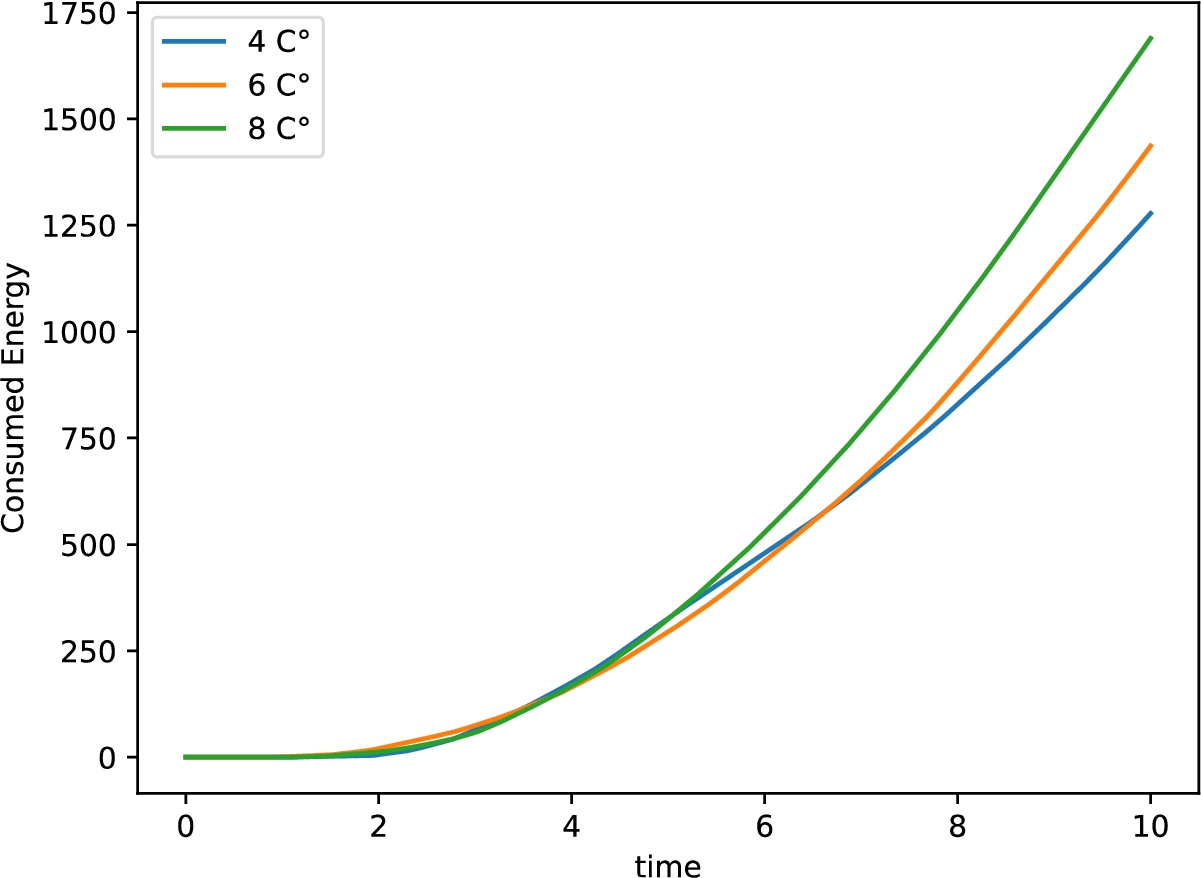
Another possibility is constituted by the study of the variation of the temperature threshold of the control logic introduced in Section 4.4. In this analysis, the value of this threshold spans from 4°C to 8°C with a step of 2°C. The analysis refers to consumed energy. The results of this simulation run are depicted in Fig. 18. In this case, the explanation of the plot is in the line 5 of Listing 3; when the threshold decreases, the number of the times the control flow of the application enters in the if branch increases. The control logic has, in these cases, more occasions to check the possibility to exploit the natural cooling of an open window.
Fig. 18.
Sensitivity analysis w.r.t. control temperature threshold.
A brief discussion is needed. The first consideration comes from noticing that this is a simplified case study. Other sensors could be added to the model, e.g., sensors on the doors and temperature sensors in the corridor. However, the approach works also in presence of partial information, considering not controllable/measurable variables as some sort of “interference”. The second comment is related to the values of the considered parameters. The values of the reported parameters are chosen according to a brief revision of datasheets and websites reporting mean values and plausible ranges for parameters as: transmittance coefficients, energy consumption of lamps and workstations, etc. A full detailed report of such sources is out of the scope of this paper. Furthermore, the values of the hyper-parameters (e.g., number of the simulation runs per experiment, simulated time) are also chosen to keep the simulations time-limited. Once one has chosen the proper set of parameter values by means of sensitivity analyses and/or optimization mechanisms, he/she can expand the simulation time window to validate the chosen scenario. The third consideration is related to the sensitivity analysis runs. As stated at the beginning of this section, the motivation of introducing this stage of analysis is to demonstrate that a BEMS designer can base his/her decision on quantitative data. The presentation of two analyses, one based on a user-related parameter, one on a control-related one, demonstrates this objective.
6.Conclusions and future work
The model-based approach using PNs for the construction of a BEMS has proven to be an effective method for creating efficient and reliable systems. This approach allows for the representation of complex processes and interactions within a building’s energy management system, and allows for the modelling of various scenarios and optimization of energy usage. Furthermore, the use of PNs allows for easy modification and updating of the system as necessary, making it a flexible and adaptable solution.
This paper defines the modelling methodology and applies it to the construction of a modular FSPN model and its simulation. The results of this study demonstrate the potential for this approach to significantly improve building energy management and reduce energy consumption. The proposed methodology could also be used to define proper, ad-hoc SRI indices, as considered in [28]. Further scenarios can be explored to assess the methodology.
This paper does not claim to present a fully automated approach. The details about the M2M transformation for the four different layers here presented is out of the scope of this paper. Future work will take into account:
– to continue refining and testing this approach in a variety of different building types and environments to totally demonstrate its effectiveness;
– definition of a wider methodology finalized to the construction of DTs for physical buildings and infrastructures.
The research at the last point will be conducted by exploring the link between the Formal Model and real settings. This aim will be reached gradually first by interfacing simulative software as in [17], then by making an IoT system controlling HVAC in a single room office of a larger building, and finally enlarging the scope of the experimentation to a small building.
Notes
1 Other three mentioned functions – measure, supply, audit – are mentioned in [1] but not fully considered in the cited paper.
4 The necessity of using PN patterns comes from the intrinsic parallelism of the network generated by the Alpha Miner algorithm: as an example, there could be more users, both of them switching off an appliance at the same time or there could be the case of an automated mechanism trying to switch off a device already switched off.
5
6 Two temperatures are considered equals if their difference is under a parametrizable threshold. This mechanism is typical of the hysteresis-based control theory; see as an example [19].
Acknowledgement
The research leading to these results has received funding from the project aDversarial scenArios geneRation With dIgital twiNs In induSTry (DARWINIST), funded by the program of fundamental and applied research projects dedicated to young researchers, Universitá della Campania “Luigi Vanvitelli”, D.R. 834 del 30/09/2022.
The work of Laura Verde is granted by the “Predictive Maintenance Multidominio (Multidomain predictive maintenance)” project, PON “Ricerca e Innovazione” 2014–2020, Asse IV “Istruzione e ricerca per il recupero”-Azione IV.4-”Dottorati e contratti di ricerca su tematiche dell’innovazione” programme CUP: B61B21005470007.
The work of Roberta De Fazio is granted by PON Ricerca e Innovazione 2014/2020 MUR – Ministero dell’Universit‘a e della Ricerca (Italy) – with the PhD program XXXVII cycle D.M. N.1061 “Dottorati e contratti di ricerca su tematiche dell’Innovazione”.
The work of Michele Di Giovanni has been financed within the framework of PREDIS (Pre-disposal management of radioactive waste, Euratom research and training programme, grant agreement No 945098).
Conflict of interest
None to report.
References
[1] | A.M. Al-Ghaili, H. Kasim, N.M. Al-Hada, B.N. Jorgensen, M. Othman and W. Jihua, Energy management systems and strategies in buildings sector: A scoping review, IEEE Access 9: ((2021) ), 63790–63813. doi:10.1109/ACCESS.2021.3075485. |
[2] | M. Azeroual, T. Lamhamdi, H.E. Moussaoui and H.E. Markhi, Simulation tools for a smart grid and energy management for microgrid with wind power using multi-agent system, Wind Engineering 44: (6) ((2020) ), 661–672. doi:10.1177/0309524X19862755. |
[3] | R. Bergenthum, Prime miner – process discovery using prime event structures, in: 2019 International Conference on Process Mining (ICPM), (2019) , pp. 41–48. doi:10.1109/ICPM.2019.00017. |
[4] | S. Bernardi, S. Donatelli and A. Horváth, Implementing compositionality for stochastic Petri nets, International Journal on Software Tools for Technology Transfer 3: (4) ((2001) ), 417–430. doi:10.1007/s100090100065. |
[5] | V. Calderaro, C.N. Hadjicostis, A. Piccolo and P. Siano, Failure identification in smart grids based on Petri net modeling, IEEE Transactions on Industrial Electronics 58: (10) ((2011) ), 4613–4623. doi:10.1109/TIE.2011.2109335. |
[6] | M.P. Fanti, A.M. Mangini and M. Roccotelli, A Petri net model for a building energy management system based on a demand response approach, in: 2014 22nd Mediterranean Conference on Control and Automation, MED 2014, (2014) , pp. 816–821. doi:10.1109/MED.2014.6961474. |
[7] | M.P. Fanti, A.M. Mangini and M. Roccotelli, A first order hybrid Petri net model for building energy management, in: 2018 5th International Conference on Control, Decision and Information Technologies, CoDIT 2018, (2018) , pp. 665–670. doi:10.1109/CoDIT.2018.8394882. |
[8] | G.P.R. Filho, L.A. Villas, V.P. Gonçalves, G. Pessin, A.A.F. Loureiro and J. Ueyama, Energy-efficient smart home systems: Infrastructure and decision-making process, Internet of Things (Netherlands) 5: ((2019) ), 153–167. doi:10.1016/j.iot.2018.12.004. |
[9] | D. Gayo-Avello, A survey on session detection methods in query logs and a proposal for future evaluation, Information Sciences 179: (12) ((2009) ), 1822–1843, Special Section: Web Search. doi:10.1016/j.ins.2009.01.026. |
[10] | U. Gentile, S. Marrone, N. Mazzocca and R. Nardone, µGRIMOIRE: A tool for smart micro grids modelling and energy profiling, Open Cybernetics and Systemics Journal 10: ((2016) ), 263–282. doi:10.2174/1874110X01610010263. |
[11] | M. Gholamzadehmir, C. Del Pero, S. Buffa, R. Fedrizzi and N. Aste, Adaptive-predictive control strategy for HVAC systems in smart buildings – a review, Sustainable Cities and Society 63: ((2020) ), 102480, https://www.sciencedirect.com/science/article/pii/S2210670720307009. doi:10.1016/j.scs.2020.102480. |
[12] | L. Gomes and J.P. Barros, Structuring and composability issues in Petri nets modeling, IEEE Transactions on Industrial Informatics 1: (2) ((2005) ), 112–123. doi:10.1109/TII.2005.844433. |
[13] | L. Gomes, J.P. Barros, A. Costa and R. Nunes, The input-output place-transition Petri net class and associated tools, in: IEEE International Conference on Industrial Informatics (INDIN), Vol. 1: , (2007) , pp. 509–514. doi:10.1109/INDIN.2007.4384809. |
[14] | M. Gribaudo and A. Horváth, Fluid stochastic Petri nets augmented with flush-out arcs: A transient analysis technique, IEEE Transactions on Software Engineering 28: (10) ((2002) ), 944–955. doi:10.1109/TSE.2002.1041051. |
[15] | M. Gribaudo and M. Sereno, Simulation of fluid stochastic Petri nets, in: IEEE International Workshop on Modeling, Analysis, and Simulation of Computer and Telecommunication Systems – Proceedings, (2000) , pp. 231–239. |
[16] | M. Jahn, M. Jentsch, C.R. Prause, F. Pramudianto, A. Al-Akkad and R. Reiners, The energy aware smart home, in: 2010 5th International Conference on Future Information Technology, (2010) . doi:10.1109/FUTURETECH.2010.5482712. |
[17] | S. Karmacharya, G. Putrus, C. Underwood and K. Mahkamov, Thermal modelling of the building and its HVAC system using Matlab/Simulink, in: 2012 2nd International Symposium on Environment Friendly Energies and Applications, (2012) , pp. 202–206. doi:10.1109/EFEA.2012.6294078. |
[18] | W. Khamphanchai, A. Saha, K. Rathinavel, M. Kuzlu, M. Pipattanasomporn, S. Rahman, B. Akyol and J. Haack, Conceptual architecture of building energy management open source software (BEMOSS), in: IEEE PES Innovative Smart Grid Technologies, Europe, (2014) , pp. 1–6. doi:10.1109/ISGTEurope.2014.7028784. |
[19] | O. Lopez-Santos, D.S. Dantonio, F. Flores-Bahamonde and C.A. Torres-Pinzón, Chapter 2 – hysteresis control methods, in: Multilevel Inverters, E. Kabalcı, ed., Academic Press, (2021) , pp. 35–60. ISBN 978-0-323-90217-5. doi:10.1016/B978-0-323-90217-5.00002-2. |
[20] | M. Naedele and J.W. Janneck, Design patterns in Petri net system modeling, in: Proceedings of the IEEE International Conference on Engineering of Complex Computer Systems, ICECCS, (1998) , pp. 47–54. doi:10.1109/ICECCS.1998.706655. |
[21] | J. Ock, R.R.A. Issa and I. Flood, Smart building energy management systems (BEMS) simulation conceptual framework, in: Proceedings – Winter Simulation Conference, Vol. 0: , (2016) , pp. 3237–3245. doi:10.1109/WSC.2016.7822355. |
[22] | H.S. Ramadan, M. Becherif and F. Claude, Energy management improvement of hybrid electric vehicles via combined GPS/rule-based methodology, IEEE Transactions on Automation Science and Engineering 14: (2) ((2017) ), 586–597. doi:10.1109/TASE.2017.2650146. |
[23] | N. Razmjooy, D. Bahmanyar, V. Rajinikanth and G.G. de Oliveira, A new home energy management system for smart home using improved multi-objective antlion optimization algorithm, in: Proceedings of the 7th Brazilian Technology Symposium (BTSym’21), Smart Innovation, Systems and Technologies Vol. 207: , (2023) , pp. 56–72. doi:10.1007/978-3-031-04435-9_6. |
[24] | P. Siano, G. Graditi, M. Atrigna and A. Piccolo, Designing and testing decision support and energy management systems for smart homes, Journal of Ambient Intelligence and Humanized Computing 4: (6) ((2013) ), 651–661. doi:10.1007/s12652-013-0176-9. |
[25] | C. Sibertin-Blanc, CoOperative Objects: Principles, Use and Implementation, Springer-Verlag, (2001) . ISBN 354041942X. |
[26] | SmartBuilt4EU Partners, Smart buildings EU-funded innovations, Technical Report, SmartBuilt4EU, 2022, https://smartbuilt4eu.eu/?jet_download=3328. |
[27] | L. Strenge, G. Schafaschek and J. Raisch, Modeling and control of prosumer-based microgrids: A Petri net approach, in: 2019 IEEE 15th International Conference on Automation Science and Engineering (CASE), (2019) , pp. 209–215. doi:10.1109/COASE.2019.8843026. |
[28] | The European Parliament and the Council of the European Union, Directive (EU) 2018/844 on energy efficiency, Technical Report, European Union, 2018, PE/4/2018/REV/1, https://eur-lex.europa.eu/legal-content/EN/TXT/?uri=uriserv:OJ.L_.2018.156.01.0075.01.ENG. |
[29] | United Nations – Department of Economic and Social Affairs, Population Division, World population prospects 2022: Summary of results, Technical Report, UN, 2022, UN DESA/POP/2022/TR/NO. 3. |
[30] | United Nations – General Assembly, Transforming our world: The 2030 agenda for sustainable development, Technical Report, UN, 2015, UN A/RES/70/1. |
[31] | US Department of Energy, EnergyPlus: Getting started with energy plus, in basic concepts manual – essential information you need about running energyplus, Technical Report, 2011, https://energyplus.net/sites/default/files/pdfs_v8.3.0/GettingStarted.pdf. |
[32] | W. Van Der Aalst, Process mining: Overview and opportunities, ACM Transactions on Management Information Systems 3: (2) ((2012) ), 7. |
[33] | S. Venticinque and M. Diodati, A genetic algorithm for real-time demand side management in smart-microgrids, International Journal of Computational Science and Engineering 25: (1) ((2022) ), 91–104. doi:10.1504/IJCSE.2022.120792. |
[34] | M. Xavier, V. Dubinin, S. Patil and V. Vyatkin, in: Process Mining in Industrial Control Systems, (2022) , pp. 1–6. doi:10.1109/INDIN51773.2022.9976111. |
[35] | C. Xia, Z. Wang and Z. Wang, The refinement of Petri net with inhibitor arcs based representation for embedded systems, Electronics 11: (9) ((2022) ), 1389, https://www.mdpi.com/2079-9292/11/9/1389. |
[36] | J. Zheng and A. Jamalipour, Wireless Sensor Networks: A Networking Perspective, Wiley-IEEE Press, (2009) . ISBN 0470167637. |


