
A low-cost air quality monitoring system based on Internet of Things for smart homes
Abstract
Global climate change and COVID-19 have changed our social and business life. People spend most of their daily lives indoors. Low-cost devices can monitor indoor air quality (IAQ) and reduce health problems caused by air pollutants. This study proposes a real-time and low-cost air quality monitoring system for smart homes based on Internet of Things (IoT). The developed IoT-based monitoring system is portable and provides users with real-time data transfer about IAQ. During the COVID-19 period, air quality data were collected from the kitchen, bedroom and balcony of their home, where a family of 5 spend most of their time. As a result of the analyzes, it has been determined that indoor particulate matter is mainly caused by outdoor infiltration and cooking emissions, and the CO2 value can rise well above the permissible health limits in case of insufficient ventilation due to night sleep activity. The obtained results show that the developed measuring devices may be suitable for measurement-based indoor air quality management. In addition, the proposed low-cost measurement system compared to existing systems; It has advantages such as modularity, scalability, low cost, portability, easy installation and open-source technologies.
1.Introduction
Air pollution increases with the increasing population, urbanization, industry, transportation, and agricultural developments, is a significant health problem worldwide. Breathing healthy air represents a fundamental right for everyone. However, the report of states that the vast majority of the world’s population breathes polluted air and seven million people die annually from air pollution-related causes [63].
The United States Environmental Protection Agency (EPA) regulates both outdoor and IAQ. In accordance with the EPA, indoor pollutant levels can be two to five times and occasionally more than 100 times higher compared to outdoor pollutant levels, which is among the top five environmental risks to human health. IAQ constitutes a determinant of human health. People in modern societies spend more than 90% of their time at home, shopping malls, workplaces, schools, transport and public spaces [61]. Therefore, real-time monitoring of IAQ in buildings is crucial to detect unhealthy situations. IAQ is critical people spending most of their lives indoors, e.g., the elderly, disabled, infants, and chronic patients, and low air quality poses a major health threat to these individuals [6,21,37].
Due to indoor air pollution, people may have severe health problems, especially respiratory, cardiovascular, and skin diseases. The major indoor air pollutants are sulfur dioxide (SO2), ozone (O3), carbon monoxide (CO), CO2, nitrogen dioxide (NO2), PM, volatile and semi-volatile organic compounds (VOCs), radon, and microorganisms [20]. It is known that certain pollutants, including tobacco smoke, CO, NO2, formaldehyde, asbestos fibers, microorganisms, and allergens, are closely associated with health problems [47].
The European Respiratory Society (ERS) identified PMs (
Various low-cost sensors are available for
Cleaning, smoking, and cooking are among indoor PM sources. Among these, smoking and cooking are indoor activities that have the most significant effect on indoor particle concentrations [19]. It is usually reported that the most significant cause of lung cancer among housewives is cooking [17]. These activities produce particles of small sizes due to burning. Field measurements were made for a cooking process to analyze the
Another study showed that smoking and cooking activities reached peak values in indoor
CO2 significantly affects public health and is a key indicator of IAQ. The ventilation system, in which the CO2 level is taken into account, helps prevent many diseases, particularly respiratory infections. Hence, the real-time monitoring of the CO2 concentration level is a critical issue in controlling IAQ. CO2 levels above 1000 ppm indicate an IAQ potential problem [19]. IAQ monitoring represents an significant issue that would trigger the right chain of actions, either through real-time feedback or the direct activation of automatic control devices to encourage human actions [48].
Air quality monitoring systems have become indispensable for the detection of high concentrations of pollutants that may occur in indoor environments. Difficulties in data access, high cost and complexity are the biggest disadvantages of traditional devices developed for air quality monitoring. In the last decade, low-cost sensor technology has played a role in making important strides in air quality monitoring [67].
Low-cost air quality sensors can be utilized for the analysis of air quality in near real time and economically. The user-friendly interface and low maintenance requirement make them an easy-to-use and convenient device [42]. Interest in air quality measurement systems has recently increased with the production of low-cost sensors. The development of IoT-based and low-cost devices to monitor IAQ increases our awareness of indoor air pollutants, which are invisible to the eye but have adverse health effects [46].
IAQ monitoring is an essential element in creating a healthy indoor environment, enabling individuals to trigger the right actions with real-time feedback or direct activation of automatic control devices [16]. Internet of Things (IoT) represents a communication network in which physical objects are interconnected or connected with larger systems [64]. This network collects billions of data obtained from various devices we use in daily life and turns them into usable information [4]. Numerous applications have been developed in smart homes that change our living habits using IoT technology on issues such as comfort, healthcare services, security, and energy savings [36,50,58,60].
In this study, an IoT-based, real-time, low-cost, portable and easy-to-install air quality monitoring system for smart homes is proposed. The proposed system is an IAQ monitoring solution that measures temperature and humidity in real-time, as well as indoor pollutants such as
The remainder of the article is organized as follows. Section 2 is a review of existing methods for indoor air quality measurement. Section 3 presents the architecture of the measurement system and the calibration method. Section 4 presents the experimental results. Finally, Section 5 summarizes the results.
2.Related works
Most people are aware that outdoor air pollution can impact their health, but indoor air pollution can also have significant and harmful health effects. It is essential to monitor the factors affecting air quality to avoid health risks due to poor air quality [45]. However, at present, most of the devices developed to monitor air quality data are not very well calibrated. Moreover, they measure a limited number of air quality parameters. Therefore, to avoid possible health risks, it is necessary to develop a measurement and monitoring system that can efficiently collect and analyze data on the air we breathe.
The Internet is among the necessary and important technology that can be utilized for developing a system that can monitor and share information on environmental pollution. The reduction of hardware costs and the development of new technologies have recently made it possible to develop many high-tech devices to monitor the condition of the indoor and outdoor environment to support human life quality. Furthermore, new regulations and limits for PM and pollutant gas concentrations expressed by the WHO (World Health Organization) and the EU Committee have increased people’s interest in this issue.
In a study conducted in China, the relationship between air pollutant concentrations such as
Traditional approaches to air pollution monitoring utilize costly, complex, fixed devices that put a limit on data access, application flexibility, and overall budget. In the last decade, low-cost sensor technology made significant steps in monitoring air pollution, giving it an opportunity to change the status quo [13]. Unlike the temperature that people perceive and can understand whether it is appropriate, the presence of pollutants in the air is not always perceived by humans, and in fact, humans cannot smell CO2, one of the most common self-produced indoor pollutants. As long as our living spaces are not equipped with sensors, the CO2 concentration can significantly exceed limit values without anyone knowing [50]. iAir, an IoT-based measurement system developed by for real-time IAQ monitoring [34]. It consists of an ESP8266 sensor as a communication and processing unit and a MICS-6814 sensor, which is a metal oxide semiconductor sensor that can detect various gases, e.g., carbon monoxide, nitrogen dioxide, ethanol, methane, and propane, as a sensing unit. This system also uses a smartphone application for data consultancy and real-time notifications.
In the study, the effect of different wood-burning methods on indoor pollutant concentrations in interior spaces where heating was provided by burning biomass was investigated [62]. The CO, CO2, and
A brief case study for a comprehensive air quality monitoring program in one of the student canteens where university students spent their extracurricular time is proposed in. It was observed that comfort parameters and average values obtained for regulated pollutants were generally within international ranges. However, CO2 and PM values created strong fluctuations depending on activities and occupancy rates, and more than 80% of PM concentrations were produced indoors.
People spend about 8 hours of their daily life in bedrooms. Therefore, it is important to ensure that the air quality is suitable in these areas where they are vulnerable. In bedrooms with low air quality, people have difficulty falling asleep, cannot rest enough during sleep and wake up tired. As a result of IAQ measurements carried out in the bedroom of a single-family house, it was observed by that the CO2 concentration increasing during the night exceeded the allowed standard of 1000 ppm [23].
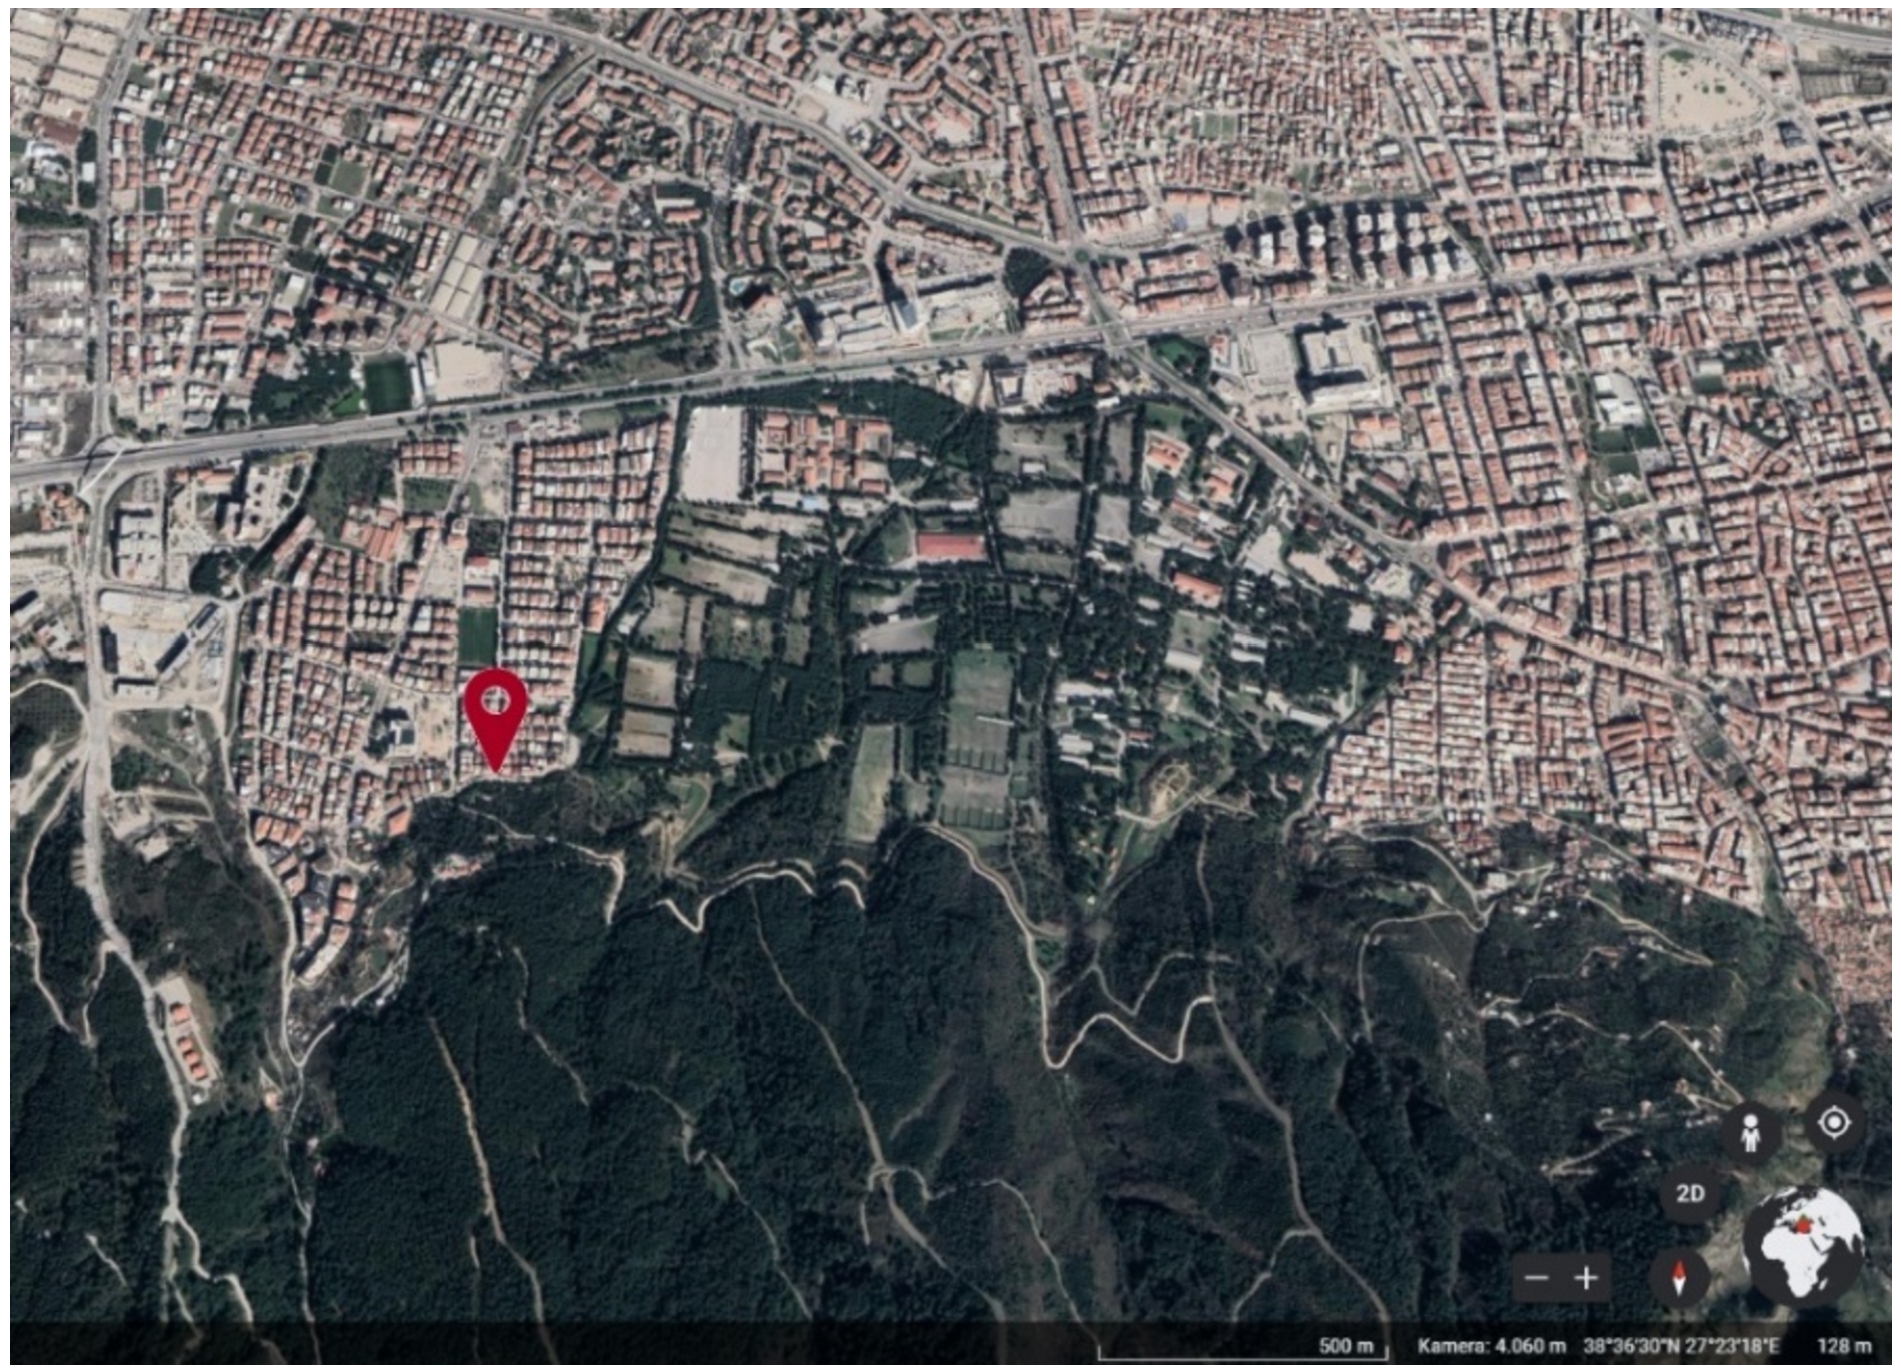
Fig. 1.
The location of the house where the air quality measurements are made (from Google maps).
An IoT-based IAQ measurement system made by using a ESP8266-12E microcontroller and PMS5003 PM sensor provides the house occupants with an intervention opportunity for ambient and assisted living (AAL) [35]. In the prototype developed for IoT-based indoor air quality monitoring, Arduino UNO is used as the processing unit and an ESP8266 is used as the communication unit. Temperature, humidity, CO2, dust and light sensor data are stored in real time on a ThingSpeak platform. The system has smartphone compatibility, providing real-time access to data [33].
A low-cost system that measures parameters such as CO2, VOC, atmospheric pressure, humidity and temperature to deal with IAQ problems using IoT architecture is presented in the study [12]. In the proposed system, two Arduino UNO microcontrollers are used for data acquisition and preprocessing. This data is transmitted to the Raspberry Pi microcontroller, which is the main unit, by Arduino UNO via serial communication. The collected data can be accessed using a mobile application developed using the “Android Studio IDE” Java programming language. In the study [45], an IAQ monitoring system using MQ135 and MQ7 sensors is proposed for air quality measurement. The IAQ monitoring system includes an Arduino Uno and a Wi-Fi compatible ESP8266 microcontroller. The obtained data is stored on the ThingSpeak Platform and the ThingSpeak Cloud service is used for data visualization.
3.Methods
3.1.Home and location
The house where the measurements were taken is 50 m away from the forest area at 38°, 36′, 21′ N and 27°, 22, 55 E coordinates in the central Yunusemre district of Manisa. The house is located on the ground floor of a 3-storey apartment building and is surrounded by a garden on all four sides. The house where the air quality measurements were made, the location of which is shown in Fig. 1, is 190 m2 and the calibration measurements were made in a 25 m2 study room and on a table 1 m high from the ground.
Fig. 2.
House plan and sensor locations.
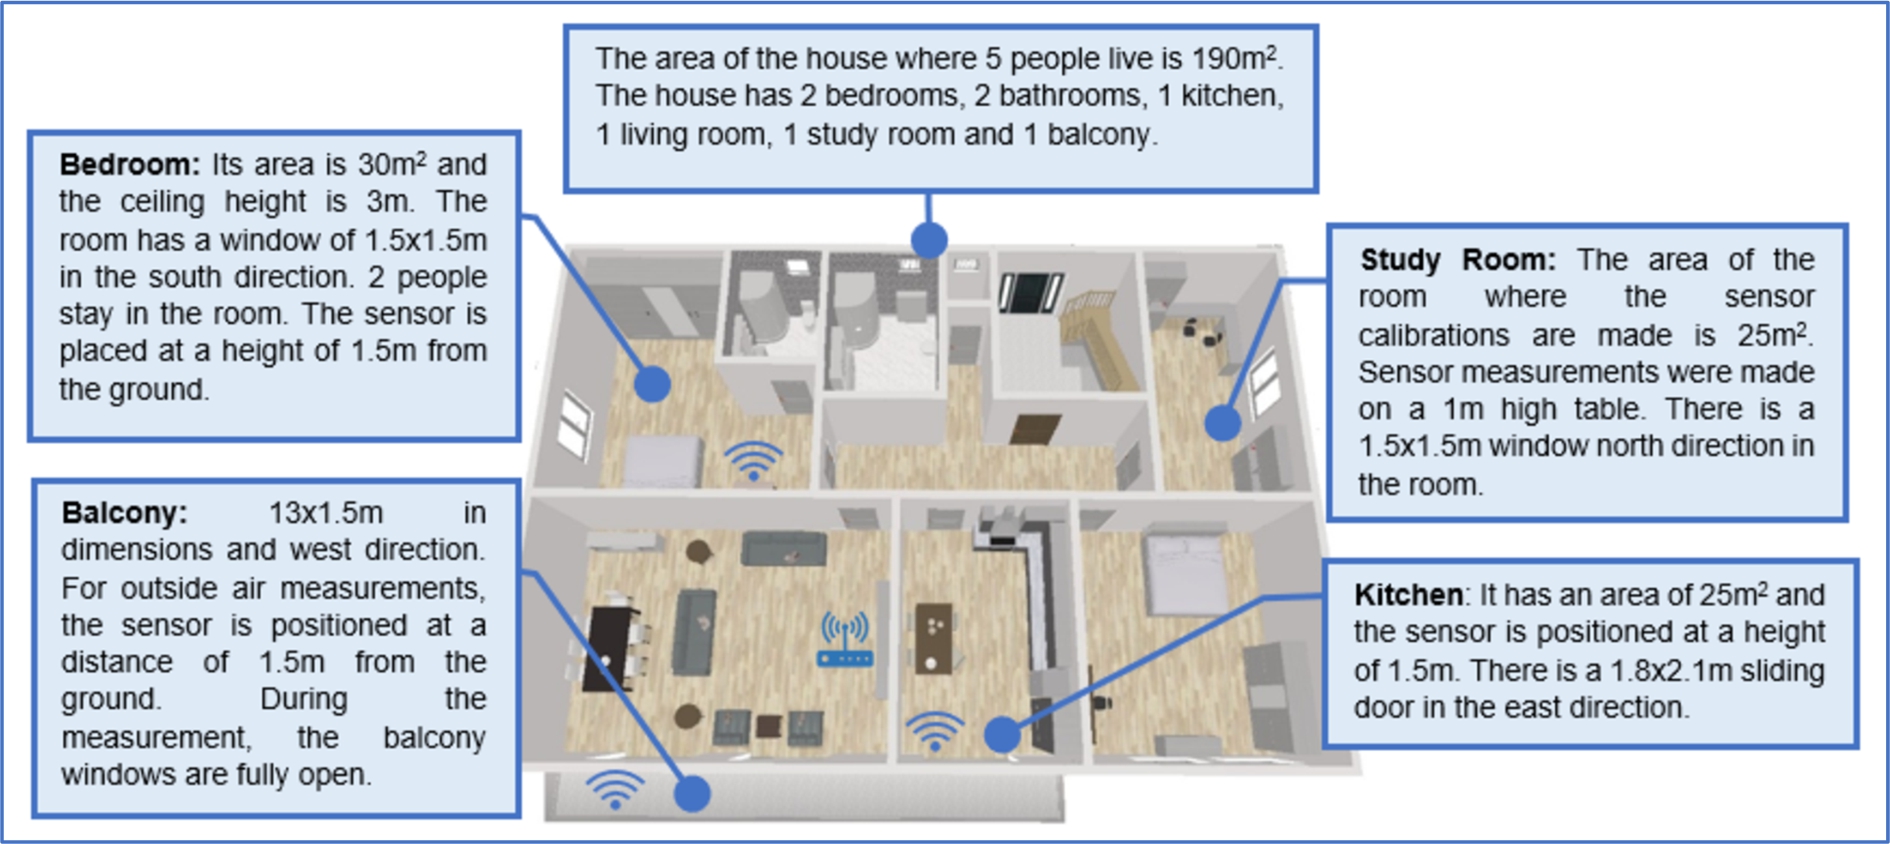
The house, the plan of which is shown in Fig. 2, is heated by a central heating system and a total of 5 people live in the house. Due to COVID-19, all of the house occupants were mostly at home during the time the measurements were made. There is no air cleaning system in the house, and the ventilation of the environment is performed naturally by opening doors or windows. The interior doors of other living areas in the house occupants were not closed while the measurement was made, thus ensuring that the air in the household was homogeneous. Kitchen ventilation was performed through a
3.2.Architecture of the IAQ monitoring system
A reliable, cost-effective system that could be easily configured and installed by users was developed for monitoring IoT-based IAQ in smart homes. Low-cost and high-precision CO2 (MH-Z19A), PM (PMS7003), temperature and humidity (AHT10) sensors were used in the developed system. A microcontroller (ESP8266-12E) with native Wi-Fi support was selected to process the sensor data and transfer it to the IoT platform. In most commercially produced air quality measuring devices, data recording to the cloud server is usually limited to hourly averages and 1-week periods. Therefore, they cannot give precise information about the instantaneously changing pollutant concentrations. Since the data recording period is weekly, it is not possible to access data older than 1 week. Also, commercial products do not have an adjustable contaminant threshold and are generally designed for measurement. When the proposed measurement system is compared with the commercial versions; It is much cheaper, expandable, sensors for different pollutants can be added and long-term (over 1 year) data recording can be stored in the cloud server. In the measurement system, whose data recording frequency is 1 minute, this time can be reduced to 5 s if needed. Thanks to all these features, it shows that the proposed air quality measurement system is far superior to its commercial competitors.
In this section, the cost of the system will be examined together with the hardware and software that constitute the system. This proposed measurement system is an IAQ monitoring solution that measures both indoor pollutants and climate parameters in real time and informs users of their excess concentration via real-time notifications. The architectural structure of the proposed measurement system is presented in Fig. 3.
Fig. 3.
The architecture of the IoT-based IAQ monitoring system for smart homes.
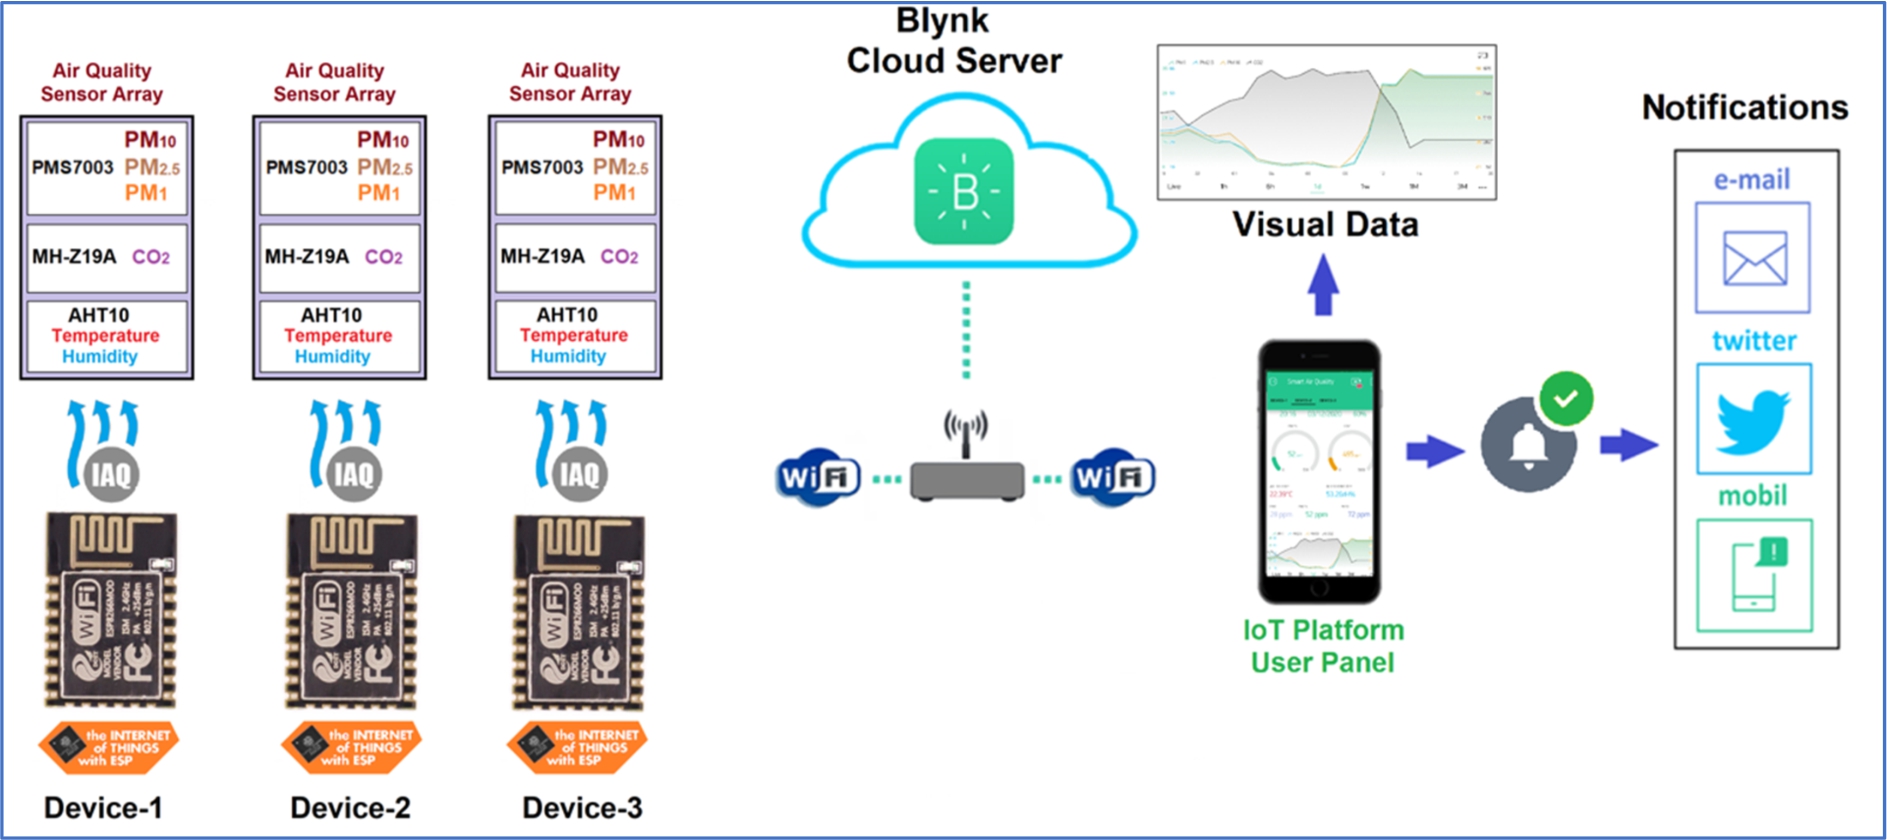
In the proposed system, a completely wireless solution was obtained by utilizing the ESP8266-12E chip, which implements the IEEE 802.11 b/g/n network protocol. This microcontroller with built-in Wi-Fi features is utilized both as a processing and communication unit. In this study, Blynk (2.28.17v) IoT platform was used as a mobile interface development tool. Blynk supports a large number of controllers such as Arduino, ESP8266, ESP32, Raspberry Pi, Onion Omega, SparkFun, etc., which are widely used in IoT applications. Using this IoT platform, without the need to write codes, an iOS/Android mobile interface can be developed for IoT projects in a very short time using only Widgets [39,44,49,53,55].
MH-Z19 NDIR infrared gas module is widely used in the HVAC refrigeration and IAQ monitoring. Despite its low cost, the MH-Z19 is regarded as a reliable, stable and accurate sensor for CO2 measurement [8,31,35,43]. MH-Z19, used in the sensing unit of the IoT-based IAQ monitoring system presented in Fig. 3, is a non-dispersive infrared (NDIR) CO2 sensor. It has a built-in temperature sensor for temperature compensation and has no oxygen dependence. The ideal operating range of the sensor with digital and analog output is 0∼50 °C for temperature and 0∼95% rH for humidity. The measuring range is 0∼5000 ppm, the life is more than 5 years, and the average current consumption is less than 10 mA. MH-Z19 has a 3.3 V interface level and a PWM and UART output signal [1].
PMS7003, used to measure
AHT10 is a new-generation temperature and humidity sensor manufactured by Aosong Electronic. The sensor gives a calibrated digital output in the standard I2C format. It is equipped with an improved MEMS semiconductor capacitive humidity sensing element and a standard on-chip temperature sensing element. Its performance has been significantly enhanced beyond the reliability level of previous generation sensors. In production, each sensor is calibrated and tested with a product lot number printed on the product’s surface. These improved and miniaturized sensors are cost-effective and have low energy consumption. The sensor, which has a resolution of 0.024 rH % for humidity and 0.01°C for temperature, operates at 3.3 V DC voltage [5].
Fig. 4.
Air quality measurement device (a) 3D box model, (b) in-box sensor assembly, (c) full assembled state.
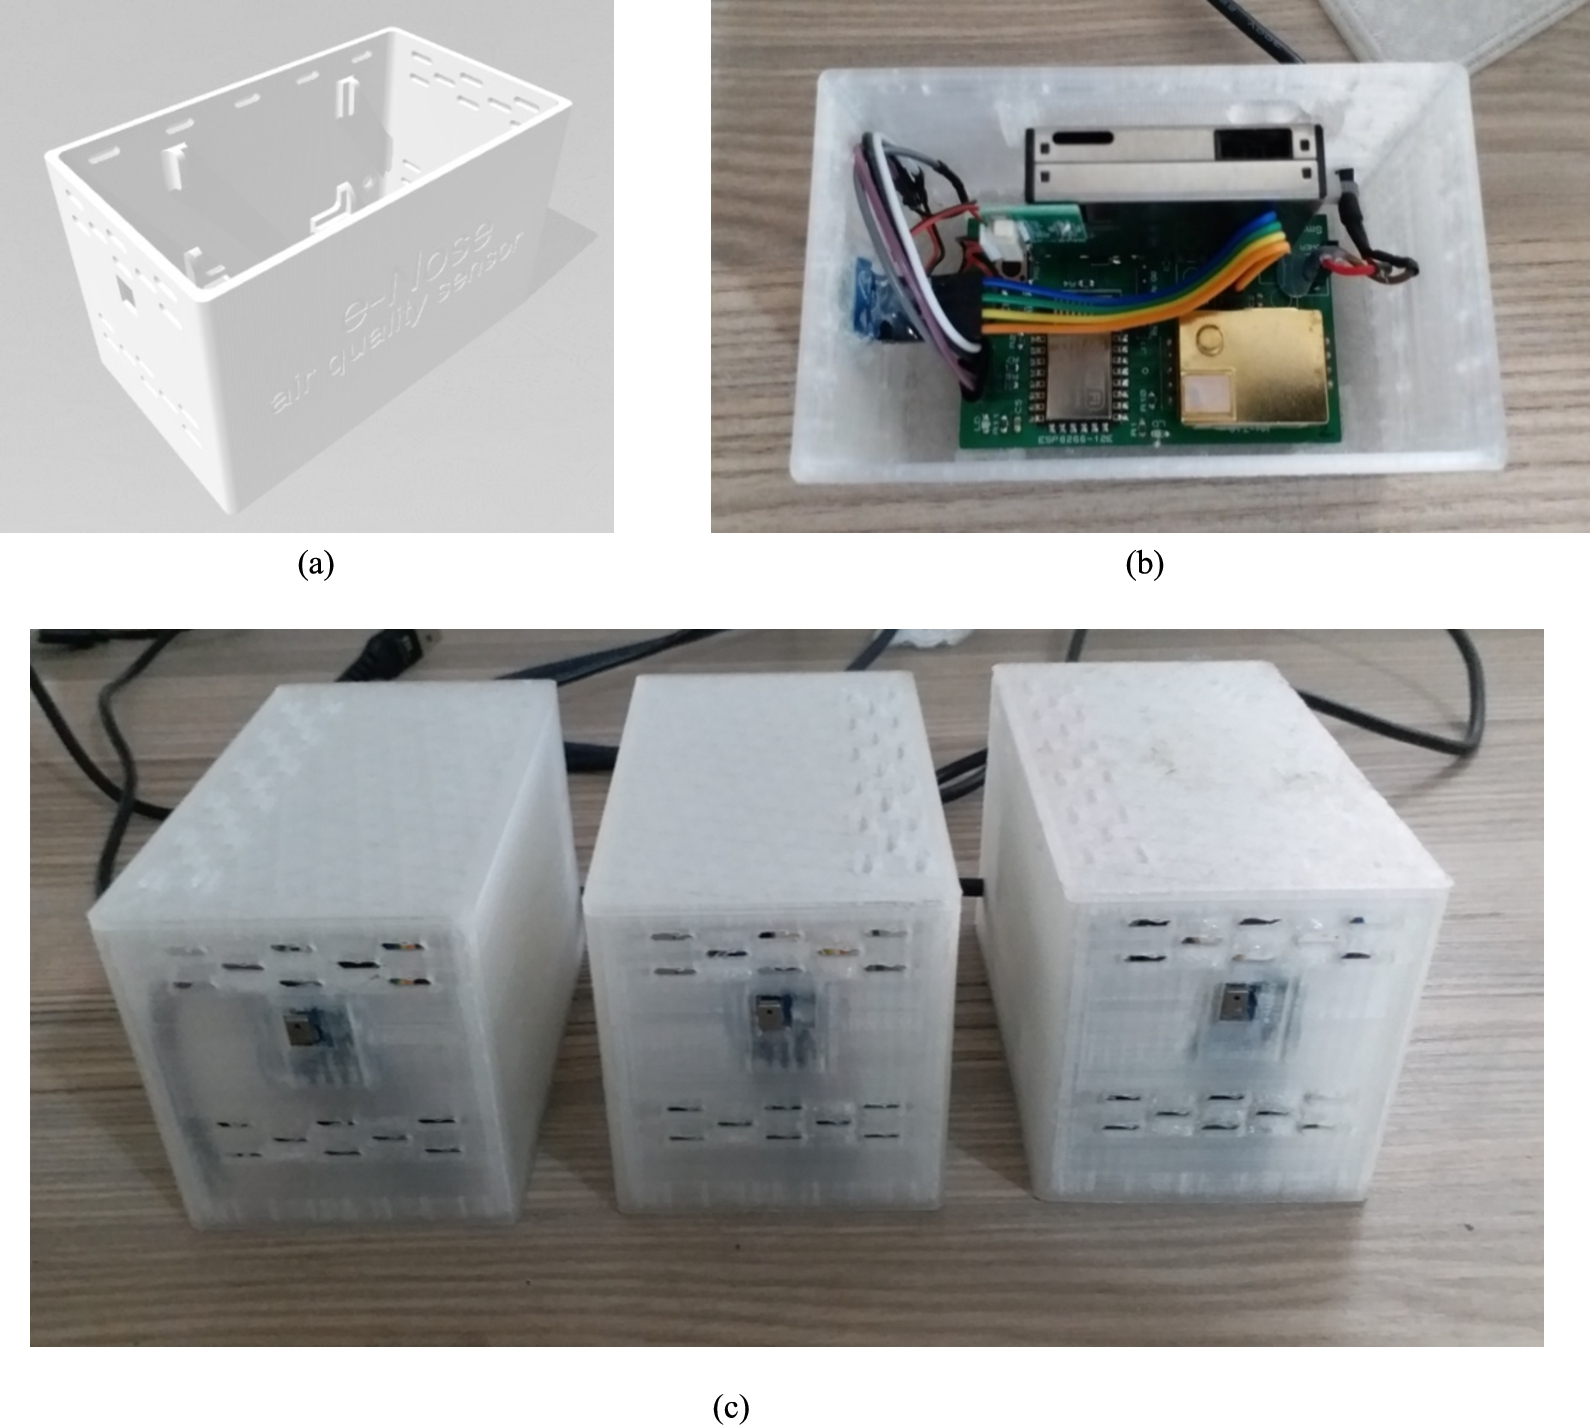
The 3D box model of the air quality measuring device is presented in Fig. 4(a), the placement and connections of the sensors in the box are presented in Fig. 4(b), and the finished assembly is presented in Fig. 4(c). The IoT-based devices convert the measurement data they receive at 5-sec intervals into 1-minute average values. The average minute data obtained is stored on the Blynk-cloud server.
These data stored in the Blynk Cloud server are sent to the registered e-mail address as a csv (Comma Separated Values) file when requested. The data of each air quality parameter also includes time-date information. Thus, all data can be synchronized perfectly. Internet outages occurred in some cases during data recording. This resulted in devices being disconnected and data lost. However, due to the 1-minute data logging frequency, a large amount of data has been recorded in the cloud server for analysis.
Fig. 5.
The user interface of the air quality measurement device (a) kitchen, (b) bedroom, (c) outdoor, (d) notification setup, (e) eventor setup, (f) mail notification.
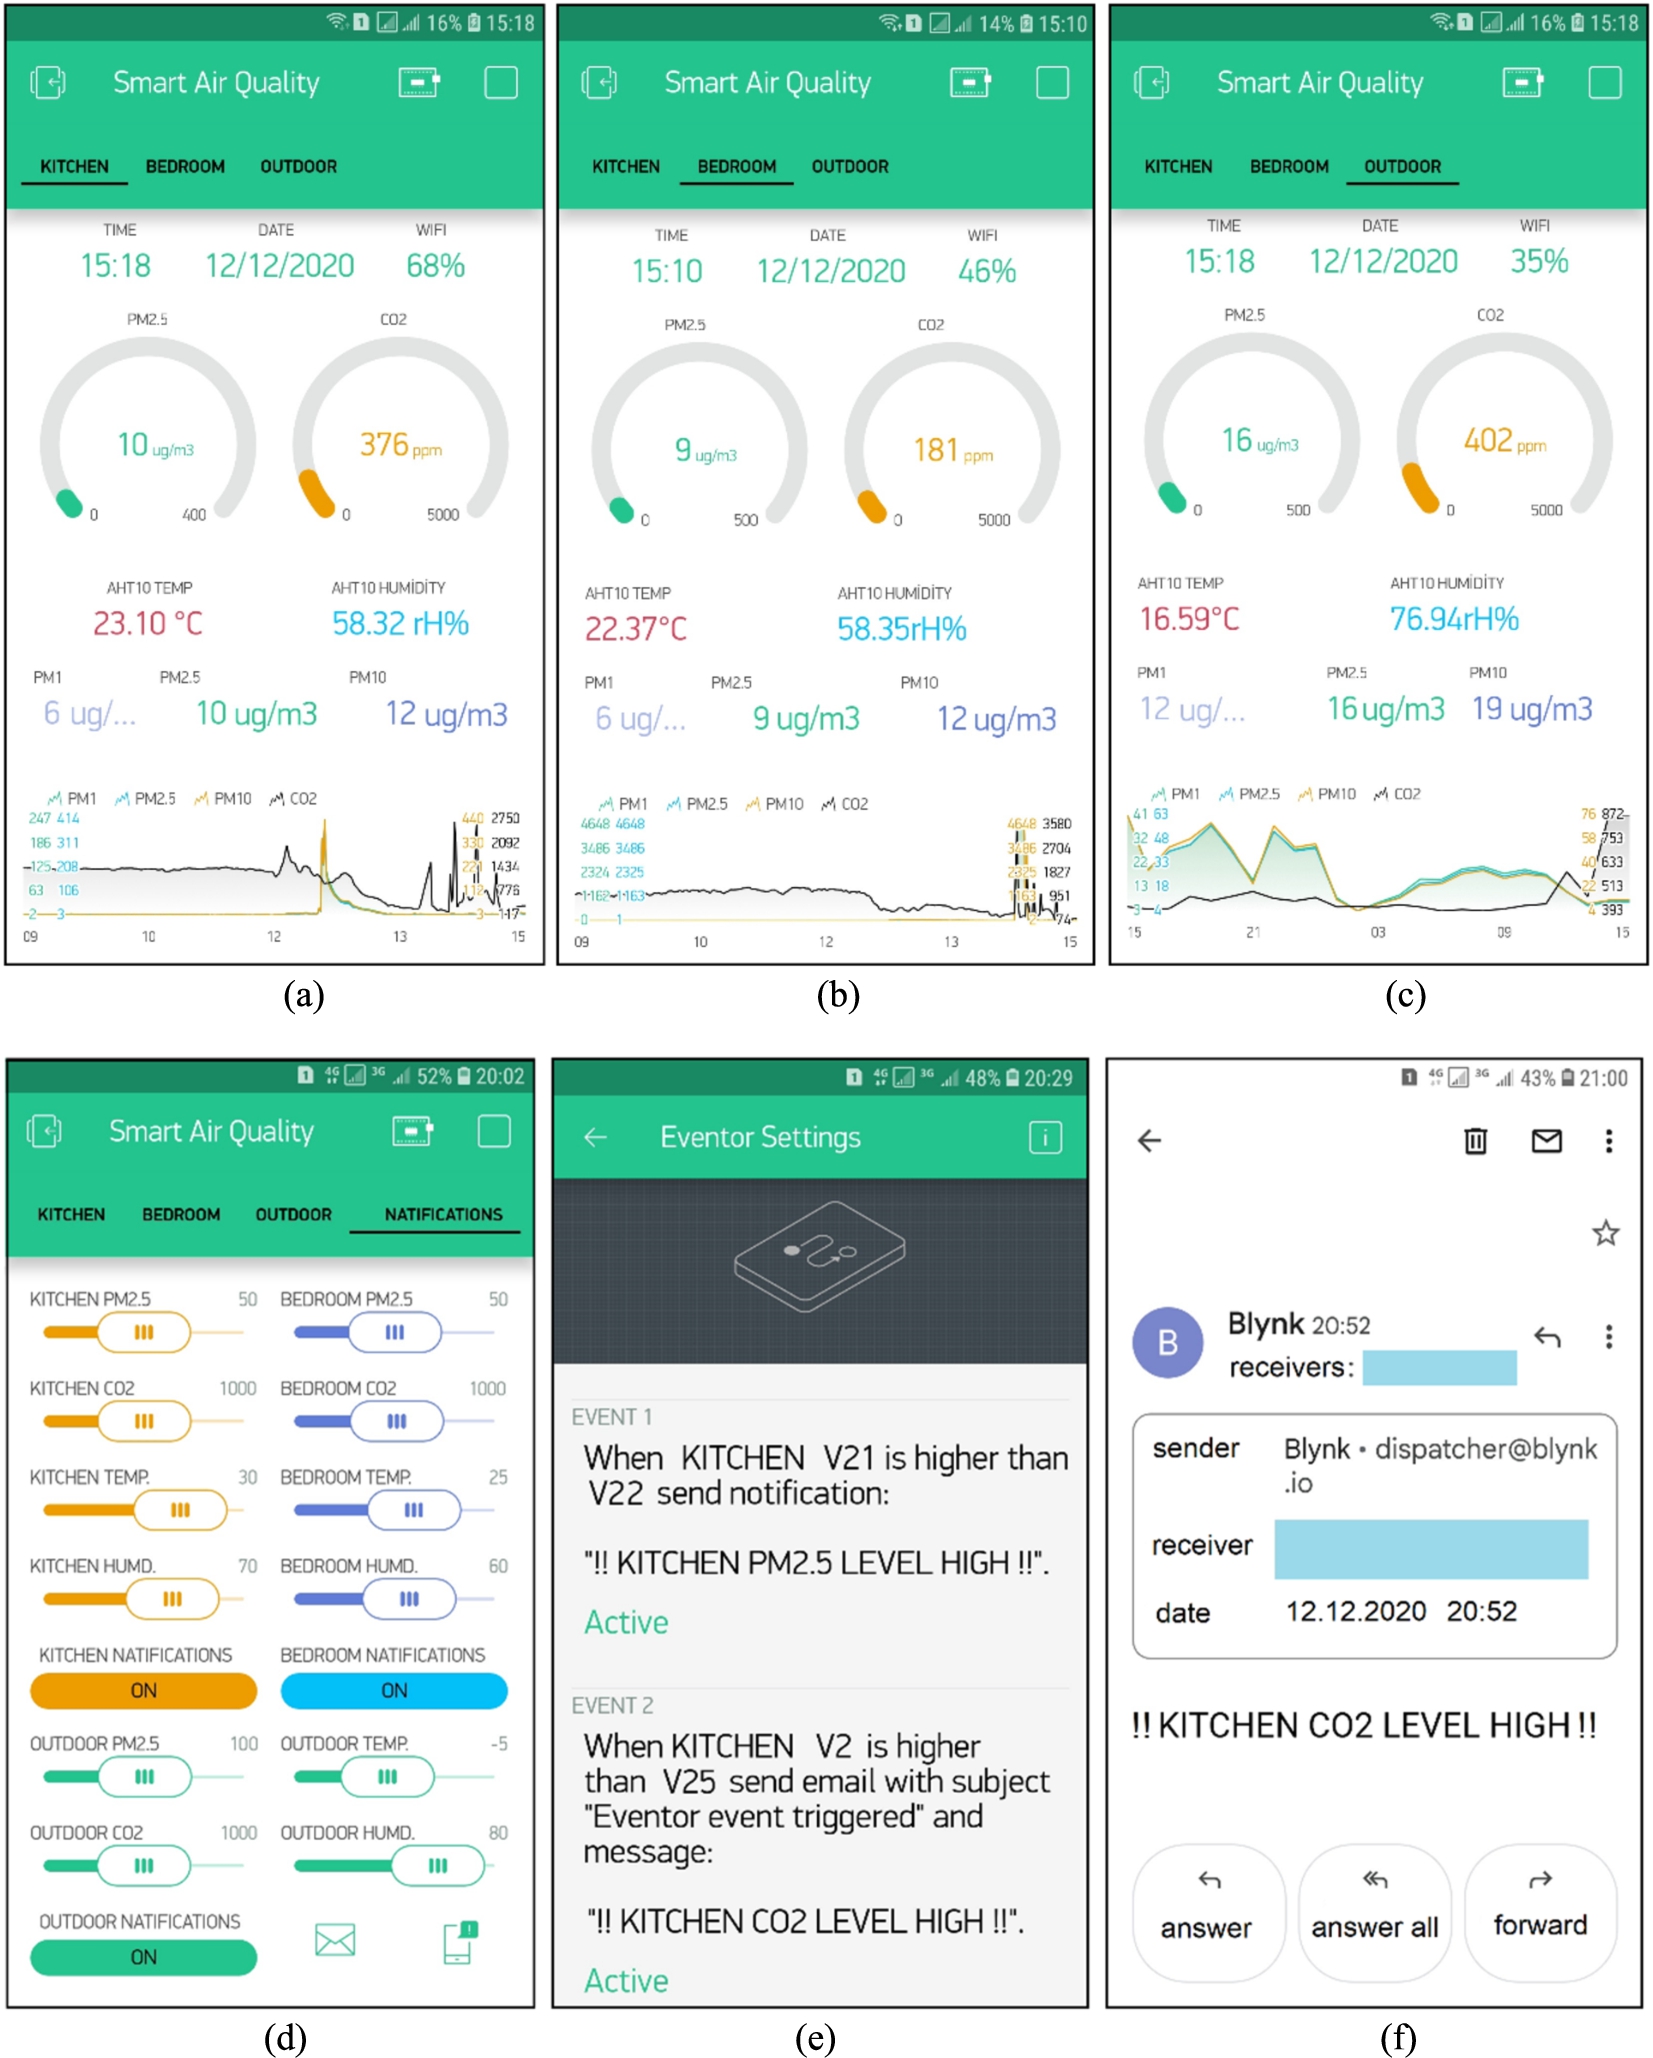
The user interface of the air quality measurement devices is observed in Fig. 5(a), (b), (c). This interface allows data to be collected, visualized, and analyzed in the cloud. The graphs displaying air quality data in the mobile user interface created with the Blynk IoT platform ensure a better perception of the behavior of the monitored parameters than in the digital format. Moreover, the mobile user interface ensures easy and fast access to the collected data, as well as a more precise analysis of the temporal change in air quality parameters. Therefore, the system represents a powerful tool for IAQ analysis and supports decision-making on possible interventions to enhance a healthy indoor environment. The data collected by the sensors are analyzed by the microcontroller before being sent to the Blynk-could server. As seen in Fig. 5(d), the threshold values of the measured air quality parameters can be adjusted via the user interface. In case the threshold values determined for pollutant concentration and climate parameters are exceeded, real-time notifications are sent to users through 2 different channels, via e-mail and mobile device [53,54]. Figure 5(e) shows the event editor window for notifications to be sent to users for different events. In Event-1, in the event that the
The real-time notifications of climate parameters and pollutant concentrations sent to residents provide precise and detailed data on the health of the living environment and assist them in planning interventions to enhance IAQ. Moreover, notification messages encourage behavioral changes and alert the user to act as soon as possible to enhance IAQ. In addition, these real-time notifications allow residents to take permanent and decisive measures to avoid these repeating unhealthy situations. The user-friendly interface settings by which users can configure the wireless network in a few steps are given in Fig. 6. When the system is first started, if the embedded Wi-Fi module on the ESP8266-12E chip-cannot connect to any of the wireless networks, it will switch to the hotspot mode. Then the user can configure the credentials of the Wi-Fi network to connect to the appropriate Wi-Fi network. Due to this feature, users make the IoT-based IAQ monitoring system easily installed and ready to use.
Fig. 6.
Devices Wi-Fi configurations.
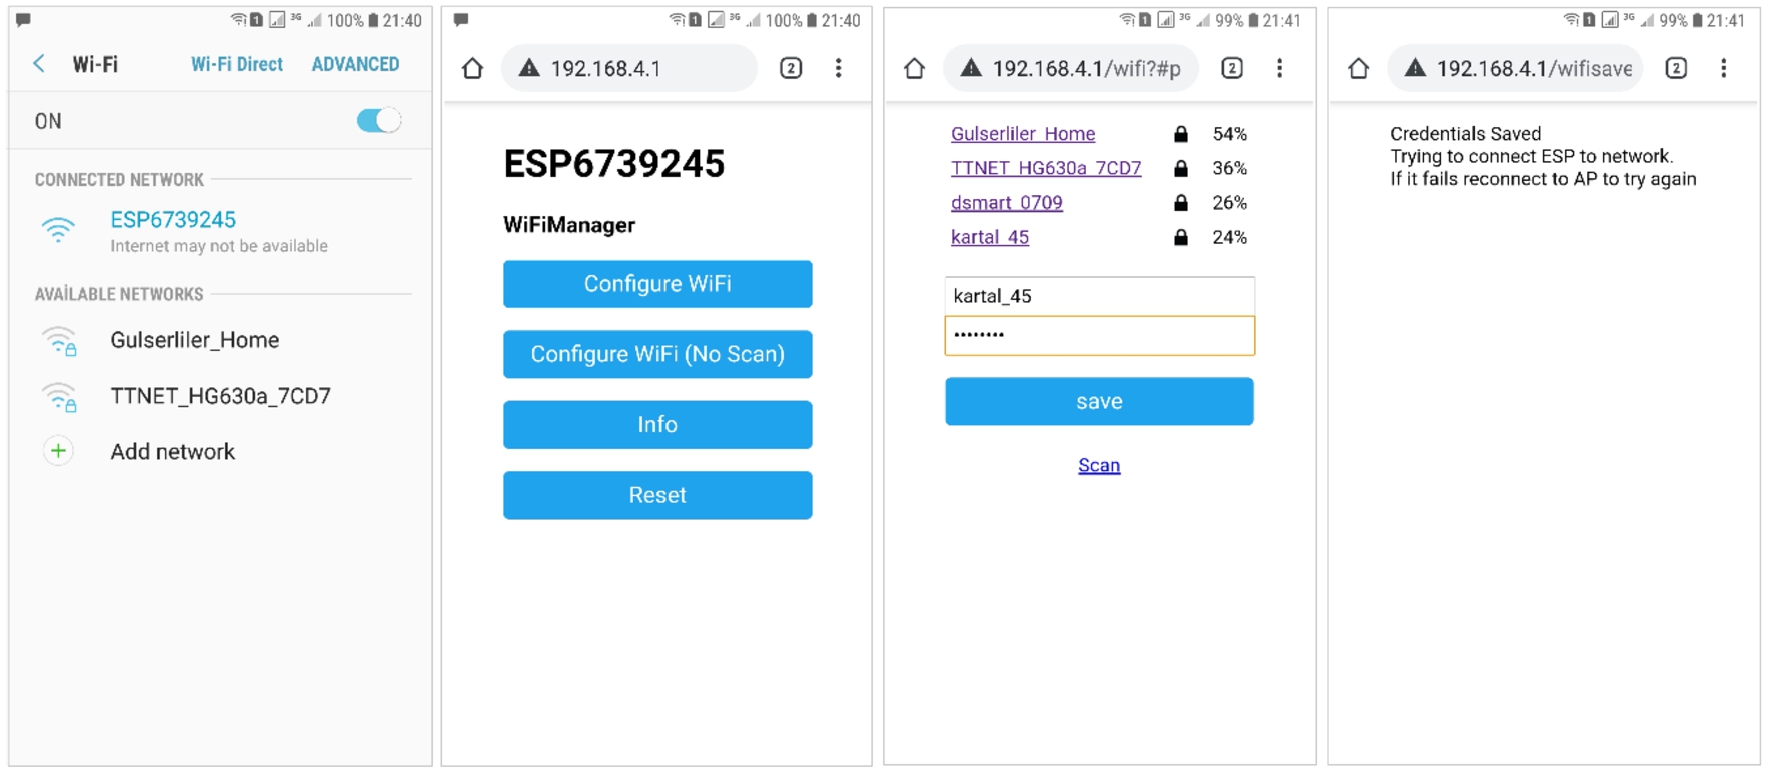
Compared to state-of-the-art devices, the IoT-based IAQ monitoring system’s Wi-fi configuration settings are user-friendly and support an easy setup process. Another advantage of the system is the modularity of the system. The desired number of measurement points can be added as required. To this end, the new device can be connected to the Wi-Fi network without any additional settings.
3.3.Calibration of devices
Devices with the same features developed for the IoT-based air quality monitoring system are shown in Fig. 7(a). These devices and reference devices recorded data together for 1 week. A “Dienmern DM72B” Wi-fi air quality monitor was used for the
Fig. 7.
(a) Calibration of air quality measuring devices with reference devices, (b) Screenshots of the Dienmern DM72B air quality monitor and Tuya Smart.
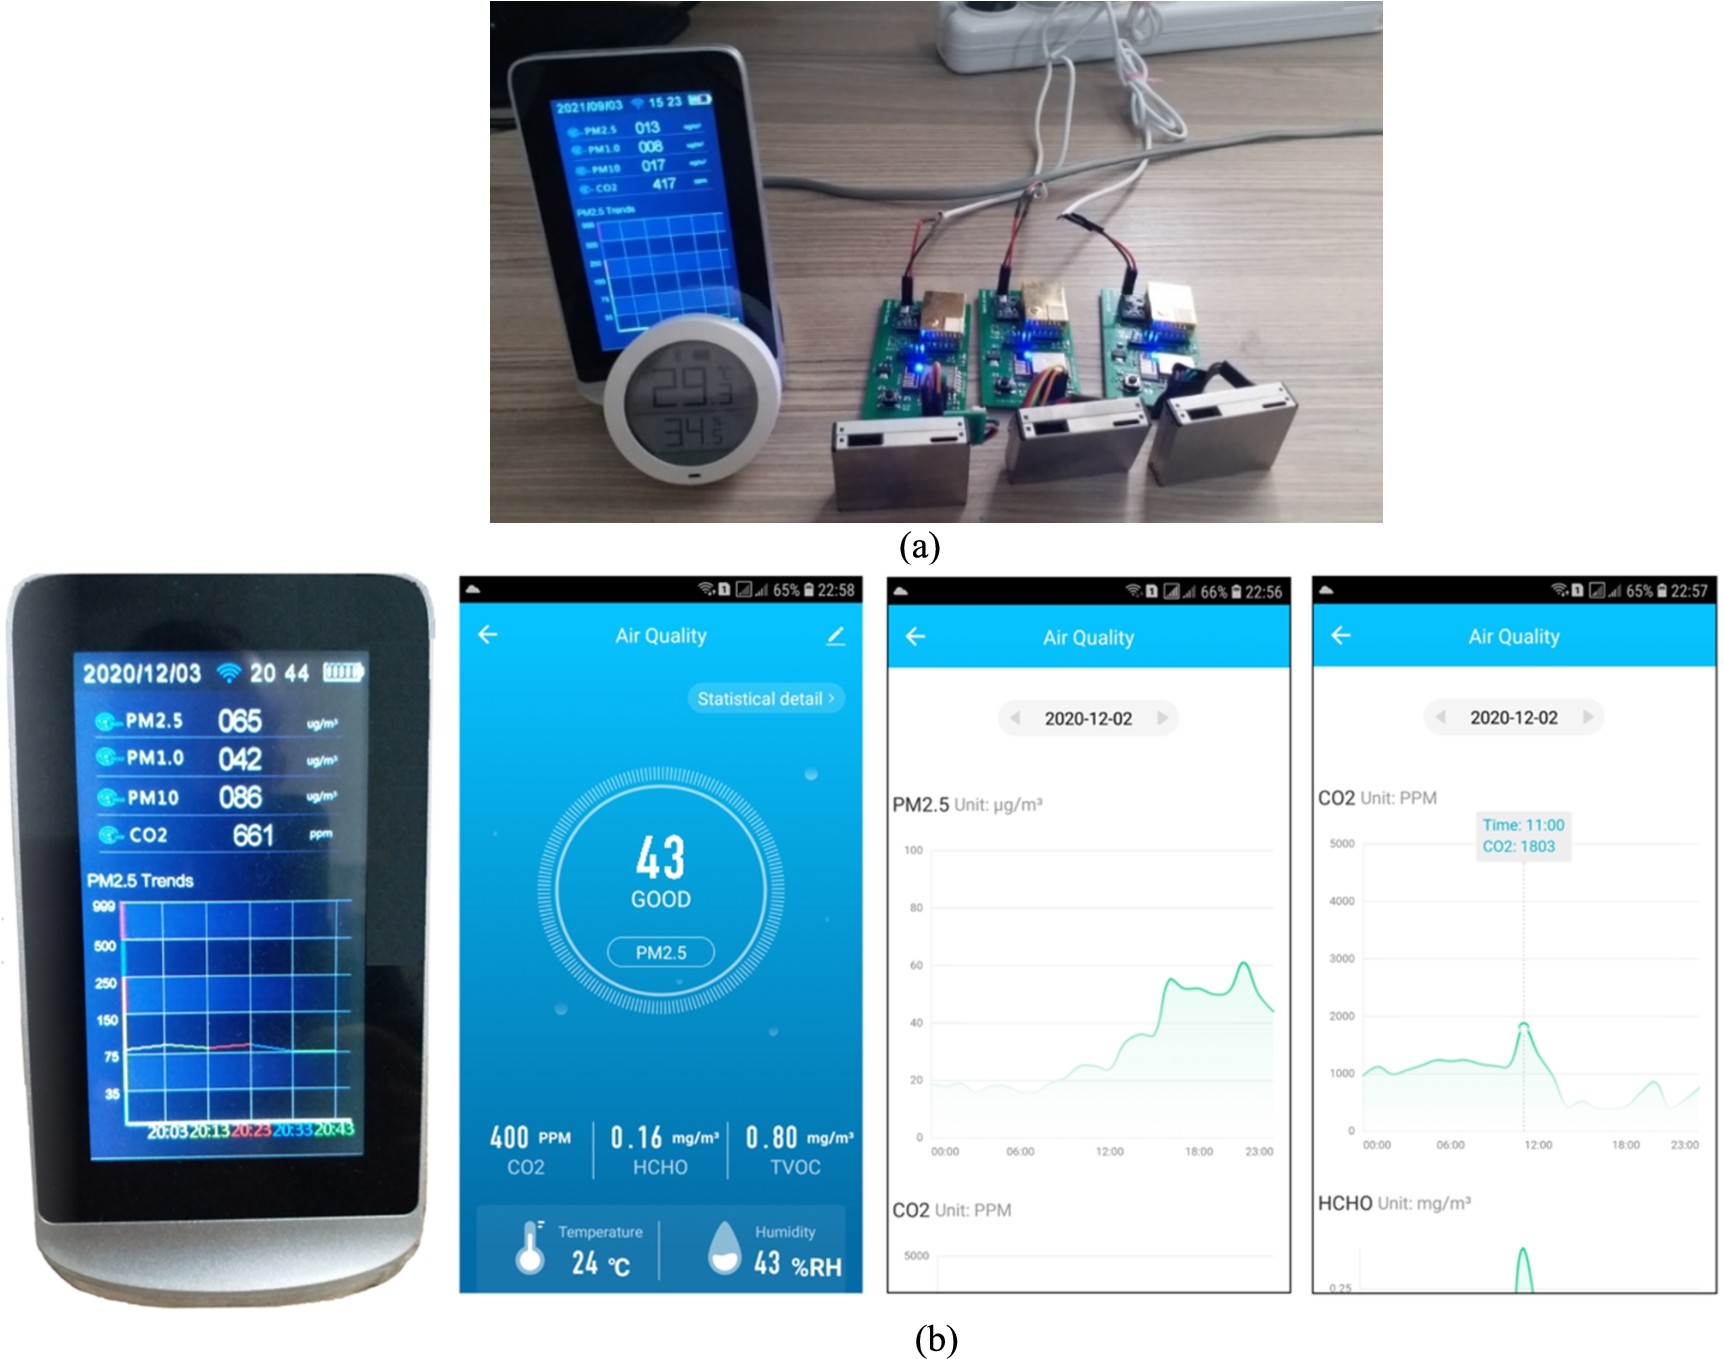
The screenshots of the Dienmern DM72B air quality monitor and Tuya Smart are presented in Fig. 7(b). The data measurement frequency on the device is 5 sec, and data recording to the cloud server is made in the form of 1-hour averages. BLE wireless communication was used for the transfer of the data measured by the “Xiaomi Mijia” measurement device. The temperature and humidity data of this sensor were used by the ESP32 controller with the built-in BLE module and the Blynk IoT platform for recording data to the cloud.
Necessary explanations about calibration processes are given in Section 4.
3.4.Cost of the system
Creating the IoT-based IAQ monitoring system and sensor selection were made, taking into account the minimum cost and maximum measurement accuracy. Considering that the measurement system can also be used with batteries when necessary, attention was paid to selecting sensors with low power consumption. The cost per device of the proposed IoT-based IAQ monitoring system is presented in Table 1. The unit cost of the devices developed for IoT-based air quality measurement is $60 as seen in Table 1.
Table 1
Cost per device of the IoT-based IAQ monitoring system
| Component | Cost [$] |
| ESP8266-12E Chip | 5 |
| MH-Z19A sensor | 15 |
| PMS7003 sensor | 17 |
| Blynk Platform Energy | 5 |
| 5 V-2 A DC Power Supply | 3 |
| Power Supply Cable | 1 |
| 5 V/10 Ah PowerBank | 6 |
| PCB, Box | 8 |
| Total | $60 |
The price of some of the portable CO2 measurement systems in the market varies between €111–377. However, these devices with portability are not capable of analyzing the collected data and deciding on possible interventions to improve public health [32]. Therefore, the low-cost measurement system developed for air quality measurement, with its portability, scalability and modularity features, can offer a reliable and effective solution for air quality measurement systems compared to existing commercial solutions.
Table 2
Technical specifications of commercially available air quality sensors
| Monitor/reporting interval | Retail price | Temperature range/sensor | RH range | PM size/sensor | CO2 range/sensor |
| Low-Cost AQ Sensor | $60 | −40–85°C | 0–100% | 0.3–10 μm | 0–5.000 ppm |
| 5 s | AHT10 | Plantower PMS 7003 | MH-Z19B | ||
| Foobot | $199 | 15–45°C | 30–85% | 0.3–2.5 μm | Estimation from TVOC |
| 5 min. | Sensirion SHT30 | SHARP PY1010AU0F | |||
| Kaiterra Laser Egg + CO2 | $199 | −20–100°C | 0–99% | 0.3–2.5 μm | 400–10.000 ppm |
| 1 min. | Sensirion SHT30 | Plantower 3003 | SenseAir S8 or LP8 | ||
| Awair 2nd Edition | $199 | −40–125°C | 0–100% | 0.3–10 μm | 0–5.000 ppm |
| 10 s | Sensirion SHT30 | Honeywell HPMA115S0-XXX | Amphenol Telaire T6703-5 K | ||
| AirVisual Pro | $269 | 0–40°C | 0–95% | 0.3–2.5 μm | 400–10.000 ppm |
| 10 s | Sensirion SHT30 | AirVisualM25b | SenseAir S8 or LP8 | ||
| uHoo | $320 | −40°C–85°C | 0–100% | 0.3–2.5 μm | 0–5.000 ppm |
| 1 min. | Bosh BME280 | Shinyei ppd42 | ELT T110 | ||
| Clarity Node | $1000 | 15–45°C | 30–85% | 0.3–10 μm | not specified |
| 2.5 min. | not specified | Plantower PMS 6003 |
Table 2 shows the technical specifications of some commercial air quality sensors with prices ranging from $199 to $1000. It is seen that the proposed AQ measurement system has a very low cost compared to its commercial counterparts that make similar measurements.
4.Results and discussion
The proposed air quality measuring device has been developed to provide air quality detection in both indoor and outdoor environments. For the calibration process, between 6–13 November 2020, reference devices and 3 devices to be calibrated together collected data for 1 week.
Regression models allow the relationship between variables to be described by fitting a line to the observed data. Linear regression models use a straight line, while nonlinear regression models use a curved line. Regression allows you to predict how the dependent variable changes as the independent variable(s) change. SLR is used to model the relationship between two continuous variables. Often, the objective is to predict the value of an output variable (or response) based on the value of an input (or predictor) variable.
Current calibration models generally use a univariate SLR, assuming linearity between sensor and reference device response [24].
However, in field conditions where more than one variable influences the measurement result, the SLR is often not sufficient to achieve high measurement accuracy. In these cases, Multivariate Linear Regression (MLR) [66], high-dimensional models [57] or hybrid models are used for calibration [40,52,59]. Since there is a strong linearity between the raw and reference data of the measurements obtained in our study, it was calibrated with the SLR method.
The devices were calibrated with the curve-fitting equations obtained using SLR. Data were collected by placing the calibrated devices in the bedroom, kitchen and outside. PCC were calculated to determine the relationship between these collected data. PCC is often used to analyze the strength of the linear relationship between two variables. PCC is a statistical indicator that is active for correlation analysis between data. Most studies [25,30,41,56] use PCC to determine the relationship between air quality parameters. In the study [14], PCC was used to analyze the relationship of various air pollutants with temperature, humidity and wind speed. In the study [3], in which the exposure of the elderly to indoor air pollutants was determined, it was determined that the living rooms and bedrooms made the highest contribution. The results and the statistical analyzes performed (Pearson correlation and t-test) confirmed that indoor activities (cooking, smoking, and cleaning) can significantly affect the IAQ in living rooms and bedrooms. PCC was used to determine the relationship between CO2, air temperature, relative humidity, formaldehyde and PM values taken from the office, industrial kitchen and gym [7]. In the study [42] where the relationship between indoor and outdoor temperature and
Fig. 8.
PM concentrations of the devices (a)
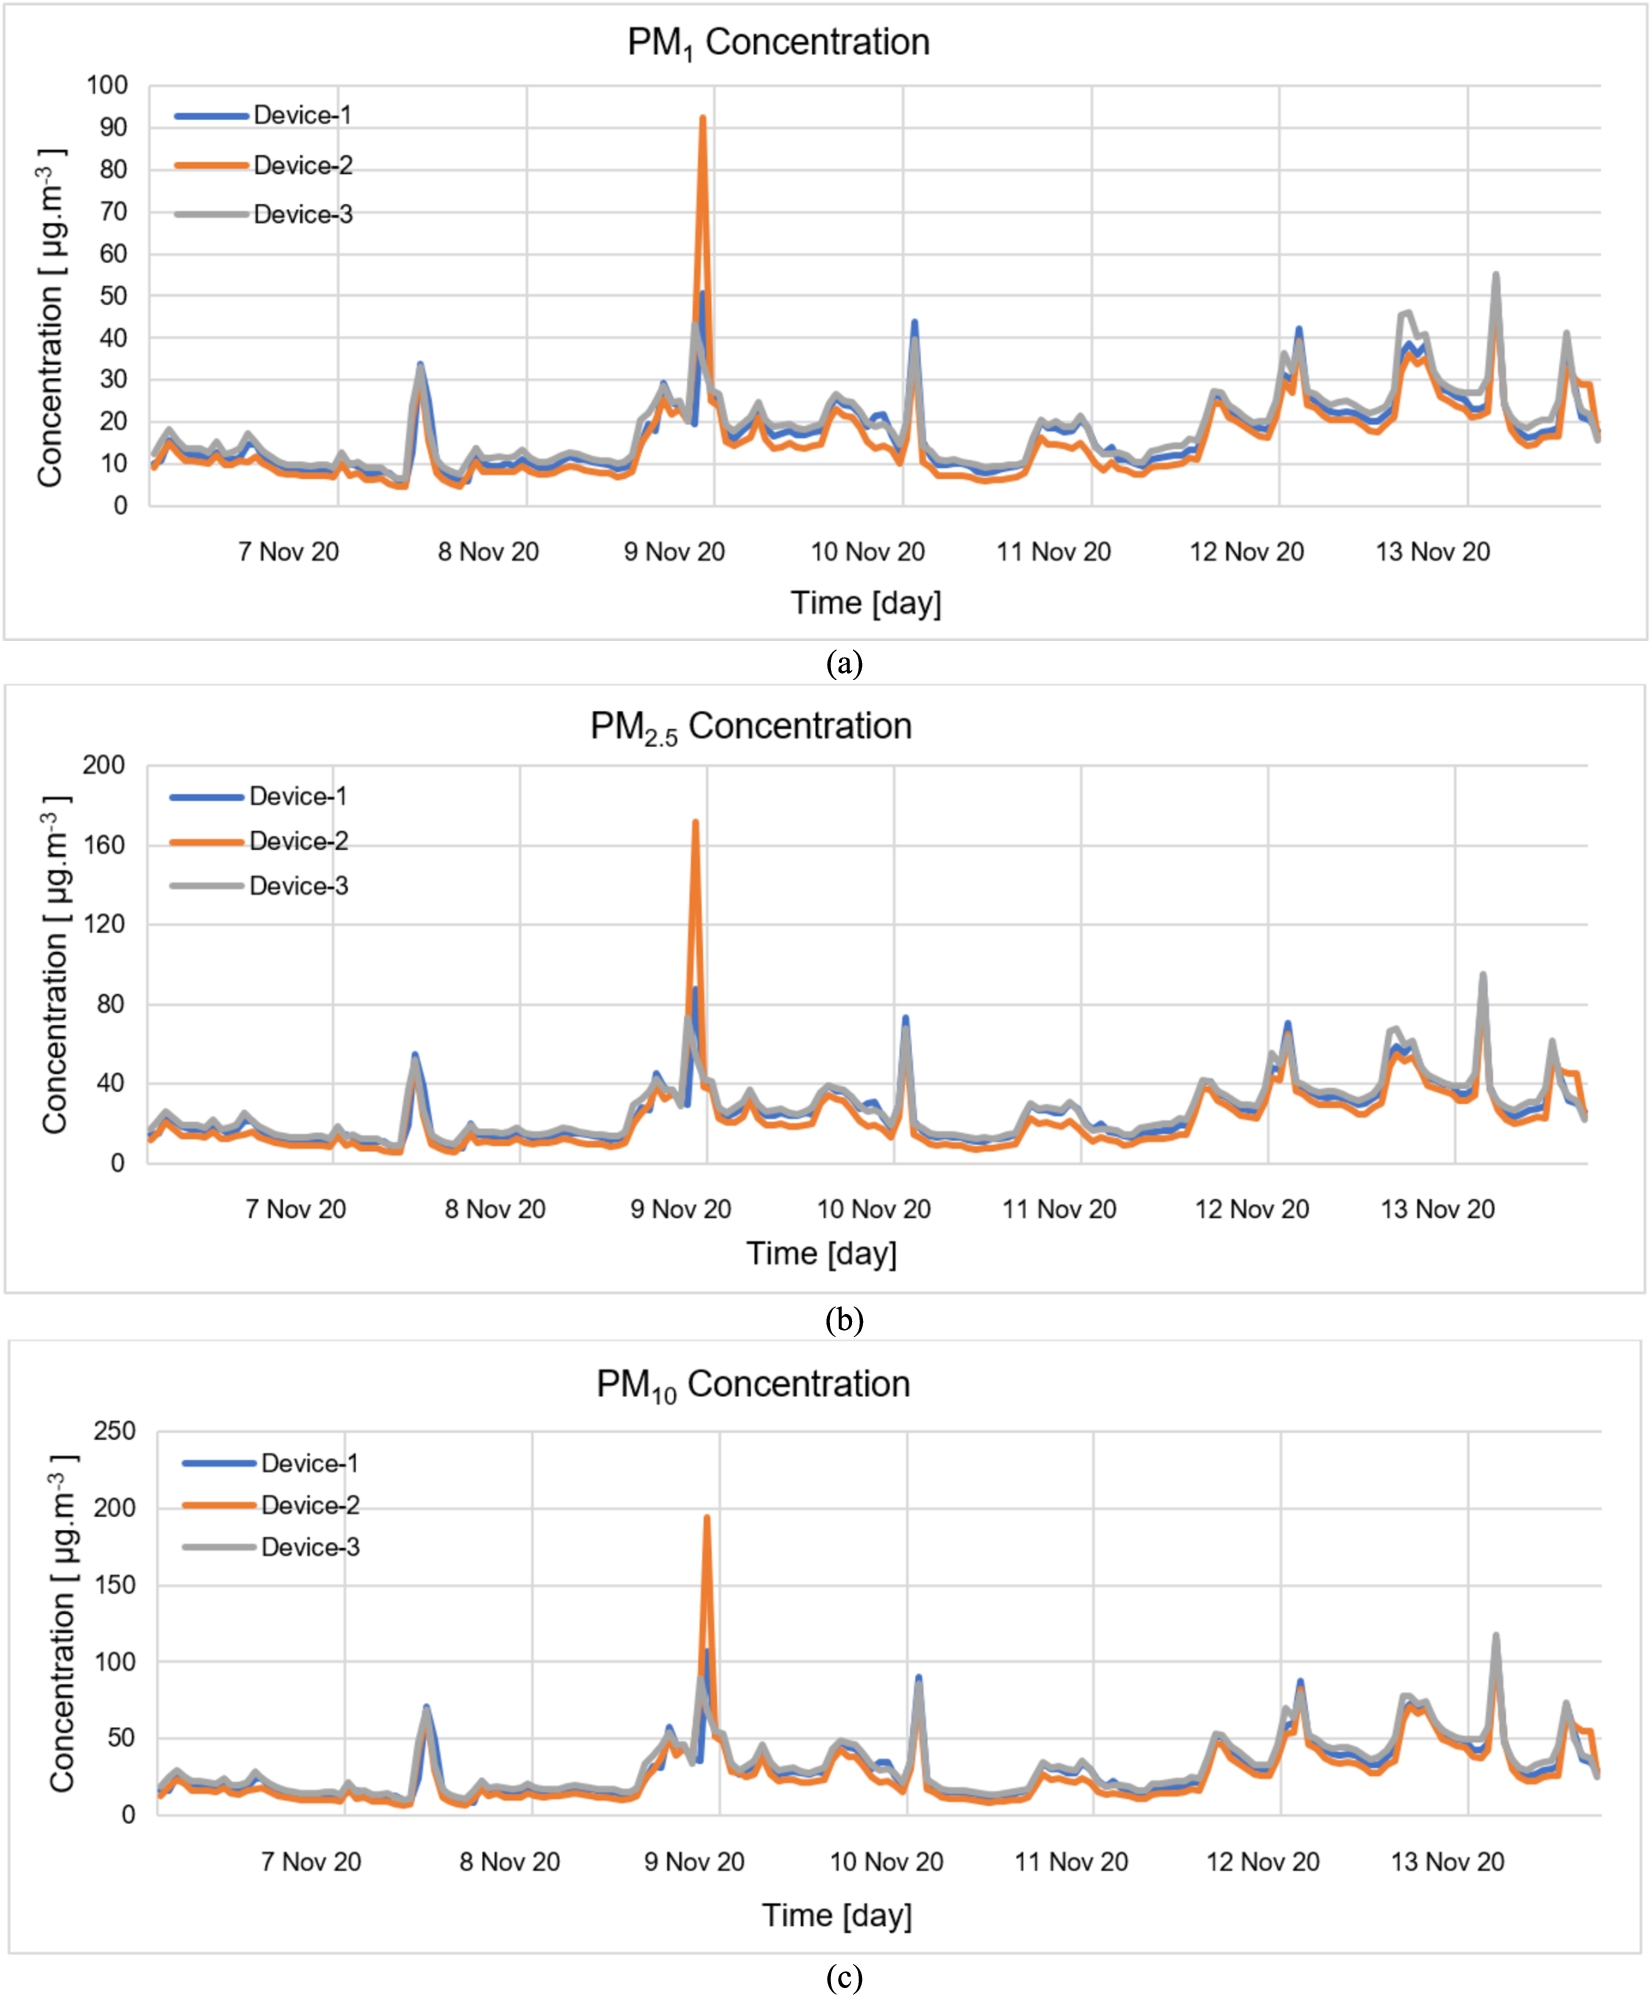
The data graphs of the hourly averages of PM concentrations taken from the air quality measurement devices for 1 week are shown in Fig. 8. During the measurement, the PM values in the environment were increased using natural ventilation and external PM sources in certain time periods.
Fig. 9.
Air quality parameters taken from the devices (a) temperature; (b) humidity; (c) CO2 concentration.
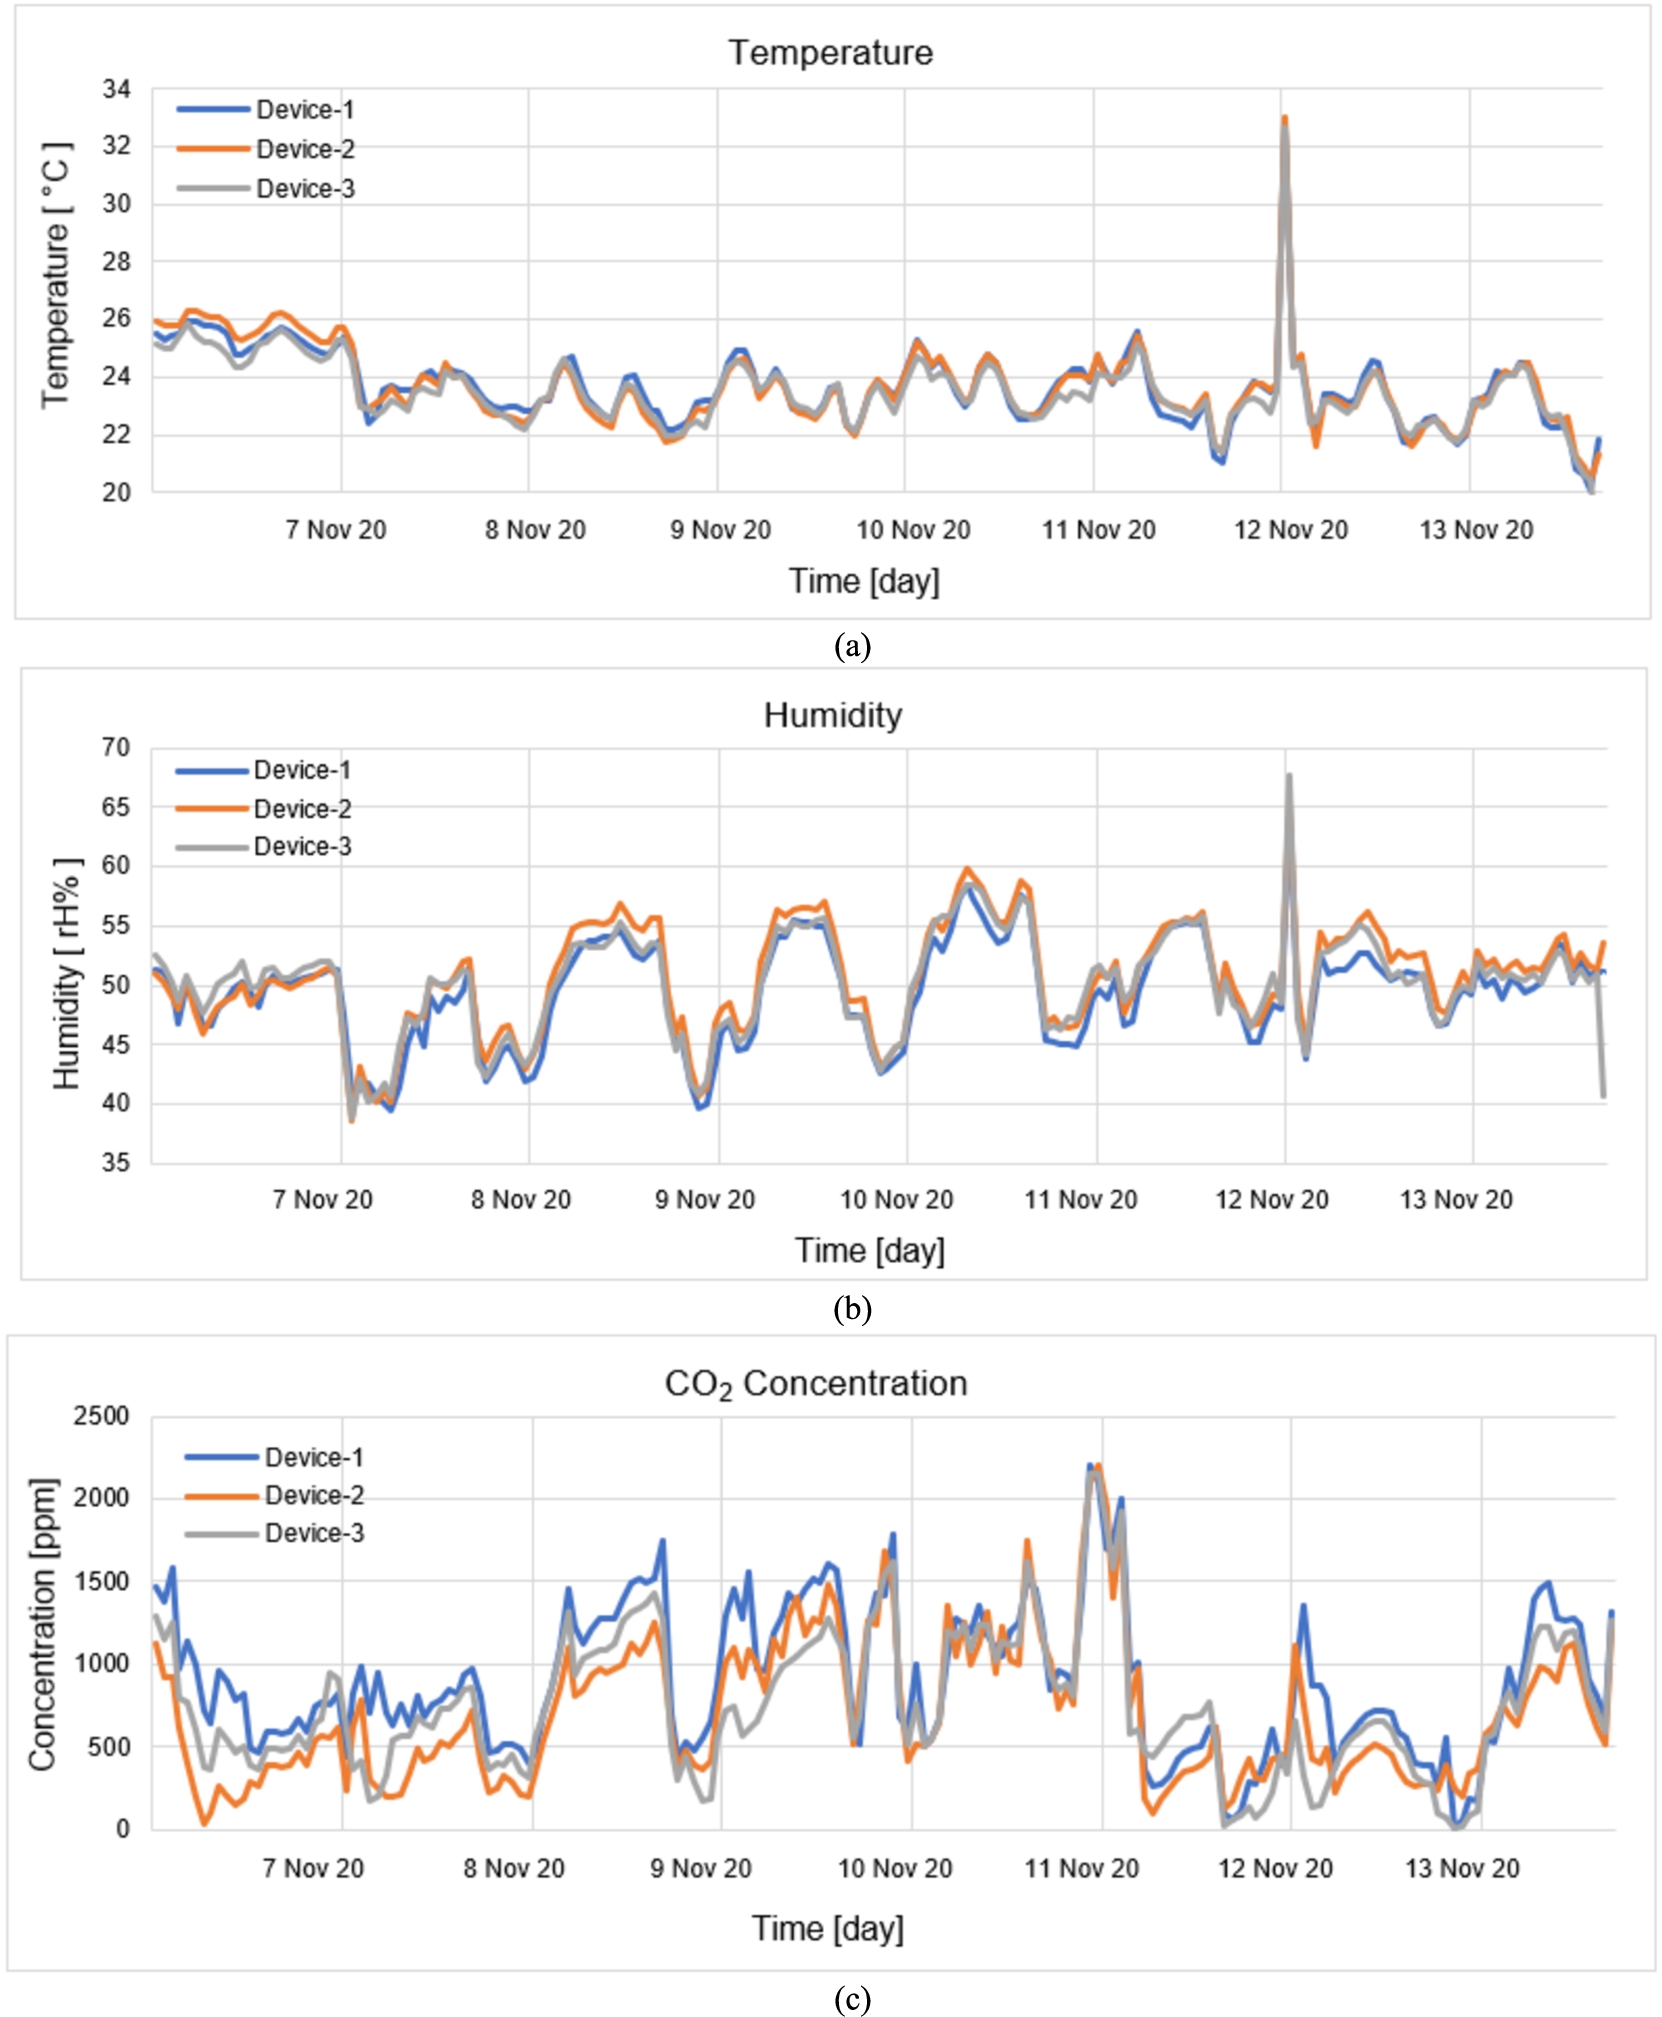
The hourly average values of temperature, humidity, and CO2 concentration taken from the air quality measurement devices for 1 week are observed in Fig. 9. Temperature, humidity, and CO2 values changed depending on indoor and natural ventilation conditions.
Fig. 10.
SLR graphs of the devices; (a) temperature; (b) humidity; (c) CO2 concentration.
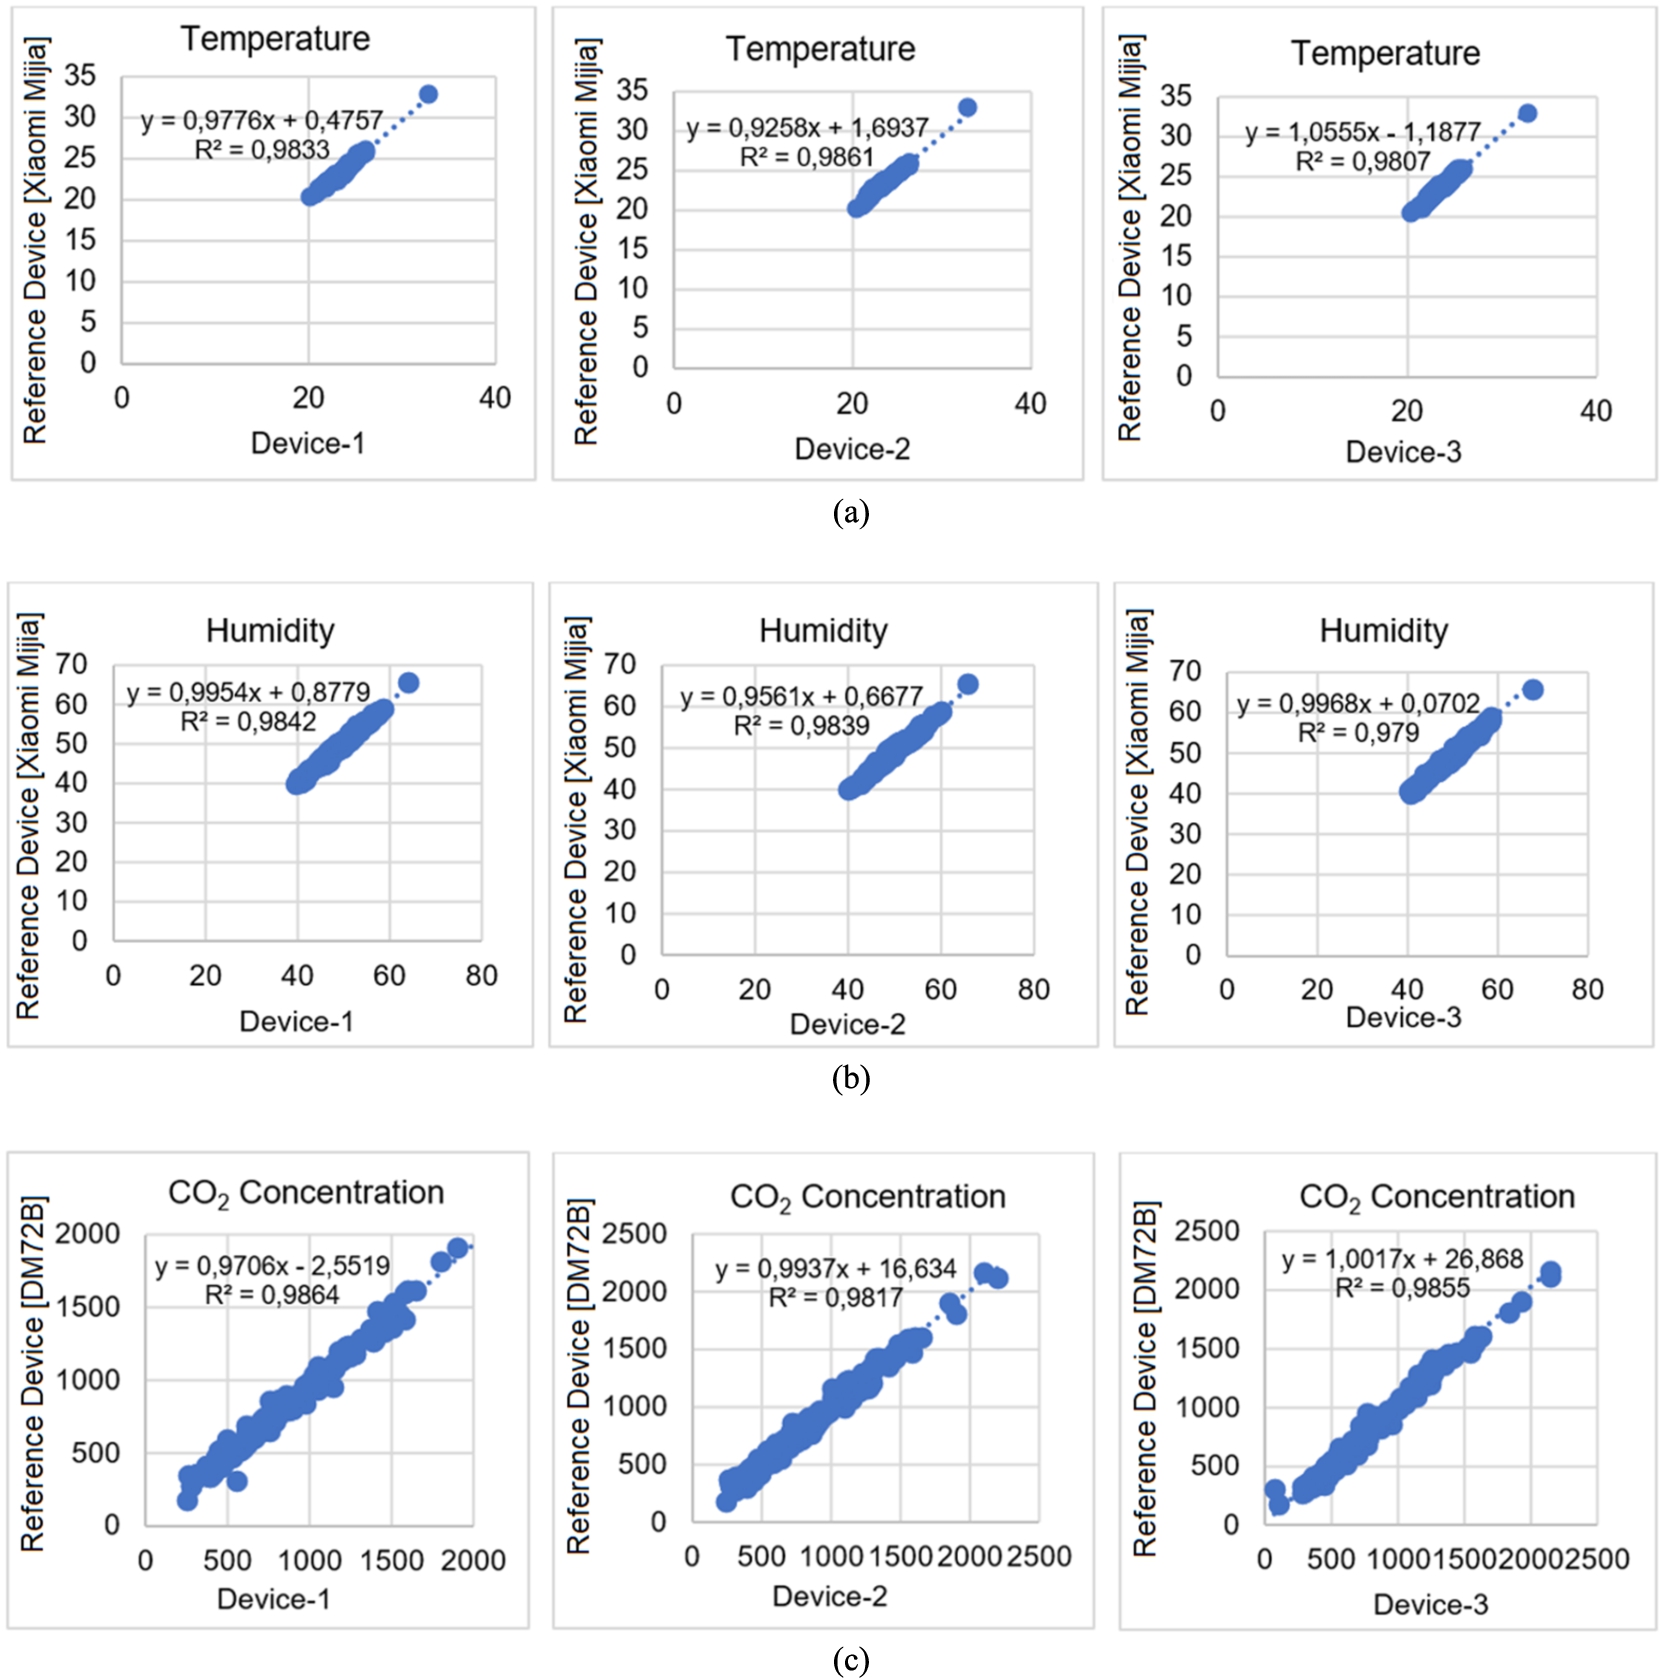
R-squared (R2) is the coefficient of determination representing the prediction performance for linear regression models. This metric explains the percentile volume of cases where the independent variable affects the dependent variable, showing the strength of the relationship between the independent variable and the dependent variable on a 0–100% scale from 0–1.
SLR graphs for temperature, humidity and CO2 concentration of air quality measuring devices are shown in Fig. 10. When the SLR graphs are examined, it is seen that the devices have high determination coefficients (
Fig. 11.
SLR graphics of the devices, (a)
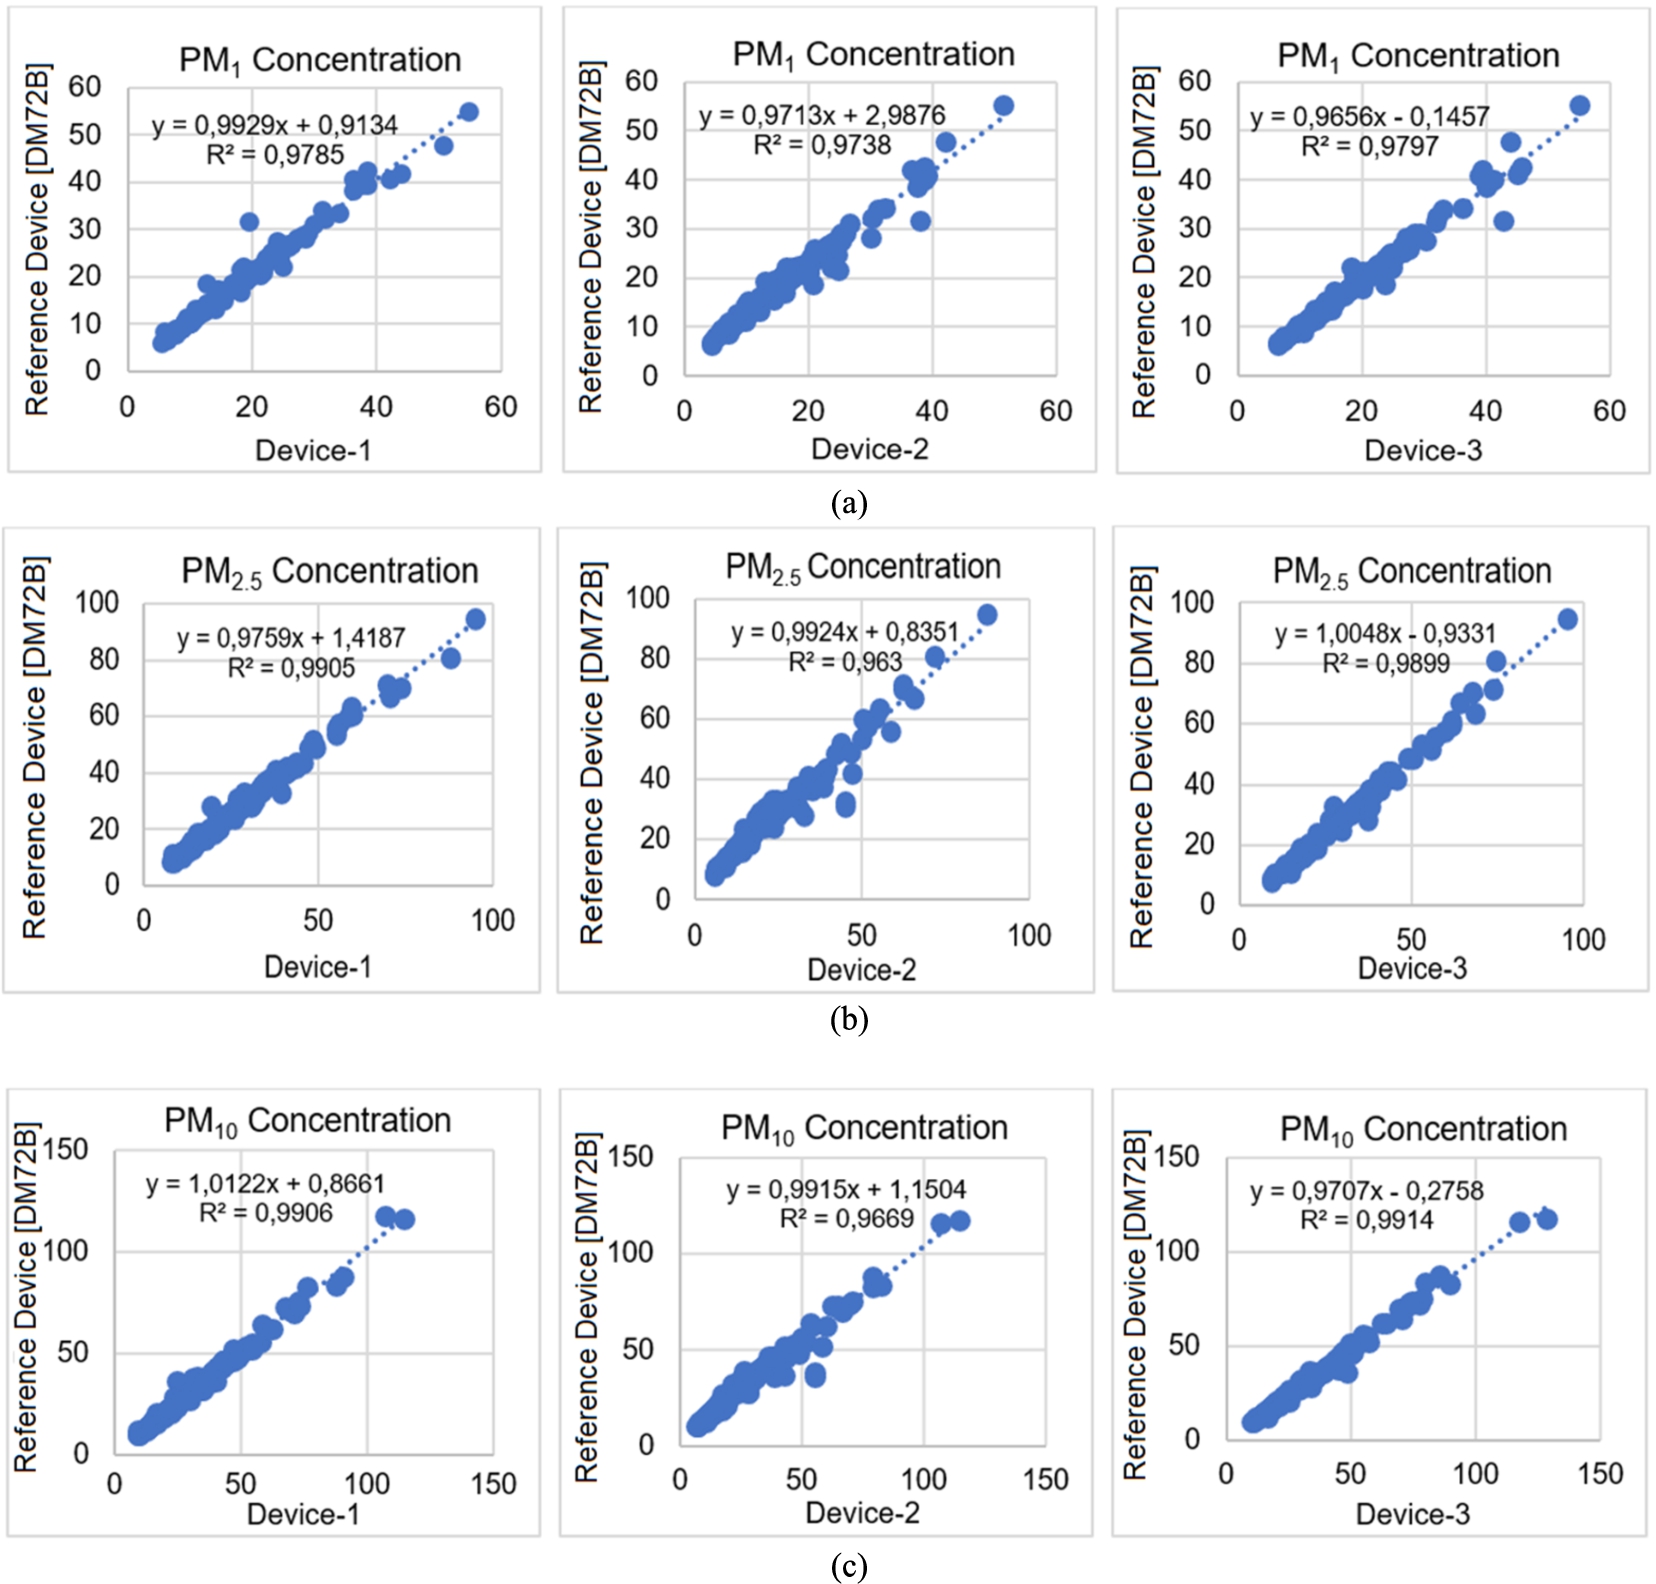
Figure 11 shows SLR graphs of PM concentrations for air quality measuring devices and reference devices. Similarly, the coefficient of determination for
The most significant difficulty in low-cost sensor technology is the reliability of the measurement data. The measurement data obtained from sensors that are not well calibrated will be insufficient for good IAQ planning. The calibration process was performed using the SLR equations obtained from the data of the reference and developed devices.
Fig. 12.
Calibrated PM concentrations of devices (a)
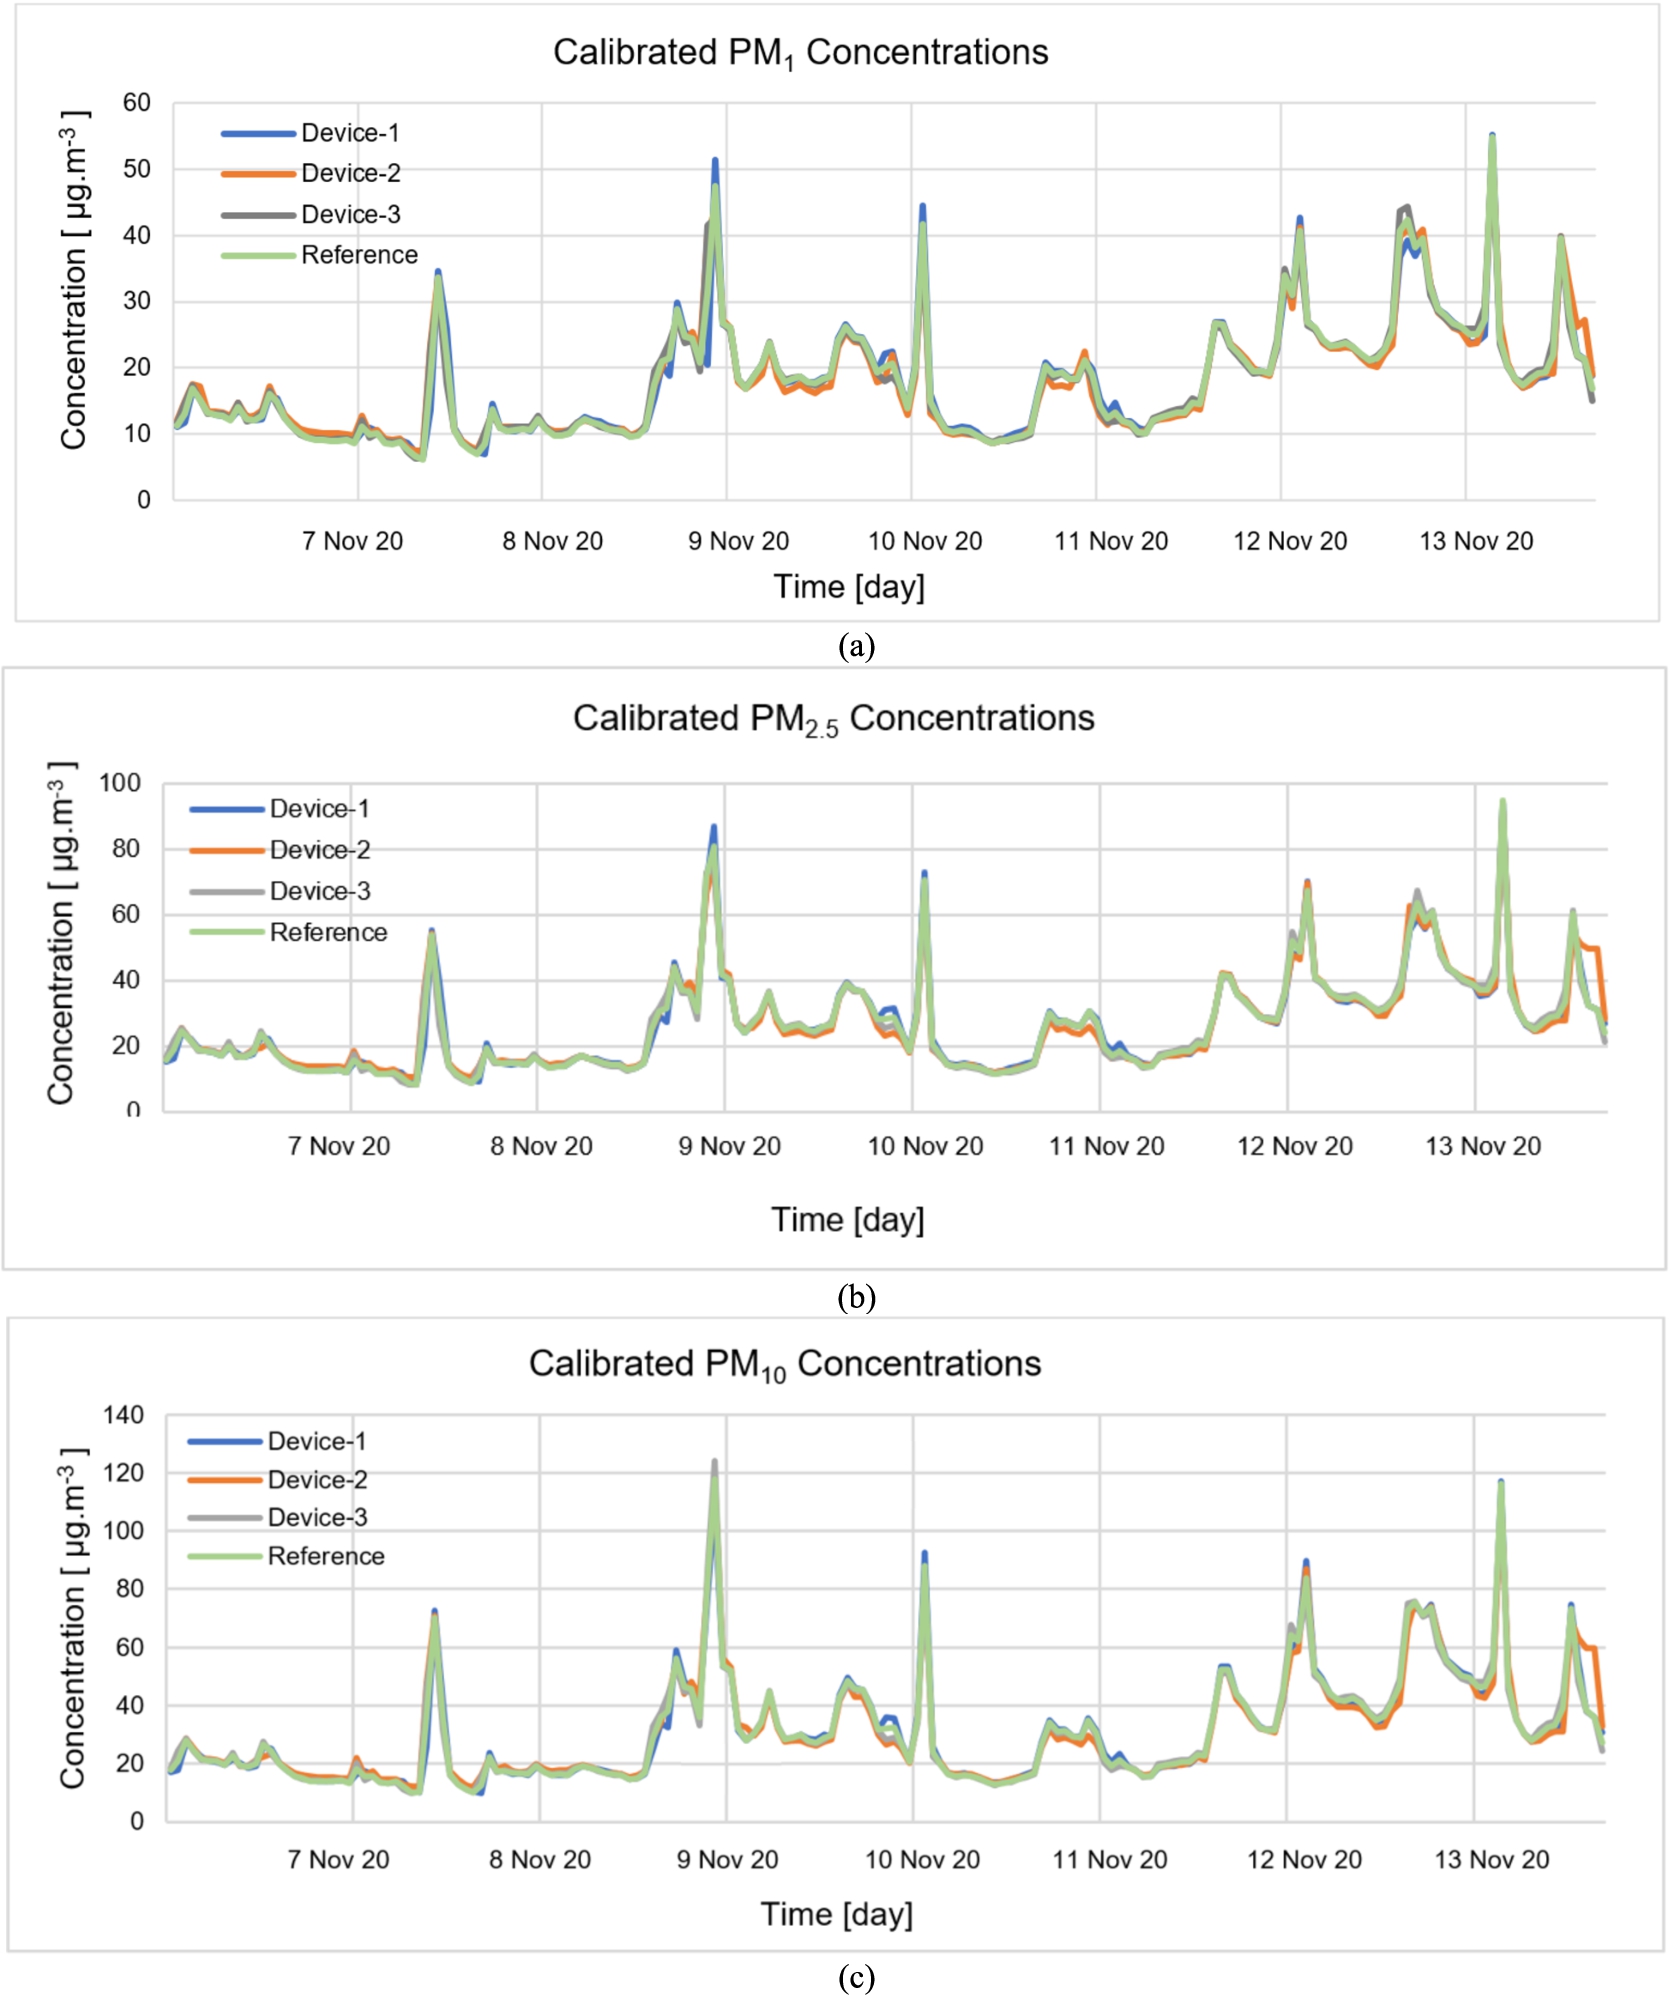
The
Fig. 13.
Calibrated air quality parameters of the devices (a) temperature; (b) humidity; (c) CO2 concentration.
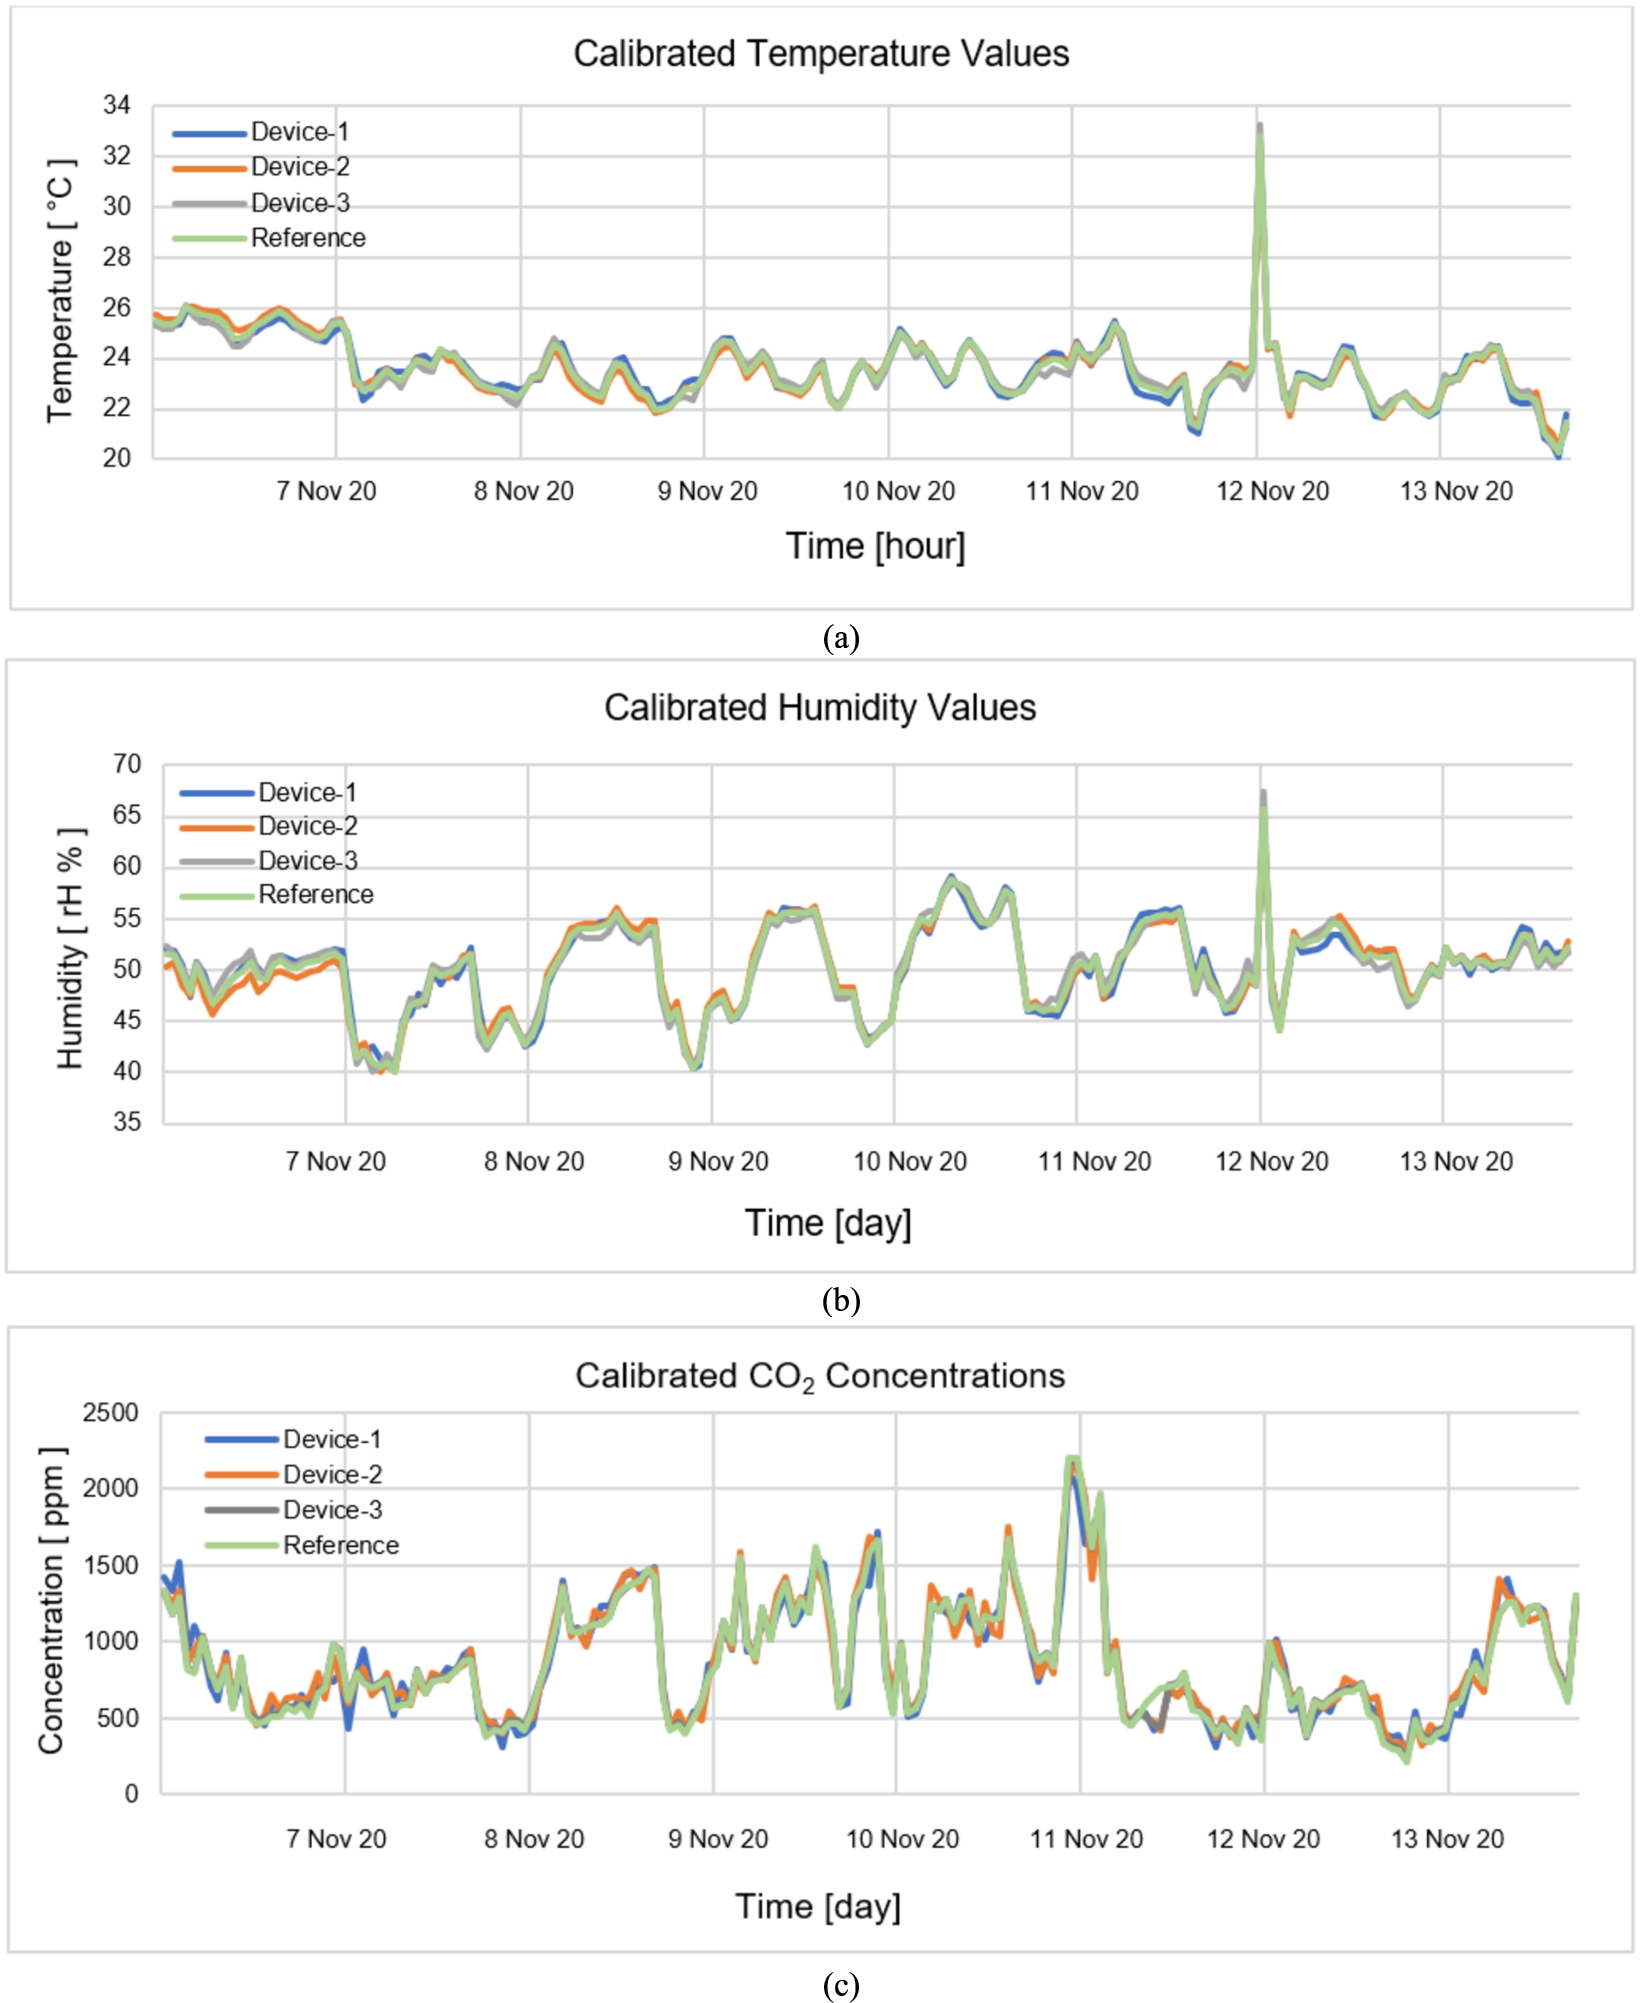
The temperature and humidity values of the calibrated devices and the Xiaomi Mijia temperature-humidity measurement device we used for reference are presented in Fig. 13(a), (b). Moreover, the CO2 concentration of the calibrated devices and the Dienmern DM72B reference device is observed in Fig. 13(c). Two of the calibrated devices were placed in the kitchen and bedroom inside the house, and the other was placed on the balcony of the house for outdoor measurements. The graphs of the data obtained from the devices for 3 days are shown in Figs 14, 15, 16, and Fig. 17.
Fig. 14.
Kitchen, bedroom, and outdoor
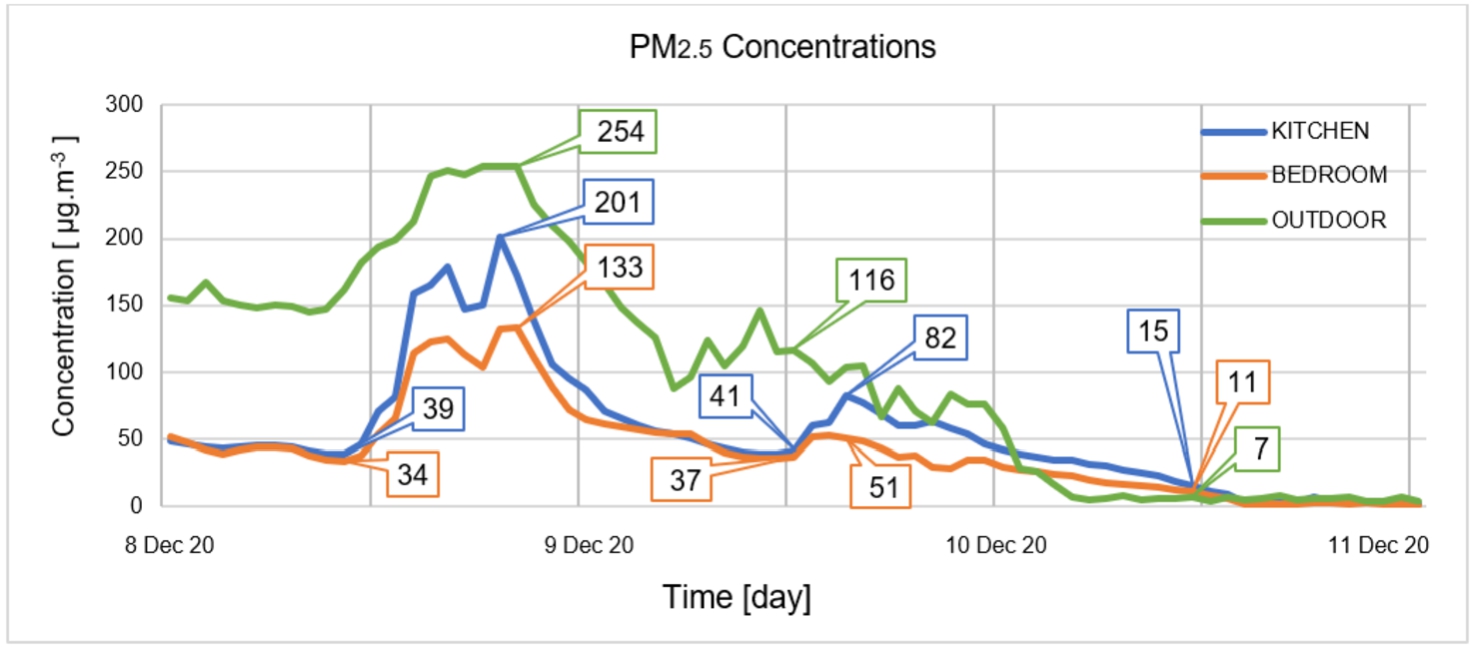
The
As a result of the natural ventilation in the kitchen and bedroom performed simultaneously on December 8, at 10 o’clock, a high increase in the
Fig. 15.
CO2 concentration changes in the kitchen, bedroom, and outdoor environment.
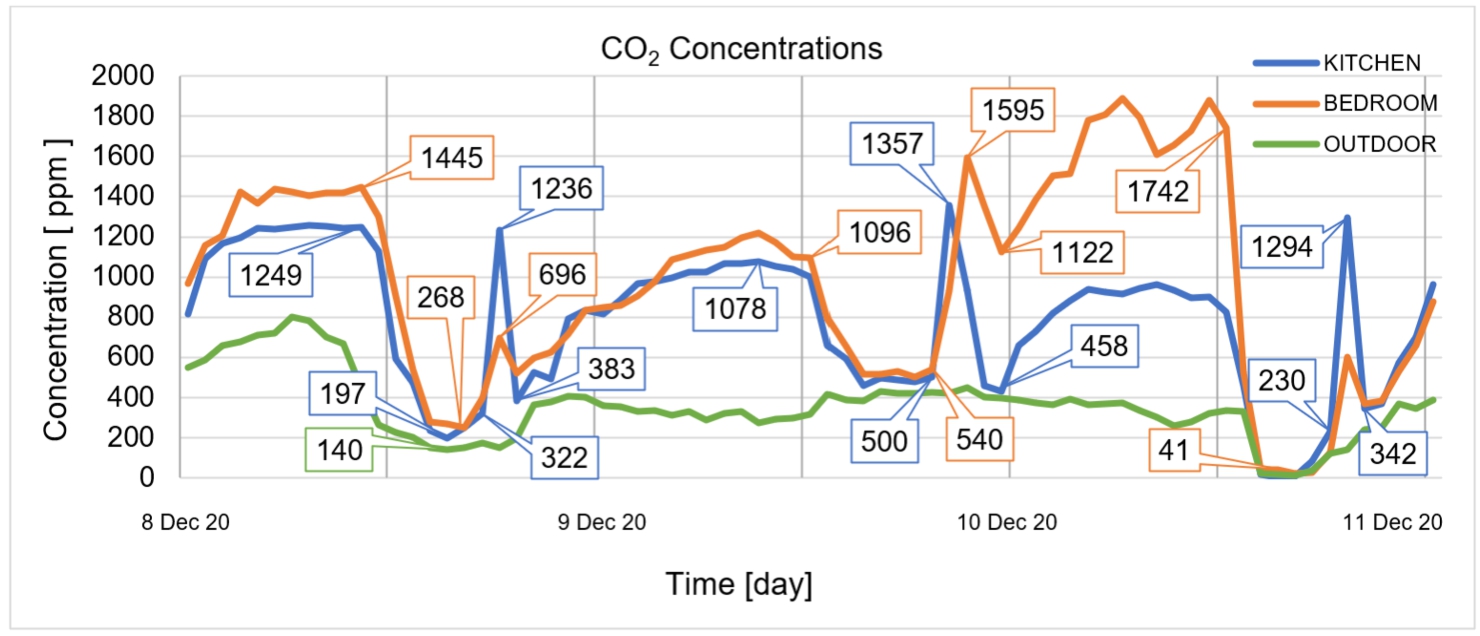
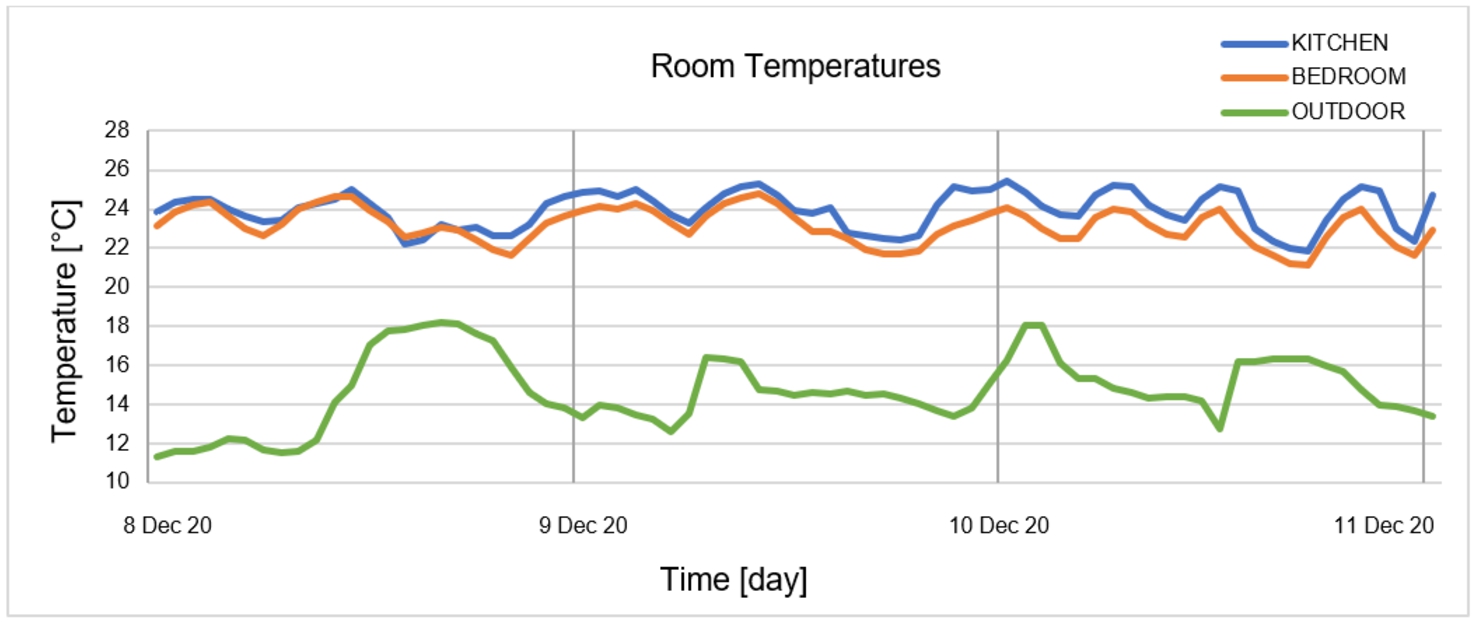
Fig. 16.
Temperature changes in the kitchen, bedroom, and outdoor environment.
The indoor and outdoor CO2 concentrations of the devices are observed in Fig. 15. It is observed that the indoor CO2 concentration values, which increased during the night on December 8, decreased as a result of the natural ventilation started at 11 o’clock. The CO2 concentrations, which were 1445 ppm in the bedroom and 1249 ppm in the kitchen before the natural ventilation, decreased to 218 ppm and 133 ppm, respectively, 2 hours after the start of the ventilation.
The indoor CO2 concentrations, which increased to 1096 ppm and 1078 ppm during the night in the bedroom and kitchen on December 9, decreased to 540 ppm and 500 ppm due to the natural ventilation in the morning. The CO2 concentration of the kitchen, which increased on the night of December 10, decreased from 1742 ppm to 41 ppm after the ventilation that started at 13 o’clock. The cooking activity in the kitchen directly affects CO2 concentration. The CO2 concentration in the kitchen, which was 322 ppm before the cooking activity started on December 8 at 18 o’clock, increased to 1236 ppm. Due to natural ventilation, the concentration decreased to 383 ppm. The CO2 concentration, which was 500 ppm before the cooking activity that started on December 9 at 19 o’clock, increased to 1357 ppm and decreased to 458 ppm at the end of the ventilation. Likewise, the CO2 concentration, which was 230 ppm before the cooking activity that started on December 10 at 18 o’clock, increased to 1294 ppm and decreased to 342 ppm at the end of the ventilation.
The CO2 concentration increasing due to the cooking activity in the kitchen directly affects other living spaces. On the evening of December 8, the bedroom CO2 concentration, which was 268 ppm before the cooking activity, increased to 696 ppm. Likewise, the CO2 concentration, which was 540 ppm before cooking on the evening of December 9, increased to 1595 ppm. As a result of the natural ventilation in the kitchen following the cooking activity, the CO2 concentration in the bedroom also decreased to 1122 ppm.
According to the results of the 3-day data analysis, it was determined that there was a strong correlation at r = 0.732 between the CO2 concentrations of the kitchen and bedroom. There is a strong correlation r = 0.626 between outdoor and kitchen CO2 concentrations, and a moderate correlation r = 0.537 between outdoor and bedroom. Due to natural ventilation, indoor CO2 concentration values decrease or increase directly depending on the outdoor CO2 concentration, similar to the indoor PM concentration. Therefore, we need to have information about outdoor PM and CO2 gas concentration before natural ventilation. Otherwise, instead of decreasing the indoor PM and CO2 gas concentration, we can inadvertently increase it.
The 3-day data graph of indoor and outdoor temperatures is observed in Fig. 16. The house where the data are collected is heated by a central heating system. There is a very strong positive correlation at r = 0.855 between kitchen and bedroom temperatures. Due to the cooking activity in the kitchen, the temperature is usually higher than in the bedroom. There is a low negative correlation at
Fig. 17.
Relative humidity changes in the kitchen, bedroom, and outdoor environment.
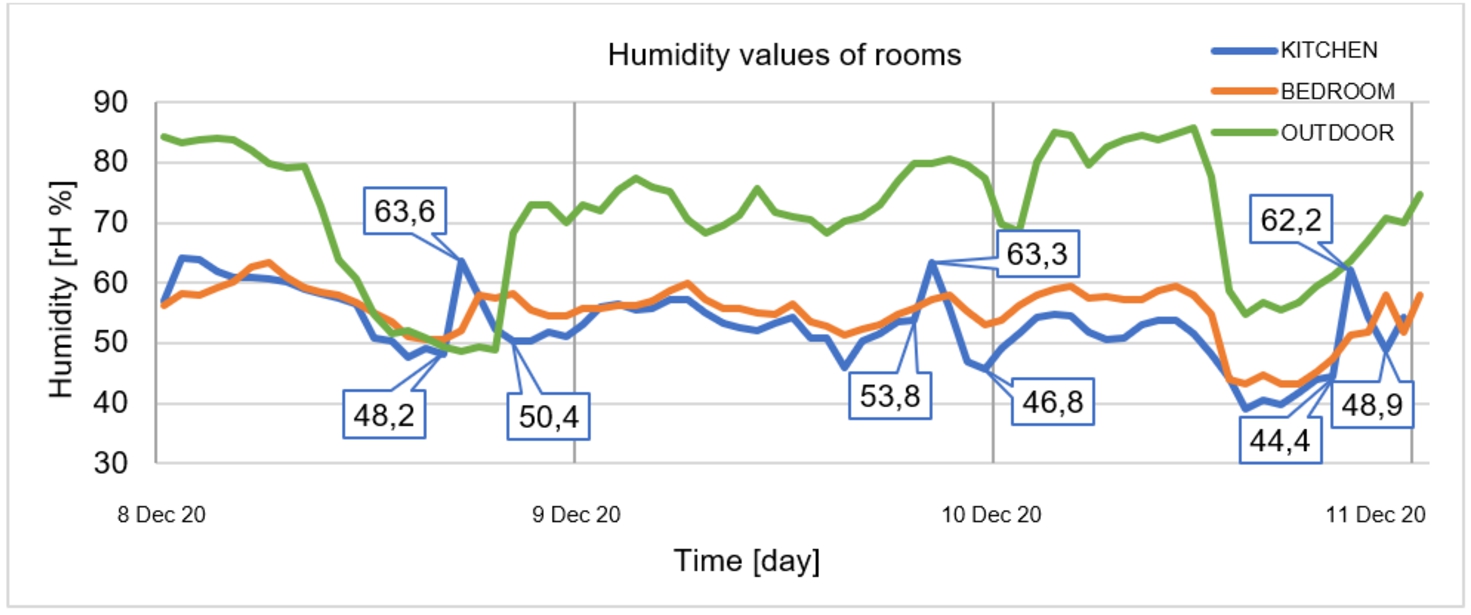
The graph of the indoor and outdoor relative humidity values is presented in Fig. 17. There is a strong positive correlation at (r = 0.748, p < 0.001) between the relative humidity values of the residential kitchen and bedroom where the data are collected. There is a strong correlation at r = 0.642 between the outdoor and bedroom relative humidity values and a moderate correlation at r = 0.429 between the outdoor and kitchen relative humidity values. It was observed that the relative humidity increased due to the cooking activity in the kitchen. The humidity value, which was 48.2 rH% in the kitchen before the cooking activity that started on December 8 at 18 o’clock, increased to 63.6 rH% during cooking, and as a result of the ventilation, the humidity value decreased to 50.4 rH%. The humidity value, which was 53.8 rH% in the kitchen before the cooking activity that started on December 9 at 19 o’clock, increased to 63.8 rH% during cooking, and as a result of the ventilation, the humidity decreased to 46.8 rH%. Likewise, the humidity value in the kitchen, which was 44.4 rH% before the cooking activity started on December 10 at 18 o’clock, increased to 62.2 rH% and decreased to 48.9 rH% as a result of the ventilation.
Table 3
Pearson correlation coefficient matrix of devices in indoor and outdoor environment (n = 72)
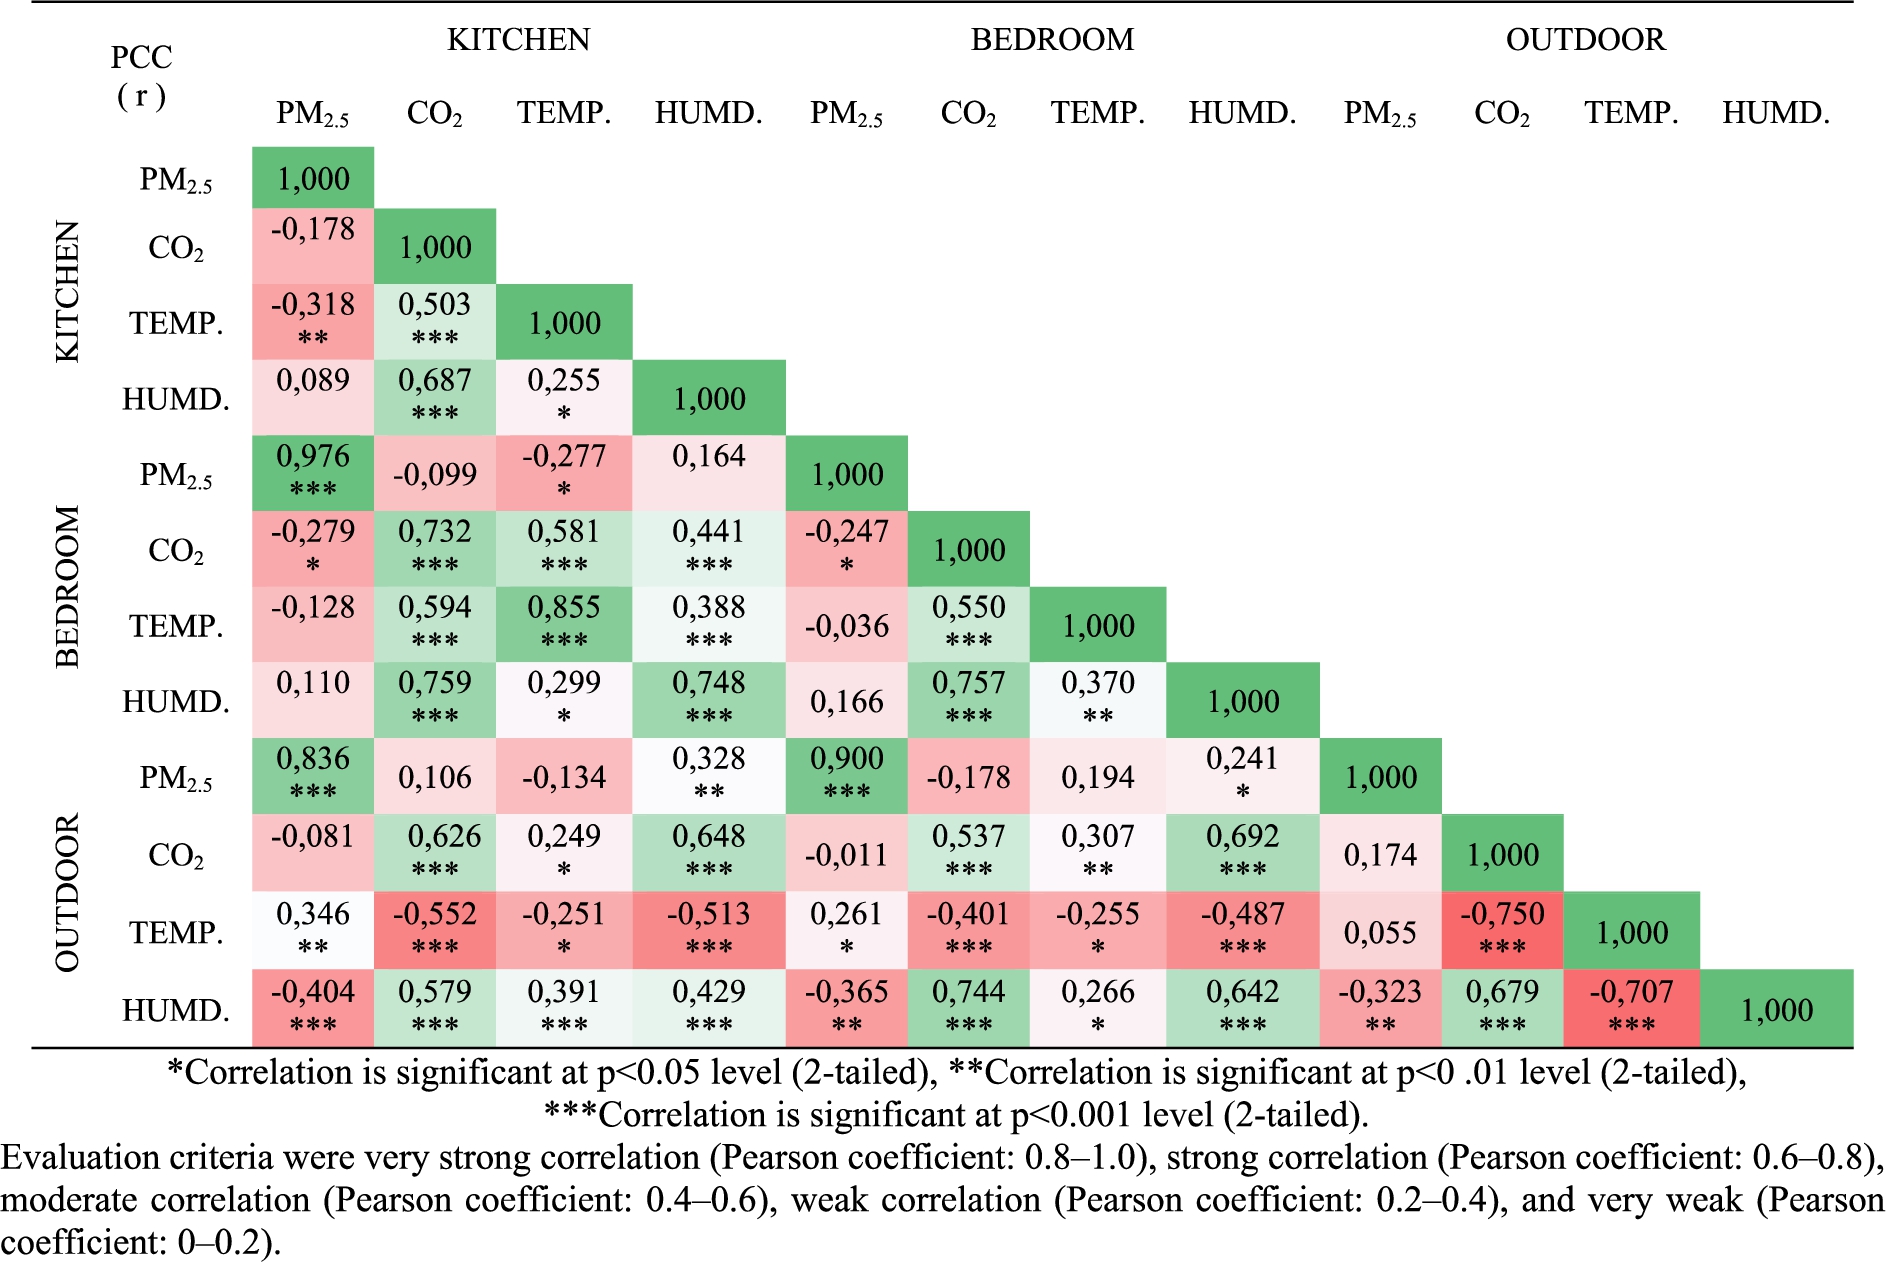
In Table 3, the PCC matrix of the data obtained from the devices placed in the kitchen, bedroom and balcony is given. The matrix obtained by bivariate Pearson analysis determines the strength of linear relationships between indoor and outdoor pollutant concentrations. The results in Table 3 show a very strong positive correlation of (r ⩾ 0.836, p < 0.001) between indoor and outdoor
Analysis of indoor data revealed that the IAQ frequently exceeded the limits considered normal for healthy daily living. It would be more convenient to place a sensor in each room of the house to better understand the IAQ of the whole house. In this way, the air quality interaction between the rooms can be revealed more clearly.
The improved mobile interface provides users with greater awareness of the IAQ, allowing them to view the IAQ as numeric values or as a time series. This study presents a low-cost IoT approach to monitoring IAQ. The results shows that low-cost sensors and IoT components may be sufficient to monitor and improve IAQ.
5.Conclusion
The majority of the people who spend most of their daily life indoors have very limited knowledge about the air quality of their environment. It is necessary to measure IAQ, which is especially important for the health of children and the elderly, and accordingly, necessary ventilation measures must be taken.
In this study, a real-time IoT-based IAQ measurement system, consisting of hardware prototypes for collecting air quality data such as temperature, humidity,
According to the analysis results obtained from the data, the inferences obtained from the proposed IoT-based IAQ monitoring system are as follows:
IAQ directly depends on the number of people in the household and activities of the house occupants.
Individual activities, e.g., cooking and sleeping, have a direct impact on PM and CO2 concentrations.
Outdoor PM concentrations during natural ventilation directly affect indoor PM concentrations.
In cases where outdoor PM concentration is high, professional ventilation systems should be preferred instead of natural ventilation in order to increase IAQ.
Indoor PMs is mainly composed of outside infiltration and cooking.
A very high positive correlation was observed between bedroom and kitchen
Due to the fact that the doors and windows were kept closed during the night and there was no additional ventilation system, the nightly CO2 concentration reached 1445, 1200 and 1850 ppm, respectively. These values are above 1000 ppm, which is accepted as the upper limit by most health commissions.
It has been observed that natural ventilation in the morning reduces indoor CO2 concentration by 2 to 6 times.
Increasing
There was a very strong correlation between kitchen and bedroom
During natural ventilation, high outdoor PM concentration increased indoor PM concentration up to 5 times.
The developed IoT-based air quality measurement devices provides a significant advantage with its low cost of $60, the use of open-source technologies, 1-minute measurement frequency and easy setup. Because of the usage of wireless technology for communication, the system provides ease of installation, configuration, and adding new devices. Furthermore, the proposed air quality measurement system contributes significantly to creating a healthy living environment. The poor air conditions detected by the measurement system are reported to users in real time, which enables them to create intervention plans. The results show that the proposed low-cost devices have sufficient potential to ensure indoor air quality.
Environmental factors such as temperature and humidity were not taken into account while calibrating the sensors. Measurements were taken only from the bedroom, kitchen and balcony. The effects of IAQ in other rooms to the kitchen and bedroom are not taken into account. IAQ measurement devices were not placed in the center of the rooms and the air was assumed to be homogeneous in the rooms.
The sensors used in the study were tested for values under normal conditions. A special environment has not been established where the minimum and maximum measurement limits will be tested. Since frying and baking processes were not carried out in the cooking activity, there was no significant increase in PM concentrations in the kitchen. Measurements were limited to only a few days and future work will cover longer time periods. Cleaning chemicals, vacuum cleaner, perfume and exercises significantly reduce indoor air quality. Measurement devices will be placed in each room and the effects of these personal activities on indoor air quality and other rooms will be analyzed. The sensors will be calibrated using MLR or high-dimensional models to increase measurement accuracy.
Conflict of interest
None to report.
References
[1] | https://www.winsen-sensor.com/d/files/infrared-gas-sensor/mh-z19b-co2-ver1_0.pdf, 2016 (accessed September 14, 2021). |
[2] | M.M. Abdel-Salam, Investigation of indoor air quality at urban schools in Qatar, Indoor and Built Environment 28: ((2019) ), 278–288. doi:10.1177/1420326X17700948. |
[3] | M.M.M. Abdel-Salam, Indoor exposure of elderly to air pollutants in residential buildings in Alexandria, Egypt, Building and Environment 219: ((2022) ), 109221. doi:10.1016/j.buildenv.2022.109221. |
[4] | S. Ahmadi, 5G NR: Architecture, Technology, Implementation, and Operation of 3GPP New Radio Standards, Academic Press, (2019) . |
[5] | AHT10 Integrated temperature and humidity sensor – sensor-temperature and humidity – Guangzhou Aosong Electronic Co., Ltd. Retrieved September 6, 2021, https://www.aosong.com/en/products-40.html. |
[6] | S. Alkobaisi, W.D. Bae, M. Horak, S. Narayanappa, J. Lee, E. AbuKhousa and D.J. Bae, Predictive and exposome analytics: A case study of asthma exacerbation management, Journal of Ambient Intelligence and Smart Environments 11: ((2019) ), 527–552. doi:10.3233/AIS-190540. |
[7] | M.J. Alonso, S. Wolf, R.B. Jørgensen, H. Madsen and H.M. Mathisen, A methodology for the selection of pollutants for ensuring good indoor air quality using the de-trended cross-correlation function, Building and Environment 209: ((2022) ), 108668. doi:10.1016/j.buildenv.2021.108668. |
[8] | P. Asha, L. Natrayan, B.T. Geetha, J.R. Beulah, R. Sumathy, G. Varalakshmi and S. Neelakandan, IoT enabled environmental toxicology for air pollution monitoring using AI techniques, Environmental Research 205: ((2022) ), 112574. doi:10.1016/j.envres.2021.112574. |
[9] | M. Badura, P. Batog, A. Drzeniecka-Osiadacz and P. Modzel, Regression methods in the calibration of low-cost sensors for ambient particulate matter measurements, SN Applied Sciences 1: ((2019) ), 1–11. doi:10.1007/s42452-019-0630-1. |
[10] | Beijing Plantower CO., Digital universal particle concentration sensor PMS7003 series data manual, 2016, https://www.espruino.com/datasheets/PMS7003.pdf. |
[11] | X. Chen and J. Huang, Combining particle filter algorithm with bio-inspired anemotaxis behavior: A smoke plume tracking method and its robotic experiment validation, Measurement 154: ((2020) ), 107482. doi:10.1016/j.measurement.2020.107482. |
[12] | G. Chiesa, S. Cesari, M. Garcia, M. Issa and S. Li, Multisensor IoT platform for optimising IAQ levels in buildings through a smart ventilation system, Sustainability 11: ((2019) ), 5777. doi:10.3390/su11205777. |
[13] | H. Chojer, P. Branco, F.G. Martins, M.C. Alvim-Ferraz and S.I.V. Sousa, Development of low-cost indoor air quality monitoring devices: Recent advancements, Science of The Total Environment 727: ((2020) ), 138385. doi:10.1016/j.scitotenv.2020.138385. |
[14] | M. Coccia, The effects of atmospheric stability with low wind speed and of air pollution on the accelerated transmission dynamics of COVID-19, International Journal of Environmental Studies 78: ((2021) ), 1–27. doi:10.1080/00207233.2020.1802937. |
[15] | H. Cooper, Y. Wang, S. Stamp, E. Burman and D. Mumovic, Use of portable air purifiers in homes: Operating behaviour, effect on indoor PM2.5 and perceived indoor air quality, Building and Environment 191: ((2021) ), 107621. doi:10.1016/j.buildenv.2021.107621. |
[16] | I. Demanega, I. Mujan, B.C. Singer, A.S. Anđelković, F. Babich and D. Licina, Performance assessment of low-cost environmental monitors and single sensors under variable indoor air quality and thermal conditions, Building and Environment 187: ((2021) ), 107415. doi:10.1016/j.buildenv.2020.107415. |
[17] | L. Deng, Y. Ma, P. Ma, Y. Wu, X. Yang and Q. Deng, Toxic effect of cooking oil fume (COF) on lungs: Evidence of endoplasmic reticulum stress in rat, Ecotoxicology and Environmental Safety 221: ((2021) ), 112463. doi:10.1016/j.ecoenv.2021.112463. |
[18] | P. deSouza and P.L. Kinney, On the distribution of low-cost PM2.5 sensors in the US: Demographic and air quality associations, Journal of Exposure Science & Environmental Epidemiology 31: ((2021) ), 514–524. doi:10.1038/s41370-021-00328-2. |
[19] | T.V. Dinh, J.Y. Lee, J.W. Ahn and J.C. Kim, Development of a wide-range non-dispersive infrared analyzer for the continuous measurement of CO2 in indoor environments, Atmosphere 11: ((2020) ), 1024. doi:10.3390/atmos11101024. |
[20] | D.K. Farmer, M. Pothier and J.M. Mattila, Analytical tools in indoor chemistry, in: Handbook of Indoor Air Quality, Springer Nature Singapore, Singapore, (2022) , pp. 1–23. doi:10.1007/978-981-10-5155-5_35-1. |
[21] | A. Florea, C. Lorint and C. Danciu, Particulate matters generated by caprisoara tailing pond and their impact on air quality, Environmental Engineering and Management Journal 18: ((2019) ), 803–810. doi:10.30638/eemj.2019.075. |
[22] | J. Gibson, R. Loddenkemper, B. Lundbäck and Y. Sibille, Respiratory Health and Disease in Europe: The New European Lung White Book, (2013) , pp. 559–563. |
[23] | K. Gladyszewska-Fiedoruk, Indoor air quality in the bedroom of a single-family house – A case study, Multidisciplinary Digital Publishing Institute Proceedings 16: ((2019) ), 38. doi:10.3390/proceedings2019016038. |
[24] | P. Han, H. Mei, D. Liu, N. Zeng, X. Tang, Y. Wang and Y. Pan, Calibrations of low-cost air pollution monitoring sensors for CO, NO2, O3, and SO2, Sensors 21: ((2021) ), 256. doi:10.3390/s21010256. |
[25] | J. Saini, M. Dutta and G. Marques, ADFIST: Adaptive dynamic fuzzy inference system tree driven by optimized knowledge base for indoor air quality assessment, Sensors 22: ((2022) ), 1008. doi:10.3390/s22031008. |
[26] | Kim, K. Kang and T. Kim, Measurement of particulate matter (PM2.5) and health risk assessment of cooking-generated particles in the kitchen and living rooms of apartment house, Sustainability 10: ((2018) ), 843. doi:10.3390/su10030843. |
[27] | P. Kumar, S. Hama, R.A. Abbass, T. Nogueira, V.S. Brand, H.W. Wu and S.S. Nagendra, In-kitchen aerosol exposure in twelve cities across the globe, Environment International 162: ((2022) ), 107155. doi:10.1016/j.envint.2022.107155. |
[28] | H.Y. Liu, P. Schneider, R. Haugen and M. Vogt, Performance assessment of a low-cost PM2.5 sensor for a near four-month period in Oslo, Atmosphere 10: ((2019) ), 41. doi:10.3390/atmos10020041. |
[29] | M. Malakootian and A. Mohammadi, Estimating health impact of exposure to PM2.5, NO2 and O3 using |
[30] | W. Mao, W. Wang, L. Jiao, S. Zhao and A. Liu, Modeling air quality prediction using a deep learning approach: Method optimization and evaluation, Sustainable Cities and Society 65: ((2021) ), 102567. doi:10.1016/j.scs.2020.102567. |
[31] | G. Marques, C.R. Ferreira and R. Pitarma, Indoor air quality assessment using a CO2 monitoring system based on Internet of Things, Journal of Medical Systems 43: ((2019) ), 1–10. doi:10.1007/s10916-019-1184-x. |
[32] | G. Marques, N. Miranda, A. Kumar Bhoi, B. Garcia-Zapirain, S. Hamrioui and I. de la Torre Díez, Internet of Things and enhanced living environments: Measuring and mapping air quality using cyber-physical systems and mobile computing technologies, Sensors 20: ((2020) ), 720. doi:10.3390/s20030720. |
[33] | G. Marques and R. Pitarma, Monitoring health factors in indoor living environments using Internet of things, in: World Conference on Information Systems and Technologies, (2019) , pp. 785–794. doi:10.1007/978-3-319-56538-5_79. |
[34] | G. Marques and R. Pitarma, A cost-effective air quality supervision solution for enhanced living environments through the Internet of things, Electronics 8: ((2019) ), 170. doi:10.3390/electronics8020170. |
[35] | G. Marques, C. Roque Ferreira and R. Pitarma, A system based on the Internet of Things for real-time particle monitoring in buildings, International Journal of Environmental Research and Public Health 15: ((2018) ), 821. doi:10.3390/ijerph15040821. |
[36] | M. Marufuzzaman, T. Tumbraegel, L.F. Rahman and L.M. Sidek, A machine learning approach to predict the activity of smart home inhabitant, Journal of Ambient Intelligence and Smart Environments 13: ((2021) ), 271–283. doi:10.3233/AIS-210604. |
[37] | T.M. Mata, F. Felgueiras, A.A. Martins, H. Monteiro, M.P. Ferraz, G.M. Oliveira and G.V. Silva, Indoor air quality in elderly centers: Pollutants emission and health effects, Environments 9: ((2022) ), 86. doi:10.3390/environments9070086. |
[38] | Y. Men, J. Li, X. Liu, Y. Li, K. Jiang, Z. Luo and G. Shen, Contributions of internal emissions to peaks and incremental indoor PM2.5 in rural coal use households, Environmental Pollution 288: ((2021) ), 117753. doi:10.1016/j.envpol.2021.117753. |
[39] | I. Mujan, D. Ličina, M. Kljajić, A. Čulić and A.S. Anđelković, Development of indoor environmental quality index using a low-cost monitoring platform, Journal of Cleaner Production 312: ((2021) ), 127846. doi:10.1016/j.jclepro.2021.127846. |
[40] | N.U. Okafor, Y. Alghorani and D.T. Delaney, Improving data quality of low-cost IoT sensors in environmental monitoring networks using data fusion and machine learning approach, ICT Express 6: ((2020) ), 220–228. doi:10.1016/j.icte.2020.06.004. |
[41] | S. Pallarés, E. Gómez, A. Martínez and M.M. Jordán, The relationship between indoor and outdoor levels of PM10 and its chemical composition at schools in a coastal region in Spain, Heliyon 5: (8) ((2019) ), e02270. doi:10.1016/j.heliyon.2019.e02270. |
[42] | M.C. Pietrogrande, L. Casari, G. Demaria and M. Russo, Indoor air quality in domestic environments during periods close to Italian COVID-19 lockdown, International Journal of Environmental Research and Public Health 18: (8) ((2021) ), 4060. doi:10.3390/ijerph18084060. |
[43] | E. Png, S. Srinivasan, K. Bekiroglu, J. Chaoyang, R. Su and K. Poolla, An Internet of things upgrade for smart and scalable heating, ventilation and air-conditioning control in commercial buildings, Applied Energy 239: ((2019) ), 408–424. doi:10.1016/j.apenergy.2019.01.229. |
[44] | K.L. Raju and V. Vijayaraghavan, IoT technologies in agricultural environment: A survey, Wireless Personal Communications 113: ((2021) ), 2415–2446. doi:10.1007/s11277-020-07334-x. |
[45] | K. Sai, S.R. Subbareddy and A.K. Luhach, IOT based air quality monitoring system using MQ135 and MQ7 with machine learning analysis, Scalable Computing: Practice and Experience 20: ((2019) ), 599–606. doi:10.12694/scpe.v20i4.1561. |
[46] | J. Saini, M. Dutta and G. Marques, Indoor air quality prediction systems for smart environments: A systematic review, Journal of Ambient Intelligence and Smart Environments 12: ((2020) ), 433–453. doi:10.3233/AIS-200574. |
[47] | J. Saini, M. Dutta and G. Marques, Indoor air quality monitoring systems and COVID-19, in: Emerging Technologies During the Era of COVID-19 Pandemic, Studies in Systems, Decision and Control, Vol. 348: , Springer, Cham, (2021) , pp. 133–147. doi:10.1007/978-3-030-67716-9_9. |
[48] | R. Salis, M. Abadie, P. Wargocki and C. Rode, Towards the definition of indicators for assessment of indoor air quality and energy performance in low-energy residential buildings, Energy and Buildings 152: ((2017) ), 492–502. doi:10.1016/j.enbuild.2017.07.054. |
[49] | D. Sarkar and S.K. Gunturi, Online health status monitoring of high voltage insulators using deep learning model, The Visual Computer ((2021) ), 1–12. doi:10.1007/s00371-021-02308-x. |
[50] | A. Schieweck, E. Uhde, T. Salthammer, L.C. Salthammer, L. Morawska, M. Mazaheri and P. Kumar, Smart homes and the control of indoor air quality, Renewable and Sustainable Energy Reviews 94: ((2018) ), 705–718. doi:10.1016/j.rser.2018.05.057. |
[51] | Q. Shi, Y. Yang, Z. Sun and C. Lee, Progress of advanced devices and Internet of Things systems as enabling technologies for smart homes and health care, ACS Materials Au 2: ((2022) ), 394–435. doi:10.1021/acsmaterialsau.2c00001. |
[52] | K.R. Smith, P.M. Edwards, P.D. Ivatt, J.D. Lee, F. Squires, C. Dai and A.C. Lewis, An improved low-power measurement of ambient NO2 and O3 combining electrochemical sensor clusters and machine learning, Atmospheric Measurement Techniques 12: (2) ((2019) ), 1325–1336. doi:10.5194/amt-12-1325-2019. |
[53] | M. Taştan, An IoT based air quality measurement and warning system for ambient assisted living, European Journal of Science and Technology 16: ((2019) ), 960–968. doi:10.31590/ejosat.607434. |
[54] | M. Taştan and H. Gökozan, An Internet of Things based air conditioning and lighting control system for smart home, American Scientific Research Journal for Engineering, Technology and Sciences 50: ((2018) ), 181–189. |
[55] | M. Taştan and H. Gökozan, Real-time monitoring of indoor air quality with Internet of Things-based E-nose, Applied Sciences 9: ((2019) ), 3435. doi:10.3390/app9163435. |
[56] | E. Tello-Leal and B.A. Macías-Hernández, Association of environmental and meteorological factors on the spread of COVID-19 in Victoria, Mexico, and air quality during the lockdown, Environmental Research 196: ((2021) ), 110442. doi:10.1016/j.envres.2020.110442. |
[57] | B. Tian, K.M. Hou, X. Diao, H. Shi, H. Zhou and W. Wang, Environment-adaptive calibration system for outdoor low-cost electrochemical gas sensors, IEEE Access 7: ((2019) ), 62592–62605. doi:10.1109/ACCESS.2019.2916826. |
[58] | P. Tiwari, V. Garg and R. Agrawal, Changing world: Smart homes review and future, in: Smart IoT for Research and Industry, Springer, Cham, (2022) , pp. 145–160. doi:10.1007/978-3-030-71485-7_9. |
[59] | D.B. Topalović, M.D. Davidović, M. Jovanović, A. Bartonova, Z. Ristovski and M. Jovašević-Stojanović, In search of an optimal in-field calibration method of low-cost gas sensors for ambient air pollutants: Comparison of linear, multilinear and artificial neural network approaches, Atmospheric Environment 213: ((2019) ), 640–658. doi:10.1016/j.atmosenv.2019.06.028. |
[60] | S. Ujager, A. Mahmood and S. Khatoon, Wellness determination of the elderly using spatio-temporal correlation analysis of daily activities, Journal of Ambient Intelligence and Smart Environments 11: ((2019) ), 515–526. doi:10.3233/AIS-190538. |
[61] | US EPA, Why indoor air quality is important to schools, 2015, https://www.epa.gov/iaq-schools/why-indoor-air-quality-important-schools. |
[62] | E.D. Vicente, A.M. Vicente, M. Evtyugina, F.I. Oduber, F. Amato, X. Querol and C. Alves, Impact of wood combustion on indoor air quality, Science of The Total Environment 705: ((2020) ), 135769. doi:10.1016/j.scitotenv.2019.135769. |
[63] | World Health Organization, How air pollution is destroying our health. World Health Organization, Geneva, 2018. |
[64] | F. Wortmann and K. Flüchter, Internet of Things, Business & Information Systems Engineering 57: ((2015) ), 221–224. doi:10.1007/s12599-015-0383-3. |
[65] | Y. Zhang, W. Yu, Y. Li and H. Li, Comparative research on the air pollutant prevention and thermal comfort for different types of ventilation, Indoor and Built Environment 30: ((2021) ), 1092–1105. doi:10.1177/1420326X20925521. |
[66] | W. Zhao, J. Jiang, H. Qin, X. Li and J. Li, Machine learning based soft sensor and long-term calibration scheme: A solid oxide fuel cell system case, International Journal of Hydrogen Energy 46: ((2021) ), 17322–17342. doi:10.1016/j.ijhydene.2021.02.134. |
[67] | Z. Zhu, B. Chen, Y. Zhao and Y. Ji, Multi-sensing paradigm based urban air quality monitoring and hazardous gas source analyzing: A review, Journal of Safety Science and Resilience 2: ((2021) ), 131–145. doi:10.1016/j.jnlssr.2021.08.004. |


