
An improved method for recognizing pediatric epileptic seizures based on advanced learning and moving window technique
Abstract
In this work, advanced learning and moving window-based methods have been used for epileptic seizure detection. Epilepsy is a disorder of the central nervous system and roughly affects 50 million people worldwide. The most common non-invasive tool for studying the brain activity of an epileptic patient is the electroencephalogram. Accurate detection of seizure onset is still an elusive work. Electroencephalogram signals belonging to pediatric patients from Children’s Hospital Boston, Massachusetts Institute of Technology have been used in this work to validate the proposed method. For determining between seizure and non-seizure signals, feature extraction techniques based on time-domain, frequency domain, time-frequency domain have been used. Four different methods (decision tree, random forest, artificial neural network, and ensemble learning) have been studied and their performances have been compared using different statistical measures. The test sample technique has been used for the validation of all seizure detection methods. The results show better performance by random forest among all the four classifiers with an accuracy, sensitivity, and specificity of 91.9%, 94.1%, and 89.7% respectively. The proposed method is suggested as an improved method because it is not channel specific, not patient specific and has a promising accuracy in detecting epileptic seizure.
1.Introduction
Epilepsy is a chronic disease of the brain that is not transmissible directly from one person to another but is known to have affected nearly 50 million people around the globe including children [6]. Even though antiepileptic drugs are available for treatment but roughly 20–30% of patients are impervious to the medication [21]. A seizure is a sudden event, thus monitoring and identification of seizure is significant for decision making and designing of efficient automated seizure detection models. Over the years, to understand the neuronal activity of the brain, electroencephalogram (EEG) has been referred to by authors and researchers be it long EEG recordings [7], or short-term EEG videos [13]. In the investigation of EEG recordings for epileptic seizures, automatic seizure detection systems can assist as a valuable tool in a computationally effective and unbiased way. The foremost purpose of such automated systems lies in discerning seizure data from non-seizure data recordings. These automated seizure detection systems when implemented with sensors will increase the quality of life of patients suffering from intractable epilepsy [38]. Generally, the inputs given to such systems are features extracted from raw EEG signals. Feature extraction constitutes a major part of the signal processing of EEG recordings [1,4,14,28,35,40]. Optimization of the feature extraction process [27] is necessary for application in real-life scenarios [11,26] as a substantial amount of time is required to extract relevant features.
Most of the work suggested for epilepsy detection revolves around epilepsy instead of pediatric epilepsy. Detection of pediatric epileptic seizure is difficult in nature and studies tend to concentrate on patient specific approach [8,17,32,34,37,41]. Few works focused on channel specific approach [8,39] instead of generalized approach. In other suggested literatures, the accuracy of detection is not as promising [34,41]. Hence the objective of this study is to design an improved method to overcome the above-mentioned drawbacks and to make the work more comprehensive in nature. The proposed method is improved in terms of generalized approach which is not patient specific, not channel specific and with better accuracy and lower false detection rate.
A complete epileptic seizure detection system requires advance machine learning algorithms apart from feature extraction techniques. Different literature [2,3,5,10,12,20,36] have discussed the use of traditional as well as deep learning methods [16] for designing EEG-based seizure detection systems. As features play an integral part in seizure detection, therefore mean, standard deviation, energy [22], discrete Fourier transform [31], and discrete wavelet transformation [25] have been used in this work to obtain relevant features from the original EEG signals. These features have been linked to four different machine learning methods – artificial neural network, decision tree, random forest, and ensemble learning for distinguishing seizure data from non-seizure data. The performance of individual features, as well as classifiers, has been statistically evaluated and analyzed. This analysis helped in determining the most effective and reliable method for seizure detection. The proposed method has been analyzed on the Children’s Hospital Boston, Massachusetts Institute of Technology (CHB-MIT) dataset as well as validated using the Sleep-Wake-Epilepsy-Center (SWEC) of the University Department of Neurology at the Inselspital Bern and the Integrated Systems Laboratory of the ETH Zurich. The structure of the paper is as follows; Section 2 covers the general overview of the proposed comparison study along with different feature extraction methods and classifiers used along with their complexity analysis, Section 3 contains the results obtained for patient-specific as well as a generalized approach for CHB-MIT dataset. In Section 4, results of seizure detection method with SWEC dataset have been discussed. A detailed discussion and comparison study are presented in Section 5 followed by the conclusion in Section 6.
2.The proposed method for epileptic seizure detection
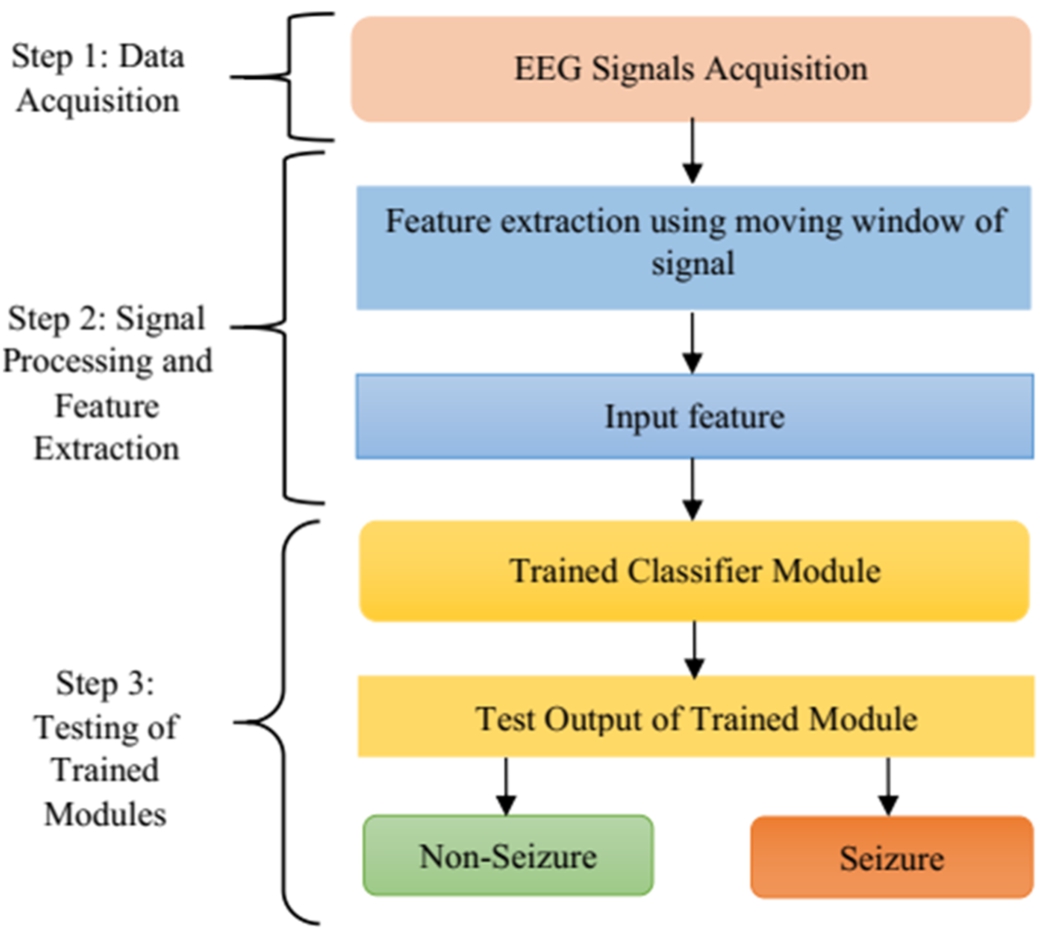
As the objective of the work is to improve the pediatric epileptic seizure detection method, it is important to select suitable techniques and design the method appropriately to achieve good performance in seizure detection. The proposed seizure detection framework is divided into different stages as shown in Fig. 1. The first stage of the proposed method is the selection of input and input data acquisition. Two suitable datasets have been chosen for the proposed work – CHB-MIT and SWEC dataset. The second stage is extraction of suitable features and finally the selection of appropriate features that help in decision-making. In this regard, five suitable methods such as mean, standard deviation, energy, DWT and DFT has been chosen. The last stage is the use of the obtained features for the process of classification as the main aim of epilepsy seizure detection is to differentiate between non-seizure and seizure. Four classifiers such as ANN, DT, RF and ensemble learning have been chosen for detection of seizure. Each step has been described in detail in subsequent sub-sections given below.
Fig. 1.
Schematic diagram of various stages of the proposed method.
2.1.Using CHB-MIT dataset
2.1.1.Selection of input
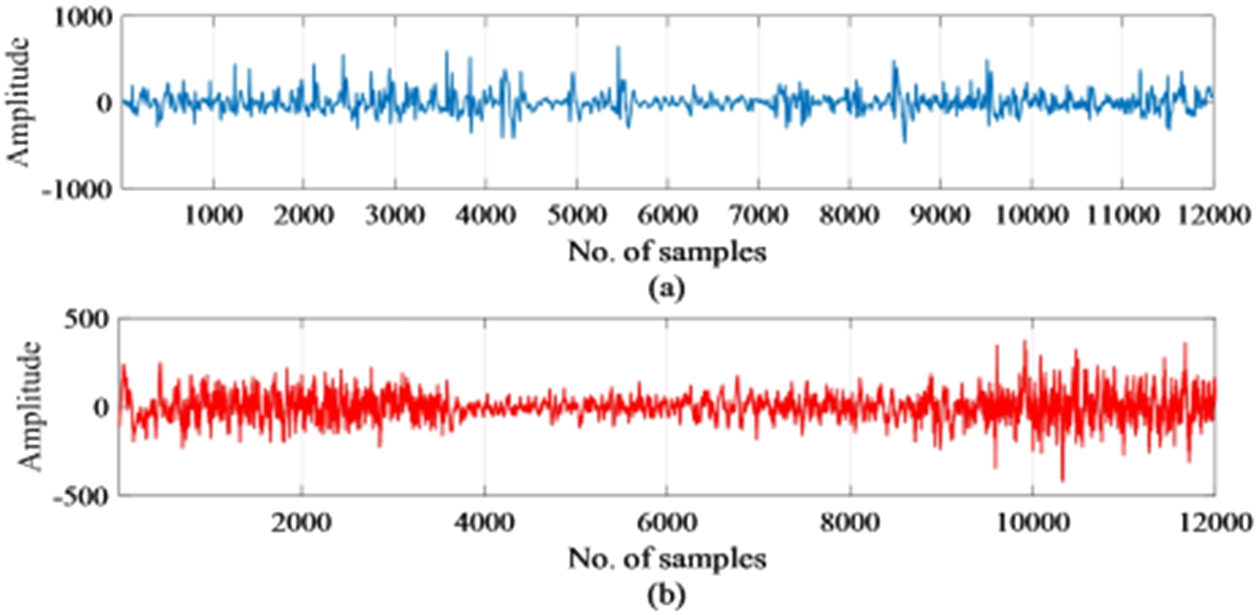
The first step of any type of detection method is to select the inputs that will be used for detection. It is presumed that right from the early stage, brain activity continues lifelong and they are representative of not only the brain function but of the condition of the entire body. An electroencephalogram (EEG) helps in measuring and understanding brain activity during an epilepsy seizure attack. In this work, EEG signals have been chosen as input for the detection of epilepsy. The data set considered in this work consist of scalp EEG recordings of 10 pediatric patients between the ages of 1.5 years to 15 years suffering from intractable seizures. The data set belongs to patients from the Children’s Hospital Boston Massachusetts (CHB-MIT) [24] and Table 1 shows the details of the dataset. This work used EEG signals of 10 patients (chb01, chb02, chb03, chb05, chb06, chb07, chb08, chb10, chb23, and chb24) out of the 24 patients for substantiating the proposed method. The goal here is to develop a generalized EEG seizure detector that is not patient-specific or channel-specific. The 10 patients as suggested above have 23 channels with the same electrode placement throughout the recording. Hence, EEG recordings of these patients are considered for validation of the proposed method. Each file contained one to a maximum of four seizures that were recorded using the bipolar placement of electrodes according to the 10–20 international electrode placement and were sampled at 256 Hz at 16-bit resolution. The onset of seizure recorded a paroxysmal burst of 4 Hz in different channels. The location or type of seizure has not been labeled in the files distinctly but has been mentioned in the recordings. Artifacts such as eye movements, head, and body movements are present in the recordings. The recording time of brain activity varied between the patients and lasted from one to few hours. The total EEG recording time of 10 subjects was 53 hours and contained 51 seizures. EEG signal of a single channel with normal and epileptic conditions are shown in Fig. 2. From Fig. 2, it can be observed that differentiating epileptic signals from non-epileptic signals to make a clear decision is difficult. So, there is a need for processing the EEG signals and finding appropriate features to make a correct decision when given as input to a classifier.
Table 1
Details of CHB-MIT dataset patients
| Patient Id | Gender | Age (years) | Channels (Signal) |
| chb01 | Female | 11 | 23 (EEG) |
| chb02 | Male | 11 | 23 (EEG) |
| chb03 | Female | 14 | 23 (EEG) |
| chb04 | Male | 22 | 24 (EEG and ECG) |
| chb05 | Female | 7 | 23 (EEG) |
| chb06 | Female | 1.5 | 23 (EEG) |
| chb07 | Female | 14.5 | 23 (EEG) |
| chb08 | Male | 3.5 | 23 (EEG) |
| chb09 | Female | 10 | 24 (EEG) |
| chb10 | Male | 3 | 23 (EEG) |
| chb11 | Female | 12 | 28 (EEG) |
| chb12 | Female | 2 | 28 (EEG and EKG) |
| chb13 | Female | 3 | 18 (EEG and EKG) |
| chb14 | Female | 9 | 28 (EEG) |
| chb15 | Female | 16 | 32 (EEG) |
| chb16 | Female | 7 | 28 (EEG) |
| chb17 | Female | 12 | 28 (EEG) |
| chb18 | Female | 18 | 22 (EEG) |
| chb19 | Female | 19 | 22 (EEG) |
| chb20 | Female | 6 | 28 (EEG) |
| chb21 | Female | 13 | 28 (EEG) |
| chb22 | Female | 9 | 28 (EEG) |
| chb23 | Male | 3 | 23 (EEG) |
| chb24 | – | – | 23 (EEG) |
Fig. 2.
Samples of (a) normal EEG signal (b) EEG signal with epileptic seizure.
2.1.2.Feature extraction from the selected input
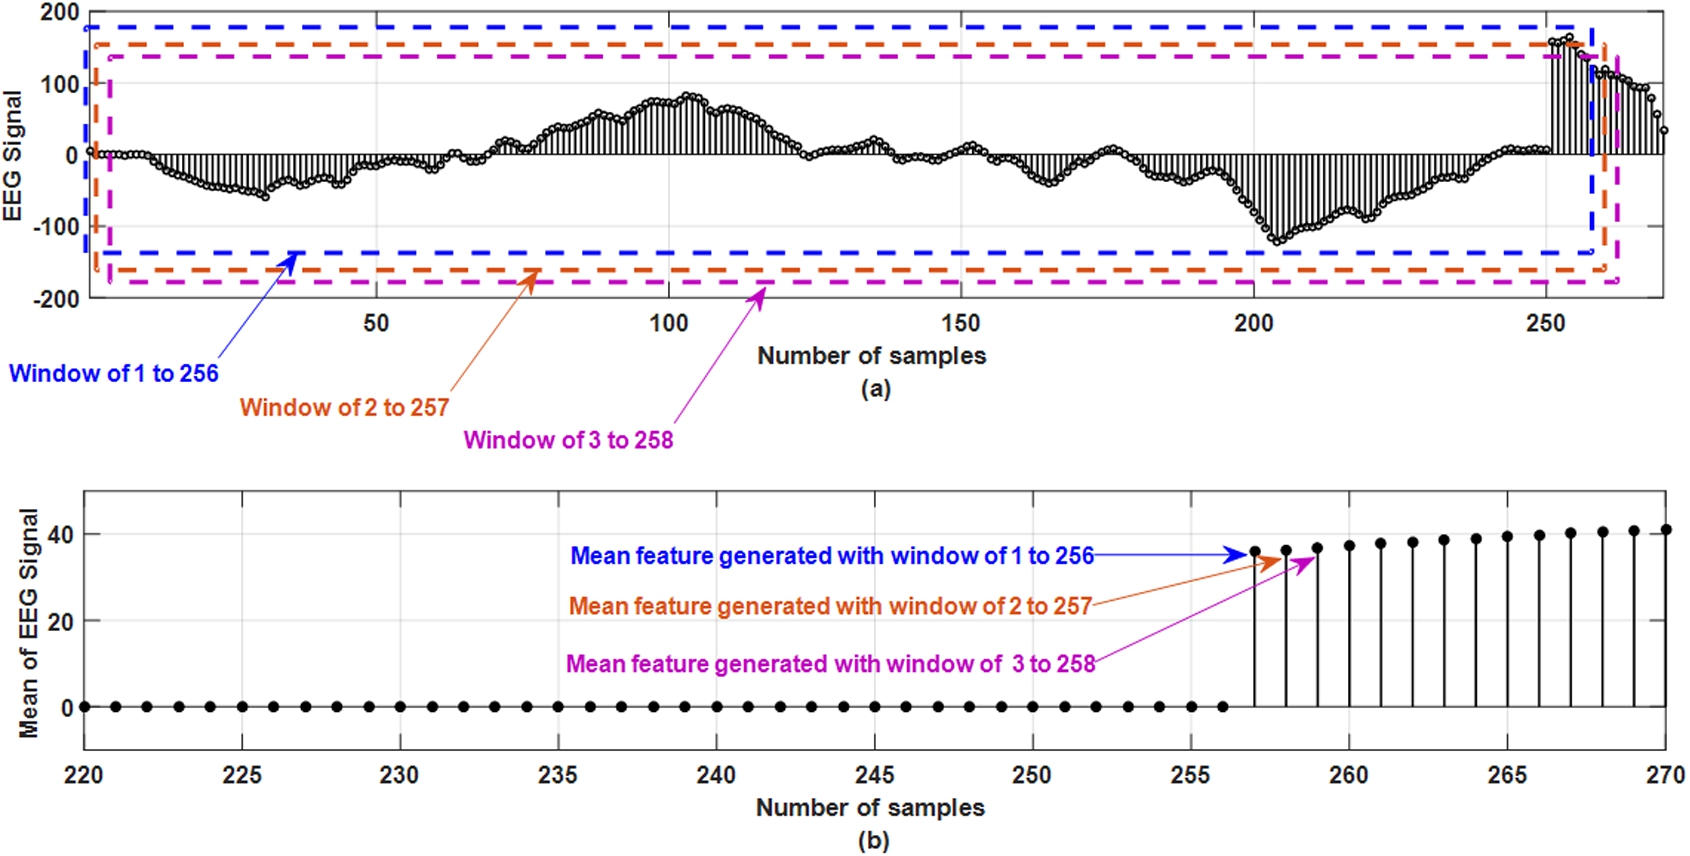
To design an efficient seizure detection unit, extracting relevant features is necessary to capture the information embedded in the EEG signals for better classification accuracy and sensitivity. In this work, different feature-extraction techniques have been used to extract significant features from the original signals. Significant features denote the features which are contributing in discriminating between normal and epileptic condition. In this work, using an overlapping moving-window of 1 second, methods like mean, standard deviation (STD), energy [22], discrete Fourier transform (DFT) [31] and discrete wavelet transformation (DWT) [25] subsequent features are extracted from the original EEG signals. To extract statistical information related to the EEG signals, mean and standard deviation have been used, for time-frequency analysis wavelet transformation has been chosen and finally to understand the spectral estimation of the signal during a seizure attack, Fourier transformation has been applied. The moving window of specific size is moved over the data and the moving distance is equal to the width of the window. This has been done to statistically summarize all data located within the window section over a particular time. The main reason behind using a moving window is to understand the pattern of the EEG signals over a time and how the signal changes in the particular time frame. Figure 3 shows the feature extraction from the EEG signal in the moving window of 256 samples based on the mean of the window. Figure 3 (a) shows the original signal from one EEG channel with different window containing 256 samples. Three windows are shown in dotted lines which are window 1 to 256, window of 2 to 257 and window of 3 to 258. Figure 3 (b) shows that up to 256 samples, mean feature are of zero magnitudes as it takes 256 samples to generate first sample. In Fig. 3 (b), sample number 257 has amplitude which is generated by taking the mean from the window of 1 to 256 samples. Figure 3 (b) shows sample number 258 which are generated by taking the mean from the window of 2 to 257 samples. Figure 3 (b) shows sample number 259 which are generated by taking the mean from the window of 3 to 258 samples. In this similar approach, mean of the EEG signals is obtained by moving the window and taking the mean of samples in that particular window. This is the reason for which it is called as overlapping moving window as shown in Fig. 3(a). This identical method has been used for the rest of the four techniques (standard deviation, energy, DFT, and DWT) to extract the features from the EEG recordings.
Fig. 3.
Mean feature extraction from EEG signal using overlapping moving window of 256 samples.
The EEG signals are processed with discrete Fourier transform (DFT) where equal spaced samples in a finite sequence are converted into equal spaced sample having same length. Then features are extracted from the DFT processed EEG signal with moving window of 256 samples using standard deviation of the window. For discrete wavelet transform (DWT), Daubechies wavelet has been used and DB8 wavelet has been used for decomposition of the signal. The EEG signals have been decomposed up to level 4 and approximate coefficients have been considered. Then standard deviation of the approximate coefficients is taken. Finally features are extracted from the DWT processed EEG signal with moving window of 256 samples. These aforementioned extracted features from the EEG signals are then given to the classifiers for detecting epileptic seizures as described in the next section.
2.1.3.Epileptic seizure detection using learning techniques
The classification model designed should efficiently distinguish between seizure and normal data. To achieve that, a traditional classifier such as artificial neural network [29,30] has been used as it is widely used for seizure detection. Apart from that tree-based classifier has been considered (decision tree) [19], along with newer method of ensemble learning [23]. Random forest [15,18] has been chosen as it works well with imbalanced data, and in seizure detection there is always a chance that the signal being analyzed may have class imbalance. The proposed method has been designed such that it will be first trained with a certain amount of data. The designed training module has been tested with data that has not been used previously in training. The test data is entirely different from the training data. For both the training phase as well as the testing phase, completely different EEG signals have been used to determine the performance accuracy of the classifiers. The main goal lies in creating boundaries between the data, label the classes, and maintain a threshold value for the features. From each patient, one seizure recording and one non-seizure recording are taken. The total seizure samples used is 844,336 and the total non-seizure samples used is 844,439. Hence, the total number of samples used in this work is 1,688,775. From the total samples, 70% of the original EEG recordings have been used for training the module while the remaining 30% have been used for testing. Here, the random sample division method has been used for dividing the training and testing samples into 70% and 30%. The random sample division has been carried out using the random sample selection method in MATLAB. The total number of samples used for training is 1,178,599 and testing contained 505,097 samples.
A. Design of the training module
The training seizure detection framework comprises of different steps that have been followed in this work. The elementary step consists of data acquisition, which here is a collection of pediatric EEG signals with a history of intractable epilepsy. This is followed by the extraction of suitable features. Different features have been extracted with the help of signal decomposition and a moving window of 1 sec. The obtained features are then trained to differentiate between non-seizure and seizure data using four different methods such as artificial neural network, decision tree, random forest, and ensemble learning. The schematic diagram of the proposed method for the training module is presented in Fig. 4.
Fig. 4.
Schematic diagram of training module of the proposed method.
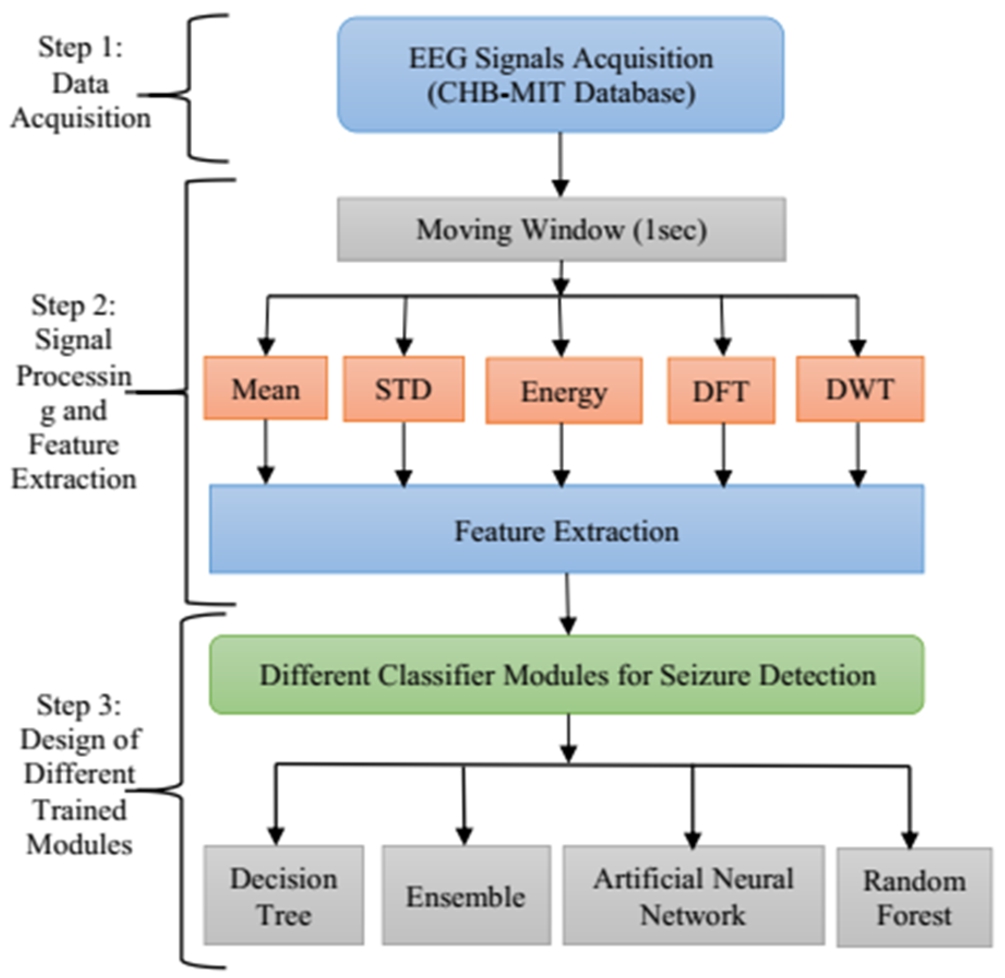
Fig. 5.
Final structure of the trained artificial neural network.
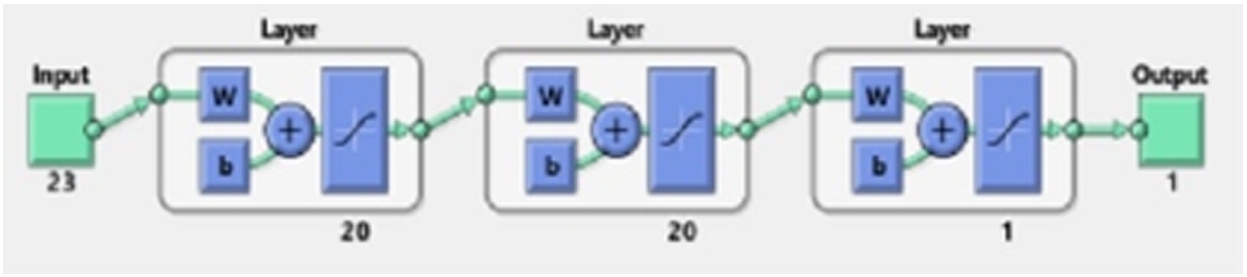
Before finalizing the final architecture of the artificial neural network (ANN), different network structures have been considered. As deducing the working architecture for neural network is a trial-and-error method, the error goal, layers and neurons have been changed and performance is evaluated before the final structure of the ANN is decided. In the ANN, the final network configuration consisted of three layers with each hidden layer containing 20 neurons, and the last layer contained a single neuron. Figure 5 shows the final network structure of the trained module. As mentioned in Fig. 5, the input layer has 23 neurons representing the input signals from 23 EEG channels. The activation (transfer) function used is tan-sig and 500 epochs have been used for training the neural network. The error goal for the network is kept at 0.001 and the initialization of the weights and biases has been done using the Nguyen–Widrow method. The training function used by the neural network for all the features has been Levenberg–Marquardt optimization. Similarly, for decision tree and random forest, the classifier specification has been maintained for all the features. In the decision tree, different splitting criteria are used for splitting and building the tree. In this work, the Gini impurity index has been used for the decision tree. Meanwhile, in the random forest, the number of learning cycles has been varied to check the accuracy before maintaining at 100 cycles for training the data. The number of trees in the random forest is 100. For partitioning the tree, interaction-curvature has been used as the predictor selector. In random forest, maximum depth is 25, minimum sample split is 5, minimum sample leaf is 2 and alpha is 0.0. This method reduces the p-value of the chi-square test between the predictor and response. Although, this method is slower than the standard classification and regression trees but has the capability of producing better predictor estimates. Figure 6 shows the pruned structure of the first trained tree of random forest. Finally, for the ensemble learning technique generative ensemble with the re-sampling method has been used where various boosting methods have been trained with a varying number of learning cycles before selecting the most efficient method. Out of all the boosting method, Gentle-Boost has shown better performance with the training data for 300 learning cycles. This specification has been maintained throughout the work for all the features. Table 2 mentions the configuration of all the four classifiers used in this work. After the training network is designed, it is tested with unknown samples as given in next section.
Fig. 6.
Final structure of the first tree of trained pruned random forest.
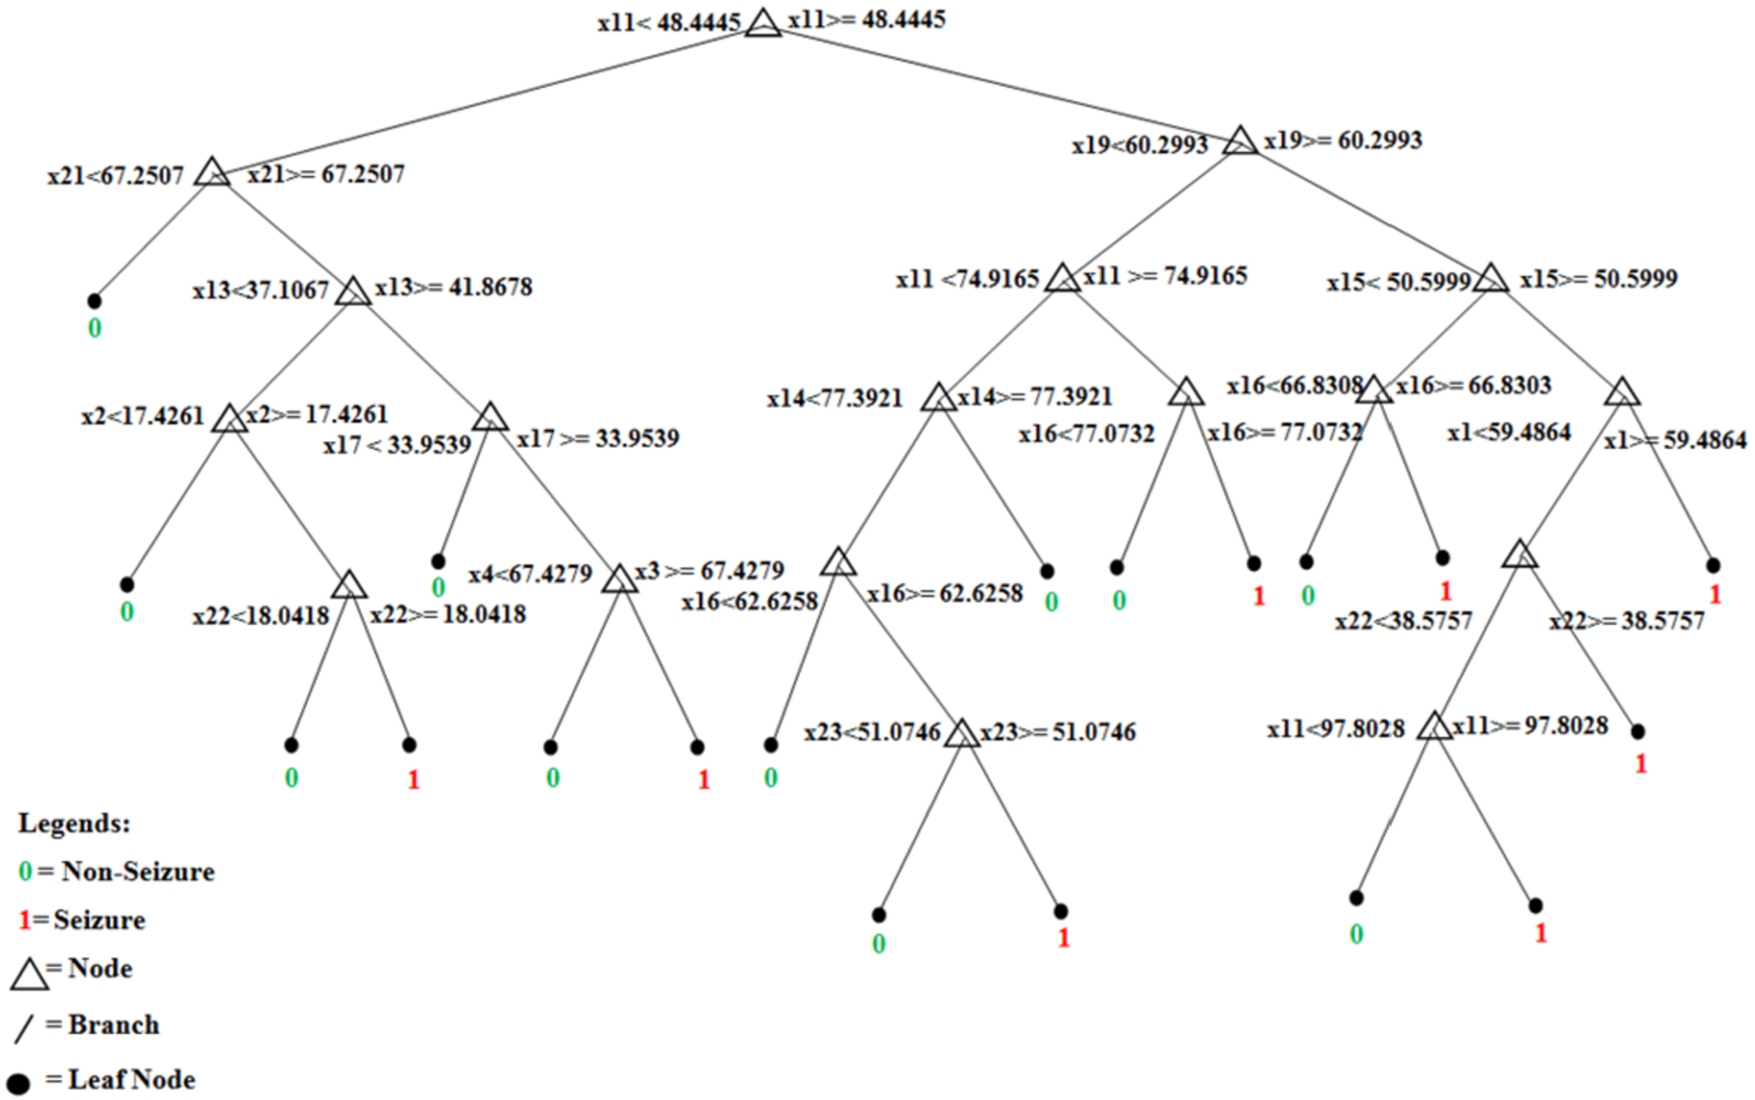
Table 2
Optimal parameters used in different methods during training
| Classifier | Specifications |
| Artificial Neural Network (ANN) | Activation Function: Tan-sig, Epochs: 500, Error Goal: 0.001, Network: 3 layers (20-20-1), Normalization: Min-Max, Training Function: Levenberg–Marquardt Optimization, Weight and Biases: Nguyen–Widrow Method |
| Decision Tree (DT) | Splitting Criterion: Gini Impurity Index, Number of Levels: 446 |
| Random Forest (RF) | Learning Cycles: 100, Splitting Criterion: Gini-Index, Number of trees: 100, Maximum depth: 25, Minimum sample split: 5, Minimum sample leaf: 2, Maximum features: Auto, Maximum leaf node: None, Bootstrap: True, Alpha: 0.0 |
| Ensemble learning | Learning Cycles: 300, Method: Generative Ensemble (Re-sampling Method), Boosting: Gentle Boost |
B. Testing of the trained module
For testing the performance of the methods, a completely different set of test samples have been used as input. Features are extracted from the test samples using the same feature extraction techniques. The extracted features are then given as input to the already trained classifiers. Each of the classifiers is tested individually and the results obtained are compared to analyze the performance of all four classifiers. After testing of seizure detection modules, the results are analyzed which is discussed in the next section.
2.2.Using SWEC dataset
Another dataset that has been used for the validation of the proposed method is taken from the Sleep-Wake-Epilepsy-Center (SWEC) of the University Department of Neurology at the Inselspital Bern and the Integrated Systems Laboratory of the ETH Zurich [9,33]. The database consisted of a total of 16 patients having 99 recordings with 100 seizures. The intracranial EEG signals have been recorded using strip, depth, and grid electrodes. Localized between the 10/20 position of Fz and Cz, an extracranial electrode has been used as a reference for the recording. The sampling frequency of the signals is 512 Hz and a fourth-order Butterworth filter between 0.5 Hz and 150 Hz has been used to filter the recorded signals. Each of the EEG recordings comprised of interictal segments of 3 minutes followed by ictal segments ranging between 10 s and 1002 s and postictal segments of 3 minutes. Features, as suggested in the previous section, have been extracted from the EEG signals. These extracted features are then given to the four machine learning algorithms for detection as discussed in previous sections. The splitting of the dataset is similar to the first dataset i.e. 70% of the EEG recordings have been used for training the module while the remaining 30% have been used for testing. For this dataset, Table 2 mentions the configuration of all the four classifiers used. After the training network is designed, it is tested with unknown samples as given in Section 4.
3.Results obtained for CHB-MIT dataset
Different learning method have been validated and tested on pediatric patients and the performance has been assessed for patient-specific raw EEG signals and processed signals having features. Statistical parameters such as accuracy, sensitivity, and specificity have been used to evaluate the obtained results. In this work, Matthew’s correlation coefficient (MCC), kappa analysis, and F1 score have been used to study the performance of the different classifiers. The mathematical formulas used to calculate the performance indicators are shown in Eqs (1) to (7).
3.1.Performance of different methods with raw EEG signal
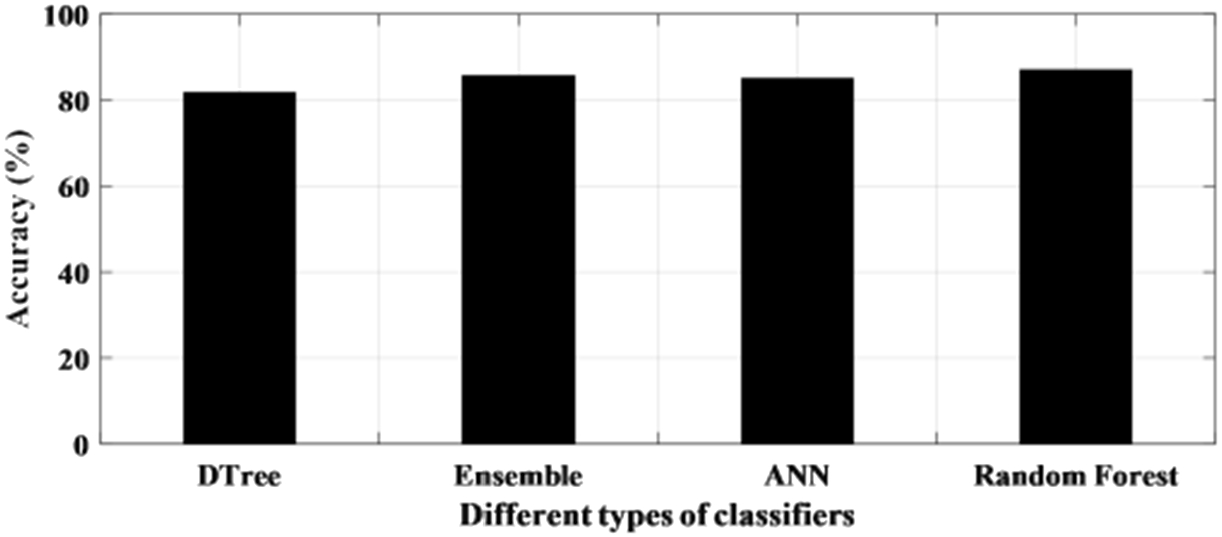
The performance of the learning-based methods has been first tested with raw EEG signals. This has been done in a patient-specific approach where an individual patient has been considered for testing the accuracy of the classifier. The statistical analysis of the method is presented in Table 3. It can be seen from Table 3 that the accuracy of all the classifiers for each patient ranged from 75% to 99% with the only exception of a patient where the accuracy is recorded below 70% for all the four classifiers. The sensitivity and specificity also varied from 75% to 95% and 70% to 100% respectively. It is noticed from the results that one of the patient’s file consistently recorded a higher accuracy among all the patient data set for all the classifiers and obtained the highest accuracy of 99.7% for the random forest. Figure 7 shows the individual accuracy of each patient recorded for each classifier. In addition, it can be seen from Table 3 and Fig. 8 that the average accuracy of each classifier for signals has been calculated. The average accuracy obtained from 10 patients for decision tree is 81.7% with sensitivity and specificity of 85.7% and 79.4% respectively. Ensemble learning edged ahead with an accuracy of 85.6% while ANN has an average accuracy of 85.0%. The highest average accuracy of 87.0% is observed for random forest classifier.
Table 3
Performance of various method using raw signals
| Methods used | Patient | Accuracy (%) | Sensitivity (%) | Specificity (%) | F1 score | Matthew’s correlation coefficient | Kappa |
| Decision Tree | 1 | 83.4 | 90.4 | 78.5 | 0.847 | 0.679 | 0.745 |
| 2 | 88.4 | 89.0 | 87.8 | 0.885 | 0.767 | 0.768 | |
| 3 | 89.7 | 87.5 | 92.3 | 0.894 | 0.796 | 0.796 | |
| 4 | 84.2 | 92.3 | 78.6 | 0.856 | 0.696 | 0.681 | |
| 5 | 61.9 | 61.9 | 61.9 | 0.619 | 0.239 | 0.238 | |
| 6 | 98.5 | 99.4 | 97.6 | 0.985 | 0.970 | 0.970 | |
| 7 | 79.9 | 77.8 | 82.4 | 0.792 | 0.600 | 0.600 | |
| 8 | 74.1 | 82.6 | 69.1 | 0.771 | 0.500 | 0.482 | |
| 9 | 80.6 | 93.4 | 73.6 | 0.831 | 0.641 | 0.612 | |
| 10 | 76.6 | 82.7 | 72.4 | 0.786 | 0.539 | 0.533 | |
| Overall | 81.7 | 85.7 | 79.4 | 0.827 | 0.643 | 0.643 | |
| Ensemble Learning | 1 | 88.6 | 86.6 | 90.8 | 0.889 | 0.773 | 0.772 |
| 2 | 91.9 | 93.1 | 90.8 | 0.918 | 0.839 | 0.838 | |
| 3 | 92.5 | 94.6 | 90.6 | 0.923 | 0.851 | 0.850 | |
| 4 | 91.5 | 88.9 | 94.4 | 0.917 | 0.831 | 0.830 | |
| 5 | 62.8 | 64.5 | 61.4 | 0.605 | 0.258 | 0.256 | |
| 6 | 99.6 | 99.2 | 100.0 | 0.996 | 0.992 | 0.992 | |
| 7 | 82.1 | 86.6 | 78.6 | 0.810 | 0.648 | 0.642 | |
| 8 | 78.0 | 75.1 | 81.6 | 0.792 | 0.564 | 0.560 | |
| 9 | 85.0 | 78.1 | 96.4 | 0.866 | 0.722 | 0.700 | |
| 10 | 83.6 | 81.2 | 86.4 | 0.842 | 0.674 | 0.672 | |
| Overall | 85.6 | 84.8 | 87.1 | 0.856 | 0.715 | 0.711 | |
| ANN | 1 | 82.3 | 76.0 | 92.7 | 0.842 | 0.666 | 0.647 |
| 2 | 93.4 | 93.8 | 93.1 | 0.943 | 0.869 | 0.868 | |
| 3 | 95.1 | 95.4 | 94.8 | 0.951 | 0.902 | 0.902 | |
| 4 | 89.8 | 85.1 | 96.0 | 0.905 | 0.804 | 0.796 | |
| 5 | 63.9 | 63.1 | 64.7 | 0.649 | 0.278 | 0.278 | |
| 6 | 99.5 | 99.4 | 99.6 | 0.995 | 0.990 | 0.990 | |
| 7 | 86.0 | 89.2 | 83.3 | 0.854 | 0.723 | 0.720 | |
| 8 | 74.4 | 67.8 | 89.2 | 0.785 | 0.528 | 0.488 | |
| 9 | 84.3 | 77.0 | 97.0 | 0.862 | 0.713 | 0.686 | |
| 10 | 81.3 | 80.1 | 82.5 | 0.816 | 0.626 | 0.628 | |
| Overall | 85.0 | 82.7 | 89.3 | 0.860 | 0.710 | 0.700 | |
| RF | 1 | 86.9 | 81.0 | 95.4 | 0.880 | 0.750 | 0.740 |
| 2 | 94.0 | 93.1 | 94.9 | 0.940 | 0.879 | 0.880 | |
| 3 | 96.2 | 94.1 | 98.4 | 0.963 | 0.925 | 0.924 | |
| 4 | 89.3 | 83.7 | 97.1 | 0.901 | 0.797 | 0.786 | |
| 5 | 67.5 | 66.5 | 68.7 | 0.685 | 0.352 | 0.350 | |
| 6 | 99.7 | 99.4 | 100.0 | 0.997 | 0.994 | 0.990 | |
| 7 | 86.1 | 89.8 | 83.1 | 0.855 | 0.726 | 0.722 | |
| 8 | 78.8 | 72.9 | 88.9 | 0.812 | 0.596 | 0.576 | |
| 9 | 82.5 | 74.4 | 98.7 | 0.850 | 0.689 | 0.650 | |
| 10 | 89.0 | 85.9 | 92.7 | 0.895 | 0.783 | 0.780 | |
| Overall | 87.0 | 84.1 | 91.8 | 0.878 | 0.749 | 0.740 |
Fig. 7.
Patient-specific accuracy achieved with raw data using different classifiers.
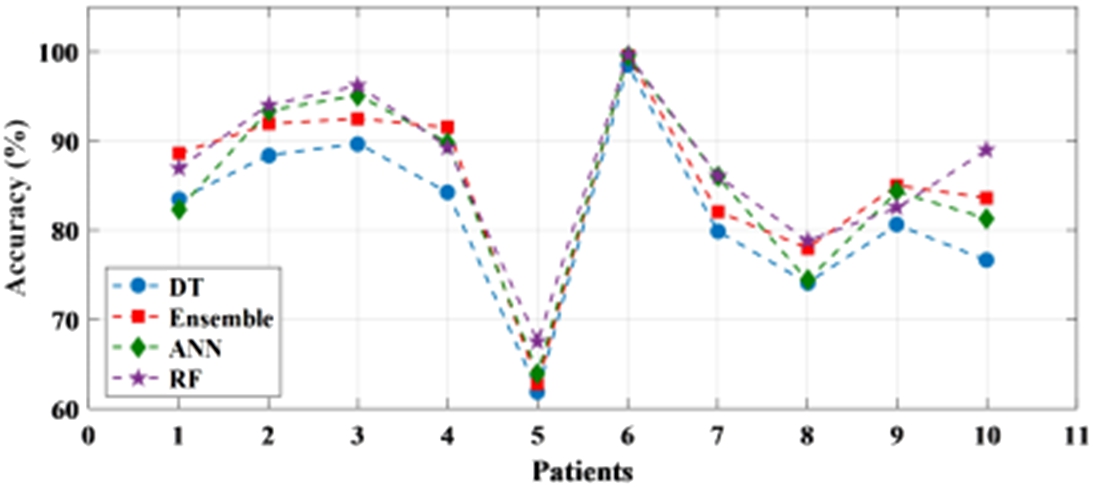
Fig. 8.
Average accuracy achieved with raw data using different classifiers.
3.2.Performance with extracted features from EEG signals
The performance of different methods is studied based on the five different features that have been obtained using feature extraction techniques from the original EEG recordings. The features used in this work are mean, standard deviation, energy of the signal, discrete Fourier transform, and discrete wavelet transform. Table 4 presents the performance analysis of decision tree, ensemble learning, artificial neural network, and random forest classifier with respect to various features. As seen from Table 4, the accuracy of all the four classifiers is mentioned for each of the features along with sensitivity and specificity. Figure 9 (a) and (b) represent the accuracy plot of artificial neural network and random forest. Figure 9 (c) and (d) present the accuracy plot of the decision tree and ensemble learning for all the five features used in this work. Standard deviation is seen to have obtained the highest accuracy for three out of the four classifiers, while for ensemble learning, mean has given the highest accuracy rate. Among the four classifiers, random forest has given the highest accuracy of 91.9% for standard deviation. Therefore, after comparing all the four classifiers against the five features, standard deviation with a moving window of 1 sec stands out to be the preferred choice among the features. Moreover, among the classifiers, random forest outdid the other three classifiers in providing the lowest amount of misclassified data. The false detection rate is 0.07/h, 0.1/h, 0.1/h, and 0.06/h for neural network, decision tree, ensemble learning and random forest method respectively.
Table 4
Performance of different methods using different features
| Type of classifier | Features | Accuracy (%) | Sensitivity (%) | Specificity (%) |
| Decision Tree | Mean | 85.4 | 91.5 | 79.3 |
| Standard Deviation | 85.7 | 91.7 | 79.7 | |
| Energy | 71.6 | 73.4 | 69.7 | |
| DFT | 85.7 | 91.9 | 79.5 | |
| DWT | 76.2 | 79.5 | 72.9 | |
| Ensemble (Gentle-Boost) | Mean | 86.6 | 92.0 | 81.3 |
| Standard Deviation | 85.7 | 91.2 | 80.1 | |
| Energy | 78.0 | 78.7 | 77.3 | |
| DFT | 85.6 | 91.7 | 79.5 | |
| DWT | 84.0 | 87.5 | 80.4 | |
| Artificial Neural Network | Mean | 88.6 | 92.7 | 84.4 |
| Standard Deviation | 89.0 | 94.0 | 84.0 | |
| Energy | 76.0 | 81.3 | 70.6 | |
| DFT | 87.4 | 93.2 | 81.5 | |
| DWT | 84.7 | 87.3 | 82.1 | |
| Random Forest | Mean | 91.5 | 93.9 | 89.1 |
| Standard Deviation | 91.9 | 94.1 | 89.7 | |
| Energy | 80.1 | 84.7 | 75.4 | |
| DFT | 91.5 | 94.1 | 89.0 | |
| DWT | 85.9 | 91.8 | 80.0 |
Fig. 9.
Accuracy plot of (a) artificial neural network (b) random forest (c) decision tree (d) ensemble learning.
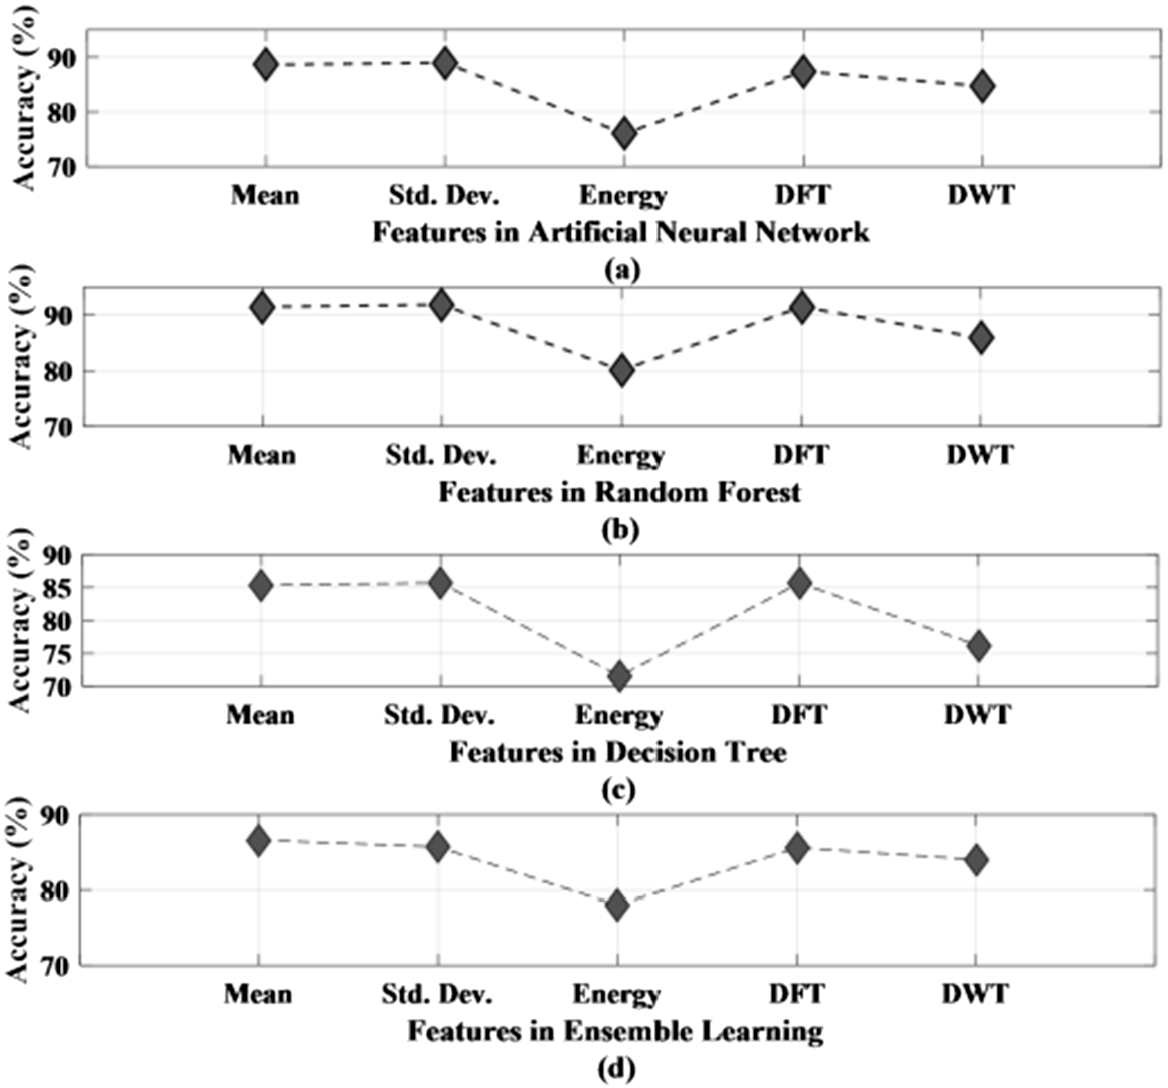
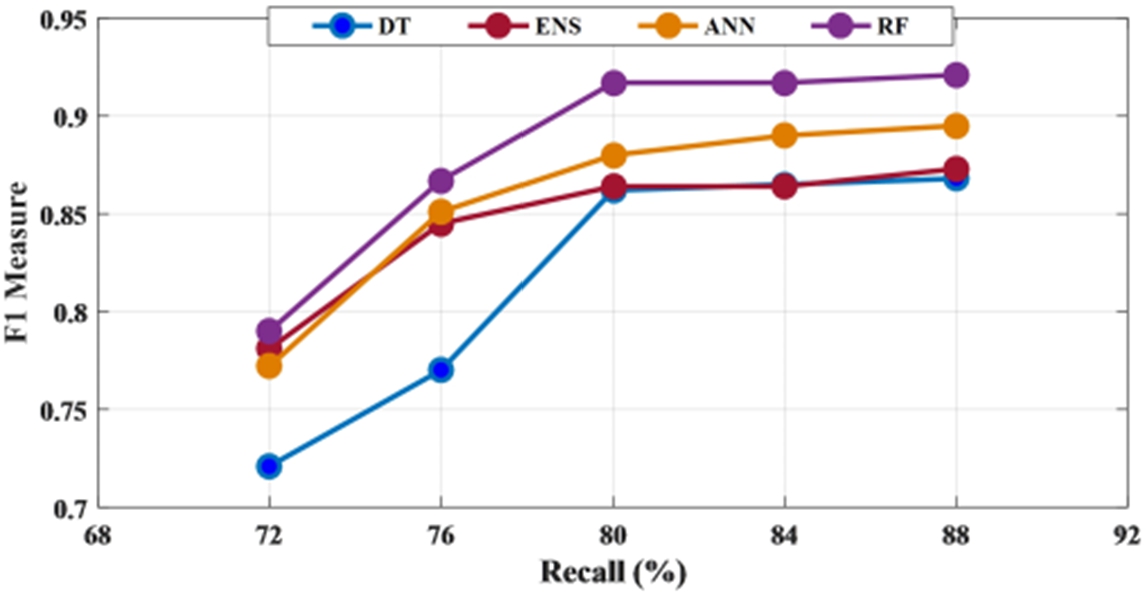
To have a threshold-free assessment of the classifiers, the receiver operating characteristics curve (ROC) is used where the area under the curve (AUC) is taken as a measure of classification performance. For each classifier, the AUC value is obtained for all the features and is presented in Fig. 10. As seen from Table 5, irrespective of the classifier, an AUC score of 0.7 is acquired when energy is considered as the chosen feature for classification. When mean and standard deviation is used, the AUC score improved to 0.9 across all the classifiers while it varied slightly for both discrete wavelet transform (DWT) and discrete Fourier transform (DFT). The decision tree recorded the lowest value when energy is used as the chosen feature. Along with this, another metric called Cohen’s kappa has been used. All the classifiers showed almost perfect agreement with few exceptions. While ensemble leaning and ANN displayed substantial agreement for almost all the features except energy. When energy is used, irrespective of the classifier, the performance accuracy is reduced. Hence the reliability measure is in moderate agreement. The decision tree presented a substantial agreement for three of the five features. While the random forest has an almost perfect agreement for the features, except for energy and DWT where it showed substantial agreement. The F1 score or F1 measure has also been calculated for all the classifiers as mentioned in Table 5 and shown in Fig. 11. Figure 12 presents the receiver-operating curve (ROC) of all four methods for standard deviation features. The confusion matrix of different methods with standard deviation feature is given in Table 6.
Table 5
Performance of different methods using different features
| Type of classifier | Features | AUC | Kappa | Matthew’s correlation coefficient | F1-score |
| Decision Tree | Mean | 0.914 | 0.708 | 0.713 | 0.862 |
| Standard Deviation | 0.917 | 0.711 | 0.719 | 0.865 | |
| Energy | 0.734 | 0.432 | 0.431 | 0.721 | |
| DFT | 0.919 | 0.714 | 0.720 | 0.868 | |
| DWT | 0.795 | 0.524 | 0.525 | 0.770 | |
| Ensemble (Gentle-Boost) | Mean | 0.913 | 0.732 | 0.737 | 0.873 |
| Standard Deviation | 0.912 | 0.714 | 0.718 | 0.864 | |
| Energy | 0.787 | 0.560 | 0.511 | 0.781 | |
| DFT | 0.917 | 0.712 | 0.717 | 0.864 | |
| DWT | 0.875 | 0.680 | 0.681 | 0.845 | |
| Artificial Neural Network | Mean | 0.928 | 0.838 | 0.801 | 0.890 |
| Standard Deviation | 0.923 | 0.780 | 0.784 | 0.895 | |
| Energy | 0.796 | 0.520 | 0.522 | 0.772 | |
| DFT | 0.920 | 0.748 | 0.752 | 0.880 | |
| DWT | 0.903 | 0.700 | 0.700 | 0.851 | |
| Random Forest | Mean | 0.939 | 0.830 | 0.831 | 0.917 |
| Standard Deviation | 0.941 | 0.838 | 0.838 | 0.921 | |
| Energy | 0.847 | 0.602 | 0.604 | 0.790 | |
| DFT | 0.941 | 0.830 | 0.832 | 0.917 | |
| DWT | 0.918 | 0.720 | 0.724 | 0.867 |
Table 6
Confusion matrix of different methods with standard deviation features
| Methods used | Confusion matrix | ||||
| DT | Training Confusion Matrix | Target Class | |||
| 0 | 1 | ||||
| Output Class | 0 | 589246 | 88 | ||
| 1 | 71 | 589156 | |||
| Testing Confusion Matrix | Target Class | ||||
| 0 | 1 | ||||
| Output Class | 0 | 201380 | 20971 | ||
| 1 | 51182 | 231561 | |||
| ANN | Training Confusion Matrix | Target Class | |||
| 0 | 1 | ||||
| Output Class | 0 | 587244 | 8598 | ||
| 1 | 2073 | 580246 | |||
| Testing Confusion Matrix | Target Class | ||||
| 0 | 1 | ||||
| Output Class | 0 | 212129 | 15138 | ||
| 1 | 40433 | 237398 | |||
| ENS | Training Confusion Matrix | Target Class | |||
| 0 | 1 | ||||
| Output Class | 0 | 534781 | 66079 | ||
| 1 | 54536 | 523165 | |||
| Testing Confusion Matrix | Target Class | ||||
| 0 | 1 | ||||
| Output Class | 0 | 202287 | 22151 | ||
| 1 | 50275 | 230381 | |||
| RF | Training Confusion Matrix | Target Class | |||
| 0 | 1 | ||||
| Output Class | 0 | 589317 | 0 | ||
| 1 | 0 | 589244 | |||
| Testing Confusion Matrix | Target Class | ||||
| 0 | 1 | ||||
| Output Class | 0 | 226514 | 14974 | ||
| 1 | 26048 | 237558 | |||
Fig. 10.
AUC score of classifiers using the different features.
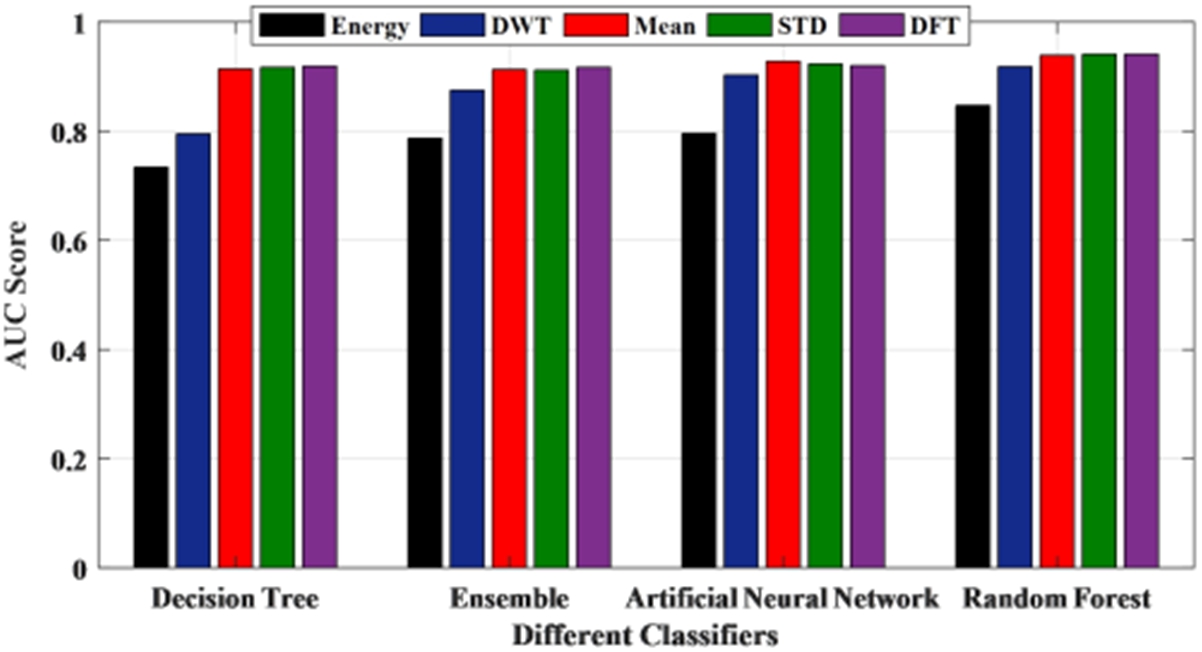
Fig. 11.
F1 measure of all four classifiers for different features.
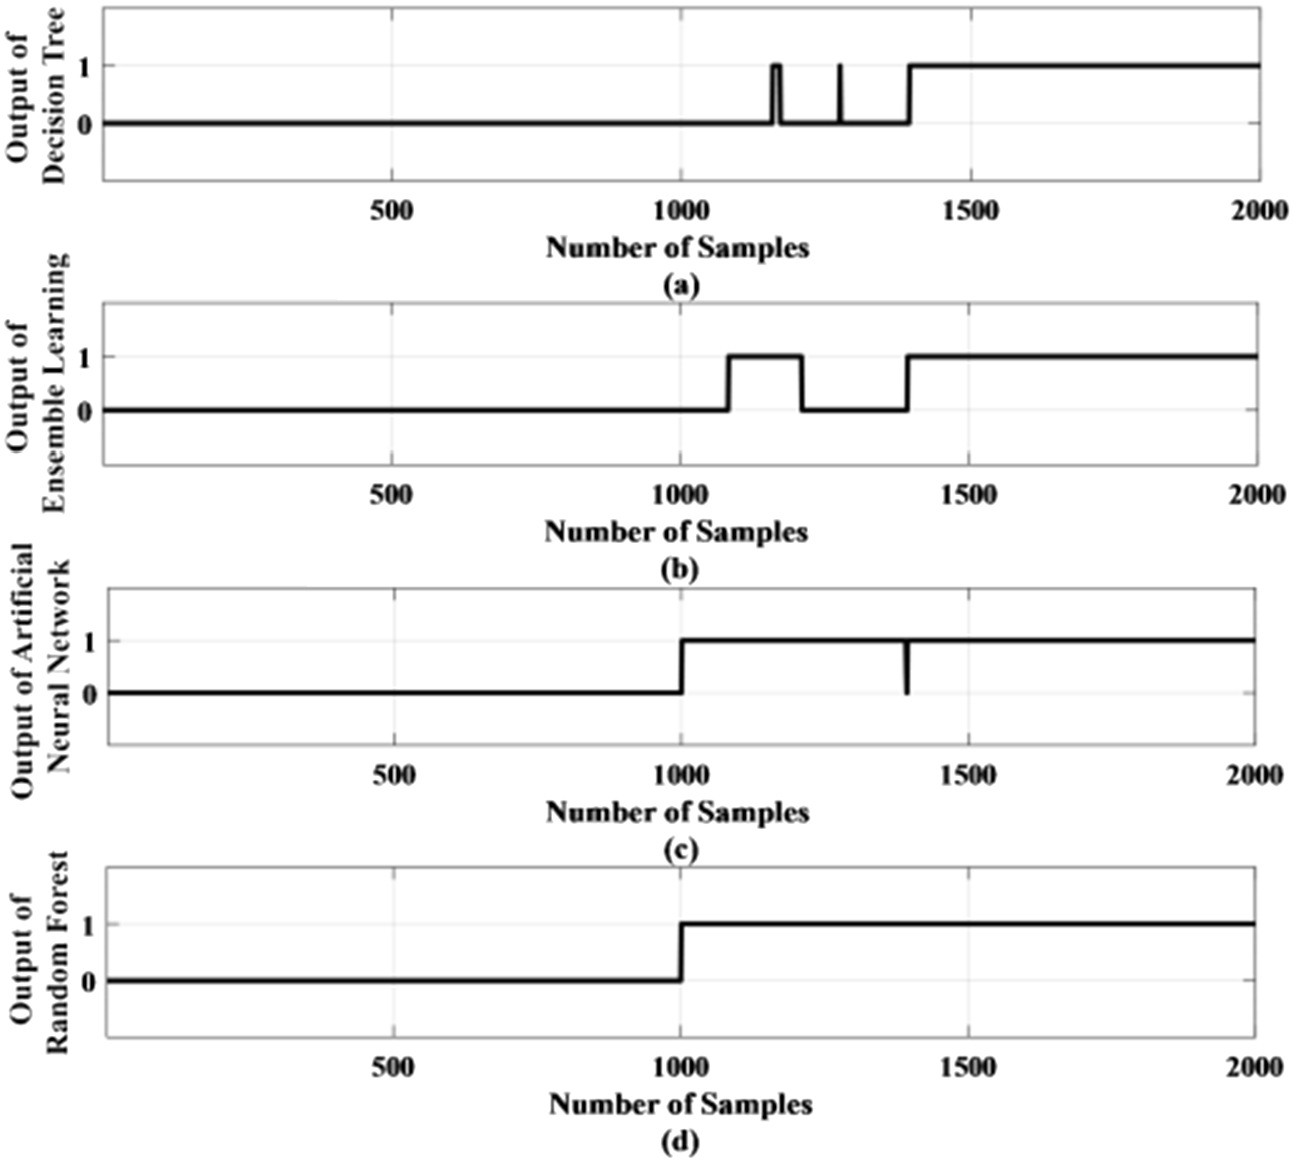
One of the test results of the proposed method using standard deviation as a feature has been shown in Fig. 13. Figure 13 (a) shows the output of the DT method in which the first 1000 samples are taken from the normal condition and the next 1000 samples are for the epileptic condition. Hence the first 1000 samples output should be ‘0’ to represent normal condition and the next 1000 samples output should be ‘1’ to represent the epileptic condition. But Fig. 13 (a) shows the output becomes ‘1’ much later around 1400 sample number and some samples become 1 and again become zero which is incorrect. Figure 13 (b) shows the output of the ensemble learning method and here also some samples become 1 after sample number 1100 and again become zero which is incorrect. Figure 13 (c) represents the output of the ANN method where output becomes one after sample number 1000. But output comes to zero at sample number 1400 which is wrong. Figure 13 (d) represents the output of the RF method where output becomes one after sample number 1000. Although the RF-based method does not have an accuracy of 100%, it detects the outputs correctly for a prolonged amount of time which will be helpful for monitoring epilepsy.
Fig. 12.
ROC of ANN, DT, ensemble learning and RF for standard deviation the feature.
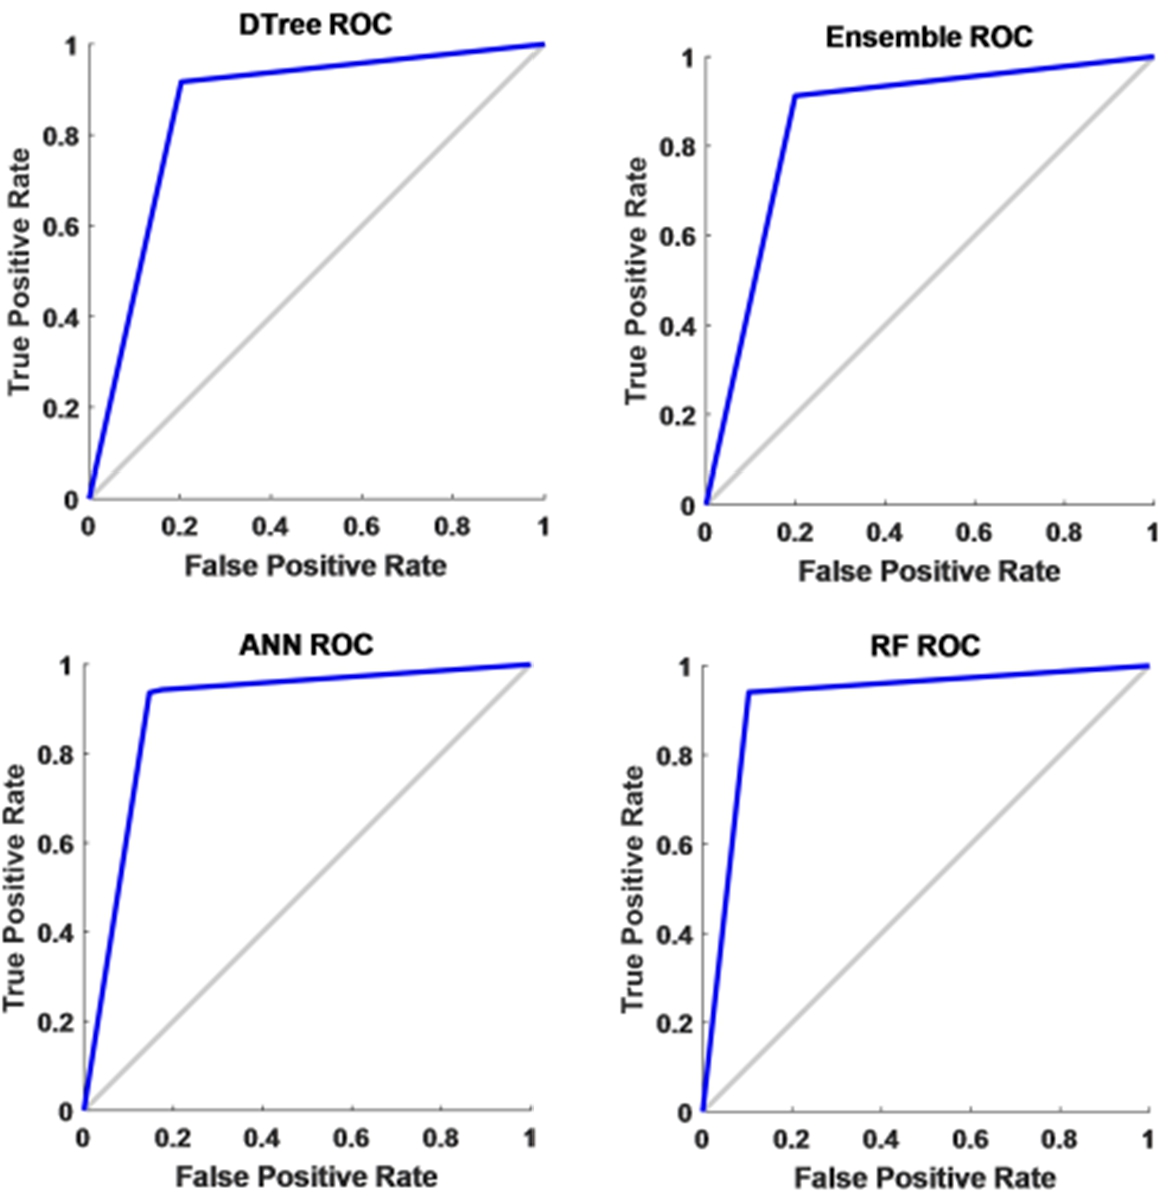
Fig. 13.
Output of different methods with standard deviation as feature.
3.3.Performance with data splitting in terms of patients using extracted features
The proposed method has been validated by dividing the data in terms of patients. The training and testing split is done in terms of patients i.e. 70% patients are used for training and 30% patients are used for testing. Few instances of the split have been presented in Fig. 14. As seen from the Fig. 14, data from different patients has been taken into consideration while creating the two subsets. Out of different combinations that have been tested, 3 cases have been shown in the Fig. 14. Table 7 shows the performance of all four classifiers for each of the 3 cases for standard deviation feature. Random forest has recorded the highest accuracy for the proposed work. Table 7 also shows the accuracy reached by random forest is highest for arbitrarily selected test cases. It can be seen from the Table 7, that the accuracy lies within ±2% percent of the accuracy achieved by the classifier. The classifier has been able to distinguish between seizure and non-seizure recordings but the consistency varied among the test cases which posed as slight limitation for the proposed method. Hence, this paves way for future work where more efficient and robust classifier is needed that can detect seizure with more finesse.
Fig. 14.
Few instances of splitting of training set and testing set in terms of patients.
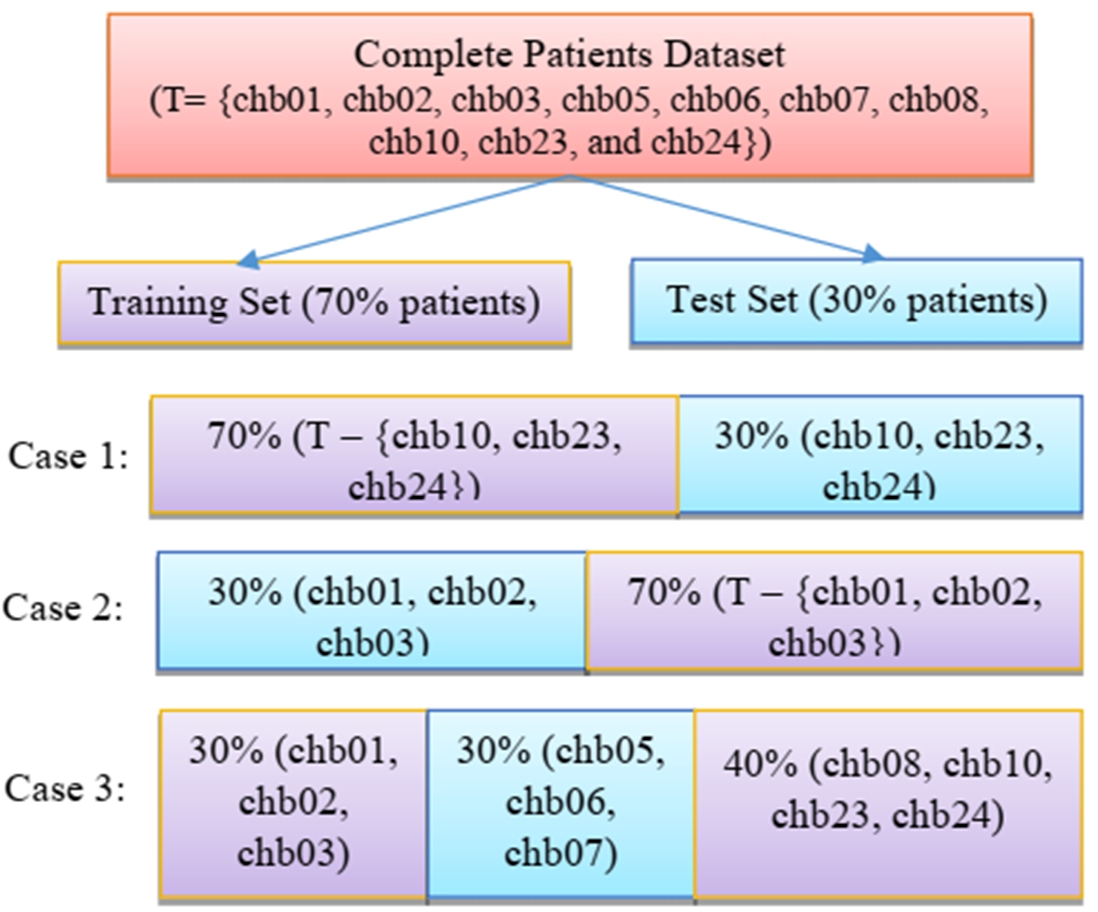
Table 7
Performance for different test cases using standard deviation input features
| Test case | Method | Accuracy (%) | Sensitivity (%) | Specificity (%) |
| Case 1 | DT | 85.5 | 95.0 | 79.7 |
| ANN | 86.9 | 95.1 | 81.5 | |
| ENS | 85.2 | 89.6 | 82.0 | |
| RF | 92.0 | 92.5 | 92.2 | |
| Case 2 | DT | 84.3 | 85.5 | 83.3 |
| ANN | 86.6 | 86.9 | 84.5 | |
| ENS | 84.0 | 84.9 | 83.2 | |
| RF | 91.2 | 91.9 | 90.5 | |
| Case 3 | DT | 84.6 | 84.7 | 84.5 |
| ANN | 87.1 | 88.7 | 85.6 | |
| ENS | 84.6 | 84.7 | 84.2 | |
| RF | 91.5 | 93.2 | 89.9 |
4.Results obtained for SWEC dataset
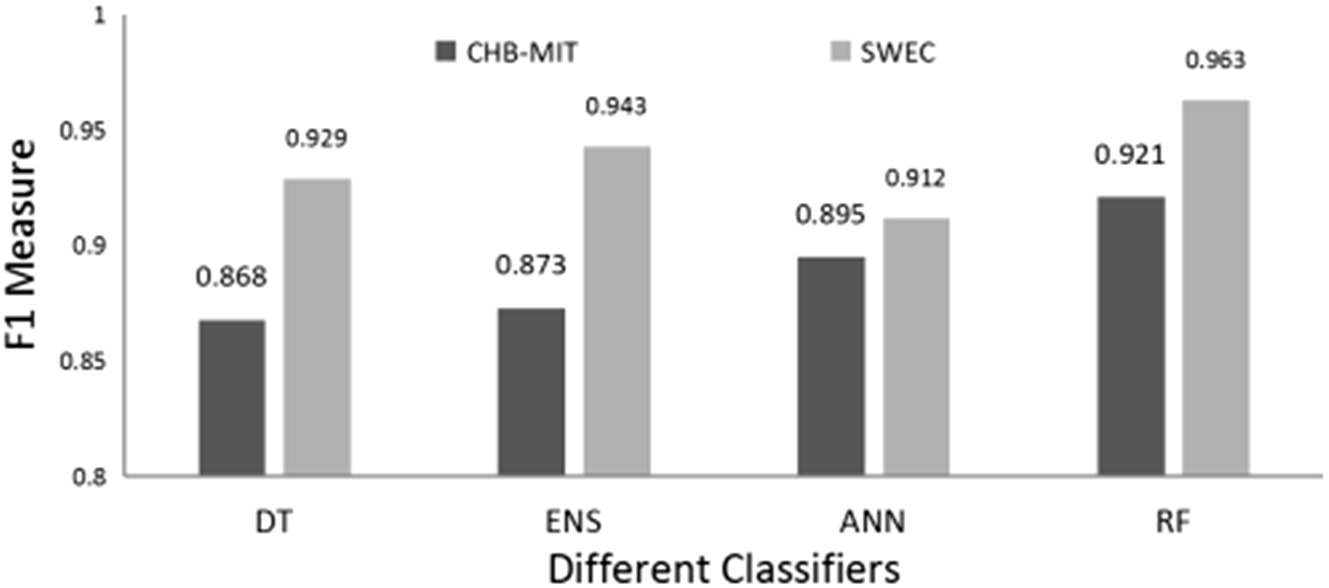
The validation result of SWEC dataset is given in Table 8 for all types of algorithms and features as used in the proposed method. It is seen that the average accuracy is from 81% to 96.9%. While sensitivity and specificity ranged from 76% to 96% and 86% to 99% respectively. Random forest and ensemble learning (ENS) have performed well among the four classifiers even for the validation dataset. The highest accuracy obtained is 96.9% for the random forest for the feature standard deviation. Figure 15 shows the F1-measure plot of all four classifiers for the feature standard deviation with respect to both the dataset. It can be realized from the graph that the performance of the proposed method for the validation dataset is at par with the obtained results (CHB-MIT dataset) and have accomplished significantly improved results.
Table 8
Performance of SWEC dataset in epileptic seizure detection
| Classifier | Features | Accuracy (%) | Sensitivity (%) | Specificity (%) | F1 score | MCC |
| Decision Tree (DT) | STD | 92.9 | 94.6 | 91.2 | 0.929 | 0.872 |
| Mean | 90.5 | 87.4 | 93.8 | 0.892 | 0.824 | |
| DFT | 92.0 | 91.5 | 92.5 | 0.915 | 0.856 | |
| Energy | 89.3 | 87.2 | 90.7 | 0.882 | 0.859 | |
| DWT | 82.1 | 77.6 | 86.5 | 0.822 | 0.661 | |
| Random Forest (RF) | STD | 96.9 | 96.6 | 98.6 | 0.963 | 0.945 |
| Mean | 95.1 | 91.0 | 99.1 | 0.936 | 0.913 | |
| DFT | 96.1 | 95.7 | 98.1 | 0.954 | 0.929 | |
| Energy | 96.1 | 96.6 | 94.9 | 0.958 | 0.918 | |
| DWT | 88.8 | 85.2 | 92.4 | 0.893 | 0.791 | |
| Ensemble Learning (ENS) | STD | 93.9 | 91.4 | 96.3 | 0.917 | 0.889 |
| Mean | 93.3 | 90.0 | 96.6 | 0.919 | 0.878 | |
| DFT | 94.7 | 92.8 | 96.3 | 0.938 | 0.904 | |
| Energy | 94.3 | 94.6 | 93.9 | 0.943 | 0.890 | |
| DWT | 87.2 | 82.4 | 91.9 | 0.873 | 0.764 | |
| Artificial neural network (ANN) | STD | 90.5 | 84.3 | 96.6 | 0.878 | 0.828 |
| Mean | 91.3 | 88.4 | 94.3 | 0.894 | 0.842 | |
| DFT | 91.0 | 89.5 | 92.5 | 0.903 | 0.834 | |
| Energy | 91.5 | 90.4 | 92.6 | 0.912 | 0.841 | |
| DWT | 81.6 | 76.6 | 86.6 | 0.821 | 0.649 |
Fig. 15.
F1-measure of all four classifiers for the standard deviation (STD) feature for CHB-MIT data set and SWEC dataset.
5.Discussion
Considering the aim of the work, an improved method has been proposed for epileptic seizure detection which is independent of channel, independent of patient and has a better accuracy. The results of the proposed method have been discussed in Section 3 and Section 4 from which it can be observed that the accuracy in detecting epileptic seizure is promising. In this work, a comparison study is presented based on the seizure detection capability of different methods to find a suitable method. Feature extraction techniques have been used that included time-domain feature, frequency-domain feature and time-frequency domain feature. Table 9 represents the comparative study of the existing work with previous works based on the same dataset. [8] used 18 channels out of the 23 channels for seizure detection for the same data set. But in the proposed method all the channels are used to propose a channel independent method. When sensitivity is compared for the same data set, the proposed method achieved the highest sensitivity of 94% in comparison to 82% of the mentioned work for neural network. As seen in seizure detection, a patient-specific approach [17,34] is applied most of the time along with k- fold cross-validation method to test and validate the performance of the classifier. In this work, generalized approach have been used to study and analyze all the classifiers. When the generalized approach for seizure detection is compared to traditional machine learning methods, it has shown improved accuracy than the patient-specific approach [34]. The proposed method also suggests patient independent approach with better accuracy. In [17], authors have used db6 while in this work db8 has been used that contained eight vanishing moments. Spectral density using Fourier transform has been used in the patient-specific approach but these methods are based on the frequency domain and lack time-related information associated with the EEG signals. Although approximate energy has been used as a feature [17], in the present study using the test sample method energy has given the lowest accuracy across all the classifiers. When compared with prior works, the proposed approach performed well except for few works [8,17,32]. Justification can be given as all the above-mentioned works used the patient-specific approach whereas for the present work a generalized seizure detection framework has been maintained for each classifier so that seizures pertaining to any type or location can be detected with maximum sensitivity. Thus, inclusive seizure detection capability of the proposed method is analyzed. The present work also included all the EEG channels such that essential features from each of the channels could be extracted and applied for training the classifier modules. Moreover, the conventional approach of cross-validation has not been used for validation. Instead, a more realistic approach of the test sample method has been tried and tested such that the shortcomings and pitfalls can be acknowledged. This would pave the way for more refined and re-defined frameworks for pediatric seizure detection with minimum delay and maximum accuracy that would be seemingly beneficial in real scenarios. Apart from traditional supervised learning techniques, convolutional neural network [41] has been used for seizure detection. When the comparison is made in the time domain analysis, the proposed method progressed to provide a better result than the average accuracy reached with deep learning technique.
Though neural network is widely used in the seizure detection framework and has been used in [10], the processing power of the neural network has a direct dependency on the network configuration. With a more intricate network structure, the time complexity also increases. In the prior work by the authors [10], discrete wavelet transformation has been used as the lone feature and 10-fold cross-validation has been used for validation of the neural network framework which is the notable difference from the present work. To reduce the computational complexity and duration of developing a classifier, decision tree, random forest, and ensemble-learning algorithms have been used with all the features for determining seizure from non-seizure data. Therefore, the present work is not only directed towards analyzing the performance of different classifiers but also understanding the underlying nuances such that depending on the complexities at hand, proper selection of classifiers can be done for hardware implementation that would be cost and energy-efficient. The method will fail if the signal is not correctly recorded by the EEG channel or in a situation where any of the channels is missing. Also, data from more patients are needed to develop a more robust classification model. Advantages of the proposed method can be outlined as follows:
– A generalized method has been designed that would be suitable for detecting epileptic seizures with precision.
– The proposed method has been designed in a way such that features are generated simultaneously with respect to the EEG signals.
– As the features are generated from EEG samples, it will be given to the classifier to produce the output concurrently as multiple computational resources are used to calculate all of these features.
– In the present work, a generalized seizure detection framework has been maintained for each method instead of a patient-specific approach so that seizures pertaining to any type or location can be detected with maximum sensitivity. Thus, inclusive seizure detection capability of the proposed method is analyzed.
– The present work also included all the EEG channels such that essential features from each of the channels could be extracted and applied for training the classifier modules.
– Instead of the conventional approach of cross-validation, a more realistic approach of the test sample method has been tried and tested such that the shortcomings and pitfalls can be acknowledged. This would pave way for more refined and re-defined frameworks for pediatric seizure detection with maximum accuracy that would be seemingly beneficial in real scenarios.
– Accuracy of the proposed seizure detection method is promising.
Table 9
Comparison study of the present work with other existing methods on CHB-MIT dataset
| Authors | Features | Algorithm | Number of patients | Number of samples | Patient specific | Channel specific | Accuracy (%) |
| Kaleem et al. [17] | Wavelet transform | Support vector machine, Linear Discriminant Analysis | 23 | 1,024 samples per segment | Yes | No | 99.6 |
| Siddiqui et al. [32] | Mean. Entropy, energy, etc. | Support vector machine, Ensemble, Decision tree | 2 | 2,520; 1,440 (10 s epoch) | Yes | No | 99.5 |
| 50,400; 28,800 (0.5 s epoch) | |||||||
| Boonyakitanont et al. [8] | Bayesian error rate | Artificial neural network, Convolutional neural network | 24 | 1,889 (Artificial neural network) | Yes | Yes | 98.6 |
| 7,945 (Convolutional neural network) | |||||||
| Chakrabarti et al. [10] | Wavelet transform | Artificial neural network | 10 | 1,688,775 samples | No | No | 95.3 |
| Yuan et al. [39] | EEG embedding | Wavelet transform – CtxEEG | 9 | 4,302 EEG fragments | – | Yes | 92.2 |
| Tsiouris et al. [34] | Statistical moments, energy spectrum, etc. | Neural Network, Support vector machine | 24 | 121,062 samples each in pre-ictal &inter-ictal phase | Yes | No | 86.7 |
| Usman et al. [37] | Convolutional neural network | Support vector machine | 24 | 32,576 (Training phase) | Yes | No | – |
| Zhou et al. [41] | – | Convolutional neural network | 24 | – | Yes | No | 59.5 |
| This work | Moving window of Standard deviation | Random Forest | 10 | 1,178,599 (Training phase) | No | No | 91.9 |
| 505,097 (Testing phase) |
*‘-’means not specified clearly
6.Conclusion
The main aim of this work is to suggest a method which is channel independent, does not depend on patients and has a better accuracy for the detection of pediatric epileptic seizures. Features belonging to different domains namely, time, frequency, and time-frequency have been used for extracting suitable features from the EEG signals. Each classifier has been analyzed using each feature to find the most appropriate classifier that can be used for seizure detection. In this work, a generalized approach has been used for all the classifiers to present a detailed analysis regarding seizure detection. Although the decision tree has taken the least computational time for training the model but has shown the least accuracy when it came to seizure detection. While the random forest has been the most computationally exhausting model for training the dataset but presented the best accuracy in detecting seizure signals from non-seizure signals. Therefore, the present comparison study not only provides a brief idea about selecting a classifier for seizure detection but also leaves room for improvement in enhancing the performance of the classifiers. The epileptic seizure detection techniques have challenges like selecting appropriate classifiers and features. However, in this work, the random forest method has been chosen out of four methods because it has advantages over others. Random forest classifiers are efficient for imbalanced data and high-dimensional datasets than neural network, and decision tree methods. The random forest method can generate more logic rules compared to the decision tree which will provide good accuracy. The method will fail if the signal is not correctly recorded by the EEG channel or in a situation where any of the channels is missing. The next step is to validate the proposed method with a real-time setup in a hospital where EEG signals from the patient will be given to the proposed framework and output will be displayed in the monitor. It will be analyzed that if the proposed method is working in real time or not. If not, then further work will be done on feature extraction and the classifier will be modified accordingly to provide a good detection rate. The future direction lies in designing an energy and cost-efficient model that would be effective for seizure detection. As the random forest has shown to work well for seizure detection, tree-based techniques can be considered for hardware implementation, as they are portable, lightweight, and suitable to be integrated on a chip.
Conflict of interest
The authors have no conflict of interest to report.
References
[1] | E. Abdulhay, M. Alafeef, A. Abdelhay and A. Al-Bashir, Classification of normal, ictal and inter-ictal EEG via direct quadrature and random forest tree, Journal of Medical and Biological Engineering 37: (6) ((2017) ), 843–857. doi:10.1007/s40846-017-0239-z. |
[2] | R. Abiyev, M. Arslan, J.B. Idoko, B. Sekeroglu and A. Ilhan, Identification of epileptic eeg signals using convolutional neural networks, Applied Sciences 10: (12) ((2020) ), 4089. doi:10.3390/app10124089. |
[3] | K. Abualsaud, M. Mahmuddin, M. Saleh and A. Mohamed, Ensemble classifier for epileptic seizure detection for imperfect EEG data, The Scientific World Journal (2015). |
[4] | E. Alickovic, J. Kevric and A. Subasi, Performance evaluation of empirical mode decomposition, discrete wavelet transform, and wavelet packed decomposition for automated epileptic seizure detection and prediction, Biomedical Signal Processing and Control 39: ((2018) ), 94–102. doi:10.1016/j.bspc.2017.07.022. |
[5] | S.A. Alshebeili, A. Sedik, B. Abd El-Rahiem, T.N. Alotaiby, G.M. El Banby, H.A. El-Khobby, M.A. Ali, A.A. Khalaf and F.E. Abd El-Samie, Inspection of EEG signals for efficient seizure prediction, Applied Acoustics 166: ((2020) ), 107327. doi:10.1016/j.apacoust.2020.107327. |
[6] | S. Amiri, J. Mehvari-Habibabadi, N. Mohammadi-Mobarakeh, S.S. Hashemi-Fesharaki, M.M. Mirbagheri, K. Elisevich and M.R. Nazem-Zadeh, Graph theory application with functional connectivity to distinguish left from right temporal lobe epilepsy, Epilepsy Research 167: ((2020) ), 106449. doi:10.1016/j.eplepsyres.2020.106449. |
[7] | I. Beheshti, D. Sone, N. Maikusa, Y. Kimura, Y. Shigemoto, N. Sato and H. Matsuda, Pattern analysis of glucose metabolic brain data for lateralization of MRI-negative temporal lobe epilepsy, Epilepsy Research 167: ((2020) ), 106474. doi:10.1016/j.eplepsyres.2020.106474. |
[8] | P. Boonyakitanont, A. Lek-uthai, K. Chomtho and J. Songsiri, A Comparison of Deep Neural Networks for Seizure Detection in EEG Signals, bioRxiv (2019), 702654. |
[9] | A. Burrello, K. Schindler, L. Benini and A. Rahimi, Hyperdimensional computing with local binary patterns: One-shot learning of seizure onset and identification of ictogenic brain regions using short-time ieeg recordings, IEEE Transactions on Biomedical Engineering 67: (2) ((2019) ), 601–613. doi:10.1109/TBME.2019.2919137. |
[10] | S. Chakrabarti, A. Swetapadma, A. Ranjan and P.K. Pattnaik, Time domain implementation of pediatric epileptic seizure detection system for enhancing the performance of detection and easy monitoring of pediatric patients, Biomedical Signal Processing and Control 59: ((2020) ), 101930. doi:10.1016/j.bspc.2020.101930. |
[11] | J.E. da Rosa Tavares and J.L. Victória Barbosa, Ubiquitous healthcare on smart environments: A systematic mapping study, Journal of Ambient Intelligence and Smart Environments Preprint (2020), 1–17. |
[12] | H. Daoud and M.A. Bayoumi, Efficient epileptic seizure prediction based on deep learning, IEEE Transactions on Biomedical Circuits and Systems 13: (5) ((2019) ), 804–813. doi:10.1109/TBCAS.2019.2929053. |
[13] | H. Gao, X. Du, W. Li, W. Liu and D. Zhou, Seizure description accuracy and seizure classification results from patient histories, Epilepsy Research 167: ((2020) ), 106413. doi:10.1016/j.eplepsyres.2020.106413. |
[14] | H. Göksu, EEG based epileptiform pattern recognition inside and outside the seizure states, Biomedical Signal Processing and Control 43: ((2018) ), 204–215. doi:10.1016/j.bspc.2018.03.004. |
[15] | I. Gryech, M. Ghogho, H. Elhammouti, N. Sbihi and A. Kobbane, Machine learning for air quality prediction using meteorological and traffic related features, Journal of Ambient Intelligence and Smart Environments (Preprint) (2020), 1–13. |
[16] | W. Hussain, M.T. Sadiq, S. Siuly and A.U. Rehman, Epileptic seizure detection using 1 D-convolutional long short-term memory neural networks, Applied Acoustics 177: ((2021) ), 107941. doi:10.1016/j.apacoust.2021.107941. |
[17] | M. Kaleem, A. Guergachi and S. Krishnan, Patient-specific seizure detection in long-term EEG using wavelet decomposition, Biomedical Signal Processing and Control 46: ((2018) ), 157–165. doi:10.1016/j.bspc.2018.07.006. |
[18] | G. Louppe, Understanding random forests: From theory to practice, 2014, preprint, arXiv:1407.7502. |
[19] | O. Maimon and L. Rokach (eds), Data Mining and Knowledge Discovery Handbook, (2005) . |
[20] | F. Manzouri, S. Heller, M. Dümpelmann, P. Woias and A. Schulze-Bonhage, A comparison of machine learning classifiers for energy-efficient implementation of seizure detection, Frontiers in systems neuroscience 12: ((2018) ), 43. doi:10.3389/fnsys.2018.00043. |
[21] | H. Niknazar, S.R. Mousavi, M. Niknazar, V. Mardanlou and B.N. Coelho, Performance analysis of EEG seizure detection features, Epilepsy Research 167: ((2020) ), 106483. doi:10.1016/j.eplepsyres.2020.106483. |
[22] | I. Omerhodzic, S. Avdakovic, A. Nuhanovic, K. Dizdarevic and K. Rotim, Energy distribution of EEG signal components, by wavelet transform (Vol. 2). Chapter (2012). |
[23] | D. Opitz and R. Maclin, Popular ensemble methods: An empirical study, Journal of artificial intelligence research 11: ((1999) ), 169–198. doi:10.1613/jair.614. |
[24] | Physionet CHB-MIT Scalp EEG Databse Boston, https://www.physionet.org/pn6/chbmit, dataset. |
[25] | R. Polikar, The Wavelet Tutorial, (1996) . |
[26] | A. Prati, C. Shan and K.I.-K. Wang, Sensors, vision and networks: From video surveillance to activity recognition and health monitoring, Journal of Ambient Intelligence and Smart Environments 11: (1) ((2019) ), 5–22. |
[27] | M.A. Rahman, M.F. Hossain, M. Hossain and R. Ahmmed, Employing PCA and t-statistical approach for feature extraction and classification of emotion from multichannel EEG signal, Egyptian Informatics Journal 21: (1) ((2020) ), 23–35. doi:10.1016/j.eij.2019.10.002. |
[28] | M.M. Rahman, M.I.H. Bhuiyan and A.B. Das, Classification of focal and non-focal EEG signals in VMD-DWT domain using ensemble stacking, Biomedical Signal Processing and Control 50: ((2019) ), 72–82. doi:10.1016/j.bspc.2019.01.012. |
[29] | A. Rehman, A. Athar, M.A. Khan, S. Abbas, A. Fatima and A. Saeed, Modelling, simulation, and optimization of diabetes type II prediction using deep extreme learning machine, Journal of Ambient Intelligence and Smart Environments 12: (2) ((2020) ), 125–138. doi:10.3233/AIS-200554. |
[30] | J.L.G. Rosa, Biologically plausible artificial neural networks, in: Artificial Neural Networks-Architectures and Applications, K. Suzuki, ed., IntechOpen, (2013) . |
[31] | M.M. Shaker, EEG waves classifier using wavelet transform and Fourier transform, Brain 2(3) (2006). |
[32] | M.K. Siddiqui, M.Z. Islam and M.A. Kabir, Analyzing performance of classification techniques in detecting epileptic seizure, in: International Conference on Advanced Data Mining and Applications, Springer, Cham, (2017) , pp. 386–398. doi:10.1007/978-3-319-69179-4_27. |
[33] | S.W.E.C. Sleep-Wake-Epilepsy-Center, University Department of Neurology at the Inselspital Bern and the Integrated Systems Laboratory of the ETH Zurich, http://ieeg-swez.ethz.ch/, dataset. |
[34] | K.M. Tsiouris, V.C. Pezoulas, D.D. Koutsouris, M. Zervakis and D.I. Fotiadis, Discrimination of preictal and interictal brain states from long-term EEG data, in: 2017 IEEE 30th International Symposium on Computer-Based Medical Systems (CBMS), IEEE, (2017) , pp. 318–323. doi:10.1109/CBMS.2017.33. |
[35] | T. Tuncer, A new stable nonlinear textural feature extraction method based EEG signal classification method using substitution Box of the Hamsi hash function: Hamsi pattern, Applied Acoustics 172: ((2021) ), 107607. doi:10.1016/j.apacoust.2020.107607. |
[36] | K.D. Tzimourta, L.G. Astrakas, A.M. Gianni, A.T. Tzallas, N. Giannakeas, I. Paliokas and D.T.M. Tsipouras, Evaluation of window size in classification of epileptic short-term EEG signals using a Brain Computer Interface software, Engineering, Technology & Applied Science Research 8: (4) ((2018) ), 3093–3097. doi:10.48084/etasr.2031. |
[37] | S.M. Usman, S. Khalid and M.H. Aslam, Epileptic seizures prediction using deep learning techniques, IEEE Access 8: ((2020) ), 39998–40007. doi:10.1109/ACCESS.2020.2976866. |
[38] | Y. Wang, A. Yalcin and C. VandeWeerd, Health and wellness monitoring using ambient sensor networks, Journal of Ambient Intelligence and Smart Environments 12: (2) ((2020) ), 139–151. doi:10.3233/AIS-200553. |
[39] | Y. Yuan, G. Xun, K. Jia and A. Zhang, A multi-context learning approach for EEG epileptic seizure detection, BMC systems biology 12: (6) ((2018) ), 47–57. |
[40] | T. Zhang, W. Chen and M. Li, Generalized Stockwell transform and SVD-based epileptic seizure detection in EEG using random forest, Biocybernetics and Biomedical Engineering 38: (3) ((2018) ), 519–534. doi:10.1016/j.bbe.2018.03.007. |
[41] | M. Zhou, C. Tian, R. Cao, B. Wang, Y. Niu, T. Hu, H. Guo and J. Xiang, Epileptic seizure detection based on EEG signals and CNN, Frontiers in neuroinformatics 12: ((2018) ), 95. doi:10.3389/fninf.2018.00095. |

