
Projections of Socioeconomic Costs for Individuals with Dementia in China 2020–2050: Modeling Study
Abstract
Background:
Previous estimates on future socioeconomic costs of dementia in China are inconsistent, and the main drivers of these costs are unclear.
Objective:
This study projected future socioeconomic costs (healthcare, formal social care, and informal care costs) and value of quality adjusted life years (QALYs) lost to dementia in China and assessed drivers of socioeconomic costs.
Methods:
Based on our prior projection on dementia cases to 2050 by a Markov model, we forecasted future socioeconomic costs and the value of QALYs from a societal perspective, utilizing the China Health and Retirement Longitudinal Study and the Chinese Longitudinal Healthy Longevity Survey. In our main analysis, dementia incidence increased by 2.9% annually, while sensitivity analyses considered a flat or 1.0% annual decrease in the temporal trend of dementia incidence. Furthermore, we decomposed socioeconomic costs changes (2018 US$) into population growth, population aging, dementia prevalence and average socioeconomic costs per case.
Results:
The annual socioeconomic costs and value of QALYs lost to dementia will reach $1,233 billion and $702 billion by 2050. If dementia incidence stays constant or decreases by 1.0% annually, the costs and QALYs would respectively decrease by 34% or 43% in 2050. Informal care is currently, and projected to remain, the largest share of socioeconomic costs. Population aging and rising dementia prevalence will mainly drive the growth in socioeconomic costs through 2050.
Conclusions:
Dementia casts an increasingly large economic burden on Chinese society, mainly driven by fast aging population and growing dementia prevalence.
INTRODUCTION
Dementia represents a significant societal burden. While most studies on the costs for individuals with dementia are carried out in high-income countries such as Japan,1 the United States and European countries,2–4 evidence for low- and middle-income countries is scarce. We focus on China, where population aging, resulting from growing life expectancy and declining fertility, is expected to rapidly increase the number of dementia cases and its associated costs.5
There are only a handful of studies that estimated future socioeconomic costs for individuals with dementia in China, varying from $368 to $2,617 billion in 2050.5–7 Although dementia care in China primarily takes place at home and in the community,8 prior studies instead mainly recruited patients from hospitals or nursing institutions,5,7 leaving out those untreated hiding in the community. There is not yet any community-based study on a national scale. Furthermore, previous evidence focused on three types of socioeconomic costs, namely healthcare, formal social care (paid social care services provided by professional caregivers), and informal care, while the Quality Adjusted Life Years (QALYs) lost to dementia has not been considered.9 As a summary measure of disease burden, QALYs lost encompass both the quantity and quality of life. This is particularly relevant for intangible costs for individuals with dementia, as patients’ quality of life deteriorates significantly as the neurodegenerative disease progresses over approximately 8–10 years.10
Based on the estimation of socioeconomic costs, it is essential to identify the primary drivers of the costs growth of dementia, which can help assist the government in pinpointing areas for potential future savings. However, less is known about the main drivers of dementia socioeconomic costs in China. As far as we know, the only relevant study is by Xu, who indicated the main contributors were population aging and dementia prevalence.11 However, Xu projected future dementia prevalence mainly based on previous estimates, failing to account for variations in the temporal trend of dementia incidence, which may fundamentally influence the projected number of dementia cases and the corresponding costs.5 Given the projected declines in the Chinese population and anticipated increases in costs per case, the extent to which these changes will contribute to future dementia-related costs requires further investigation.12
Our study aimed to project the socioeconomic costs and value of QALYs lost to dementia in China between 2020 and 2050, utilizing national representative data and updated estimates on dementia prevalence. Additionally, we investigated the drivers of the projected future costs, by quantifying the relative contributions made by population growth, population aging, dementia prevalence, and average socioeconomic costs per dementia case.
METHODS
Study design and sample
To forecast socioeconomic costs and QALYs lost to dementia between 2020 and 2050, we conducted a simulation modeling approach utilizing the IMPACT Chinese Ageing Model (IMPACT-CAM). This multistate-Markov macrosimulation model has been previously developed and validated (Supplementary Figure 1).13 Prevalence of dementia and other related states (e.g., cognitive impairment (CI), functional impairment (FI), cardiovascular disease (CVD), and death) and transition probabilities (TPs) between health states were estimated using two nationally representative datasets, namely, the China Health and Retirement Longitudinal Study (CHARLS) and the Chinese Longitudinal Healthy Longevity Survey (CLHLS).14,15 These two cohorts are widely used in China’s healthy aging studies.16,17 For each study sample, participants with missing key variables on sociodemographic characteristics (e.g., age, sex) and health states (CVD, FI, and dementia) over repeat measures were less than 5%. IMPACT-CAM projected age- and sex-specific dementia cases of these aged 50+ years by year to2050.13
The corresponding costs and the value of QALYs lost associated with these dementia cases were estimated in this study. We included 24,983 CHARLS participants living in the community, who provide high-quality data on healthcare costs, informal care usage and QALY. Another 33,249 CLHLS participants were included to provide additional data on formal social care usage, covering both community and nursing home settings. The sample selection flowchart is shown in Figure S2. CLHLS and CHARLS were separately approved by the Research Ethics Committee of Peking University (IRB00001052– 13074; IRB00001052-11015).
Case definition of dementia
We defined an individual to have dementia if s/he has a combination of CI and FI or if s/he self-reported his/herself to have doctor-diagnosed dementia or memory-related disease. CI was defined as an impairment in two or more domains of cognitive function, measured using the modified Telephone Interview for Cognitive Status questionnaire via a face-to-face interview in CHARLS and Mini-Mental State Examination in CLHLS.14,15 Based on confirmatory factor analysis,18 a common three-factor cognitive construct of orientation, memory, and executive function and language was found for both datasets. Domain-specific impairment was quantified if an individual scored 1.5 standard deviations below the mean factor score of the counterpart population with the same level of education. Those who require assistance in performing one or more Activities of Daily Living (ADL) were defined as functionally impaired. Participants’ ADLs were measured by Katz ADL scale.19 This definition of dementia was adapted to resemble Diagnostic and Statistical Manual of Mental Disorders (DSM)-IV, DSM-5, and International Classification of Diseases 10th edition for diagnosis of dementia.
Definition of socioeconomic costs and utility weights for QALYs
To capture the socioeconomic burden faced by individuals with dementia in China over time, we estimated the associated gross costs from a societal perspective that includes healthcare, formal social care, informal care costs of dementia, and the value of QALYs (Supplementary Table 1).
Healthcare costs
In CHARLS, respondents were asked to report healthcare costs of outpatient care of past month, inpatient care of past year, and self-treatment of past month (i.e., any self-purchased medicine, health supplement and healthcare equipment). We calculated the annual total healthcare costs by summarizing these three types of costs.
Formal care costs
Formal care costs were the product of formal social care usage and its unit price. Formal social care usage was derived from CLHLS participants, who had FI and received care from formal social caregivers (i.e., housekeepers and social services providers), plus those without FI but currently living in a nursing home. The age-, sex-, and health states-specific formal social care usage of CLHLS were then used to estimate the corresponding probability for their CHARLS counterparts.
Considering different prices between formal social care at home and in nursing homes, an average unit price of formal social care was estimated by calculating the weighted average unit prices of these two settings (Equation 1). The unit price of formal social care at home was estimated at $9,259, corresponding to the annual average wage of services providers, as reported by the latest National Bureau Statistics.20 The unit price of formal social care in nursing homes was assumed to be twice as expensive as formal social care at home, to reflect extra costs of staff time, accommodations and meals, etc., in line with observations of CLHLS.
(1)
Informal care costs
Informal care costs were the product of informal care hours and the hourly unit price. Informal care hours were calculated by CHARLS participants with ADLs, or Instrumental Activities of Daily Living (IADLs) limitations, who reported the number of hours per month cared by family or friends. Unit price of informal care was estimated at $4.5 per hour via the replacement cost approach, assuming a total value of 2,080 hours’ informal caregiving per year (40 hours/week, 52 weeks/year) equivalent to the annual average wage of services providers (i.e. $9,259).20,21
Utility weights for QALYs
Utility weights for QALYs were obtained based on EuroQol five-dimensions questionnaire (EQ-5D) and the utility values. EQ-5D is a health-related quality of life questionnaire widely used in economic, clinical, and population health studies.22 In CHARLS, participants answered five health profile questions, which were analogous to the five domains of the EQ-5D instrument (anxiety/depression, pain/discomfort, usual activities, self-care, and mobility) (Supplementary Table 2). Based on answers to these questions, we obtained utility weights for QALYs, using Chinese utility values for EQ-5D health states elicited from a general population.23 Among those classified as having dementia, 42.9% were found to have missing items on the EQ-5D scale. To address this, missing item values were substituted with the average of other items within the same domain for each individual, while missing utility weights were estimated using the average utility weights of individuals with matching age, gender, and health states. Comparing the mean utility weight of complete cases to the imputed utility weights of incomplete cases revealed minimal difference (0.41 versus 0.40, with a non-significant p-value >0.05). The mean utility value of QALYs for our sample was 0.41, with a standard deviation (SD) of 0.21.
Statistical analysis
Projection of socioeconomic costs and value of QALYs lost to dementia
IMPACT-CAM is a population-based discrete-time probabilistic Markov model designed to track the progression of the Chinese population aged 35–100 years through eight distinct health states. These states are defined by the presence or absence of cognitive impairment, CVD, disability, and two states representing death from CVD and non-CVD causes to 2050. The transitions of individuals among these health states are determined by age, sex, and calendar year-specific transition probabilities (TPs) per year, with a new disease-free cohort of 35-year-olds entering into the model annually. TPs were derived as a function of age and sex, utilizing incident cases between wave n and n+1 of CHARLS, with pooled data attributing to the survey midpoint. The detailed assumptions about transition probability of IMPACT-CAM were shown in Supplementary Table 3. The logistic model for age-sex specific TPs from statei to statej was constructed by setting the statej as the dependent variable, and independent variables included the age, sex, age and sex interaction term and the variable defining the initial state(statei).
(2)
Age- and sex-specific socioeconomic costs for individuals with dementia were estimated by a mixed model with age, sex, health status (dementia, CVD, FI, and their combination, altogether eight health states) and year (2011–2018). Future socioeconomic costs matching dementia cases of IMPACT-CAM were projected based on the estimated coefficients from the mixed model, assuming that age- and sex-specific costs for individuals with dementia would experience linear changes on an annual basis. Similar mixed model with observed utility weights as outcome was used to estimate age- and health states-specific utility weights. QALYs lost to dementia were then calculated as the differences of the annualized utility weights between the general population and dementia patients multiplied by the number of dementia cases predicted by IMPACT-CAM. According to a population-based survey from China,24,25 the average willingness to pay for one additional QALY covered from 1 to 3 times the gross domestic product (GDP) per capita under different scenarios. In this study, the QALYs lost were valued at 3 times the country-level GDP per capita, and valued at 1 and 2 times GDP per capita in our sensitivity analysis.
Costs were fitted to a beta distribution where the 95% uncertainty intervals represented±20% of these cost point estimates.26 Given the low uncertainty surrounding the prediction of utility weights for QALYs (standard error <0.2), there was no probabilistic distribution added to the QALY weights. Sensitivity analyses were conducted to account for uncertainty in the future trend of dementia incidence. Dementia incidence grew at an annual rate of 2.9% in our main analysis as an upper limit, based on evidence from Shanghai Ageing Studies with a clinical diagnosis of dementia and similar education structure of its baseline sample as CHARLS (≤6 years 63.8% versus 69.6%).27 Given that nationwide prevention may potentially alter dementia incidence, we set the temporal trend of dementia incidence to be flat or decrease by 1.0% annually for sensitivity analyses.5 The alternative options indicate a relative annual decline in dementia incidence, with an example where an incidence of 2.9% means the incidence rate in year n+1 equal to incidence rate in year n multiplied by (1+2.9%). To align with the latest waves of CHARLS and CLHLS, all observed costs were deflated to 2018 US$, with an exchange rate of $1.0 equivalent to 6.7 Chinese yuan.
Main drivers of socioeconomic costs for individuals with dementia
We adopted the Das Gupta decomposition method to decompose the growth of socioeconomic costs associated with dementia into the effects of population growth,28 population aging, dementia prevalence, and average socioeconomic costs per dementia case. This commonly-used decomposition method distributes interaction effects among the four factors across the main effects, and renders relative importance of each driver to the outcome.28 Specifically, it performs counterfactual scenarios to evaluate the impact of each factor on changes from the present level assuming that all other factors remain constant during the study period. For instance, the driver of dementia prevalence reflects the age-standardized dementia prevalence, in alignment with previous studies.12,29 The aggregate socioeconomic costs for individuals with dementia can be expressed as the product of these four drivers (Equation 3).
(3)
Table 1
Calculation of drivers of dementia socioeconomic costs
| Drivers | Calculation | Age range |
| Population growth | Total population size | 0+ |
| Population aging |
| 50+ |
| Dementia prevalence |
| 50+ |
| Average socioeconomic costs for individuals with dementia |
| 50+ |
United Nations forecasts of population growth and aging were used as demographic factors in our model. Non-demographic factors included growth in dementia prevalence (conditional on age and sex) projected by IMPACT Chinese Ageing Model and average socioeconomic costs per case, which we estimated using the China Health and Retirement Longitudinal Study, and Chinese Longitudinal Healthy Longevity Survey.
Based on Equation 3, we calculated the share of the growth in total dementia costs from 2020 (reference group) to 2050 attributable to each driver, indicating the relative contribution of that factor. The sum of the relative contribution of all factors in each year was equal to 100%.
We followed GATHER checklist for accurate and transparent health estimates reporting (Supplementary Table 4).
RESULTS
Projection of socioeconomic costs and value of QALYs lost
The basic characteristics of CHARLS and CLHLS are shown in Supplementary Tables 4–6. Figure 1 shows age group-specific aggregate costs and average costs per dementia case in 2020. It shows that informal care accounted for the largest share of aggregate socioeconomic costs (71%), whereas formal social care was responsible for the smallest share (3%). The number of dementia cases across the four age groups, from lowest to highest, are as follows: 0.9 million, 3.0 million, 4.0 million, 3.5 million, and 0.7 million. Therefore, the aggregate costs for individuals with dementia were the lowest for 90–100 years old age group. In contrast, the costs were the highest for the 70–79 years old age group, due to high dementia cases for this group.
Fig. 1
Age group-specific annual average costs per case (A) and aggregate costs (B) of dementia in 2020. Cost estimations based on China Health and Retirement Longitudinal Study and Chinese Longitudinal Healthy Longevity Survey, and the projections came from IMPACT Chinese Ageing Model. Average annual costs per case mean the average annual dementia costs per case with dementia. Aggregate costs are equal to average costs per case multiplied by the number of dementia cases. The number of dementia cases in each age group was 0.9, 3.0, 4.0, 3.5, and 0.7 million.

The temporal trends of average costs per case and the aggregate costs from 2020 to 2050 are shown in Fig. 2. The average socioeconomic costs and value of QALYs lost to dementia were $15,391 and $10,433 per case in 2020, respectively, and will continue to grow to $18,570 and $10,586 in 2050. The annual aggregate socioeconomic costs (health care costs + formal care + informal care) are projected to grow from $186 billion in 2020 to $1,233 billion in 2050 and value of QALYs lost to dementia from $126 billion to $702 billion. The uncertainty intervals of these projections are shown in Supplementary Table 7, and the sensitivity analysis with different value of one QALY is displayed in Supplementary Figure 3.
Fig. 2
Time trend of average costs per case (A) and aggregate costs (B) of dementia from 2020 to 2050. Note. Cost estimations based on China Health and Retirement Longitudinal Study and Chinese Longitudinal Healthy Longevity Survey, and the projections came from IMPACT Chinese Ageing Model. Average annual costs per case mean the average annual dementia costs per case with dementia. Aggregate costs are equal to average costs per case multiplied by the number of dementia cases. The number of dementia cases in 2020, 2030, 2040, and 2050 was 12.1, 26.8, 46.6, and 66.3 million.
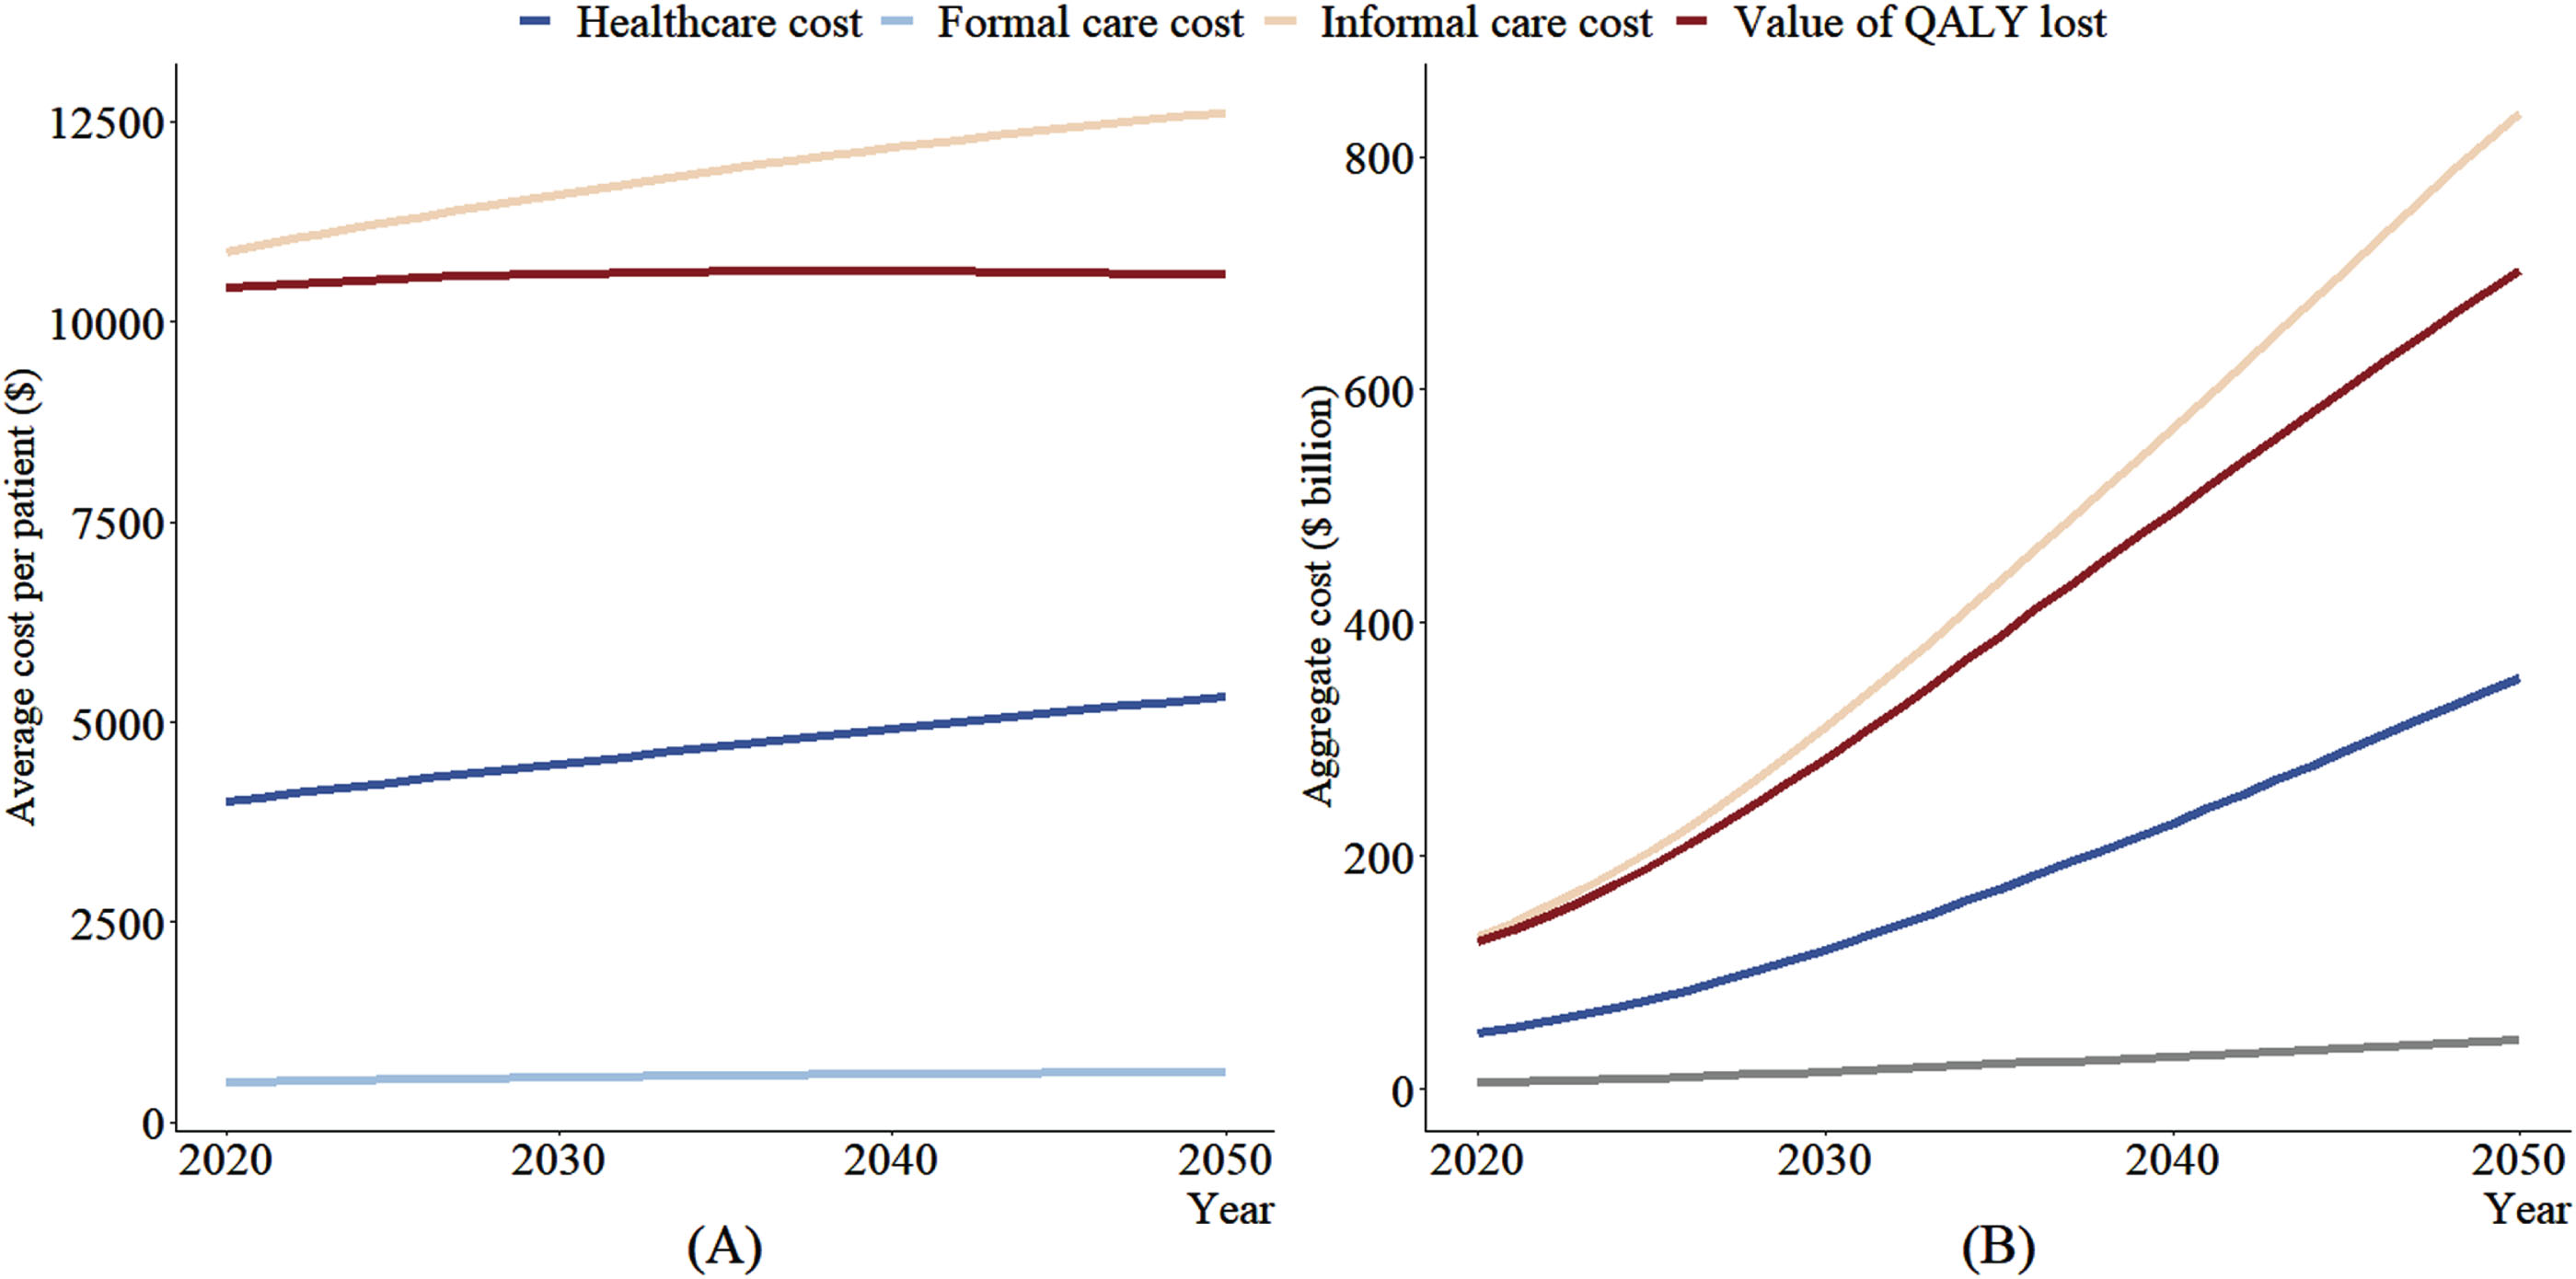
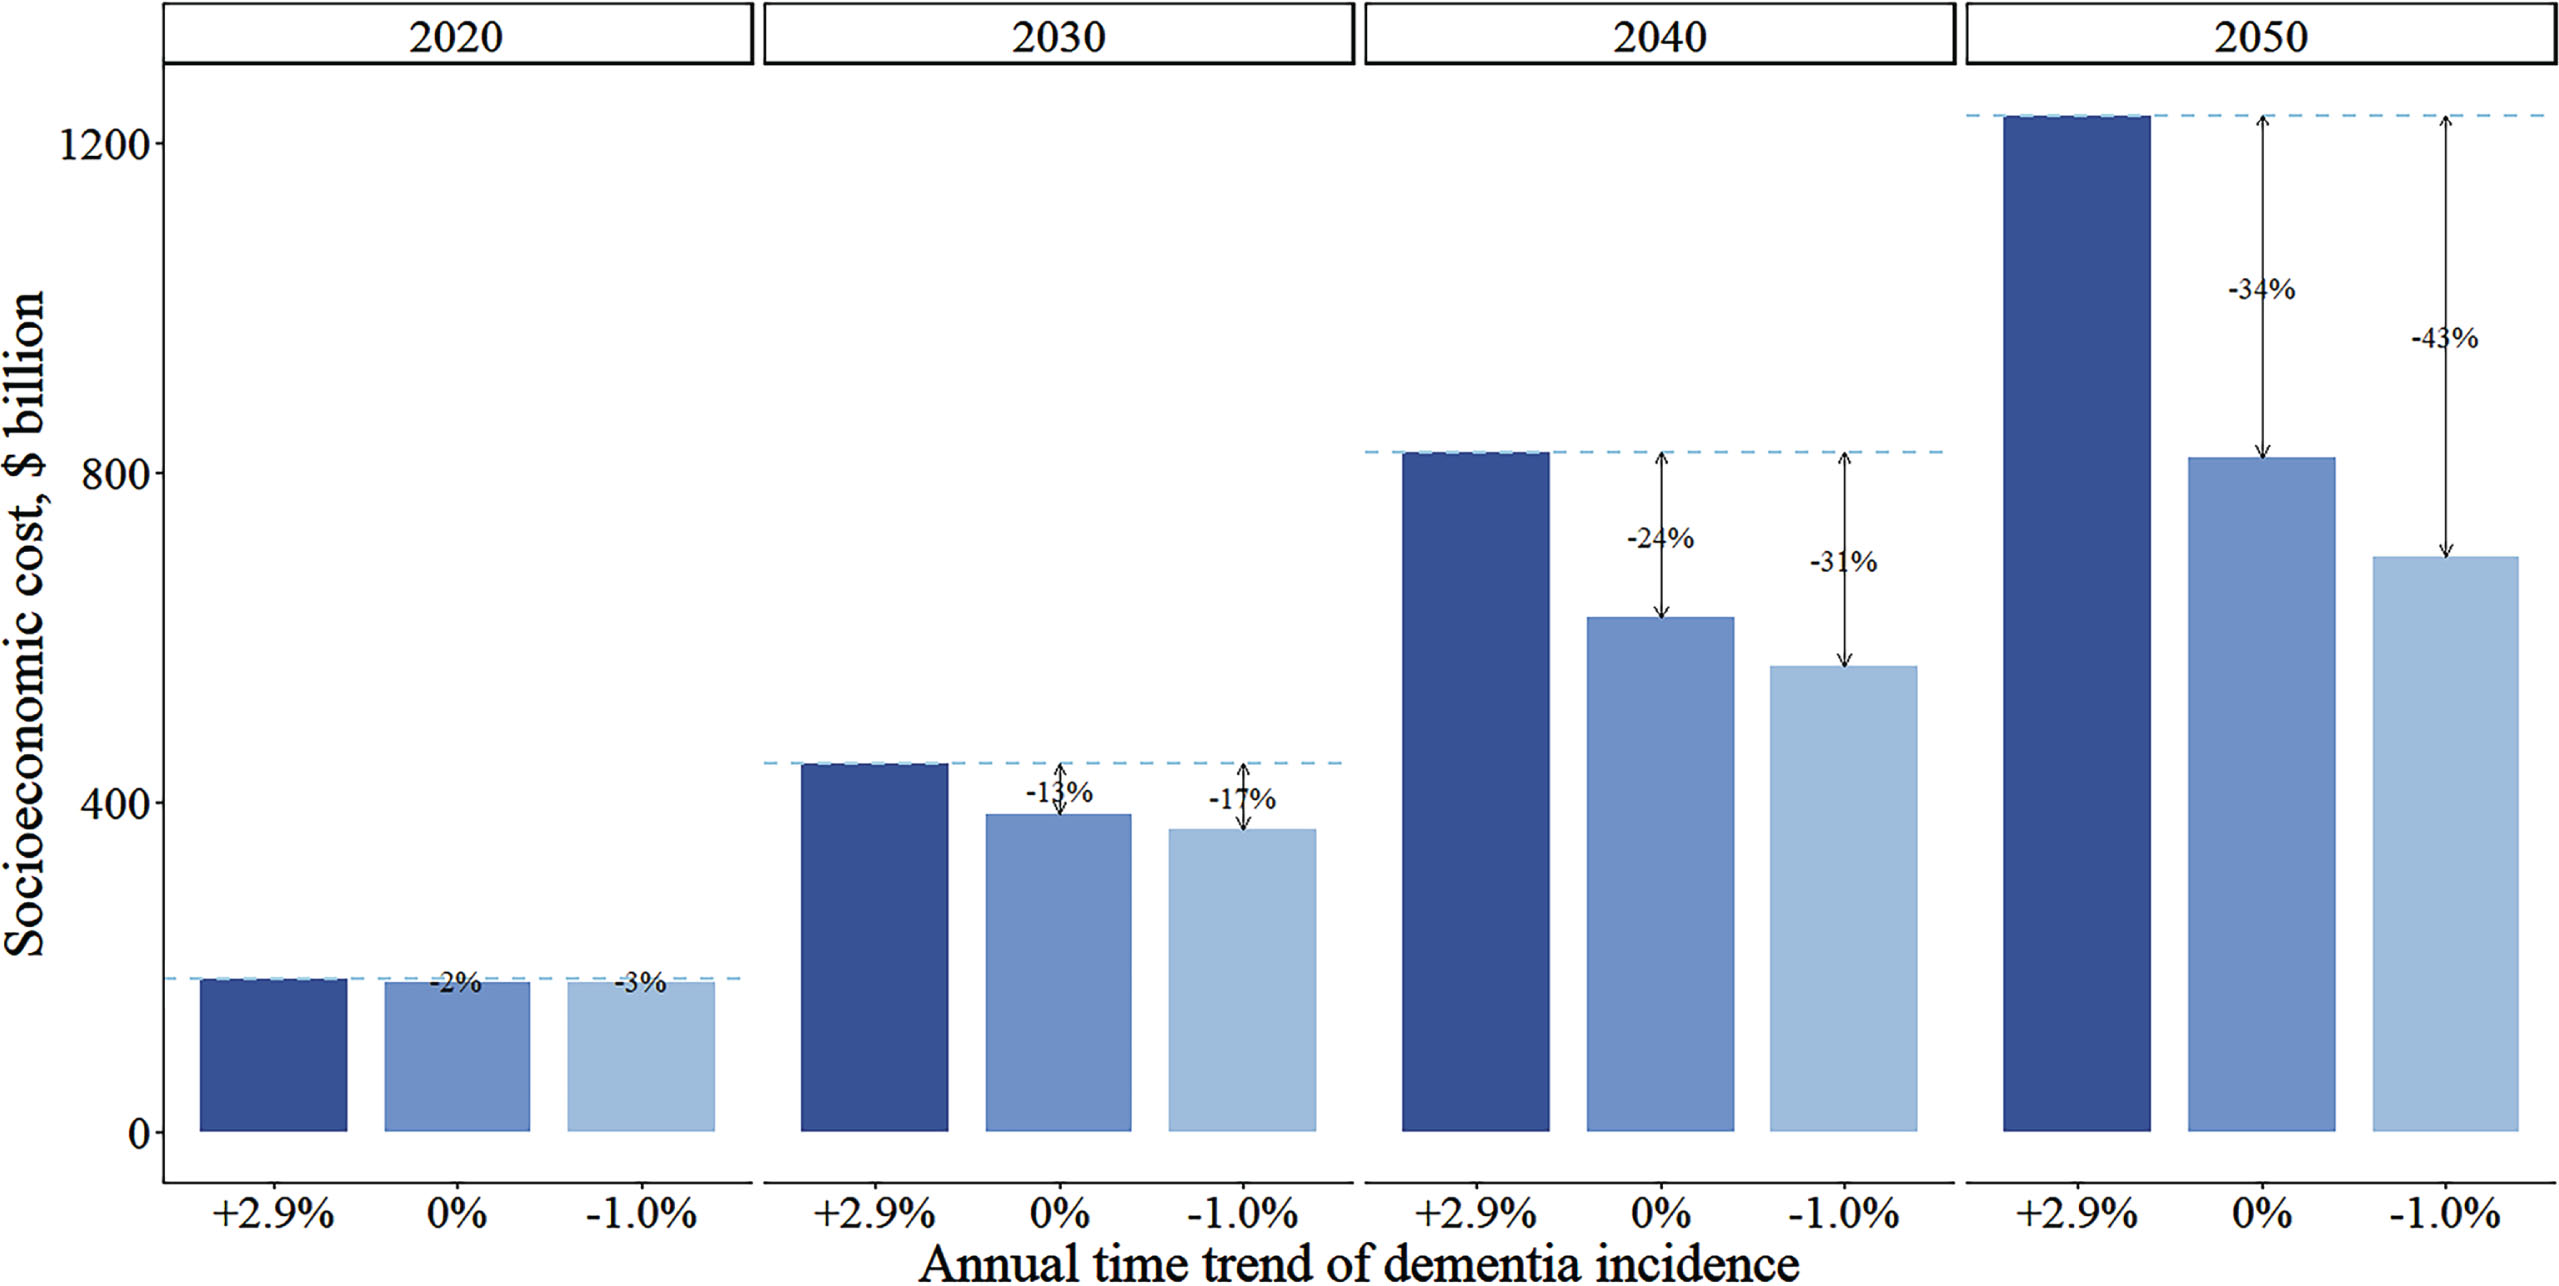
Figure 3 shows that the socioeconomic costs for individuals with dementia depend heavily on the assumed temporal trend of dementia incidence. If dementia incidence stays constant or decreases by 1.0% annually, the socioeconomic costs would respectively decrease by 34% or 43% in 2050 relative to our main analysis.
Fig. 3
Comparison of annual total socioeconomic costs for individuals with dementia by three assumptions on temporal trend of dementia incidence from 2020 to 2050. Cost estimations based on China Health and Retirement Longitudinal Study and Chinese Longitudinal Healthy Longevity Survey, and the projections came from IMPACT Chinese Ageing Model. Total socioeconomic costs consist of healthcare cost, formal social care and informal care costs. Lines indicate costs differences between the main assumption of increasing dementia incidence (+2.9% annually) with alternative falt (0%) or decline (–1.0%) assumptions.
Main drivers of socioeconomic cost
During the period from 2020 to 2050, the population in China will decrease from 1,433 million to 1,320 million, and the age structure will change significantly. The population size in the age groups 60–70, 70–80, 80–90, and 90+ will increase from 148, 76, 29, and 4 to 210, 167, 116, and 21 million respectively, while the share of the age group 50–59 sharply will decrease from 218 million to 175 million. Concurrently, dementia prevalence will increase from 3% to 11% during the same period.
Our main analysis shows that the largest driver of the rising socioeconomic costs for individuals with dementia between 2020 and 2050 is growing dementia prevalence (54%), followed by population aging (43%) (Fig. 4). Although dementia prevalence is the dominant driver over time, the relative contribution of it decreases over time, accompanied by an increasing trend of that of population aging. Using 2020 as the base year, the relative contribution of per capita healthcare costs is relatively stable between 2020 and 2050. Total population growth is negatively associated with socioeconomic costs’ growth, reflecting declines in the projected Chinese population size.
Fig. 4
Decomposition of change in aggregate socioeconomic costs (%) of dementia in China between 2020 (ref) to 2050. Population growth, population aging (aged 50+ years), dementia prevalence and average socioeconomic cost per patient under the assumption of a 2.9% relative annual increase of dementia incidence. Estimates for population growth are derived from the total population size from 2020 to 2050, of the United Nations (aged 0+). Population aging equals to population size in each age, sex group divided by total population size (aged 50+). Dementia prevalence equals to the number of dementia cases divided by population size in each age, sex group (aged 50+). Average costs per case are the aggregate socioeconomic costs (i.e., healthcare cost, formal social care and informal care costs) divided by the number of dementia cases (aged 50+).
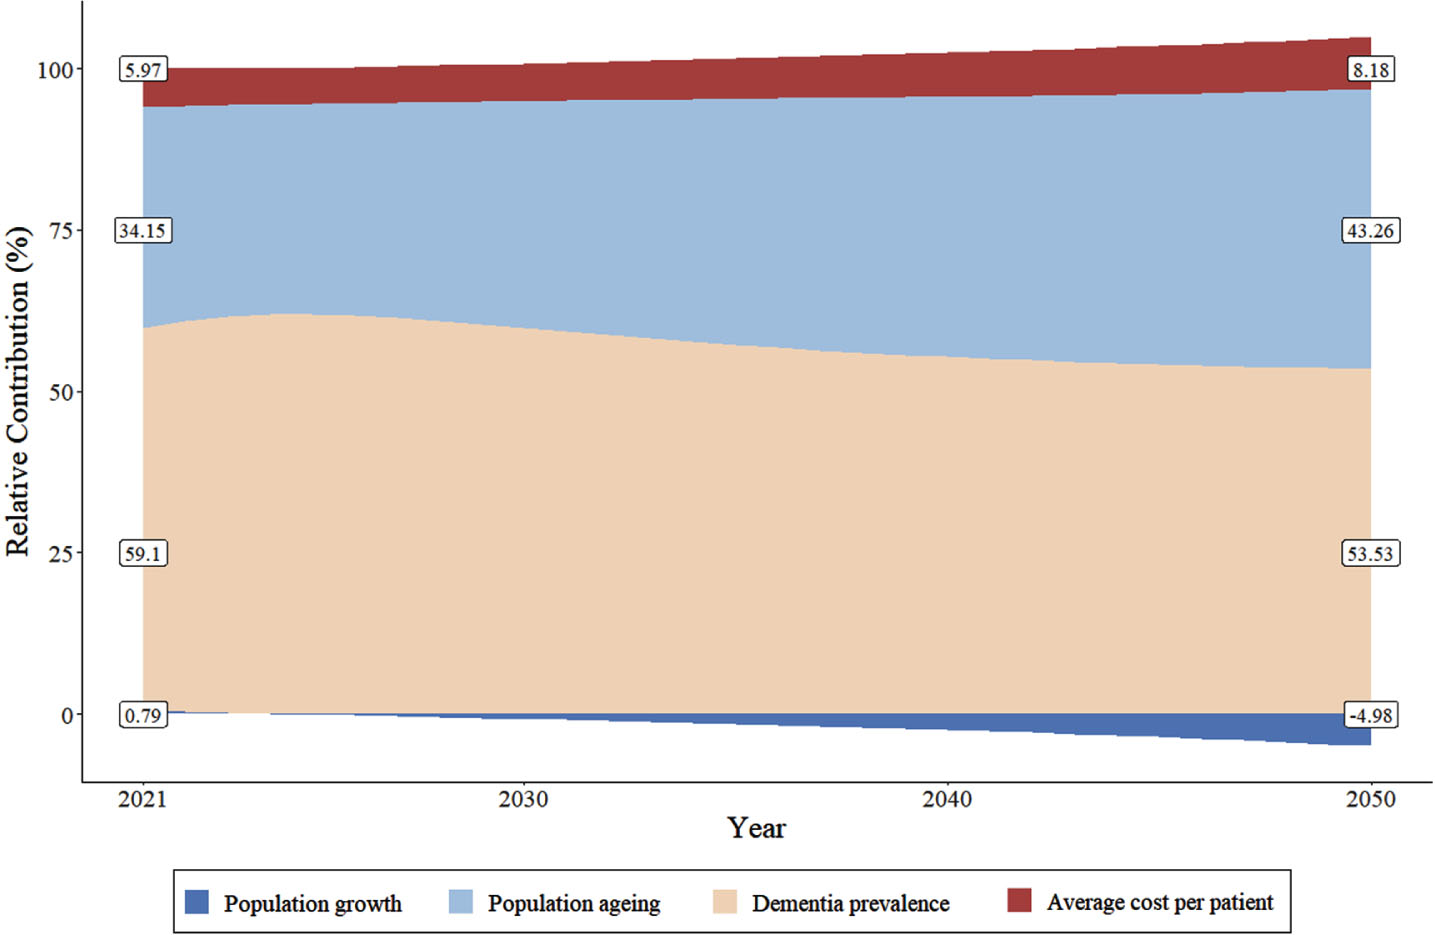
Supplementary Figure 4 displays the relative contribution of each driver for different trends of dementia incidence. If dementia incidence decreases by 1.0% annually or remains constant in the future, population aging would gradually replace dementia prevalence as the dominant driver. Specifically, if dementia incidence is to decrease by 1.0% annually, the relative contribution of population aging and dementia prevalence would be 41% and 51% between 2020 and 2021, respectively. By 2050, these two numbers will shift to 63% and 32%, respectively. A similar pattern of relative contribution is found for the case where dementia incidence stays constant.
DISCUSSION
Our study provides three projections of China’s future costs for individuals with dementia to 2050, using a macrosimulation modeling approach and several cost measures based on nationwide population aging samples. The growing prominence of dementia demands heightened attention and targeted interventions. The largest share of the estimated socioeconomic costs is informal care. Growth in these costs is mainly driven by rapid population aging and growing prevalence of dementia in the coming decades.
We predict that China’s socioeconomic costs and value of QALYs lost to dementia will rise from $186 billion and $126 billion in 2020 to $1,233 billion and $702 billion by 2050, respectively. This burden is going to be equivalent to nearly 60% of that of CVD in 2050, which has the largest economic burden in China.30,31 The projected aggregate socioeconomic costs for individuals with dementia fall within the range of previous studies, and the estimated magnitude of the increase over the next three decades in our study is close to previous forecasts (Supplementary Table 8).5–7 Our results are significantly lower than those of Jia’s and Li’s,5,7 while Huang’s appears to be an outlier.6 However, Huang’s study does report a similar proportion of informal care. In addition to differences in study samples’ representativeness, our study advances the evidence by taking into account the time effect in cost estimations, which is vital to indicate technological innovation,32 increased labor costs and the change of share of institutionalized individuals over time.33 According to Wittenberg’s study, number of patients with severe dementia will increase more quickly than those with mild forms thanks to developed technology, etc., and thus the share of institutionalized patients with severe dementia and their corresponding average cost is likely to rise rapidly in the future. Moreover, we filled the gap in current dementia costs literature about China by providing firsthand evidence on the previously neglected value of QALYs lost to dementia. The estimated value is non-trivial, nearly threefold as much as healthcare costs in 2020, equivalent to findings revealed by a UK-based study.26 These findings highlight the importance of including QALYs lost in estimating socioeconomic burden of dementia, with implications for healthcare planning and social care allocation.
This study shows that informal care costs are estimated to account for over two-thirds of the total socioeconomic costs. Corresponding to Jia’s study,7 which found that about half of socioeconomic costs were informal care costs, our findings further underscore the pivotal role of informal care costs. This could owe to our representative sample, which consists of a significant number of individuals with dementia residing in a community, where the burden on informal caregivers tends to be more substantial.34 Heavy use of informal care is commonly seen in low- and middle-income countries.35 China is transitioning into an accelerating aging society and facing increasing family caregiver burden of older adults with dementia, a phenomenon is becoming prevalent in developing countries in the Western Pacific such as Philippines.36 Filial piety remains the most important value regulating the behaviors of children towards their parents in Asian communities.37 Despite China’s long-term care insurance (LTCI) has been piloted, the relevant welfare benefits have not been given full consideration to individuals with cognitive impairments (Ye et al., unpublished results). Lacking access to formal social care combined with preferences for family care results in informal care making up the largest proportion of care and accounting for the majority of dementia costs.38 However, current support for informal caregivers is patchy, and regulation of informal care is inadequate,39 calling for tailored policies that support informal caregivers and ensure the quality of care for people with dementia.
Among the four drivers affecting future dementia costs, we identified population aging and dementia prevalence are the two main drivers. Our previous study also found that the overall dementia cases will escalate due to not only dementia prevalence, but also rapid population aging in China,13 leading to the substantial growth of aggregated dementia costs in this study. We verified a prior study by Xu and colleagues which also concludes the rapid aging population particularly after 2020,11 and the increasing dementia prevalence appeared to be the dominant forces behind the projected growth of dementia costs. The aging of the Chinese population is estimated to significantly contribute to increased dementia costs. This is consistent with Zhai’s finding that the impact of population aging on increasing healthcare costs after 2012 was greater than between 1993–2012.12,40 Moreover, we found over half of the socioeconomic costs’ growth is attributable to increasing dementia prevalence. For dementia incidence, we utilized the trend estimation from the Shanghai Aging Studies,27 revealing a potential increase despite the participants’ improved educational attainment (rising from 31% to 88% with over 6 years of education). Given the higher dementia rates in rural compared to urban areas, coupled with the rising prevalence of adult obesity, diabetes, and unhealthy lifestyles, the upward trend in dementia incidence may persist. As a result, we forecasted the corresponding dementia burden, reflecting a worst-case scenario. Furthermore, as indicated by our sensitivity analysis of a constant or declining (1.0%) dementia incidence temporal trend, the socioeconomic costs estimated would decrease by 34% or 43% respectively in 2050. As much as 44% of all dementia cases can be prevented or delayed by changing modifiable risk factors.41 Early detection and intervention are critical for reducing dementia incidence, and consequently alleviating its associated socioeconomic costs.
Our study has the strength that we used two nationally representative datasets of the Chinese population that capture all types of socioeconomic costs of health care, formal and informal care, and value of QALYs lost to dementia in China. However, there are several limitations in this study. First, we utilized the best available evidence, but the estimated costs could inevitably be influenced by a recall bias in self-reported healthcare costs or the huge variation in the unit price of formal social care in China. In this study, the assumption that institutional care is twice as expensive as home care was derived from CLHLS. This assumption may underestimate nursing home costs, as a prior study using propensity scores found residential care costs are 2 to 3 times higher than home care due to easier accessibility of care.42 Further nationwide studies collecting detailed cost information at home and in nursing home settings are needed to verify and update this assumption, and further studies would benefit from linkage data to medical insurance or/and LTCI data to enhance estimation accuracy. Second, we assumed a linear increase in socioeconomic costs over time as observed in CHALRS for the period 2011–2018. This assumption may nevertheless be violated due to various factors, such as the rolling-out LTCI policies on promoting formal social care usage and releasing informal caregivers burden. Further analyses are needed to evaluate policy impact on future socioeconomic burden of dementia. Third, we calculated missing utility weights by averaging those of individuals with corresponding age, gender, and health states. The resemblance in utility weights between complete and incomplete cases implies a potential bias toward cognitively healthier participants who completed the EQ-5D survey.43 However, our derived utility weights (mean = 0.41, SD = 0.21) were notably lower than the average utility weights identified among cognitively impaired patients with mild to severe dementia (mean = 0.94, SD = 0.10) in another study.44 Given the higher the utility weights the better a person’s quality of life,45 our study is likely to represent patients with moderate to severe dementia. Last, as clinical dementia diagnoses were unavailable in both cohorts, we defined dementia broadly to encompass various stages and types of this syndrome. This approach may overlook dementia severity and causes, resulting in a generalized cost estimate across all conditions. However, our algorithm-based definition, based on both cognitive and functional impairments, remains pertinent for health and social care policy by predicting the number of older adults requiring supportive care. Further, to fully consider the important comorbidities of dementia, such as CVD, IMPACT-CAM does not consider the severity of different physical impairments. Given the influence of the severity of dementia on costs,46 future studies should further explore differences in the socioeconomic costs for individuals with dementia using finer gradations of both dementia and the factors impacting dementia. Also, due to the absence of details about the care provider (such as age, gender, employment status) in CLHLS and CHARLS, we were unable to estimate the costs using the opportunity cost method. Previous studies indicate that estimates using the replacement cost method tend to be higher than those using the opportunity cost method.3,6 Consequently, our estimates based on the replacement cost method are likely higher. Future research could employ both the opportunity cost and replacement cost approaches to elucidate the differences between these two methods.
Conclusions
The socioeconomic costs and value of QALYs lost to dementia in China are projected to increase rapidly in coming decades, with informal care continuing to account for the largest proportion of the socioeconomic costs. Policy crafted to reduce the socioeconomic burden of dementia should pivot attention to informal caregivers. Given population aging and dementia prevalence are the two main drivers of the projected burden, effective public health interventions on dementia prevention and healthy aging are also urgently required.
AUTHOR CONTRIBUTIONS
Yanjuan Wu (Conceptualization; Data curation; Formal analysis; Methodology; Validation; Visualization; Writing – original draft); Yixuan Liu (Conceptualization; Data curation; Validation; Writing – original draft); Yuyang Liu (Conceptualization; Data curation; Formal analysis; Visualization; Writing – original draft); Yuntao Chen (Conceptualization; Methodology; Writing – review & editing); Sophia Lobanov-Rostovsky (Conceptualization; Supervision; Writing – review & editing); Yuting Zhang (Conceptualization; Data curation; Supervision); Yuanli Liu (Conceptualization; Data curation); Eric J. Brunner (Conceptualization; Supervision; Writing – review & editing); Eric French (Conceptualization; Formal analysis; Supervision; Writing – review & editing); Jing Liao (Conceptualization; Funding acquisition; Supervision; Writing – review & editing).
ACKNOWLEDGMENTS
This work was supported by National Science Foundation of China / the Economic and Social Research Council, UK Research and Innovation joint call: Understanding and Addressing Health and Social Challenges for Ageing in the UK and China. We would like to acknowledge the China Health and Retirement Longitudinal Study (CHARLS) team and the Chinese Longitudinal Healthy Longevity Survey (CLHLS) team for providing high-quality, nationally representative data. The funders of the study had no role in study design, data collection, data analysis, data interpretation, or writing of the report.
FUNDING
UK-China Health And Social Challenges Ageing Project (UKCHASCAP): present and future burden of dementia, and policy responses. (grant number 72061137003, ES/T014377/1).
CONFLICT OF INTEREST
The authors have no conflict of interest to report.
DATA AVAILABILITY
Two main datasets are available upon request. CLHLS data was stored at http://opendata.pku.edu.cn, and CHARLS data was stored at https://charls.pku.edu.cn/en/.
SUPPLEMENTARY MATERIAL
[1] The supplementary material is available in the electronic version of this article: https://dx.doi.org/10.3233/JAD-240583.
REFERENCES
1. | Hanaoka S , Matsumoto K , Kitazawa T , et al. Comprehensive cost of illness of dementia in Japan: a time trend analysis based on Japanese official statistics. Int J Qual Health Care (2019) ; 31: : 231–237. |
2. | Gustavsson A , Brinck P , Bergvall N , et al. Predictors of costs of care in Alzheimer’s disease: a multinational sample of patients. Alzheimers Dement (2011) ; 7: : 318–327. |
3. | Hurd MD , Martorell P , Delavande A , et al. Monetary costs of dementia in the United States. N Engl J Med (2013) ; 368: : 1326–1334. |
4. | Luengo-Fernandez R , Leal J and Gray AM . Cost of dementia in the pre-enlargement countries of the European Union. J Alzheimers Dis (2011) ; 27: : 187–196. |
5. | Li F , Qin W , Zhu M , et al. Model-based projection of dementia prevalence in China and worldwide: 2020-2050. J Alzheimers Dis (2021) ; 82: : 1823–1831. |
6. | Huang Y , Li X , Liu Z , et al. Projections of the economic burden of care for individuals with dementia in mainland China from 2010 to 2050. PLoS One (2022) ; 17: : e0263077. |
7. | Jia J , Wei C , Chen S , et al. The cost of Alzheimer’s disease in China and re-estimation of costs worldwide. Alzheimers Dement (2018) ; 14: : 483–491. |
8. | Jia J , Zuo X , Jia XF , et al. Diagnosis and treatment of dementia in neurology outpatient departments of general hospitals in China. Alzheimers Dement (2016) ; 12: : 446–453. |
9. | Connolly S . Economics of dementia: A review of methods. Dementia (London) (2020) ; 19: : 1426–1440. |
10. | Masters CL , Bateman R , Blennow K , et al. Alzheimer’s disease. Nat Rev Dis Primers (2015) ; 1: : 15056. |
11. | Xu J , Wang J , Wimo A , et al. The economic burden of dementia in China, -implications for health policy. Bull World Health Organ (2017) ; 95: : 18–26. |
12. | Zhai T , Goss J and Li J . Main drivers of health expenditure growth in China: a decomposition analysis. BMC Health Serv Res (2017) ; 17. |
13. | Liu Y , Wu Y , Chen Y , et al. Projection for dementia burden in China to a macro-simulation study by scenarios of dementia incidence trends. Lancet Reg Health West Pac (2024) ; 50: : 101158. |
14. | Zhao Y , Hu Y , Smith JP , et al. Cohort profile: the China Health and Retirement Longitudinal Study (CHARLS). Int J Epidemiol (2014) ; 43: : 61–68. |
15. | Yi Z . Introduction to the Chinese Longitudinal Healthy Longevity Survey (CLHLS). In: Yi Z, Poston DL, Vlosky DA, et al. (eds) Healthy Longevity in China: Demographic, Socioeconomic, and Psychological Dimensions. Dordrecht: Springer Netherlands (2008) , pp. 23–38. |
16. | Gu D . General data quality assessment of the CLHLS. In: Yi Z, Poston DL, Vlosky DA, et al. (eds) Healthy Longevity in China: Demographic, Socioeconomic, and Psychological Dimensions. Dordrecht: Springer Netherlands, (2008) , pp. 39–60. |
17. | Chen X , Wang Y , Strauss J , et al. China Health and Retirement Longitudinal Study (CHARLS). In: Gu D and Dupre ME (eds) Encyclopedia of Gerontology and Population Aging. Cham: Springer International Publishing, (2021) , pp. 948–956. |
18. | Liu Y , Wu Y , Cai J , et al. Is there a common latent cognitive construct for dementia estimation across two Chinese cohorts? Alzheimers Dement (Amst) (2022) ; 14: : e12356. |
19. | Katz S , Ford AB , Moskowitz RW , et al. Studies of illness in the aged. the index of ADL, a standardized measure of biological and psychosocial function. JAMA (1963) ; 185: : 914–919. |
20. | National Bureau of Statistics. The average annual salary of employees in enterprises above designated size in 2021, http://www.stats.gov.cn/sj/zxfb/202302/t20230203_1901474.html (2022, accessed 26 July 2024). |
21. | Joshi P , Walters AN , Noelke C , et al. Families’ job characteristics and economic self-sufficiency: differences by Income, race-ethnicity, and nativity. RSF (2022) ; 8: : 67–95. |
22. | Devlin NJ and Brooks R . EQ-5D and the EuroQol Group: past, present and future. Appl Health Econ Health Policy (2017) ; 15: : 127–137. |
23. | Liu GG , Wu H , Li M , et al. Chinese time trade-off values for EQ-5D health states. Value Health (2014) ; 17: : 597–604. |
24. | Yao Q , Liu C , Zhang Y , et al. Population norms for the EQ-5D-3L in China derived from the National Health Services Survey. J Glob Health (2021) ; 11: : 08001. |
25. | Ye Z , Abduhilil R , Huang J , et al. Willingness to pay for one additional quality adjusted life year: a population based survey from China. Appl Health Econ Health Policy (2022) ; 20: : 893–904. |
26. | Collins B , Bandosz P , Guzman-Castillo M , et al. What will the cardiovascular disease slowdown cost? Modelling the impact of CVD trends on dementia, disability, and economic costs in England and Wales from 2020-2029. PLoS One (2022) ; 17: : e0268766. |
27. | Ding D , Zhao Q , Wu W , et al. Prevalence and incidence of dementia in an older Chinese population over two decades: The role of education. Alzheimers Dement (2020) ; 16: : 1650–1662. |
28. | Gupta PD . Decomposition of the difference between two rates and its consistency when more than two populations are involved. Math Popul Stud (1991) ; 3: : 105–125. |
29. | Zhai T , Goss J , Dmytraczenko T , et al. China’s Health Expenditure Projections To Future trajectory and the estimated impact of reforms. Health Aff (Millwood) (2019) ; 38: : 835–843. |
30. | Song X , Lan L , Zhou T , et al. Economic burden of major diseases in China in 2013. Front Public Health (2021) ; 9: : 649624. |
31. | Bloom DE , Chen S , Kuhn M , et al. The economic burden of chronic diseases: Estimates and projections for China, Japan, and South Korea. J Econ Ageing (2020) ; 17: : 100163. |
32. | Institute of Medicine (US) Committee on Technological Innovation in Medicine, Gelijns AC , Halm EA. The Changing Economics of Medical Technology. Washington, DC: National Academies Press (US), 1991. |
33. | Wittenberg R , Hu B , Jagger C , et al. Projections of care for older people with dementia in England: 2015 to 2040. Age Ageing (2019) ; 49: : 264–269. |
34. | Tu J , Li H , Ye B , et al. The trajectory of family caregiving for older adults with dementia: difficulties and challenges. Age Ageing (2022) ; 51: : afac254. |
35. | Wimo A , Jonsson L , Bond J , et al. The worldwide economic impact of dementia 2010. Alzheimers Dement (2013) ; 9: : 1–11.e3. |
36. | Dominguez J , Jiloca L , Fowler KC , et al. Dementia incidence, burden and cost of care: a Filipino community-based study. Front Public Health (2021) ; 9: : 628700. |
37. | Chow N . The practice of filial piety and its impact on long-term care policies for elderly people in Asian Chinese communities. Asian J Gerontol Geriatr (2006) ; 1: : 31–35. |
38. | Lu J , Zhang L and Zhang K . Care preferences among Chinese older adults with daily care needs: individual and community factors. Res Aging (2021) ; 43: : 166–176. |
39. | Wang Y and Yang W . Does receiving informal care lead to better health outcomes? evidence from China Longitudinal Healthy Longevity Survey. Res Aging (2022) ; 44: : 510–518. |
40. | Zhai T , Wan Q , Chai P , et al. A decomposition analysis of recent health expenditure growth in China: is population ageing a significant effecting factor? China Popul Dev Stud (2020) ; 4: : 45–57. |
41. | Livingston G , Sommerlad A , Orgeta V , et al. Dementia prevention, intervention, and care. Lancet (2017) ; 390: : 2673–2734. |
42. | Kok L , Berden C and Sadiraj K . Costs and benefits of home care for the elderly versus residential care: a comparison using propensity scores. Eur J Health Econ (2014) ; 16: : 119–131. |
43. | Keetharuth AD , Hussain H , Rowen D , et al. Assessing the psychometric performance of EQ-5D-5L in dementia: a systematic review. Health Qual Life Outcomes (2022) ; 20: : 139. |
44. | Pan C-W , Wang X , Ma Q , et al. Cognitive dysfunction and health-related quality of life among older Chinese. Sci Rep (2015) ; 5: : 17301. |
45. | Brown MM , Brown GC , Sharma S , et al. Evidence-based medicine, utilities, and quality of life. Curr Opin Ophthalmol (1999) ; 10: : 221–226. |
46. | Clay E , Zhou J , Yi ZM , et al. Economic burden for Alzheimer’s disease in China from to a modelling study. J Mark Access Health Policy (2019) ; 7: : 1667195. |


