
Identifying Comorbidity Patterns in People with and without Alzheimer’s Disease Using Latent Dirichlet Allocation
Abstract
Background:
Multimorbidity is common in older adults and complicates diagnosing and care for this population.
Objective:
We investigated co-occurrence patterns (clustering) of medical conditions in persons with Alzheimer’s disease (AD) and their matched controls.
Methods:
The register-based Medication use and Alzheimer’s disease study (MEDALZ) includes 70,718 community-dwelling persons with incident AD diagnosed during 2005-2011 in Finland and a matched comparison cohort. Latent Dirichlet Allocation was used to cluster the comorbidities (ICD-10 diagnosis codes). Modeling was performed separately for AD and control cohorts. We experimented with different numbers of clusters (also known as topics in the field of Natural Language Processing) ranging from five to 20.
Results:
In both cohorts, 17 of the 20 most frequent diagnoses were the same. Based on a qualitative assessment by medical experts, the cluster patterns were not affected by the number of clusters, but the best interpretability was observed in the 10-cluster model. Quantitative assessment of the optimal number of clusters by log-likelihood estimate did not imply a specific optimal number of clusters. Multidimensional scaling visualized the variability in cluster size and (dis)similarity between the clusters with more overlapping of clusters and variation in group size seen in the AD cohort.
Conclusions:
Early signs and symptoms of AD were more commonly clustered together in the AD cohort than in the comparison cohort. This study experimented with using natural language processing techniques for clustering patterns from an epidemiological study. From the computed clusters, it was possible to qualitatively identify multimorbidity that differentiates AD cases and controls.
INTRODUCTION
Multimorbidity (co-existence of two or more chronic diseases) affects more than half of older adults aged 65 years or older and has increasing prevalence with increasing age.1 The prevalence of Alzheimer’s disease (AD), the most common cause of dementia, increases with age and has a large impact on the aging population.2 Risk factors for cognitive decline include chronic medical conditions, such as cardiovascular conditions and depression, which are common contributors to multimorbidity.3
AD has a preclinical phase and this neurodegenerative process may precede noticeable cognitive decline by 15 years.4 As there is currently no cure for AD, mediating the risk by targeting modifiable risk factors in persons at risk may be feasible, particularly because multidomain interventions have been shown to maintain cognitive function.5 Thus, identification of these persons and distinctive patterns of comorbidities, including signs and symptoms of AD, may enable a timelier cognitive assessment and AD diagnosis.
Identifying co-occurrence patterns of medical conditions can help in building statistical models for estimating hospitalizations, disease progression, or death.6 Natural language processing (NLP) can analyze data which are in the form of natural language, such as speech and written reports in documents.7 Latent Dirichlet allocation (LDA) is a method based on the idea that documents can be modeled as a mixture of latent topics, where each topic is a distribution over words.8 This method has been previously used on different types of health data, including electronic medical records.6 The majority of previous applications have centered around a mixture of natural language data,9–12 with a few studies having applied LDA solely to medical codes.13–15
Finding patterns before AD diagnosis has important implications for an early diagnosis. Our aim was to identify clusters of patterns of comorbidities prior to AD diagnosis and compare them to a matched cohort of people without AD. We investigated how a collection of ICD-10 diagnosis blocks group together and how the groups are associated with each other using a technique from NLP called LDA, with each cohort (or corpus) modeled separately.
METHODS
Study cohort
The nationwide Finnish Medication use and Alzheimer’s disease (MEDALZ) study is a nested case-control study with the Finnish population. It includes 70,718 persons who received a clinically verified diagnosis of AD from 2005-2011 and were community-dwelling at the time of diagnosis. For each of them, a matched comparison person was identified (detailed description available in the Supplementary Material).
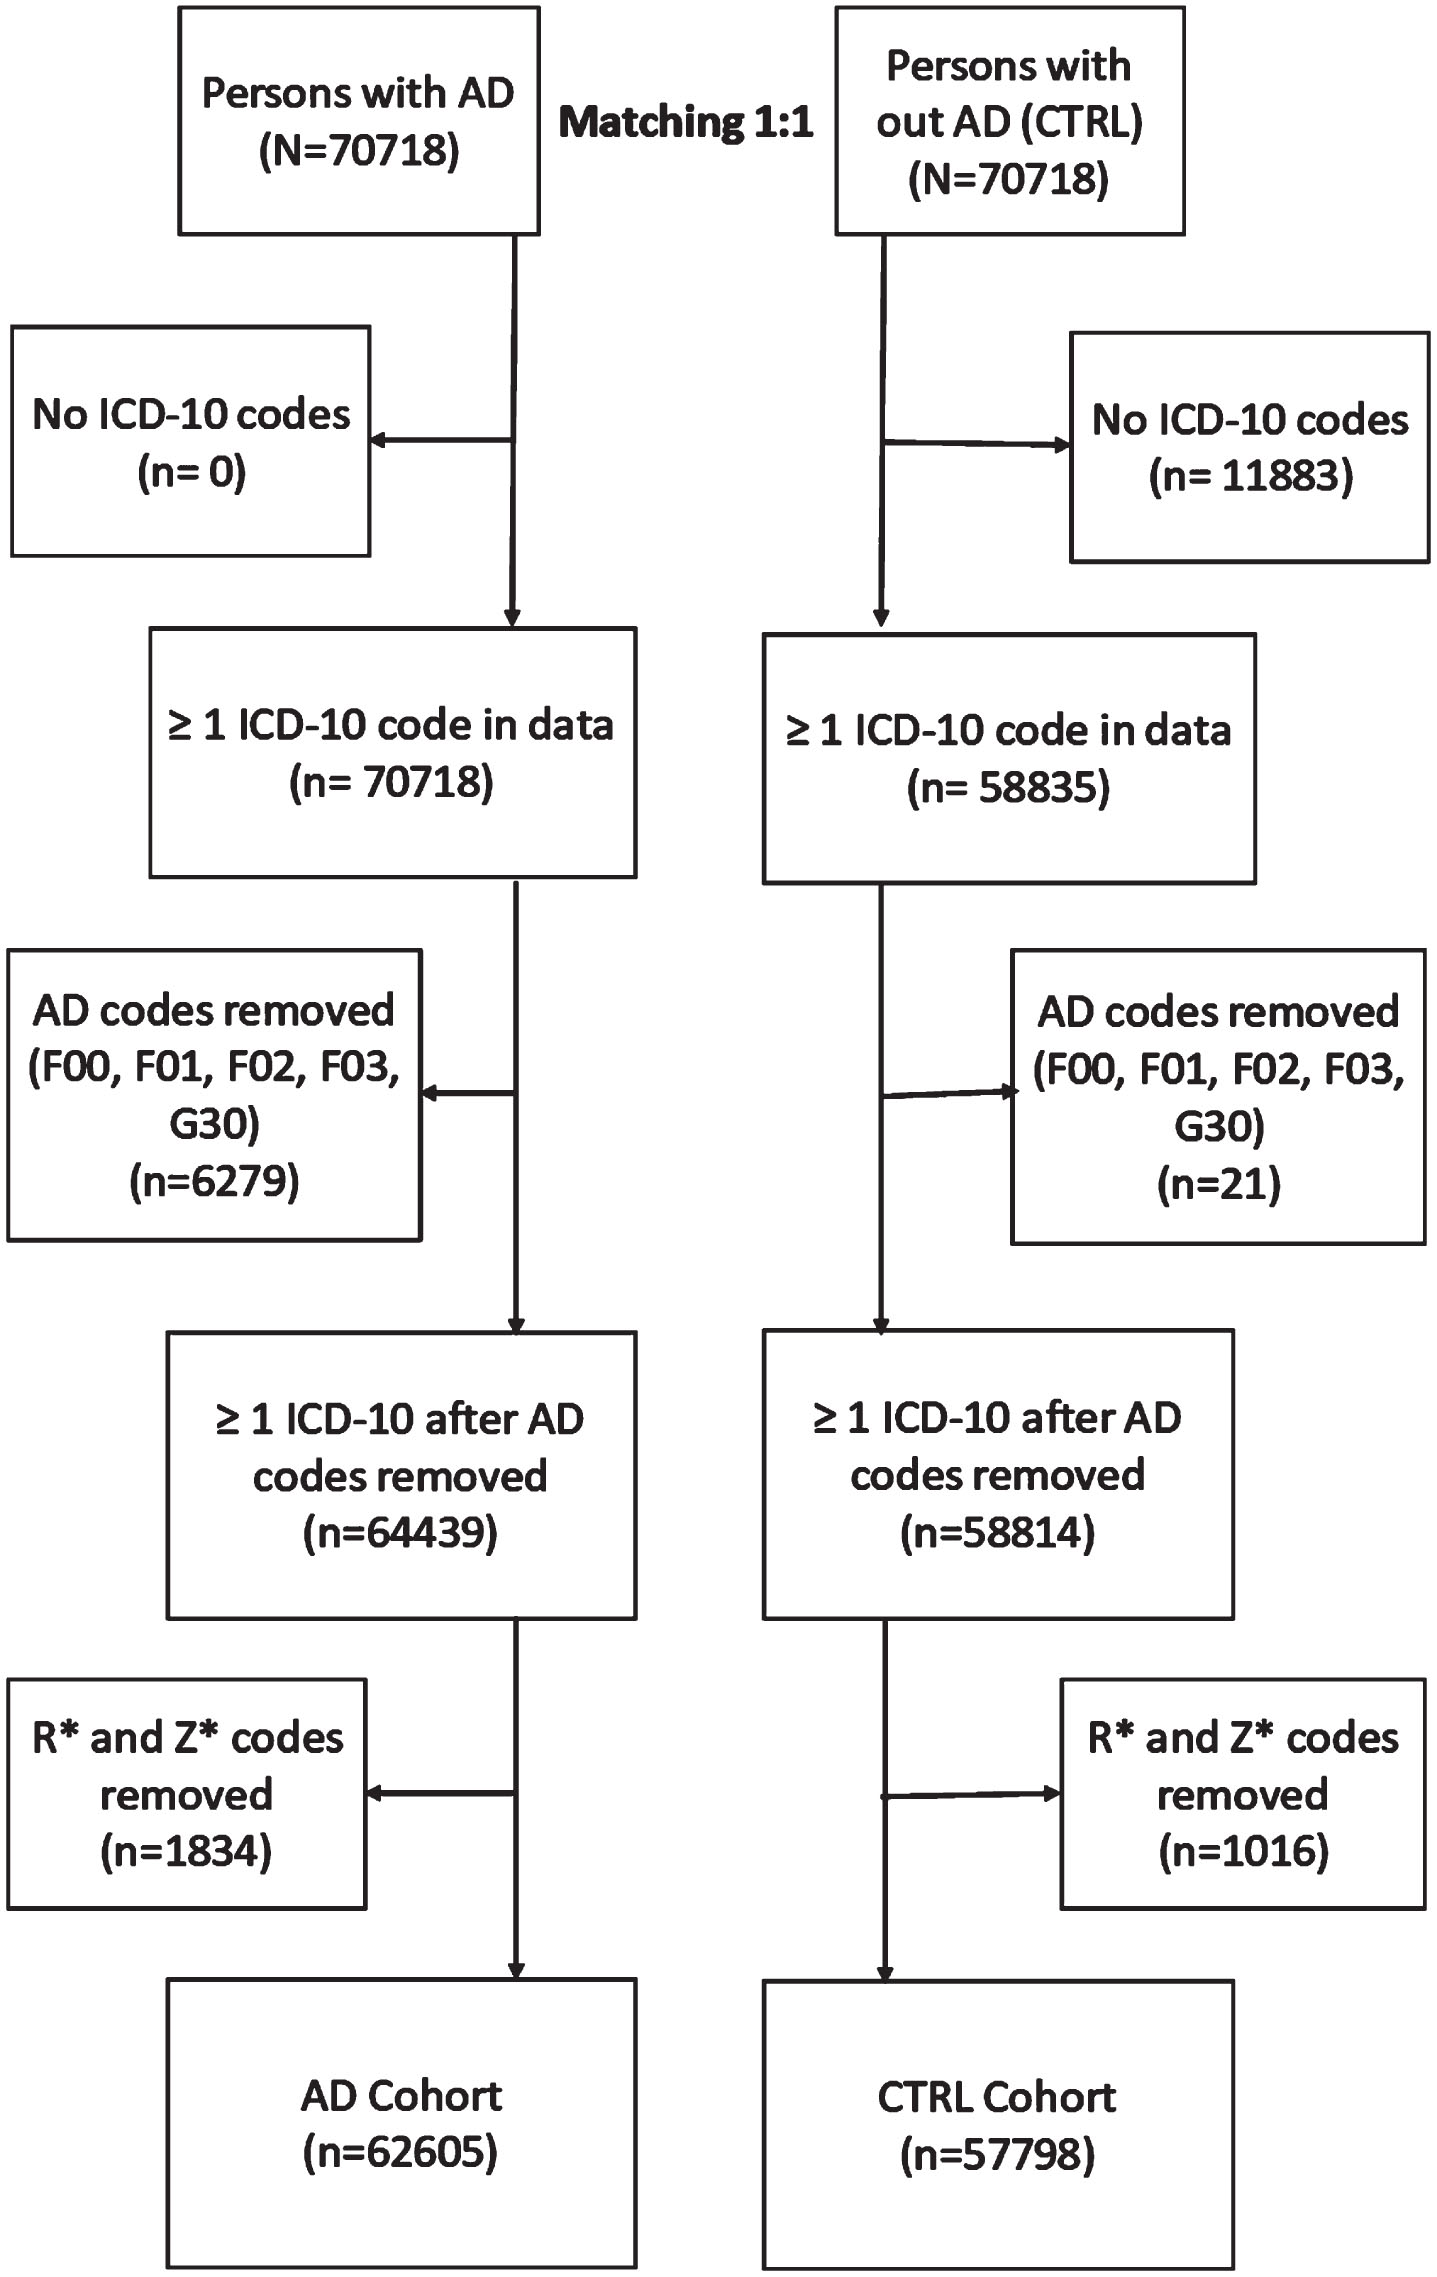
Data from the national registers was linked using the unique personal identification numbers and de-identified by the register maintainers before being released to the research team.16 The World Health Organization’s 10th version of the International Classification of Diseases (ICD-10) codes on the three-character level were compiled from the Care Register for Healthcare, including both inpatient stays and outpatient visits in specialized healthcare, and the Finnish Special Reimbursement Register (FSRR) that includes specific conditions diagnosed in specialized and primary healthcare settings. For modeling, we used the ICD-10 blocks (Supplementary Table 1), which is a designated range of ICD-10 codes on a three-character level.17 Data was limited to five years before the AD diagnosis (or matching date) because, based on our previous study, the variation in main diagnosis categories is largest during this time point18 and, therefore, a feasible time window for evaluating whether we can identify different patterns of comorbidity clustering with LDA. The exclusion criteria for this study are explained in more detail in the Supplementary Material and visualized in Fig. 1. The final study population consisted of 62,605 people in the AD cohort and 57,798 people in the non-AD (CTRL) cohort who had a diagnosis of at least one ICD-block.
Fig. 1
Formation of study population. AD, Alzheimer’s disease; CTRL, Control; ICD, International Classification of Diseases.
Probabilistic modelling
LDA is a probabilistic graphical model, that uses Bayesian statistics to model how words from a document can be divided into a group of a predefined number of topics.8 Each word is assigned a prior probability of belonging to a particular topic, and likewise, each topic is assigned a prior probability of belonging to a particular word. These priors are drawn from a Dirichlet distribution, which provides a distribution for a particular word belonging to a topic and vice versa. The word-topic assignments are done by sampling a multinomial distribution and solving a variational Bayes optimization problem. The result of this optimization problem is the allocation of words to topics where they most frequently appear, along with their associated words.
Conceptually, LDA is like hierarchical clustering, where subgroups within clusters are to be discovered. In our case, we use the ICD-10 blocks as “words”, and then search how these ICD-10 blocks group together within the topics. In statistical terms, topics are equivalent to clusters. Since this study aims at finding clusters of ICD-10 codes, we will use the word clusters when reporting the results.
LDA was applied using Hoffman et al.19,20 with implementation using Scikit-Learn21 library for Python programming language. Further details of the parameters are given in the Supplementary Material. The choice of the number of clusters is subjectively decided by the researcher and may have a significant impact on results. We ran models with five to 20 clusters separately for the AD and control cohorts (corpuses) and evaluated the results qualitatively based on background knowledge of AD and comorbidities. The fit of a cluster was evaluated by using log-likelihood estimation. In addition, qualitative criteria (interpretability) were applied in choosing the number of clusters. The labeling and interpretation of the clusters were based on the consensus of two medical experts (BR, SH) and an experienced epidemiologist (AMT).
Visualization
The LDA model itself cannot indicate how groups are related to each other. However, the similarities of clusters can be evaluated by first computing their “distance” to each other and then visualizing these computed distances. The distance between clusters gives the relative similarity measures and of their contents. We use multidimensional scaling (MDS) for evaluating cluster similarities.22 In MDS, the distance between clusters provides a measure of (dis)similarity, which is computed according to the frequencies of ICD-10 blocks within each cluster.
RESULTS
Table 1 shows the 30 most frequent codes in each cohort, in decreasing order of occurrence frequency. Of the 20 most frequent diagnoses, 17 were the same in both cohorts. Other forms of heart disease (I30-I52), which include atrial fibrillation, carditis, valve disorders, and heart failure, followed by Ischemic heart disease (I20-I25), and Disorders of the lens (H25-H28) were the most frequent diagnoses for both cohorts. The frequencies of diagnoses of males and females of each cohort are presented in Supplementary Tables 3 and 4 with sex-specific diagnoses (e.g., N80-N98 Noninflammatory disorders of female genital tract) represented in the 30 most frequent blocks. Similar proportions of the most frequent blocks were found in both the males and females in both cohorts.
Table 1
30 Most Frequent ICD-10 Blocks
| AD cohort | CTRL cohort | |||||
| ICD-10 Block | N | % of cohort | ICD-10 Block | n | % of cohort | |
| with | with | |||||
| diagnosis | diagnosis | |||||
| block | block | |||||
| 1 | I30-I52 | 24425 | 7.7 | I30-I52 | 20819 | 7.8 |
| 2 | I20-I25 | 20115 | 6.4 | I20-I25 | 18148 | 6.8 |
| 3 | H25-H28 | 17442 | 5.5 | H25-H28 | 16733 | 6.2 |
| 4 | I10-I15 | 16058 | 5.1 | M00-M25 | 15269 | 5.7 |
| 5 | M00-M25 | 14699 | 4.7 | I10-I15 | 14030 | 5.2 |
| 6 | H90-H95 | 9277 | 2.9 | H90-H95 | 8479 | 3.2 |
| 7 | N30-N39 | 8844 | 2.8 | M40-M54 | 6647 | 2.5 |
| 8 | E10-E14 | 8588 | 2.7 | E10-E14 | 6504 | 2.4 |
| 9 | I60-I69 | 8003 | 2.5 | K55-K63 | 5932 | 2.2 |
| 10 | M40-M54 | 7262 | 2.3 | I60-I69 | 5804 | 2.2 |
| 11 | K55-K63 | 7018 | 2.2 | N30-N39 | 5528 | 2.1 |
| 12 | G40-G47 | 6326 | 2.0 | J40-J47 | 5181 | 1.9 |
| 13 | J09-J18 | 6005 | 1.9 | J09-J18 | 5009 | 1.9 |
| 14 | J40-J47 | 5232 | 1.7 | G40-G47 | 4558 | 1.7 |
| 15 | K20-K31 | 5044 | 1.6 | H30-H36 | 4354 | 1.6 |
| 16 | N40-N51 | 4521 | 1.4 | D10-D36 | 4349 | 1.6 |
| 17 | E70-E90 | 4518 | 1.4 | H40-H42 | 4195 | 1.6 |
| 18 | S00-S09 | 4515 | 1.4 | K20-K31 | 4119 | 1.5 |
| 19 | D10-D36 | 4424 | 1.4 | M60-M79 | 3983 | 1.5 |
| 20 | H30-H36 | 4336 | 1.4 | N40-N51 | 3862 | 1.4 |
| 21 | S70-S79 | 4159 | 1.3 | I80-I89 | 3537 | 1.3 |
| 22 | A30-A49 | 4074 | 1.3 | E70-E90 | 3322 | 1.2 |
| 23 | H40-H42 | 4042 | 1.3 | N80-N98 | 3226 | 1.2 |
| 24 | I80-I89 | 3978 | 1.3 | A30-A49 | 3084 | 1.2 |
| 25 | M60-M79 | 3970 | 1.3 | A00-A09 | 3004 | 1.1 |
| 26 | A00-A09 | 3909 | 1.2 | K40-K46 | 2998 | 1.1 |
| 27 | F00-F09 | 3703 | 1.2 | K80-K87 | 2924 | 1.1 |
| 28 | F30-F39 | 3445 | 1.1 | I70-I79 | 2909 | 1.1 |
| 29 | N10-N16 | 3370 | 1.1 | S70-S79 | 2626 | 1.0 |
| 30 | K40-K46 | 3273 | 1.0 | C43-C44 | 2625 | 1.0 |
A list of the block labels can be found in the Online Resource. AD, Alzheimer’s disease; CTRL, Control; ICD, International Classification of Disease.
The log-likelihood estimated values for different cluster numbers were similar to each other ([-1429704,-1358103] for AD and [-1200612,-1139343] for the control cohort, Supplementary Figure 2). The 10-cluster model had the best interpretability per consensus opinion based on the proportion of codes belonging to the same organ system in each cluster and distinct clusters and was thus chosen for further inspection. Similar but less defined themes were seen when the number of clusters was greater than seven, but the themes were more heterogeneous when the number of clusters was larger than ten. The 5-cluster and 15-cluster models are presented in Supplementary Figures 3–6. The clusters were labeled based on the ten most frequent blocks that were assigned to each cluster, with each cluster represented by a few key ICD-10 blocks (Figs. 2 and 3). All the clusters in both cohorts (except Clusters 6 and 9 in the CTRL cohort) had a dominant block (representing > 20% of all the counts in the cluster). The clusters were more homogenous in the AD cohort than the CTRL cohort. Hypertensive diseases block (I10-I15) was present in seven of the clusters in the AD cohort and six of the clusters in the CTRL cohort.
Fig. 2
10-Cluster model with ICD-10 Block distribution for AD cohort. AD, Alzheimer’s disease; ICD, International Classification of Diseases.
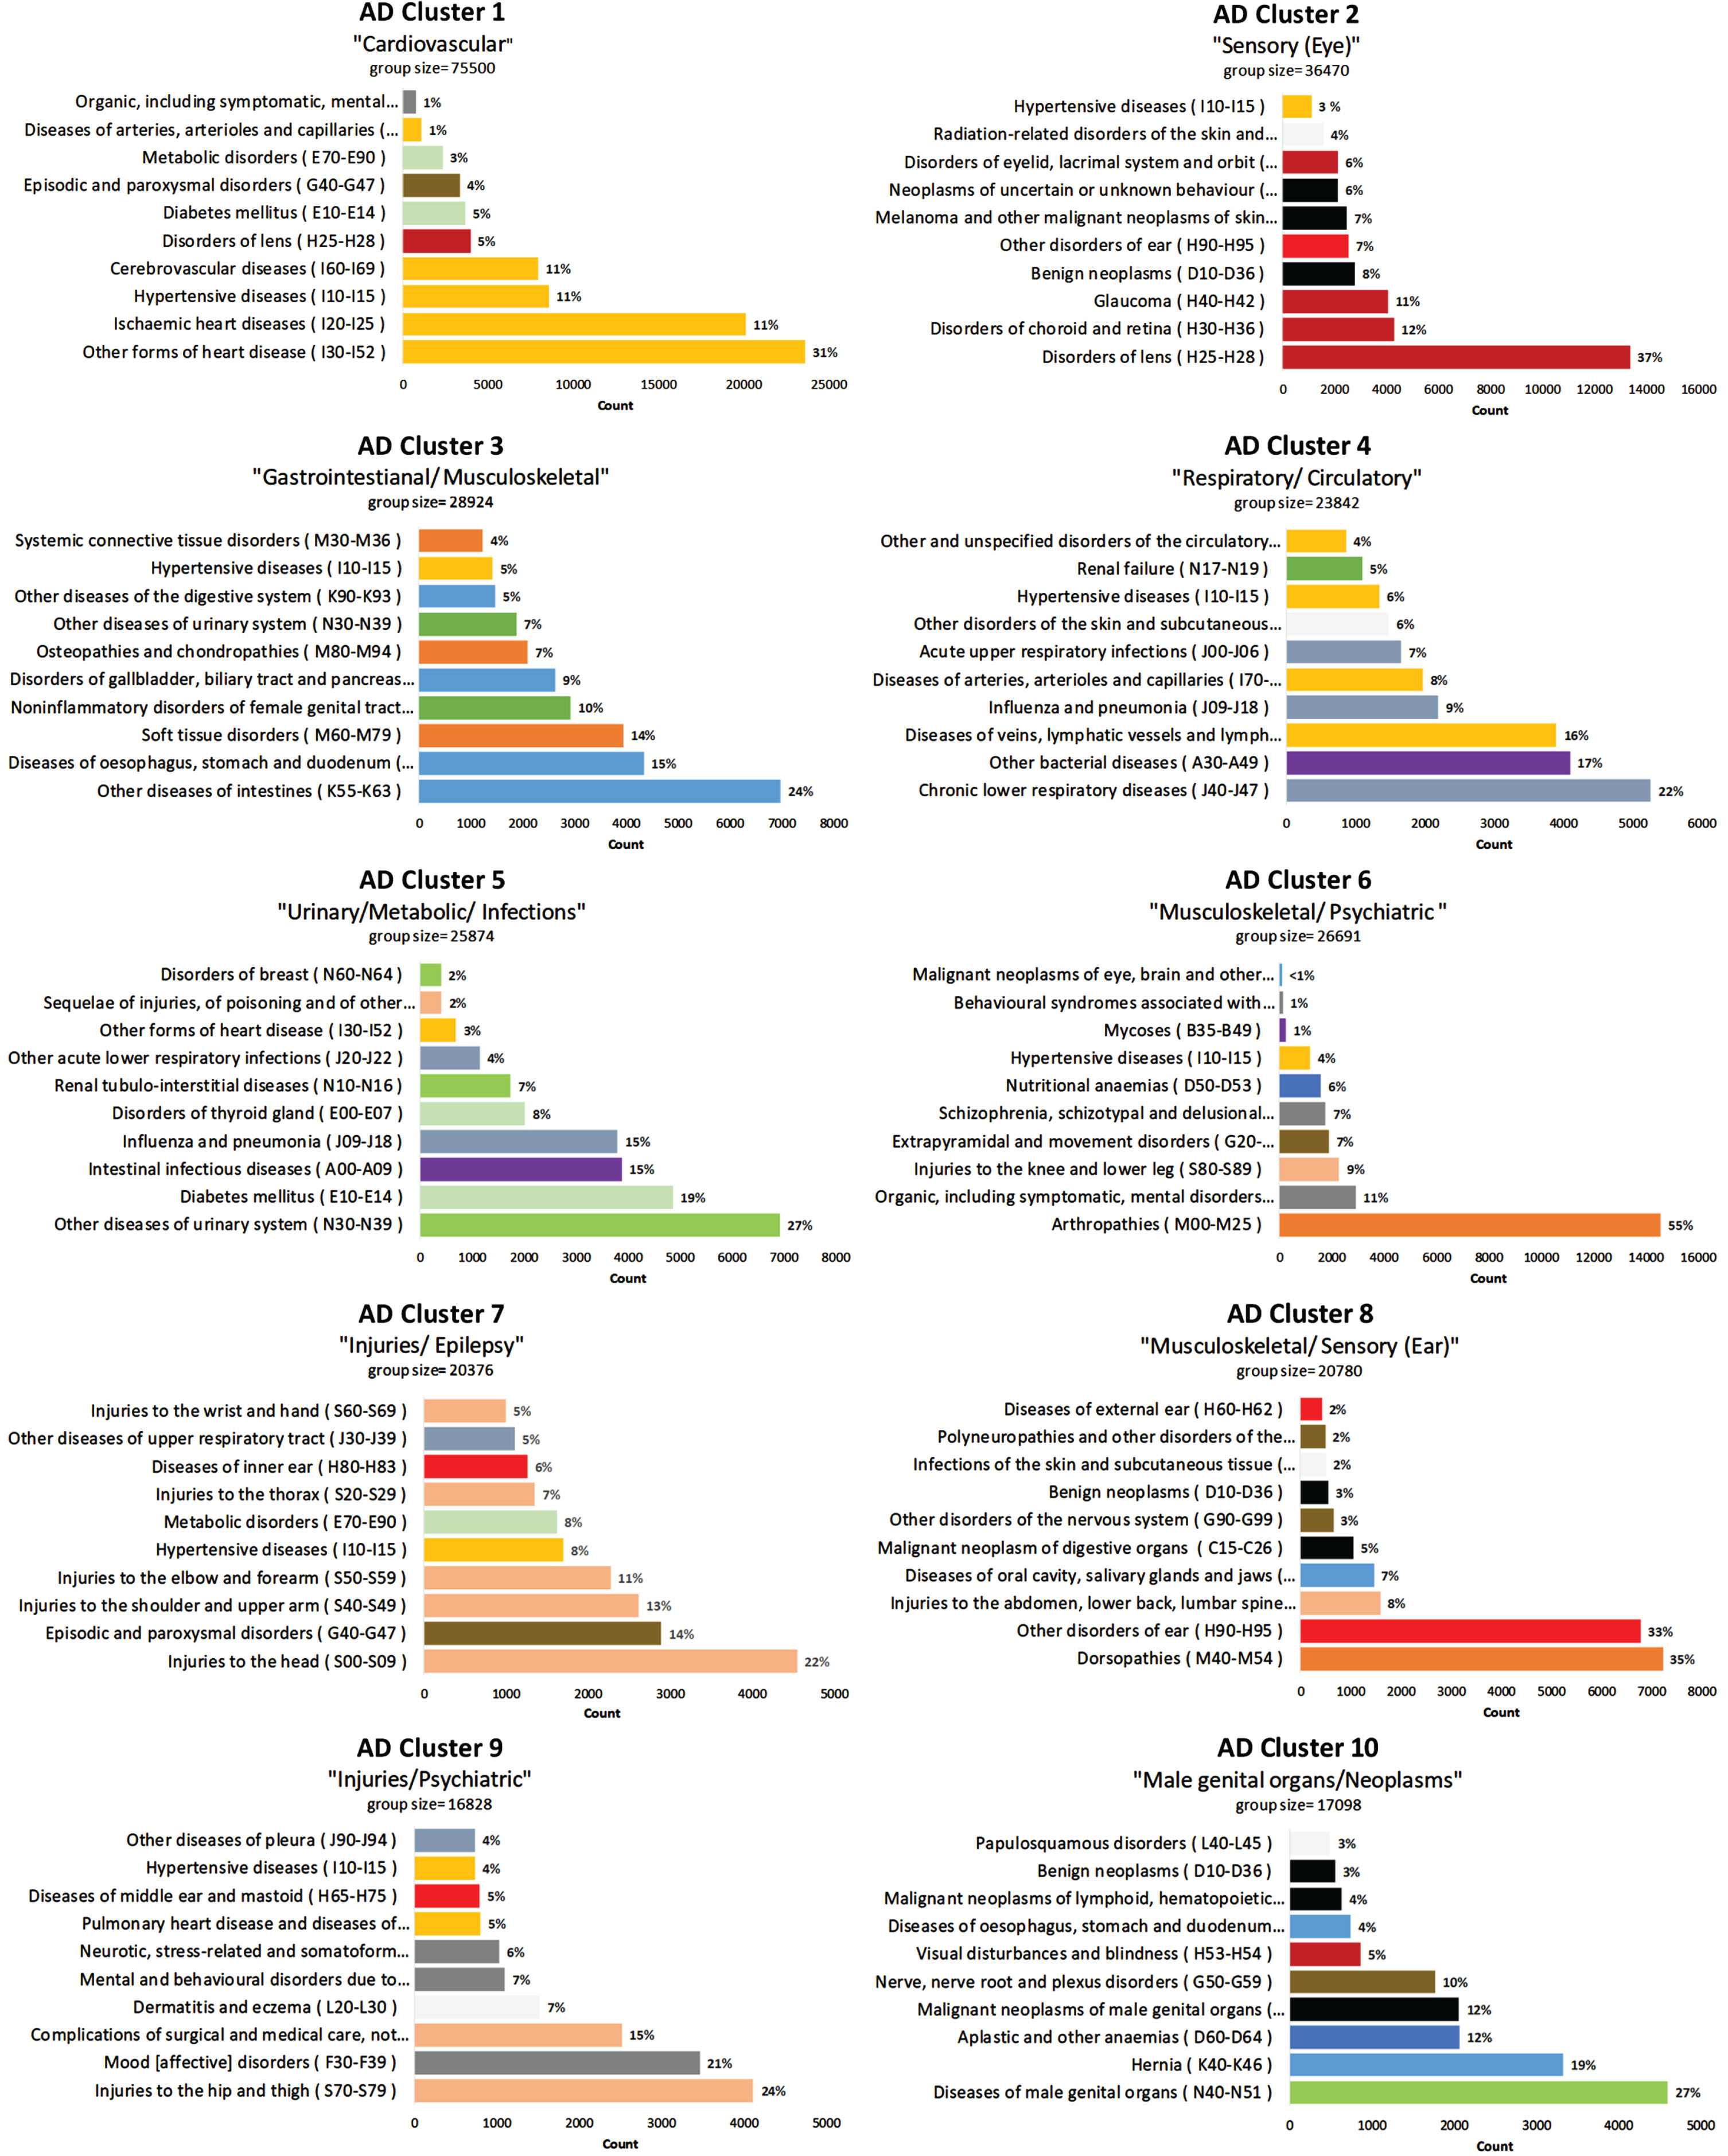
Fig. 3
10-Cluster model with ICD-10 Block distribution for CTRL cohort. CTRL, Control; ICD, International Classification of Diseases.
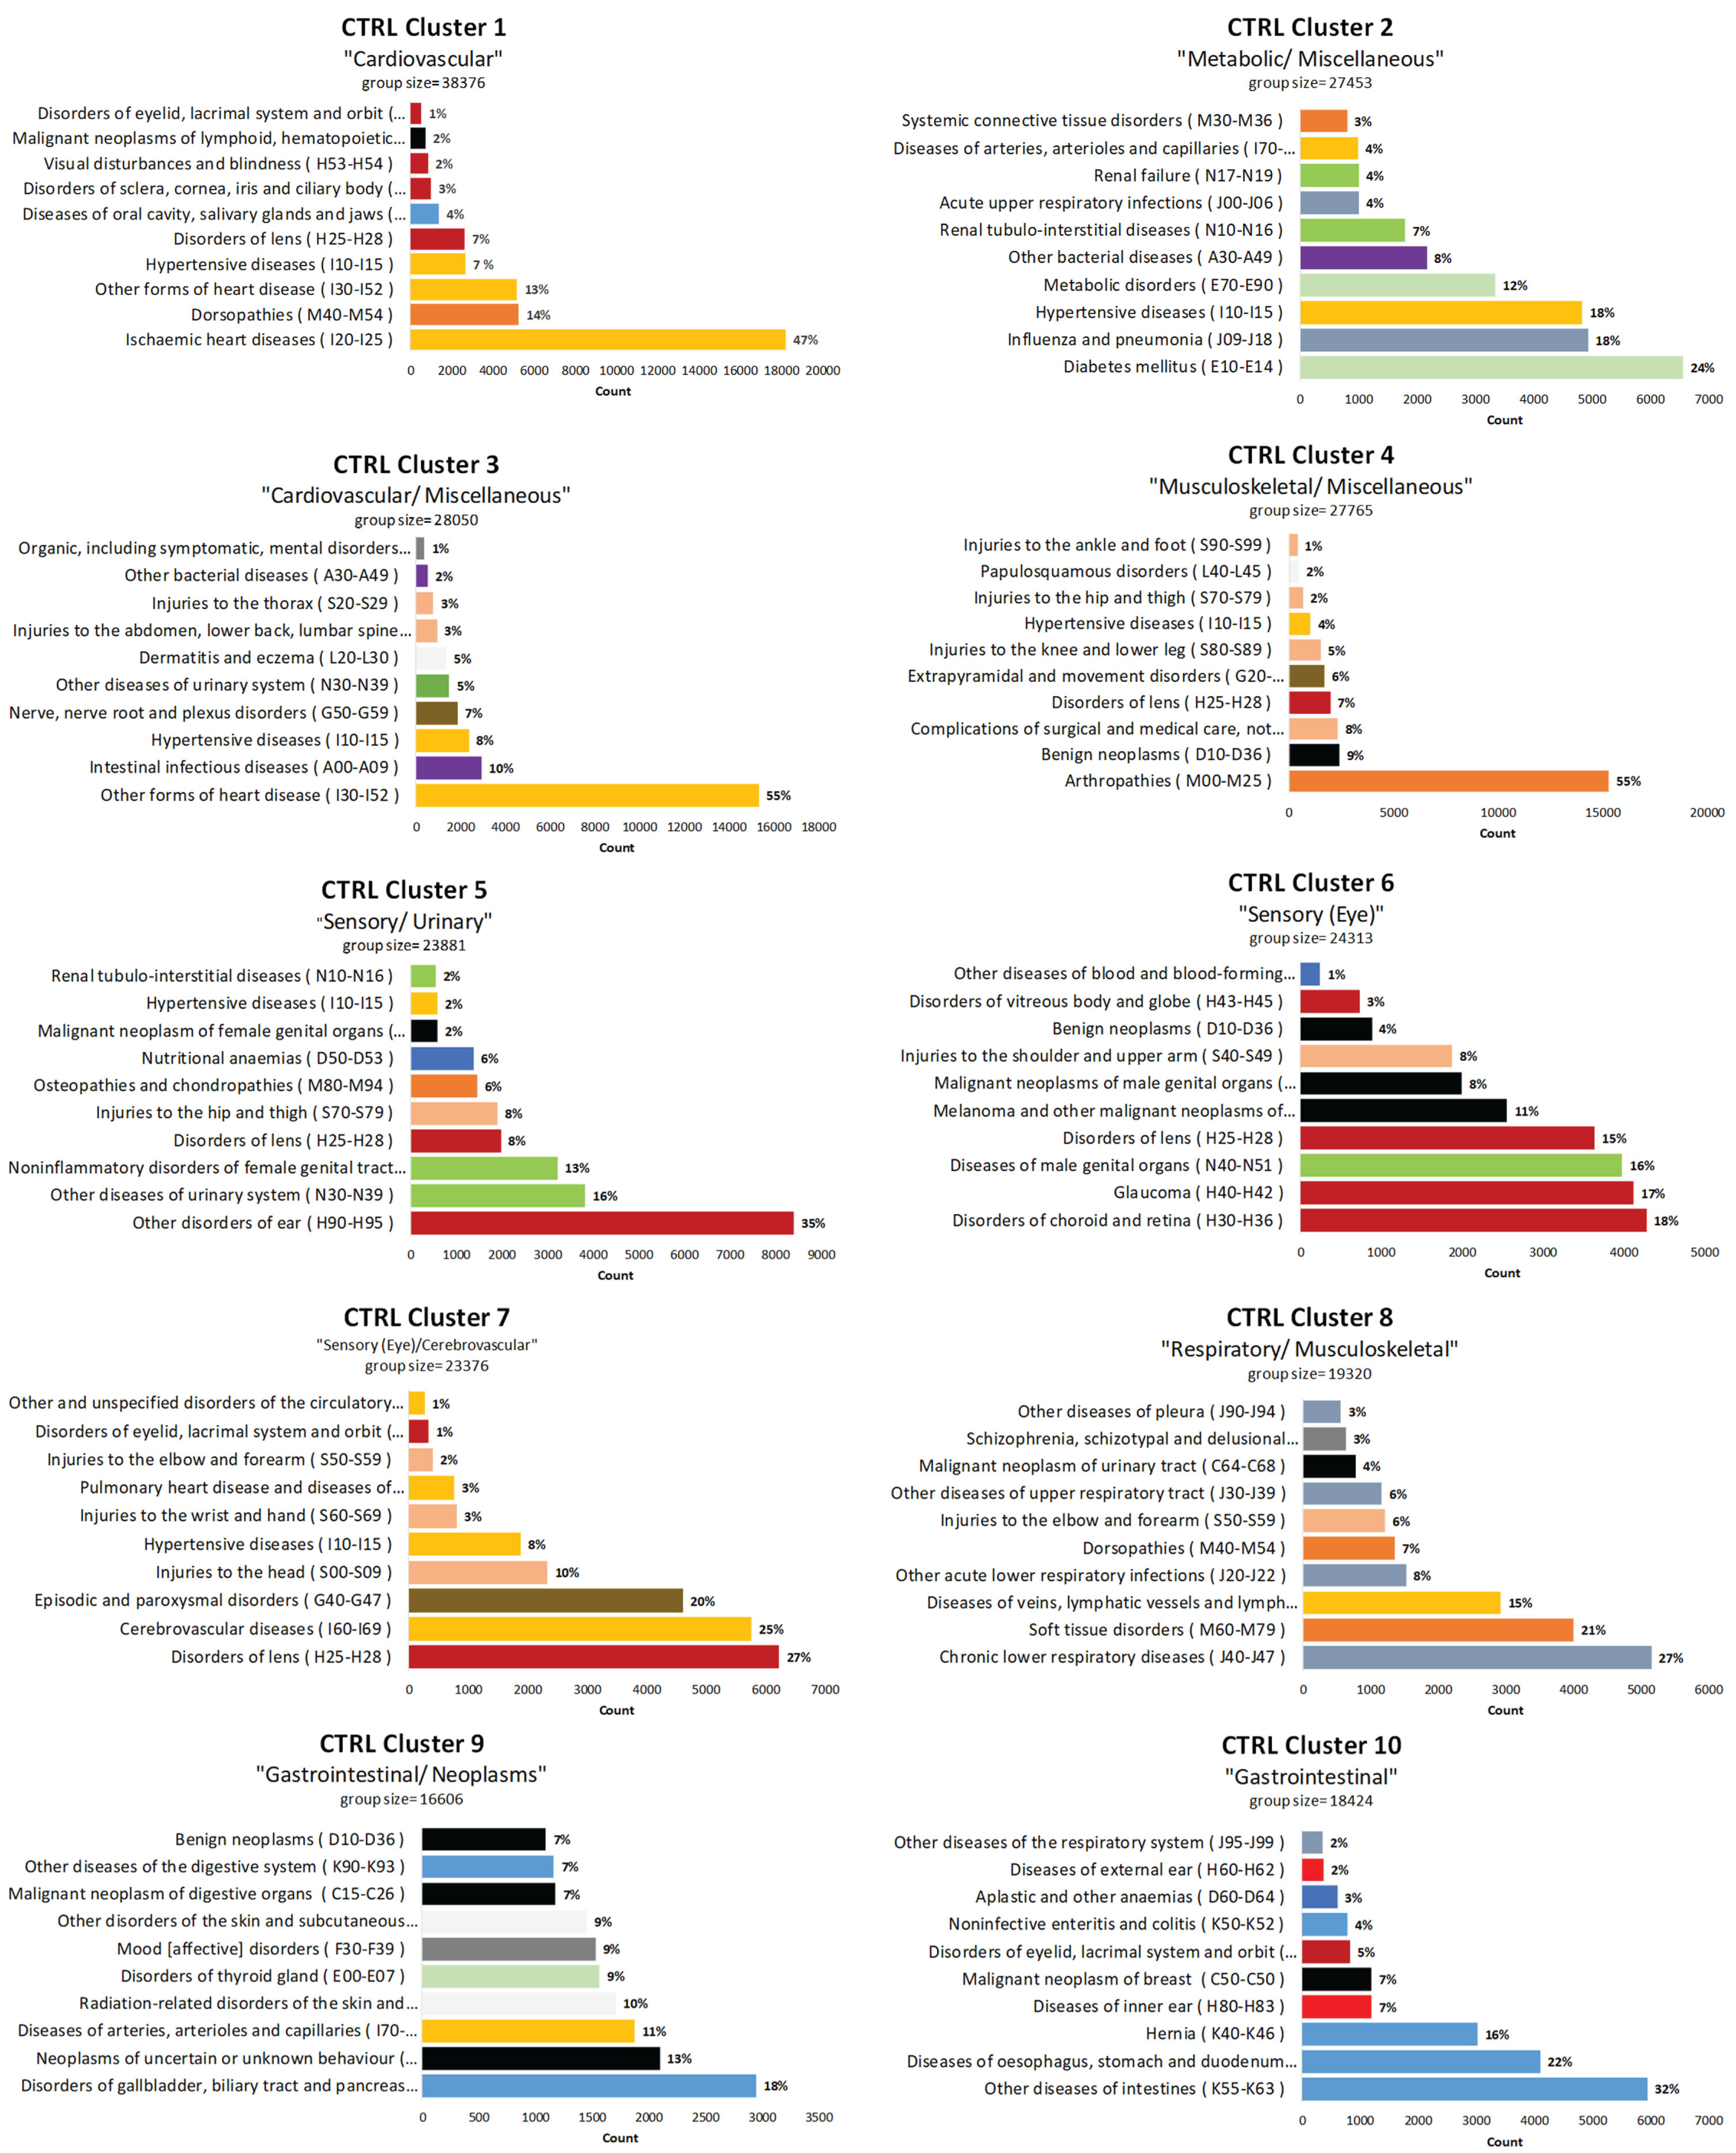
Cluster 1 for both cohorts was dominated by blocks from the Diseases of the circulatory system chapter of the ICD-10 and labeled, “Cardiovascular”. In AD Cluster 2, labeled “Sensory (Eye)”, five of the 10 blocks were related to diseases of the eye or ear (representing > 70% of all the counts in the cluster), and four of the 10 blocks were related to neoplasms or cancer treatment side effects. AD Cluster 3 included several blocks related to diseases of the digestive system and musculoskeletal disorders. AD Cluster 4 was labeled “Respiratory/Circulatory” because the dominant blocks included Chronic lower respiratory diseases (J40-J47), Other bacterial diseases (A30-A49), Diseases of veins, lymphatic vessels and lymph nodes, not elsewhere described (I80-I89), followed by two other “J” (Diseases of the respiratory system) and three other “I” (Diseases of the circulatory system) blocks. AD Cluster 5 had three themes present and was labeled “Urinary/ Metabolic/ Infections”. The dominant block was Other diseases of urinary system (N30-N39); however, metabolic diseases represented about 25% of the block counts and infectious processes representing about 35% of the block counts.
Arthropathies (M00-M25) dominated AD Cluster 6, representing 55% of all the counts in the cluster. However, other blocks in AD Cluster 6 include neurological (Extrapyramidal and movement disorders (G20-G26)) and psychiatric disorders (Organic, including symptomatic mental disorders, (F00-F09), Schizophrenia, schizotypal and delusional disorders (F20-F29), and Behavioral syndromes associated with physiological disturbances and physical factors (F50-F59)). AD Cluster 6 and 9 are the only two clusters with a large proportion of blocks from Mental and behavioral disorders.
Both AD Clusters 7 and 9 included several blocks related to injuries (“S” codes), but the blocks in Cluster 7, labeled “Injuries/ Epilepsy”, were all upper body injuries, while Cluster 9, labeled “Injuries/Psychiatric”, included Injuries of the hip and thigh (S70-S79) and Complications of surgical or medical care (T80-T88). AD Cluster 7 also included Episodic and paroxysmal disorders (G40-G47), which includes epilepsy. AD Cluster 9 also included several “F” codes (Mental and behavioral disorders).
AD Cluster 8, labeled “Musculoskeletal/Sensory (Ear)”, had two dominant blocks, Dorsopathies (M40-M54) and Other disorders of the ear (H90-H95), making up the majority of the cluster. Relating to Dorsopathies, Injuries to the abdomen, lower back, lumbar spine, and pelvis (S30-S39), and Other disorders of the nervous system (G90-G95), which includes code G95 (Other diseases of spinal cord) were are also present in this cluster. AD Cluster 10 is labeled “Male genital organs/Neoplasms” and includes Diseases of male genital organs (N40-N51), Hernia (K40-K46) and Malignant neoplasms of male genital organs (C60-C63). Other blocks related to neoplasm in this cluster were Malignant neoplasms of lymphoid, hematopoietic and related tissue (C81-C97), and Benign neoplasms (D10-D36).
Clusters from the CTRL cohort were more heterogeneous, although a dominant block was present in most clusters (except Clusters 6 and 9), but less evident pattern was noticed with the subsequent blocks in several of the clusters (i.e., “Metabolic/ Miscellaneous”) (Fig. 3). There were no clusters in the CTRL cohort with neurological or psychiatric themes. Figure 4 visualizes the similarity between clusters according to their relative (pairwise) distances in each cohort.
Fig. 4
Inter-topic distance map for the 10-cluster AD and comparison cohorts via multidimensional scaling. A two-dimensional visualization of all the clusters where the size of the bubble represents the percentage of the blocks (words) in the corpus that the cluster contains. The distance between the clusters shows how similar the clusters are to each other. (The axes are not interpretable and come from the multidimensional scaling algorithm). AD, Alzheimer’s disease; CTRL, Control; Misc., Miscellaneous.
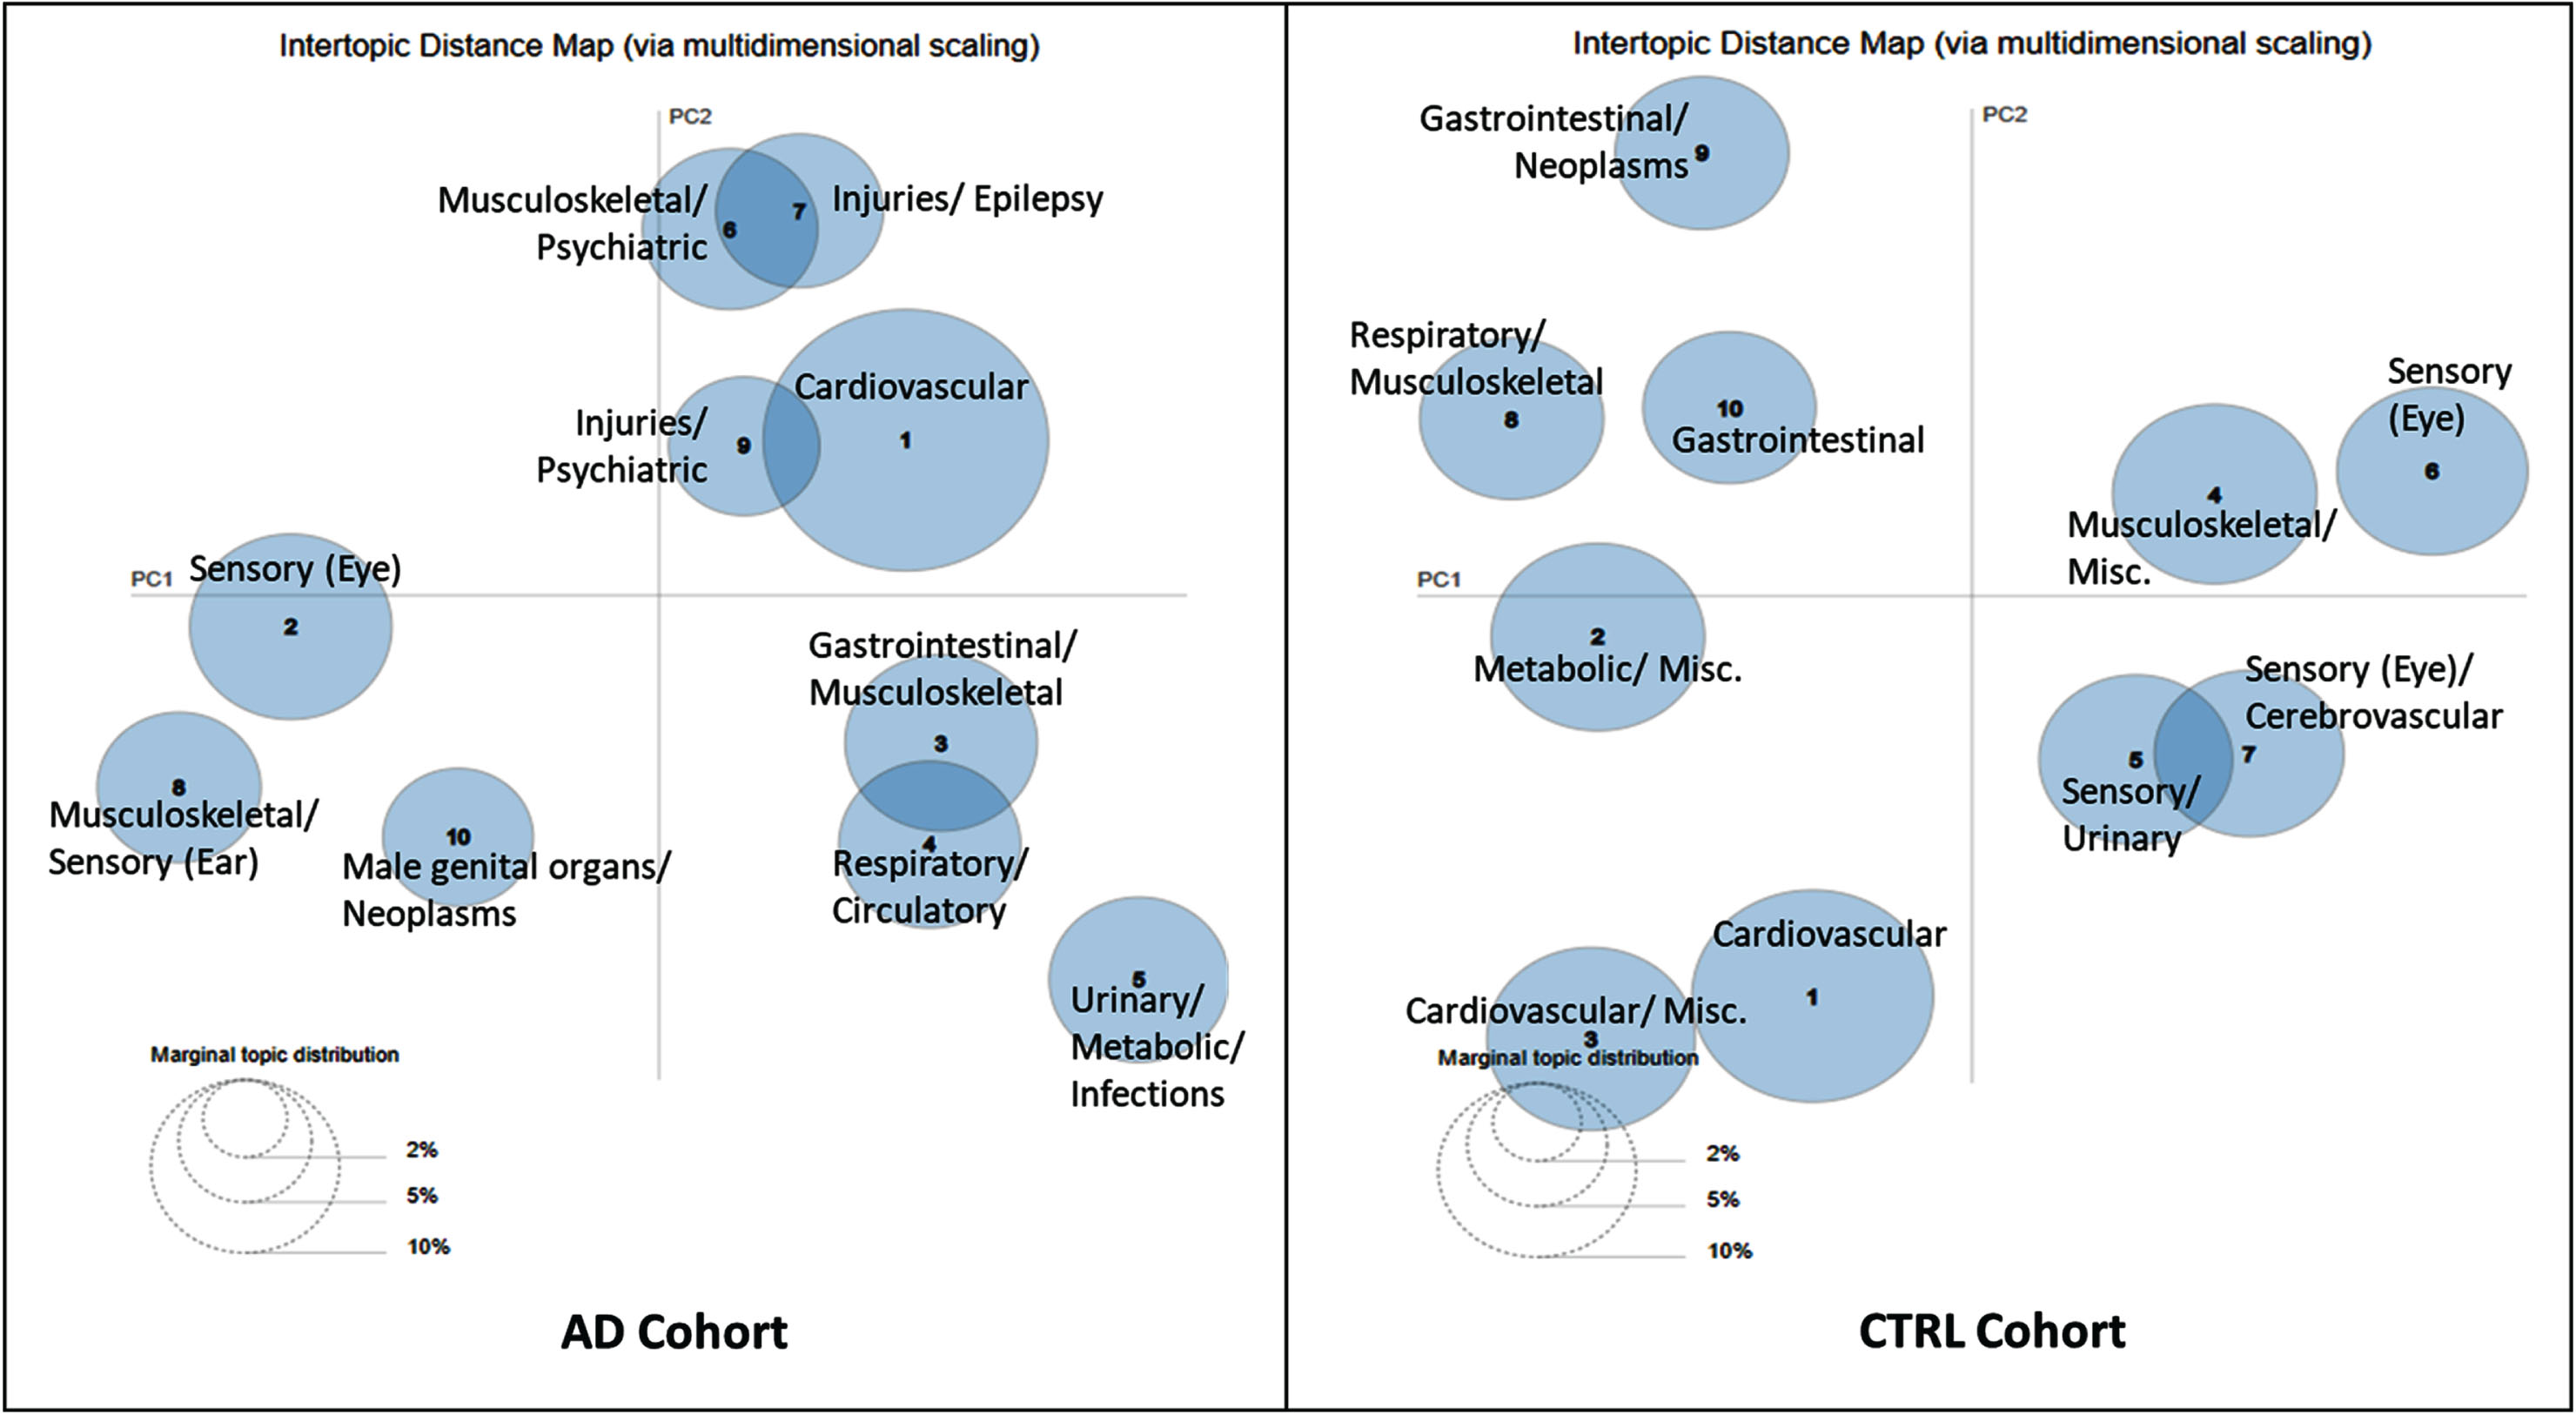
When the cohorts were split by sex similar patterns were observed in the 10-cluster models between the males and females, and also to the AD and CTRL cohorts, with sex-specific diagnoses represented in various blocks (Supplementary Figures 7 and 9). The MDS visualization of the 10-cluster model are presented in Supplementary Figures 8 and 10. Models with greater than 10 clusters had several clusters with close similarities (multiple overlapping clusters).
DISCUSSION
We exemplified how LDA can be used for clustering register-based data based on ICD-10 diagnosis codes for investigating (dis)similarities of comorbidities in persons with and without AD. More homogenous clusters were observed in the AD cohort, typically with known AD risk factors and prodromal signs and symptoms of AD. Most clusters were influenced by a few key diagnosis blocks and patterns of diagnoses differed between the two cohorts.
The majority of diseases in Cluster 1 of both cohorts were diseases of the circulatory system, but the AD Cluster 1 consists only of risk factors of AD which have linked mechanisms of action23–26 with AD and dementia. Recent meta-analyses have linked mid-life hypertension23, atrial fibrillation27, and history of stroke25 with AD. Coronary heart disease24 and heart failure28 have also been associated with dementia. Other conditions found in AD Cluster 1, such as diabetes29,30, episodic and paroxysmal disorders (including epilepsy)31, and disorders of the lens32 have been associated with risk of AD and/or dementia, or increased prevalence of these conditions have been reported in persons with dementia. Disorders of the lens was also the dominant block in AD Cluster 2.
Systemic inflammation, along with neuroinflammation, might play a role in AD pathology.33,34 In AD Cluster 6 the dominant block was Arthopathies (M00-M25) which include osteoarthritis and rheumatoid arthritis. Peripheral chronic inflammatory conditions, like rheumatoid arthritis, may contribute to AD pathogenesis.35 Other clusters in the AD cohort were dominated by injuries, such as AD Clusters 7 and 9. This is in line with previous observations of higher risk of falls in individuals in the preclinical stage of AD.36 The dominant block in AD Cluster 7 was head injuries, which have been associated with AD.37 AD Cluster 7 also included Episodic and paroxysmal disorders (G40-G47). Both head injuries and epilepsy are associated with neuro-inflammation34 and an association between injuries and seizures may explain this grouping.38 Further, increased incidence of different kind of seizures (G40-47) and delirium39,40 has been shown already years before AD diagnosis.
Although none of the clusters had a dominant block related to mental and behavioral disorders, a few clusters (AD Clusters 1, 6, and, 9 and CTRL Clusters 3, 8, and 9) contained these blocks. Delirium and schizophrenia were both included in AD Cluster 6, while AD Cluster 9 had several blocks related to mental and behavioral disorders with Mood [affective] disorders (F30-F39) representing over 20% of the cluster. Depression is associated with AD, but it is still unclear if it is a secondary effect of AD.41 In the CTRL cohort, Mood [affective] disorders represented a smaller proportion (<10% ) of CTRL Cluster 9. The previously reported increase in diagnoses of schizophrenia, schizotypal and delusional disorders within the five-year time window in persons with AD may suggest difficulties in differentiating psychiatric and neurodegenerative disorders.42
Some clusters had strong category features, like Cardiovascular (Clusters 1) while other clusters still had common themes but were less homogenous like AD Cluster 5. Three common themes have been identified in this cluster (Urinary/Metabolic/Infections), which include Diabetes mellitus (E10-E14) and Renal tubulo-interstitial diseases (N10-N16) and these diseases often co-occur.43 This cluster also included several blocks related to infections in different organ systems. The use of antibiotic treatment for respiratory infections (blocks J09-J18 and J20-J22) may lead to intestinal infections.44
Previous studies have reported an increasing prevalence of comorbidities around three years before AD diagnosis.18,45,46 We set our study parameters to capture the changes in the two cohorts during this period and using the LDA method found different patterns of diagnoses among those with and without AD. Thus, the implications of our results in terms of identifying persons with AD are limited. However, our goal was to see if using these models could capture variations in clusters in a qualitative way between people with and without AD. Further, the results illustrate the differences in multimorbidity clustering between persons with and without AD. When the models were run separately for males and females in each cohort, sex-specific diagnoses were observable in several clusters; however, similar clusters were observed when compared to the 10-cluster models of the entire AD and CTRL cohorts.
Strengths and limitations
A major strength of our study is the large nationwide data of community-dwelling people with clinically verified diagnosis of AD in Finland. Internal validity studies of the Finnish Register for Health Care have confirmed the coverage and accuracy of these registers suitable for epidemiological studies.47,48 In a previous validation study, the AD diagnosis from the FSRR has a high positive predictive value (97.1% , 95% Confidence Interval 84.7-99.9).48
People in the AD cohort may have had more contact with the healthcare system and a greater likelihood of being diagnosed with other conditions due to prodromal symptoms of AD. This detection bias could influence our results by diversifying the ICD-10 codes, and multiplications of the same ICD-code in the AD cohort. We dropped duplicate codes on the 3- character level before forming the blocks, so repetitive diagnoses were not captured in the analyzed data. Our data was limited to hospital discharge records and the FSRR with no direct data on primary care diagnoses. However, the FSRR also includes conditions diagnosed in primary care settings. As an extension to the proposed approach, a hybrid model could be developed which uses pattern recognition methods which uses additional information, such as prescribed medication, medical procedures, or diagnosis dates. Our results from this current study would potentially assist in exploring further research on register-based data using the LDA model and MDS.
LDA is designed for handling natural languages. One of the main strengths of LDA is that it can potentially be used on a regular desktop computer with modest computational hardware. Another strength of LDA is that it gives relative frequencies of the observed ICD-10 codes between clusters. This is more intuitive because it allows exposing the actual frequencies of the ICD-10 codes between and within clusters. The major challenge of the LDA approach is to set appropriate Bayesian priors for the ICD-10 codes and clusters. Before the analysis, one should sample/derive in an appropriate way priors before the computation. This challenge also poses the problem of evaluating topic coherence, underlines the heuristic nature of the approach and the importance of crosstalk and collaboration between experts in modelling, aspects of clinical care and applied data sources. Another limitation is the statistical interpretation of the results using the LDA. Because the method is based on Bayesian statistics, assigning priors to clusters and comorbidities is not possible, other than assuming equiprobable priors to the ICD-10 codes and to the number of clusters. Medical diagnoses are not independent, especially for chronic diseases that have shared risk factors; by extension one cannot assign priors to a set of ICD-10 codes. Additionally for the ICD-10 codes, assigning priors to a set of diagnoses cannot be done, (other than assuming diagnoses being independent from each other), from a computational standpoint when using the Hoffman’s implementation (Supplementary Material).
Conclusions and implications
Although common diagnosis blocks occurred in both cohorts, it seems the co-occurrences of diagnosis differed between persons with and without AD so that early signs and symptoms associated with AD were clustered together demonstrating the feasibility of this approach. LDA seems to be a useful method for comorbidity clustering by allowing the same diagnosis block to occur within multiple clusters. Identifying these latent patterns could lead to improved care for older adults.
AUTHORS CONTRIBUTIONS
Blair Rajamaki (Conceptualization; Data curation; Formal analysis; Methodology; Writing – original draft); Billy Braithwaite (Conceptualization; Formal analysis; Methodology; Software; Visualization; Writing – original draft); Sirpa Hartikainen (Conceptualization; Investigation; Resources; Validation; Writing – original draft; interpretation of the results); Anna-Maija Tolppanen (Conceptualization; Data curation; Formal analysis; Funding acquisition; Investigation; Methodology; Resources; Supervision; Validation; Visualization; Writing – original draft).
ACKNOWLEDGMENTS
An oral presentation of this research was previously presented at the 18th International Congress of the European Geriatric Medicine Society. The funders had no role in the design, methods, subject recruitment, data collection, analysis, or preparation of this manuscript.
FUNDING
This work was supported by Business Finland and the European Regional Development Fund (Dnro 733/31/2020).
CONFLICT OF INTEREST
AMT reports a research grant from Amgen, paid through the institution she is employed by, outside of the submitted work. BR, BB, and SH have no conflicts of interest.
DATA AVAILABILITY
Raw data derived from the national registers maintained by Social Insurance Institution, Finnish Institute for Health and Welfare and Statistics Finland were used in this study. Thus, restrictions apply to the availability of these data, which were used under license for the current study, and are thus not publicly available. Data are however available from the authors upon reasonable request and with permission of Health and Social Data Permit Authority Findata.
SUPPLEMENTARY MATERIAL
[1] The supplementary material is available in the electronic version of this article: https://dx.doi.org/10.3233/JAD-240490.
REFERENCES
1. | Marengoni A, Angleman S, Melis R, et al. Aging with multimorbidity: A systematic review of the literature. Ageing Res Rev (2011) 10: : 430–439. |
2. | World Health Organization (WHO). Dementia Fact Sheet, https://www.who.int/news-room/fact-sheets/detail/dementia ((2021) , accessed 4 August 2022). |
3. | Santiago JA and Potashkin JA. The impact of disease comorbidities in Alzheimer’s disease. Front Aging Neurosci (2021) 13: : 631770. |
4. | Aisen PS , Cummings J , Jack CR , et al. On the path to 2025: understanding the Alzheimer’s disease continuum. Alzheimers Res Ther (2017) 9: : 60. |
5. | Ngandu T , Lehtisalo J , Solomon A , et al. A 2 year multidomain intervention of diet, exercise, cognitive training, and vascular risk monitoring versus control to prevent cognitive decline in at-risk elderly people (FINGER): a randomised controlled trial. Lancet (2015) 385: : 2255–2263. |
6. | Mustakim M , Wardoyo R , Mustofa K , et al. Latent Dirichlet allocation for medical records topic modeling: systematic literature review. In: 2021 Sixth International Conference on Informatics and Computing (ICIC). (2021) , pp. 1–7. |
7. | Manning C and Schütze H. Foundations of Statistical Natural Language Processing. Cambridge, MA USA: MIT Press, https://mitpress.mit.edu/9780262133609/foundations-of-statistical-natural-language-processing/ ((1999) , accessed 15 November 2022). |
8. | Blei DM , Ng AY and Jordan MI. Latent Dirichlet allocation. J Mach Learn Res (2003) 3: : 993–1022. |
9. | Chiudinelli L , Dagliati A , Tibollo V , et al. Mining post-surgical care processes in breast cancer patients. Artif Intell Med (2020) 105: : 101855. |
10. | Speier W , Ong MK and Arnold CW. Using phrases and document metadata to improve topic modeling of clinical reports. J Biomed Inform (2016) 61: : 260–266. |
11. | Huang Z , Dong W , Ji L , et al. Incorporating comorbidities into latent treatment pattern mining for clinical pathways. J Biomed Inform (2016) 59: : 227–239. |
12. | Shah AM , Yan X , Qayyum A , et al. Mining topic and sentiment dynamics in physician rating websites during the early wave of the COVID-19 pandemic: Machine learning approach. Int J Med Inform (2021) 149: : 104434. |
13. | Li DC , Thermeau T , Chute C , et al. Discovering associations among diagnosis groups using topic modeling. AMIA Jt Summits Transl Sci Proc (2014) 2014: : 43–49. |
14. | Bhattacharya M , Jurkovitz C , Shatkay H . Co-occurrence of medical conditions: Exposing patterns through probabilistic topic modeling of snomed codes. J Biomed Inform (2018) 82: : 31–40. |
15. | Le Lannou E , Post B , Haar S , et al. Clustering of patient comorbidities within electronic medical records enables high-precision COVID-19 mortality prediction. medRxiv (2021) ; doi: https://doi.org/10.1101/2021.03.29.21254579 [Preprint]. Posted March 31, 2021. |
16. | Tolppanen A-M , Taipale H , Koponen M , et al. Use of existing data sources in clinical epidemiology: Finnish health care registers in Alzheimer’s disease research – the Medication use among persons with Alzheimer’s disease (MEDALZ-2005) study. Clin Epidemiol (2013) 5: : 277–285. |
17. | World Health Organization. ICD-10 version, https://apps.who.int/classifications/apps/icd/ClassificationDownload/DLArea/Download.aspx ((2015) , accessed 25 March 2021). |
18. | Mäklin K , Lampela P , Lin J , et al. Diagnostic groups of hospital stays and outpatient visits during 10 years before Alzheimer’s disease. BMC Health Serv Res (2023) 23: : 339. |
19. | Hoffman M , Bach F , Blei D . Online learning for latent Dirichlet allocation. In: Advances in Neural Information Processing Systems. Curran Associates, Inc., https://papers.nips.cc/paper_files/paper/2010/hash/71f6278d140af599e06ad9bf1ba03cb0-Abstract.html ((2010) , accessed 8 September 2023). |
20. | Hoffman MD , Blei DM , Wang C , et al. Stochastic variational inference. J Mach Learn Res (2013) 14: : 1303–1347. |
21. | Pedregosa F , Varoquaux G , Gramfort A , et al. Scikit-learn: machine learning in Python. |
22. | Kruskal JB and Wish M. Multidimensional Scaling. Thousand Oaks, CA: SAGE Publications, Inc., (1978) . |
23. | Lennon MJ , Makkar SR , Crawford JD , et al. Midlife hypertension and Alzheimer’s disease: a systematic review and meta-analysis. J Alzheimers Dis (2019) 71: : 307–316. |
24. | Deckers K , Schievink SHJ , Rodriquez MMF , et al. Coronary heart disease and risk for cognitive impairment or dementia: Systematic review and meta-analysis. PLoS One (2017) 12: : e0184244. |
25. | Zhou J , Yu J-T , Wang H-F , et al. Association between stroke and Alzheimer’s disease: systematic review and meta-analysis. J Alzheimers Dis (2015) 43: : 479–489. |
26. | Winblad B , Amouyel P , Andrieu S , et al. Defeating Alzheimer’s disease and other dementias: a priority for European science and society. Lancet Neurol (2016) 15: : 455–532. |
27. | Islam MdM , Iqbal U , Walther B , et al. Benzodiazepine use and risk of dementia in the elderly population: a systematic review and meta-analysis. Neuroepidemiology (2016) 47: : 181–191. |
28. | Wolters FJ , Segufa RA , Darweesh SKL , et al. Coronary heart disease, heart failure, and the risk of dementia: A systematic review and meta-analysis. Alzheimers Dement (2018) 14: : 1493–1504. |
29. | Chatterjee S , Peters SAE , Woodward M , et al. Type 2 diabetes as a risk factor for dementia in women compared with men: a pooled analysis of 2.3 million people comprising more than 100,000 cases of dementia. Diabetes Care (2016) 39: : 300–307. |
30. | Cheng G , Huang C , Deng H , et al. Diabetes as a risk factor for dementia and mild cognitive impairment: a meta-analysis of longitudinal studies. Intern Med J (2012) 42: : 484–491. |
31. | Subota A , Pham T , Jetté N , et al. The association between dementia and epilepsy: A systematic review and meta-analysis. Epilepsia (2017) 58: : 962–972. |
32. | Kuźma E , Littlejohns TJ , Khawaja AP , et al. Visual impairment, eye diseases, and dementia risk: a systematic review and meta-analysis. J Alzheimers Dis (2021) 83: : 1073–1087. |
33. | Walker KA , Ficek BN and Westbrook R. Understanding the role of systemic inflammation in Alzheimer’s disease. ACS Chem Neurosci (2019) 10: : 3340–3342. |
34. | DiSabato D , Quan N and Godbout JP. Neuroinflammation: the devil is in the details. J Neurochem (2016) 139: : 136–153. |
35. | Culibrk RA and Hahn MS. The role of chronic inflammatory bone and joint disorders in the pathogenesis and progression of Alzheimer’s disease. Front Aging Neurosci (2020) 12: : 583884. |
36. | Stark SL , Roe CM , Grant EA , et al. Preclinical Alzheimer disease and risk of falls. Neurology (2013) 81: : 437–443. |
37. | Li Y , Li Y , Li X , et al. Head injury as a risk factor for dementia and Alzheimer’s disease: a systematic review and meta-analysis of 32 observational studies. PLoS One (2017) 12: : e0169650. |
38. | Nguyen R and Téllez Zenteno JF. Injuries in epilepsy: a review of its prevalence, risk factors, type of injuries and prevention. Neurol Int (2009) 1: : e20. |
39. | Wilson JE , Mart MF , Cunningham C , et al. Delirium. Nat Rev Dis Primers (2020) 6: : 1–26. |
40. | Pandis D and Scarmeas N. Seizures in Alzheimer disease: clinical and epidemiological data. Epilepsy Curr (2012) 12: : 184–187. |
41. | Kuring JK , Mathias JL and Ward L. Risk of dementia in persons who have previously experienced clinically-significant depression, anxiety, or PTSD: a systematic review and meta-analysis. J Affect Disord (2020) 274: : 247–261. |
42. | Tapiainen V , Hartikainen S , Taipale H , et al. Hospital-treated mental and behavioral disorders and risk of Alzheimer’s disease: A nationwide nested case-control study. Eur Psychiatry (2017) 43: : 92–98. |
43. | Tonolo G and Cherchi S. Tubulointerstitial disease in diabetic nephropathy. Int J Nephrol Renovasc Dis (2014) 7: : 107–115. |
44. | Webb BJ , Sorensen J , Jephson A , et al. Broad-spectrum antibiotic use and poor outcomes in community-onset pneumonia: a cohort study. Eur Respir J (2019) 54: : 1900057. |
45. | Butler LM , Houghton R , Abraham A , et al. Comorbidity trajectories associated with Alzheimer’s disease: a matched case-control study in a United States claims database. Front Neurosci (2021) 15: : 749305. |
46. | Xu W , Caracciolo B , Wang H-X , et al. Accelerated progression from mild cognitive impairment to dementia in people with diabetes. Diabetes (2010) 59: : 2928–2935. |
47. | Sund R . Quality of the Finnish Hospital Discharge Register: A systematic review. Scand J Public Health (2012) 40: : 505–515. |
48. | Solomon A , Ngandu T , Soininen H , et al. Validity of dementia and Alzheimer’s disease diagnoses in Finnish national registers. Alzheimers Dement (2014) 10: : 303–309. |


