
Identification of the Shared Gene Signatures Between Alzheimer’s Disease and Diabetes-Associated Cognitive Dysfunction by Bioinformatics Analysis Combined with Biological Experiment
Abstract
Background:
The connection between diabetes-associated cognitive dysfunction (DACD) and Alzheimer’s disease (AD) has been shown in several observational studies. However, it remains controversial as to how the two related.
Objective:
To explore shared genes and pathways between DACD and AD using bioinformatics analysis combined with biological experiment.
Methods:
We analyzed GEO microarray data to identify DEGs in AD and type 2 diabetes mellitus (T2DM) induced-DACD datasets. Weighted gene co-expression network analysis was used to find modules, while R packages identified overlapping genes. A robust protein-protein interaction network was constructed, and hub genes were identified with Gene ontology enrichment and Kyoto Encyclopedia of Genome and Genome pathway analyses. HT22 cells were cultured under high glucose and amyloid-β 25–35 (Aβ25-35) conditions to establish DACD and AD models. Quantitative polymerase chain reaction with reverse transcription verification analysis was then performed on intersection genes.
Results:
Three modules each in AD and T2DM induced-DACD were identified as the most relevant and 10 hub genes were screened, with analysis revealing enrichment in pathways such as synaptic vesicle cycle and GABAergic synapse. Through biological experimentation verification, 6 key genes were identified.
Conclusions:
This study is the first to use bioinformatics tools to uncover the genetic link between AD and DACD. GAD1, UCHL1, GAP43, CARNS1, TAGLN3, and SH3GL2 were identified as key genes connecting AD and DACD. These findings offer new insights into the diseases’ pathogenesis and potential diagnostic and therapeutic targets.
INTRODUCTION
Alzheimer’s disease (AD) is a neurodegenerative disease, is one of the main causes of senile dementia.1 Type 2 diabetes mellitus (T2DM) can lead to diabetes-associated cognitive dysfunction (DACD), a complication affecting the central nervous system. DACD encompasses functional abnormalities and brain pathology resulting from metabolic disruptions inherent to diabetes, manifesting as a chronic and progressive cognitive decline. A growing body of research indicates that DACD accelerates brain aging, previous research had revealed that diabetic mice exhibit neuronal loss in the cortex or hippocampus.2 In this process, chronic hyperglycemia environment in brain plays an important role.3 DACD shares the same neuropathological changes with AD, such as Aβ accumulation, abnormal tau protein phosphorylation, and others.4–6 The mechanisms underlying these changes are thought to involve an upsurge in the production of Aβ and phosphorylated-Tau (p-Tau) proteins. The activity of α-secretase, which is involved in non-amyloidogenic processing, decreases, while the activity of β-secretase, which is involved in amyloidogenic processing, increases and this shift in enzyme activity results in an increased production of Aβ from the amyloid-β protein precursor (AβPP). Additionally, the p-Tau protein, a protein critical for maintaining the structure and function of nerve cells, is primarily regulated by an enzyme called glycogen synthase kinase (GSK), when the activity of GSK-3β increases, leading to excessive p-Tau protein.
Although growing evidence support that there is complex connection between DACD and AD, the relationship at the genetic and molecular levels remains unclear. With the advent of an aging society, the incidence of cognitive impairment diseases like DACD and AD is expected to increase, deeply research into its pathogenesis is beneficial for identifying therapeutic targets and providing new insights for treatment, which carries important clinical and social significance.
With the rapid advancement and cost reduction of high-throughput sequencing technologies, a variety of sequencing techniques have become prevalent in the investigation of multifactorial and complex diseases such as AD.7 In recent years, abounds of significant progress in developing integrated analysis techniques which leverage biological networks to extract essential information from the vast amount of data in histology. These techniques are designed to unravel the intricate interactions among crucial pieces of information and extract meaningful insights.8 Among them, Weighted gene co-expression network analysis (WGCNA) is a systems biology method to describe gene correlation patterns between microarray samples.9 Widely applied, these methods play key roles in pinpointing hub genes implicated in the progression of various diseases.
In this study, we utilized this method to constructed a network based on the gene expression data from the Gene Expression Omnibus (GEO) database of the National Center for Biotechnology Information (NCBI) to find out key modules acting on progression both in AD and T2DM induced-DACD,10 then identifying relevant modules and overlapping genes. Cytoscape was used to recognize hub genes in the protein-protein interaction (PPI) network constructed by Search Tool for the Retrieval of Interacting Genes (STRING) database. We constructed two disease models separately and carried out the quantitative polymerase chain reaction with reverse transcription (RT-qPCR) analysis, further elucidating the key genes.
METHODS
Dataset preparation
Gene expression dataset GSE118553 and GSE161355 were both downloaded from GEO. Based on the GPL10558 platform, the dataset of GSE118553 contains 27 normal samples, 33 asymptomatic AD (AsymAD) and 52 AD subjects. There samples come from different regions of brain, such as entorhinal cortex, temporal cortex, frontal cortex, and cerebellum. AsymAD samples were excluded in this study. The GSE161355 dataset based on GPL570 was downloaded, containing 6 patients with self-reported T2DM induced-DACD in the Cognitive Function and Ageing Study neuropathology cohort, and 5 age and sex-matched controls.
Identification of DEGs
These datasets were preprocessed by extracting sample information, constructing gene expression matrix and converting probe names into gene names. Utilize the limma R software package to perform gene differential analysis.11 Differentially expressed genes (DEGs) with p < 0.05 were screened. DEGs with |logfold change (logFC)|>0.0715 in GSE118553 and |logFC|>0.042 in GSE161355 were further investigated. R software was utilized to create a heatmap for differential gene clustering and a volcano plot.
WGCNA network construction and module identification
All genes in GSE118553 and GSE161355 were sequenced according to the significance of differential expression, and the top 5000 mad genes were selected for analysis. The DEGs were used WGCNA R package to construct a co-expression network with corresponding clinical symptoms, respectively.9 The “Hculst” function in the R language was utilized to perform cluster analysis on the samples and exclude outliers. According to the criterion of scale-free topology, the “pickSoftThreshold” function of WGCNA calculated the soft thresholding power (β) (scale-free R2 = 0.85). The “adjacency” function was employed to transform the gene expression similarity matrix into an adjacency matrix, using the soft thresholding parameter β. The blockwiseModules function was used for network construction and module detection to generate topological overlap matrix (TOM) of co-expressed gene modules with minModuleSize of 30 and mergeCutHeight of 0.25. The module membership (MM) was defined as the correlation of gene expression profile with module eigengenes (ME), to evaluate the relationship between gene modules and clinical traits, MEs which defined as the primary key constituents computed by means of principal component analysis were calculated via Pearson’s correlation test. The modules with a p < 0.05 were thought to be significant in the interactions with clinical features. The associations of individual genes with each group (control, two kinds of diseases) were quantified by Gene Significance (GS) value. Thus, the hub genes were chosen based on GS > 0.2 and MM > 0.8.12
Identification of shared genes and pathway enrichment
The biological correlations between GSE118553 and GSE161355 modules were determined by semantic similarity using the Disease Ontology Semantic and Enrichment analysis (DOSE) package.13,14 The results with a correlation score ≥0.85 were defined as significant, indicating that the two modules had a certain correlation in biological function. The DEGs within related modules were analyzed with Venn tool (Http://www.bioinformatics.com.cn/) to define the common genes. The overlapping genes selected were analyzed by the online Search Tool for the Retrieval of Interacting Genes (STRING database, Version 11.5; https://cn.string-db.org/) to construct PPI network. The PPI network was visualized by the Cytoscape software.15 The common genes in the network were screened by node degree, and the genes which had intense relevance were filtrated to as hub genes. Core genes involved in the pathogenesis of GSE118553 and GSE161355 were interpreted by clusterProfiler package in R to perform Gene Ontology (GO) terms enrichment analysis and Kyoto Encyclopedia of Genes and Genomes (KEGG) pathways analyses.16 Statistical significance was set at p < 0.05.
Cell culture and medicine stimulation
HT22 mouse hippocampal neuron cells (obtained from the Chinese Academy of Sciences, Shanghai, China) were cultivated in Dulbecco’s Modified Eagle’s medium (DMEM, Hyclone), supplemented with 10% fetal bovine serum (FBS, Hyclone), and maintained in a 37°C incubator with 5% CO2.
HT22 cells require a glucose concentration of 25 mM for optimal growth and survival.17 Therefore, the HT22 cells cultured in DMEM medium with a basal glucose concentration of 25 mM were considered as the normal glucose (NG) group. To assess the impact of varying glucose concentrations on HT22 cells, an extra dose of either 5 mM, 25 mM, or 50 mM glucose was provided in 24 hours and an additional 50 mM of glucose was provided in the high glucose (HG) group.18 A mannitol (50 mM of D-mannitol) was used as the osmotic control for HG.
The method for preparing Aβ25-35 oligomers was as follows: Aβ25-35 was dissolved in distillation-distillation H2O (ddH2O), filtered, aliquoted, and placed in a 37°C incubator for 5 days. Then immediately stored at –20°C as a stock. To assess the impact of varying Aβ25-35 concentrations on HT22 cells, HT22 cells were divided into 5 groups. The blank group was treated with a basic culture medium, while the other groups were treated with Aβ25-35 protein at final concentrations of 5 μM, 10 μM, 20 μM, and 40 μM respectively in 24 hours and 40 μM of Aβ25-35 was selected as the modeling concentration for the cells.19
Cell counting Kit-8 (CCK-8) assay
The cells were plated in 96-well plates and treated accordingly. Afterward, the culture medium was aspirated, and a combination of 100 μL of fresh medium and 10 μL of CCK-8 (Beyotime, Shanghai, China) was added. The cells were then incubated for an additional 2 h at 37°C, and the absorbance at a wavelength of 450 nm was measured.
Terminal deoxynucleotidyl transferase dUTP nick end labeling (TUNEL)
The TUNEL apoptosis assay was performed using a One-step TUNEL in situ apoptosis detection kit (Elabscience, Wuhan, China). After fixing the cell samples with 4% paraformaldehyde and permeabilizing them with 0.2% Triton-X100, the staining working solution for TUNEL staining was prepared according to the instructions provided by the manufacturer. The nuclei were then stained using a 4’,6-diamidino-2-phenylindole (DAPI) staining solution and washed with phosphate-buffered saline (PBS) before being examined under a fluorescence microscope.
Western blotting
The HT22 cells were homogenized and lysed with a lysis buffer (RIPA with protease and phosphatase inhibitor). Total protein concentrations were determined using a Bicinchoninic Acid (BCA) Protein Assay Kit (Beyotime, Shanghai, China). Those proteins were loaded, electrophoresed and transferred to Polyvinylidene Fluoride (PVDF) membranes. Membranes were blocked in 5% Bovine Serum Albumin (BSA) and incubated with rabbit anti-phospho-Tau (1:1000, ABclonal), anti-Tau (1:1000, ABclonal) and β-Tubulin (1:1000, ABclonal). Membranes were rinsed and incubated with Horseradish Peroxidase (HRP)-conjugated secondary antibodies (1:10000, ABclonal). Bands were visualized using Enhanced Chemiluminescence (ECL) substrates, and its intensity was analyzed with Image J software.
RT-qPCR
HT22 cells were suspended in Trizol reagent (Beyotime, Shanghai, China) for RNA extraction. Then, the total RNA was converted into cDNA templates through reverse transcription using the All-in-One cDNA Synthesis SuperMix kit. Subsequently, gene expression was examined by RT-qPCR and calculated with the formula 2–ΔΔCt method (Vazyme, Nanjing, China). GAPDH was used as a normalization control.
Statistical analysis
The results obtained from a minimum of three independent experiments were subjected to statistical analysis using the student’s t-test (for two groups) or one-way analysis of variance (ANOVA, for multiple groups). The data were presented as mean±standard deviation (SD). Statistical significance was determined at a p-value less than 0.05. The notation *p < 0.05, #p < 0.05, **p < 0.01, ##p < 0.01, ***p < 0.001, ###p < 0.001, ****p < 0.0001 and ####p < 0.0001 were used to indicate different levels of statistical significance.
RESULTS
Identification of DEGs and gene co-expression modules WGCNA
20,392 DEGs were obtained between AD and normal samples, in these DEGs, 4,240 genes were upregulated and 3,492 were downregulated (Fig. 1A). We screened the GSE161355 dataset to get 54,675 DEGs between T2DM induced-DACD and normal controls, of these DEGs, 431 genes were upregulated and 962 were downregulated (Fig. 1B).
Fig. 1
Identification of DEGs and Gene Co-expression Modules WGCNA. A, B) The volcano plots of AD and T2DM induced-DACD. Each row represents a module eigengene, and columns represent a trait. Each cell contains the correlation between the module eigengenes and traits, and the corresponding p-values. p-values less than 0.05 are considered significant. Dendrogram of all genes in the GSE118553 (C) or GSE161355 (E) dataset was clustered on the basis of a topological overlap matrix (1-TOM). Each branch in the clustering tree represents a gene, while co-expression modules were constructed in different colors. D) Three modules are related to AD. F) Six modules are related to T2DM induced-DACD. AD, Alzheimer’s disease; T2DM, type 2 diabetes mellitus; DACD, diabetes-associated cognitive dysfunction.
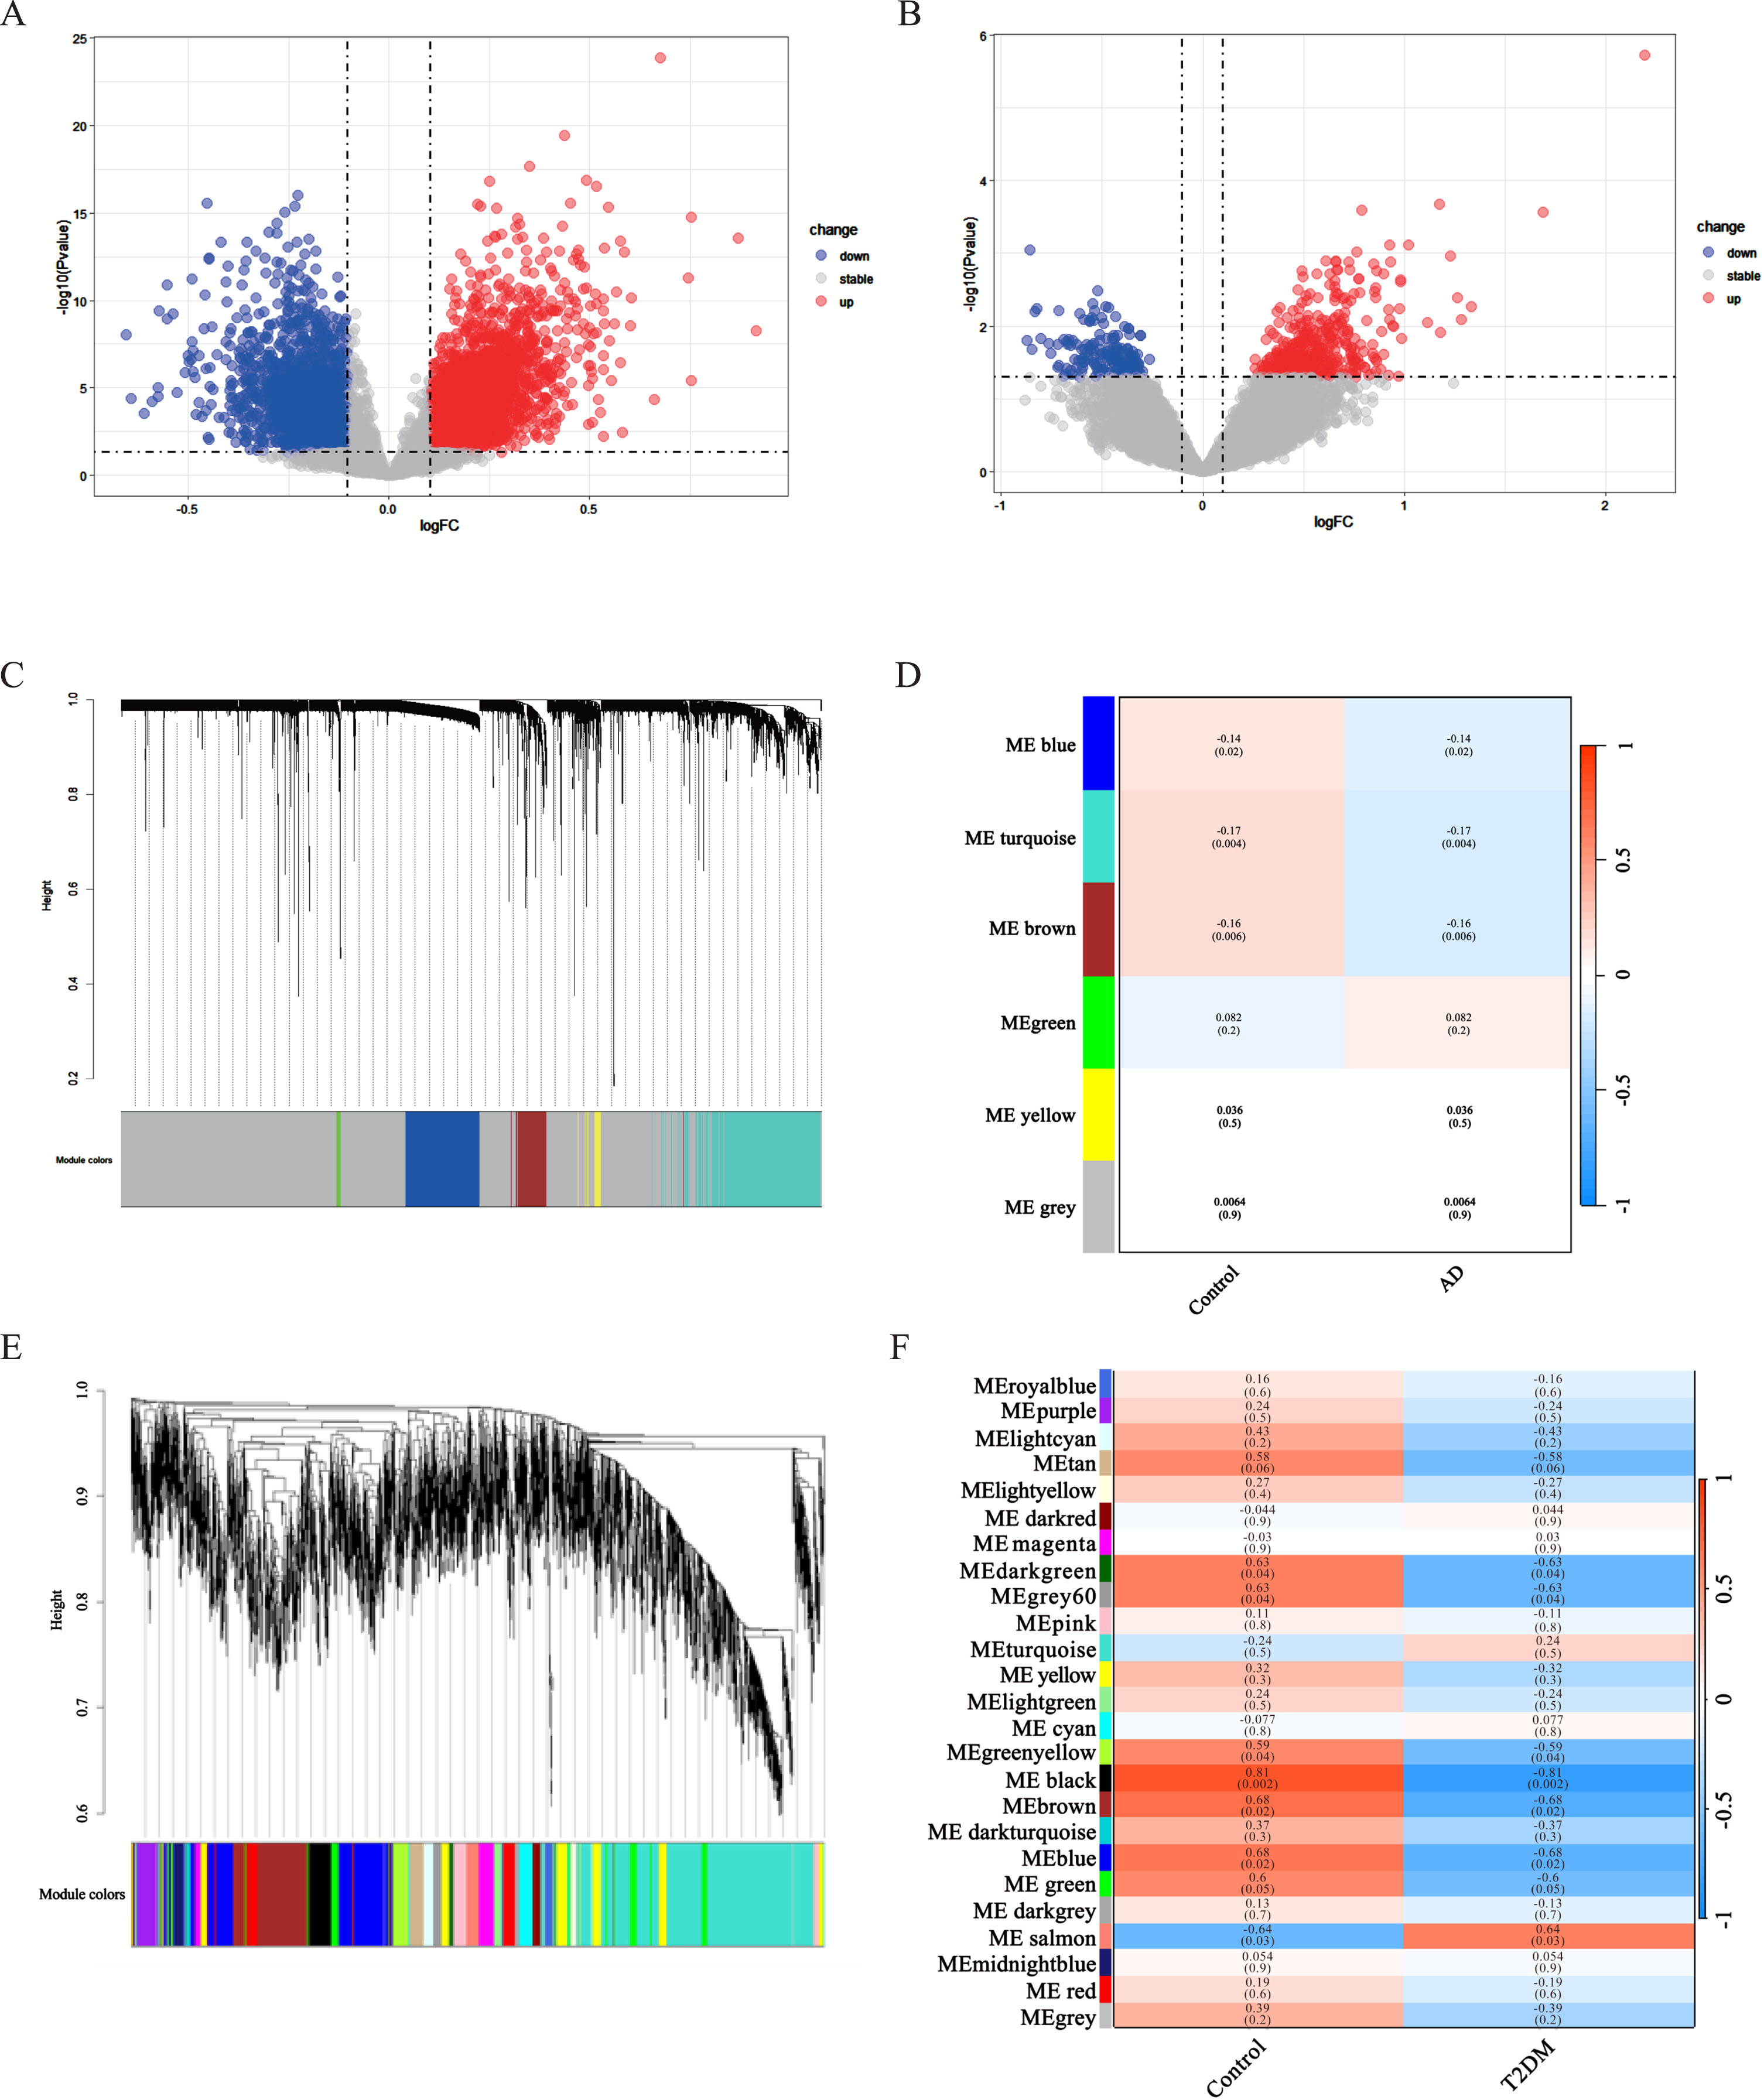
Select the top 5,000 differentially expressed genes in each of the two gene sets for WGCNA analysis. Outliers were checked by sample clustering, and no samples were removed in either GSE118553 or GSE161355. In order to guarantee a scale-free network, we assessed the scale-free fit index and average connectivity. In GSE118553, we choose 15 as the soft thresholding power (β) (scale-free R2 = 0.85), and finally get 5 modules. The grey module was excluded as it represented non-clustered genes. Genes in blue (r = –0.14, p = 0.02), brown (r = –0.16, p = 0.006), and turquoise (r = –0.17, p = 0.004) modules were negatively correlated with AD (Fig. 1C, D). In addition, 25 modules in GSE161355 were obtained with a soft power of β= 7 (scale-free R2 = 0.85). The result demonstrated that green yellow (r = –0.59, p = 0.04), dark green (r = –0.63, p = 0.04), grey60 (r = –0.63, p = 0.04), brown (r = –0.68, p = 0.02), blue (r = –0.68, p = 0.02), black (r = –0.81, p = 0.002) modules were negatively while the salmon (r = 0.64, p = 0.03) modules were positively correlated T2DM (Fig. 1E, F).
Identification of shared genes and pathway enrichment
These correlated modules were analyzed by the DOSE R package to identify the correlations between AD and T2DM induced-DACD. The correlation coefficient of the two modules is greater than or equal to 0.85, which is considered to be closely related. The results showed that blue module in AD had strong correlation with brown (r = 0.89), blue (r = 0.87), and grey60 (r = 0.85) module in T2DM induced-DACD, the brown module in AD had sensitive relevance with brown (r = 0.89), blue (r = 0.88), and grey60 (r = 0.85) module in T2DM induced-DACD, and turquoise module in AD is closely related to brown (r = 0.92) and blue (r = 0.91) module in T2DM induced-DACD (Fig. 2A). The intersection of the AD and T2DM induced-DACD related modules was drawn by a Venn diagram, and 51 intersection genes were obtained, which are potential crosstalk genes between both diseases (Fig. 2B).
Fig. 2
Identification of shared genes and pathway enrichment. A) The correlation analysis between each module in AD and T2DM induced-DACD. B) Identification of common genes between correlated modules in AD and in T2DM induced-DACD by overlapping them. 51 genes were common genes between genes in AD (red) and T2DM induced-DACD (green). C) Based on STRING database, PPI networks of the shared genes were constructed. The PPI networks were visualized with Cytoscape software. Node size is directly proportional to the degree of gene connectivity. D) The GO analysis of these genes. E) The KEGG pathway analysis of these genes. GO, gene ontology; KEGG, Kyoto Encyclopedia of Genes and Genomes; PPI, protein-protein interaction.
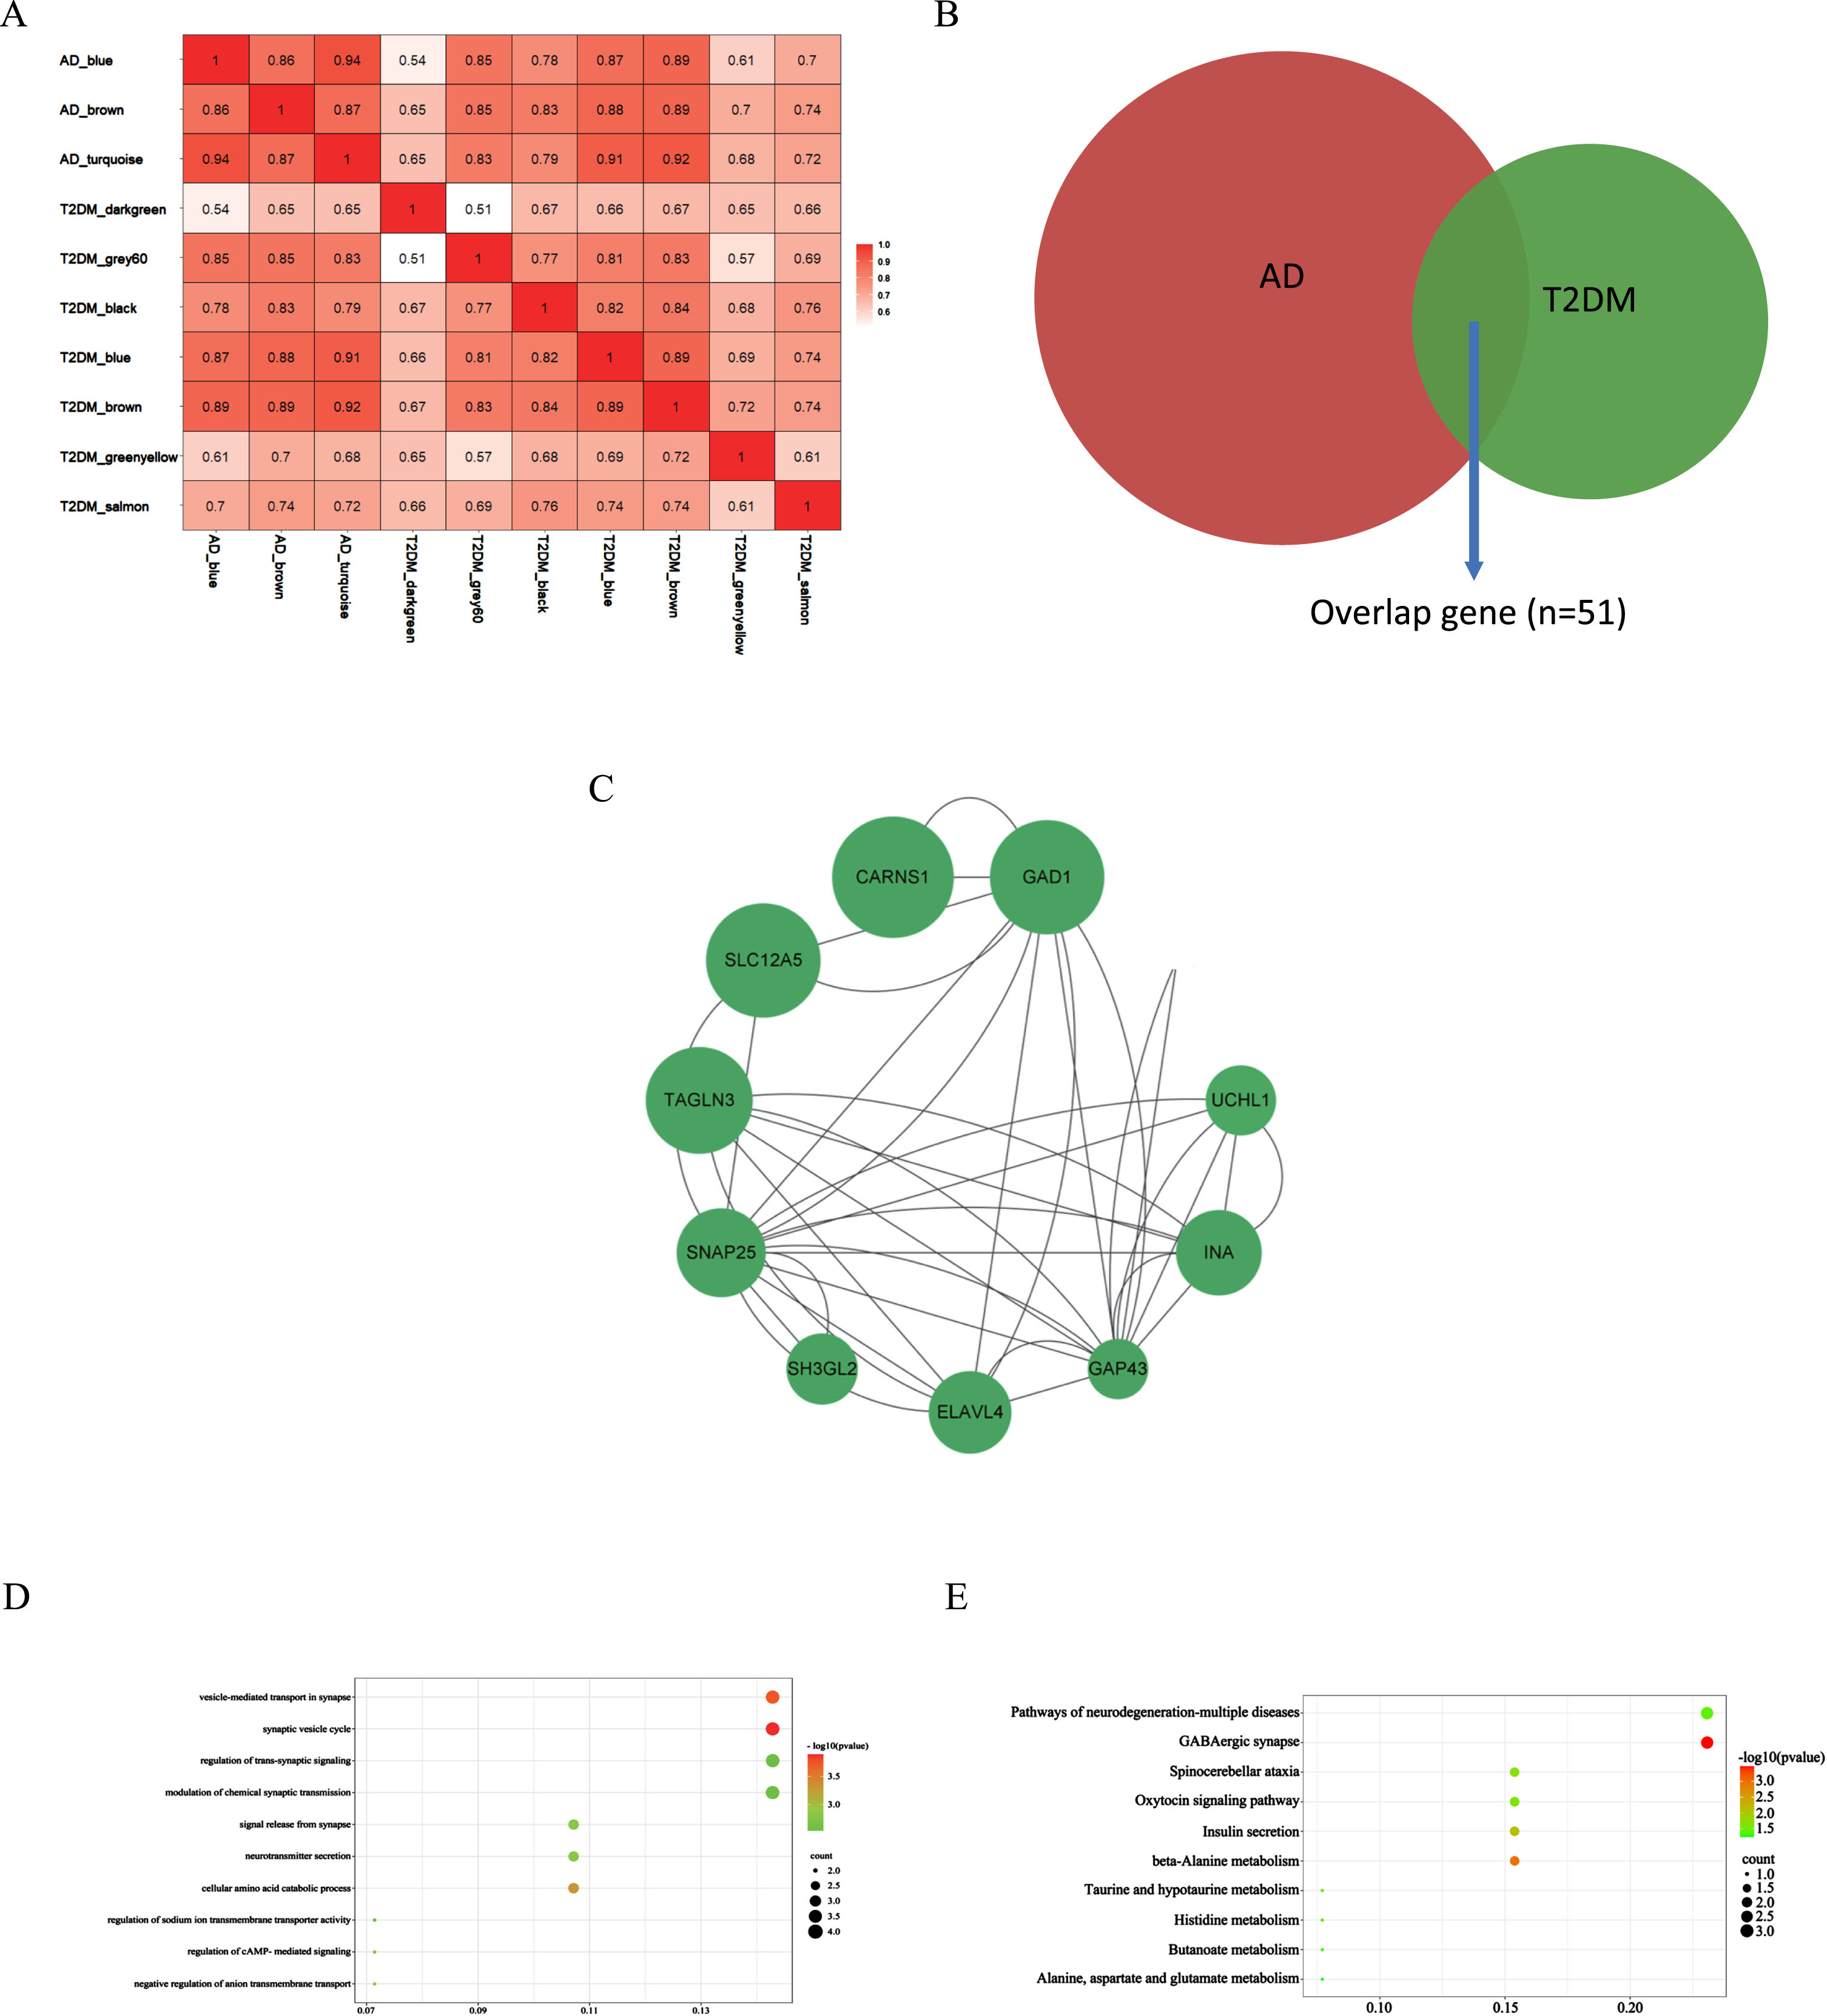
AD and T2DM induced-DACD shared genes were analyzed with the STRING database and visualized with Cytoscape. In the PPI network visualized by Cytoscape, screened out genes by sorting the node degree. Node size was directly proportional to the degree of clinical significance which measured by |logFC|. In summary, we screened out 10 most relevant genes (GAD1, CARNS1, ELAVL4, SNAP25, TAGLN3, GAP43, SLC12A5, UCHL1, INA and SH3GL2) (Fig. 2C).
GO and KEGG enrichment analyses were performed on the above 10 genes to explore the common regulatory pathways. In the above modules, we realized that shared genes functions associated with AD and T2DM induced-DACD were mainly focused on biological processes in vesicle- mediated transport in synapse and synaptic vesicle cycle. The genes were mainly concentrated on the KEGG pathways related to GABAergic synapse (Fig. 2D, E). The results of the GO and KEGG enrichment analysis are consistent with existing reports for the two diseases, indicating that the results are reliable.
Cell apoptosis of HG-cultured and Aβ25-35-cultured HT22 cells was increased
HT22 cells were stimulated with varying concentrations of glucose or mannitol. The dose-dependent increase in cell apoptosis was observed with different glucose concentrations, especially in the HG (50 μM) group, as compared to the NG group (Fig. 3A). Moreover, no significant disparity in cell apoptosis was observed between the NG and mannitol groups, thereby negating the potential impact of osmolarity on cell apoptosis. We also determined that the dosage of Aβ25-35 oligomer needed to construct a cell model of AD was 40 μM (Fig. 3B). TUNEL staining showed that HG treat and Aβ25-35 treat enhanced cell apoptosis (Fig. 3C).
Fig. 3
Cell apoptosis and tau hyperphosphorylation of HG-cultured and Aβ25-35-cultured HT22 cells was increased. A) The viability of HT22 cells was measured using a CCK-8 assay to explore the cytotoxicity of glucose and mannitol toward HT22 cells. Cells were treated with glucose and mannitol respectively (0, 5, 25, or 50 μM) for 24 h. B) The viability of HT22 cells was measured using a CCK-8 assay to explore the cytotoxicity of Aβ25-35 toward HT22 cells. Cells were treated with Aβ25-35 (0, 5, 10, 20, or 40 μM) for 24 h. C) Cell death was detected using a TUNEL (Red) assay. Quantification of the fluorescence intensity of HT22 cells using ImageJ software. D) HT22 cells were treated with high glucose (50 μM) and 40 μM Aβ25-35 oligomer for 24 h. Levels of p-Tau, tau and p-Tau/Tau were measured using western blotting, and β-Tubulin was used as the loading control, n = 3. Quantification of the gray value using ImageJ software. The data are presented as the means±SD of three experiments. *p < 0.05, #p < 0.05, **p < 0.01, ##p < 0.01, ***p < 0.001, ###p < 0.001.
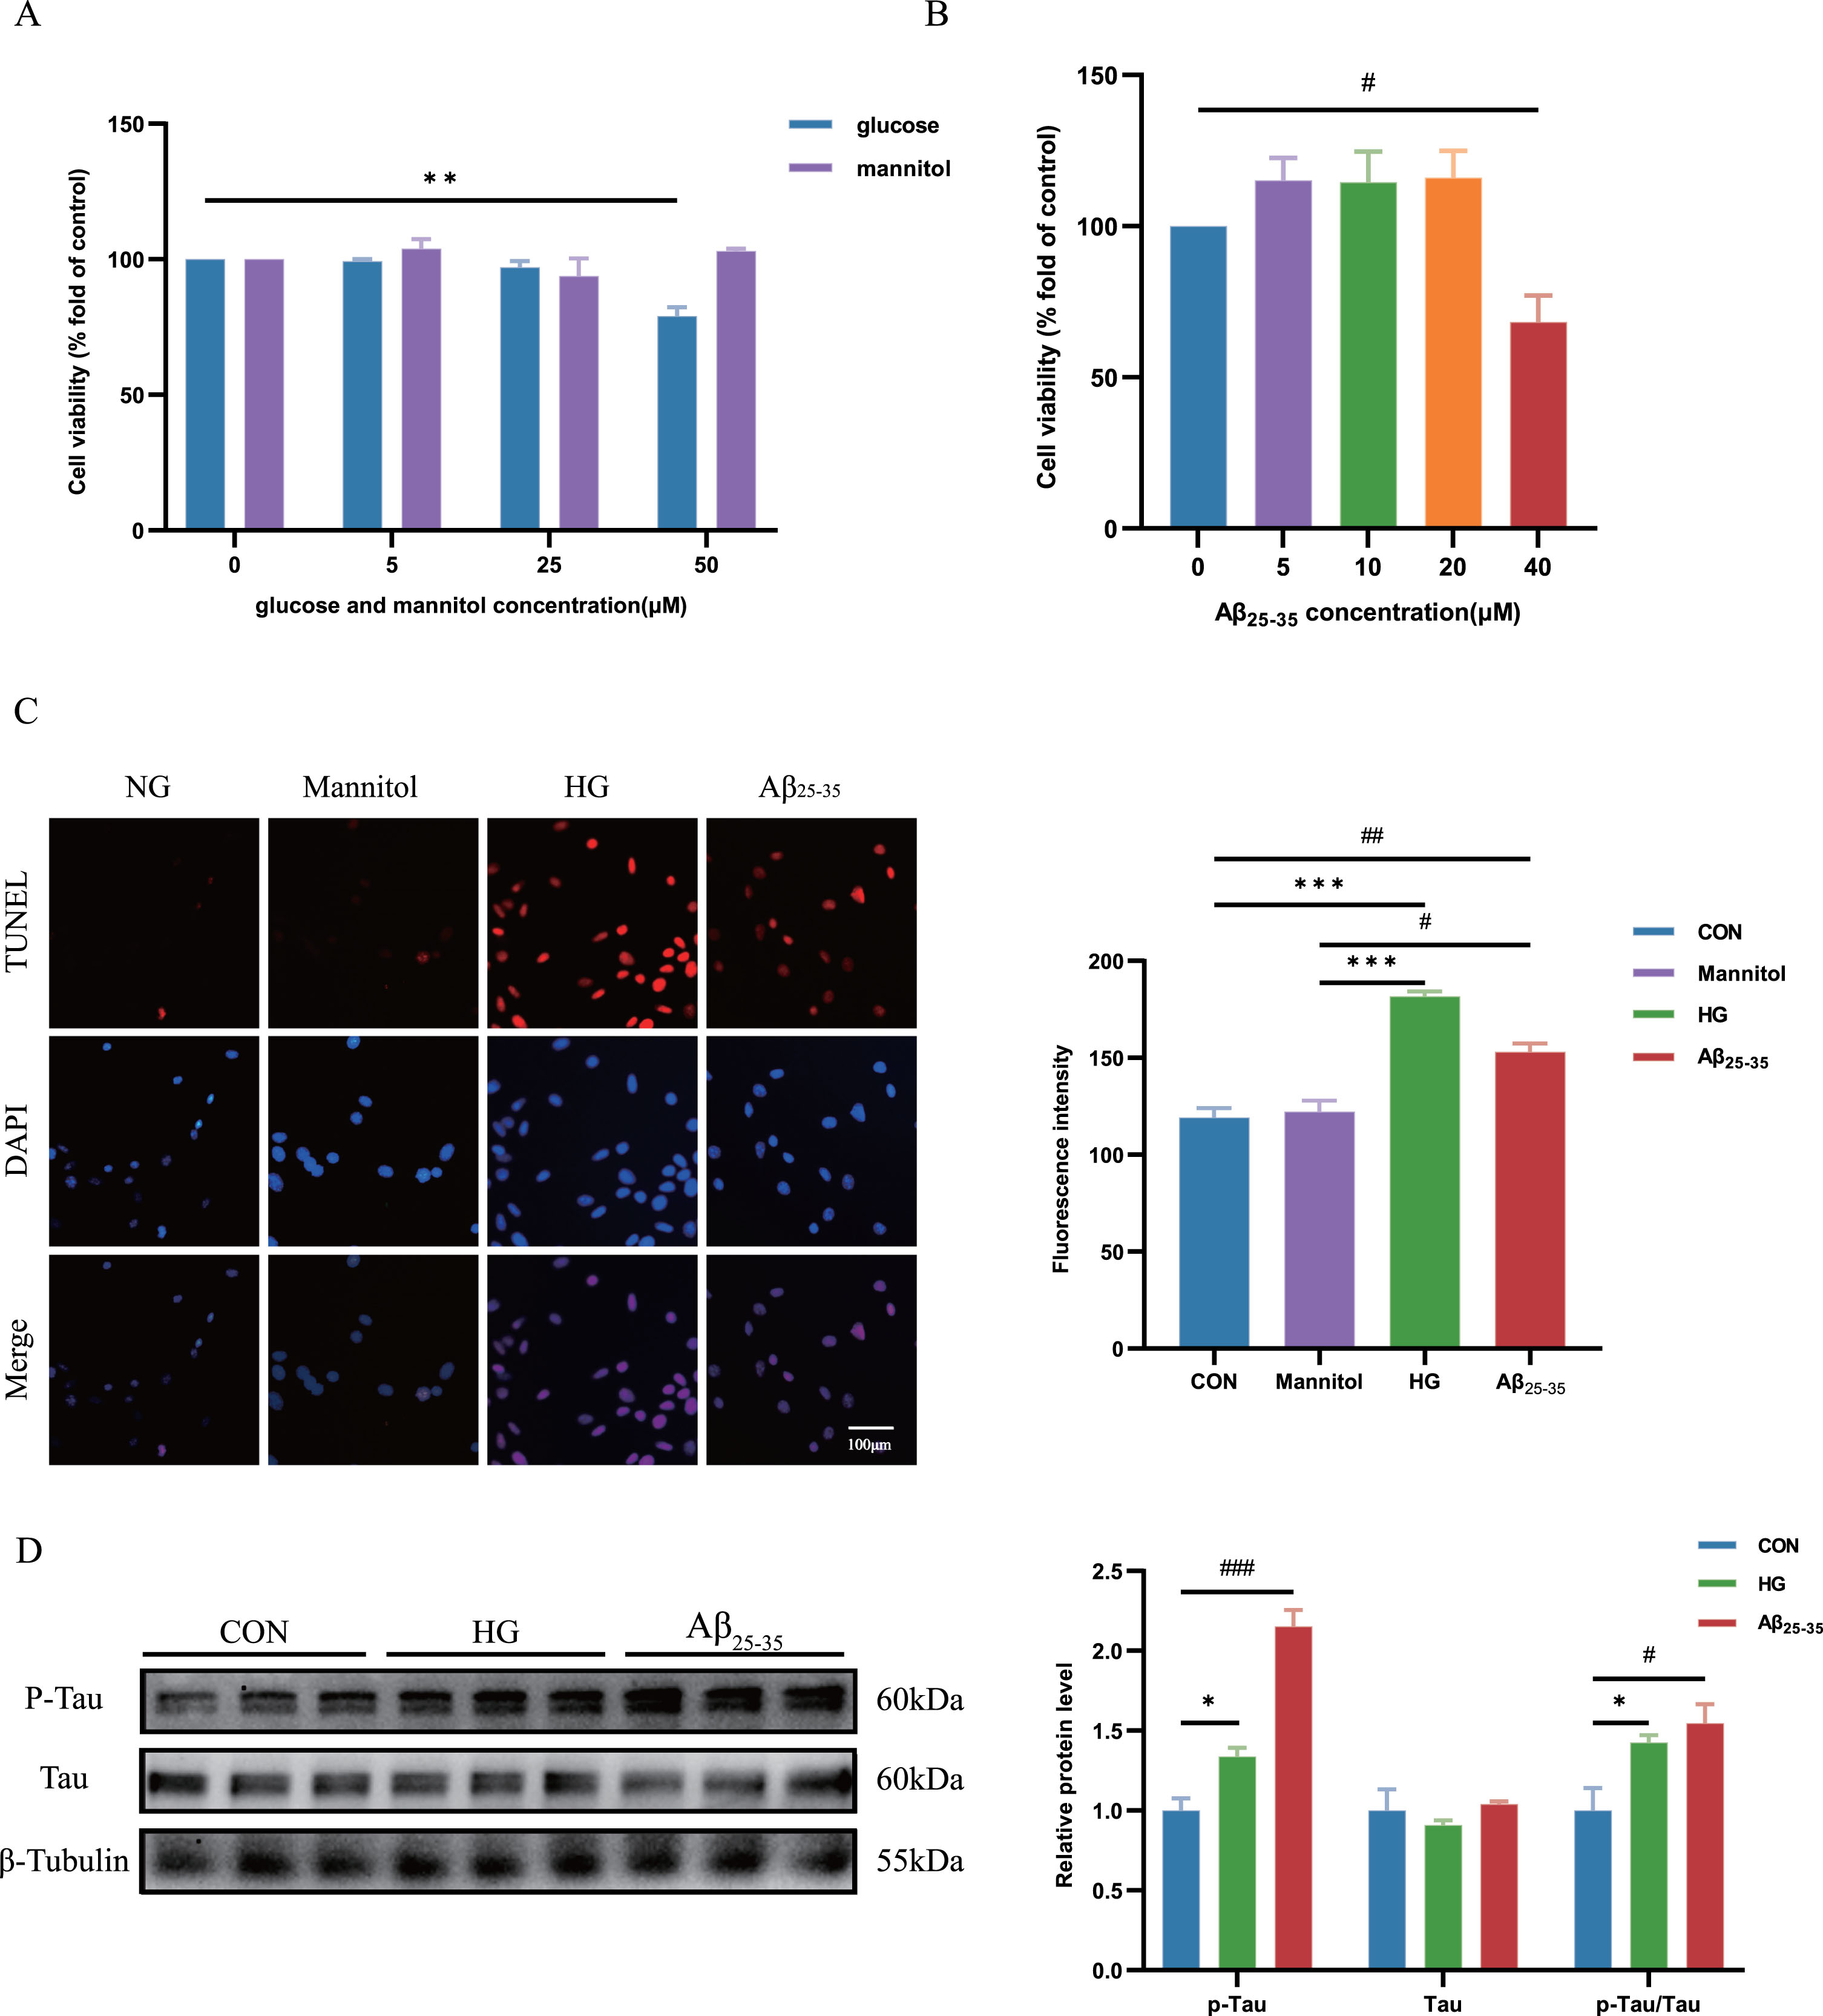
Aggravated p-Tau proteins were observed in HG-cultured and Aβ25-35-cultured HT22 cells
The accumulation of p-Tau proteins associated with AD-like pathology, can induce neuronal apoptosis, resulting primarily in cognitive decline and impaired memory and learning functions.20 In our study, we observed a significant increase in the expression of p-Tau/Tau ratio in the group with HG group and Aβ25-35 treat group compared to the control group (Fig. 3D).
Demonstration of the expression of shared genes in HG-cultured and Aβ25-35-cultured HT22 cells
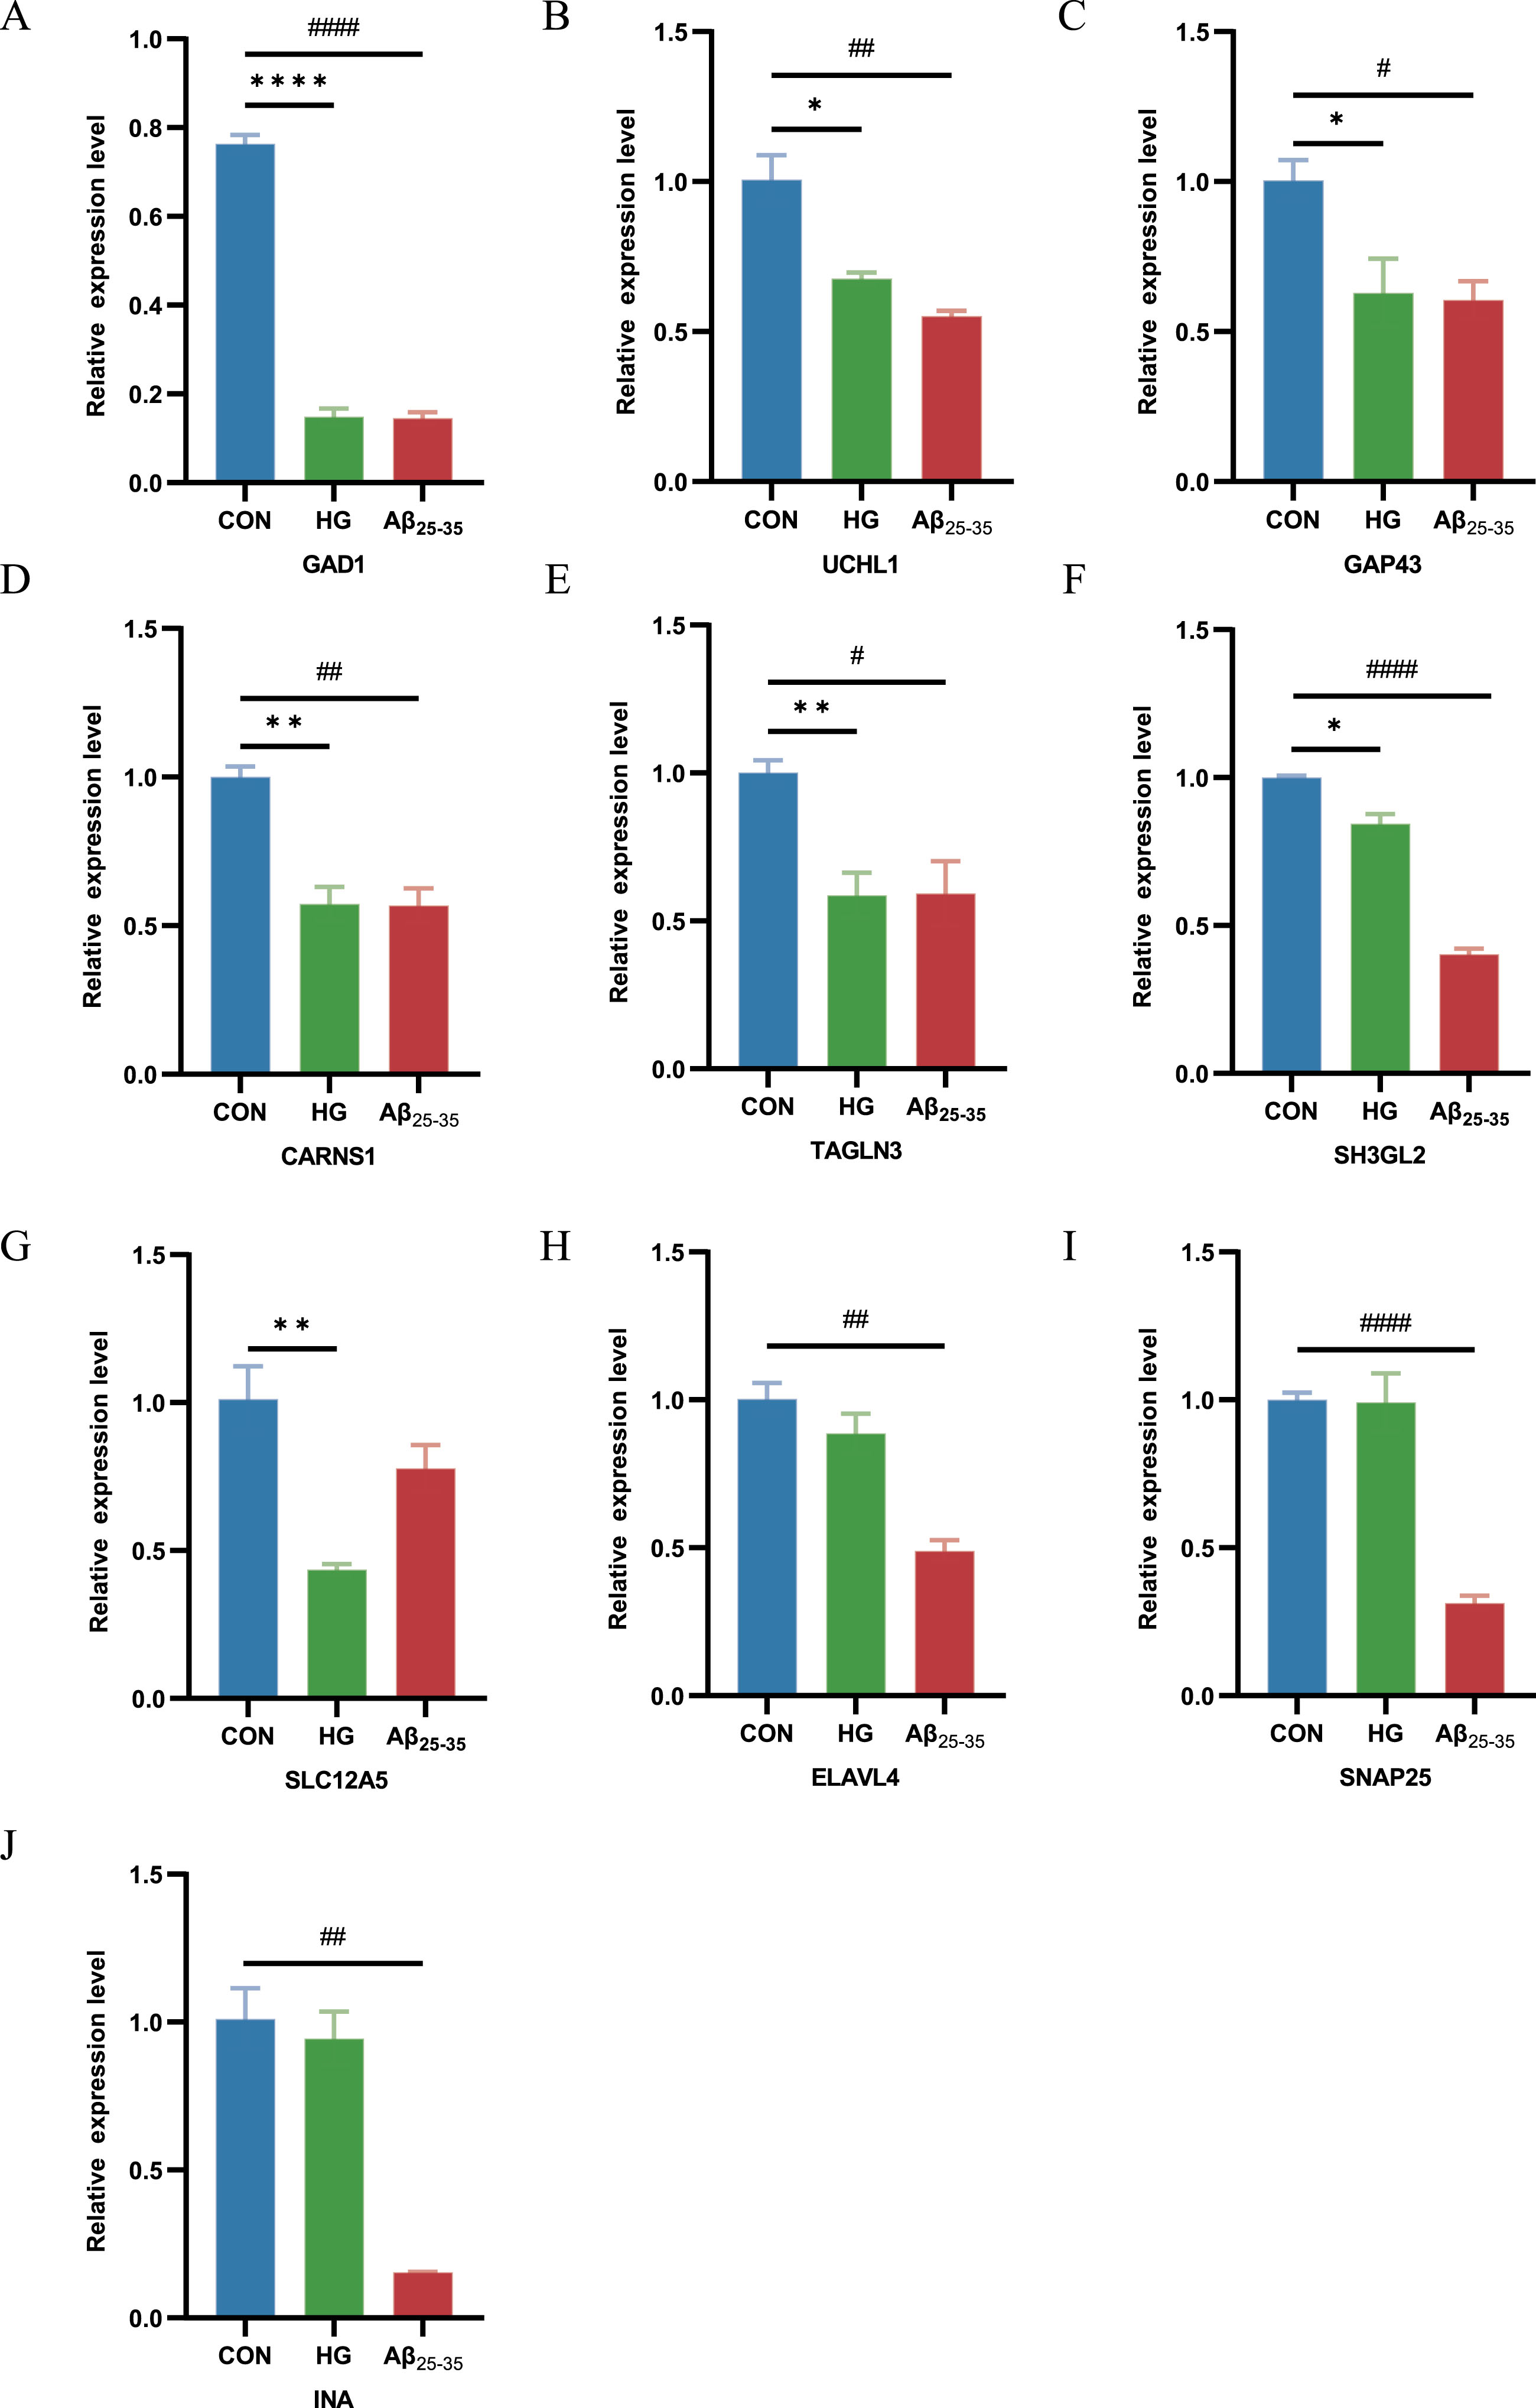
To further demonstrate the expression of shared genes in HG-cultured and Aβ25-35-cultured HT22 cells, we performed RT-qPCR in cell modules from intervention samples and control samples. The results showed that GAD1, CARNS1, TAGLN3, GAP43, SLC12A5, UCHL1and SH3GL2 expression was clearly decreased in HG-cultured HT22 cells samples compared with control samples, and GAD1, CARNS1, ELAVL4, SNAP25, TAGLN3, GAP43, UCHL1, INA and SH3GL2 expression was distinctly decreased in Aβ25-35-cultured HT22 cells samples compared with control samples (Fig. 4A-J). This finding suggested that GAD1, UCHL1, GAP43, CARNS1, TAGLN3 and SH3GL2 were the shared genes in two diseases, which is consistent with previous findings in DEGs of AD and T2DM induced-DACD.
Fig. 4
RT-PCR for the expression of common genes in HG-cultured HT22 cells samples and Aβ25-35-cultured HT22 cells samples compared with control samples. *p < 0.05, #p < 0.05, **p < 0.01, ##p < 0.01, ****p < 0.0001 and ####p < 0.0001.
DISCUSSION
DACD is a condition where diabetes mellitus (DM) contributes to a decline in cognitive function and an increased risk of dementia and it is strongly linked to a higher mortality rate.21,22 AD, the most prevalent form of dementia, is an escalating global public health issue with significant ramifications for individuals and communities.23 What interests us more is that the AD and DACD share some of the same pathological mechanisms. Previous studies have inspired us to study the link between the two diseases by analyzing GEO database resources with bioinformatics tools.24–26 They went further by directly the overlapping DEGs in the two disease datasets while in our study, we integrated the transcriptomes of AD and T2DM induced-DACD and used WGCNA for the first time to explore the common mechanism between the two, revealing potential shared genes and crosstalk pathways. By taking the intersection of WGCNA important module genes and DEGs, we found blue, turquoise and brown modules to be associated with AD, while dark green, grey60, green yellow, black, brown, blue and salmon modules to be related with T2DM induced-DACD significantly. Further, we conducted correlation analysis of these modules together and select the most relevant modules, including blue, turquoise and brown modules in AD and brown, grey60 and blue modules in T2DM induced-DACD. Upon integration, we screened the final set of “significant” overlapping genes that GAD1, CARNS1, ELAVL4, SNAP25, TAGLN3, GAP43, SLC12A5, UCHL1, INA and SH3GL2. We then described several intersection genes in these modules, most of which are enriched in synaptic vesicle cycle and GABAergic synapse.
We established cellular models through intervention with high glucose (50 μM) and Aβ25-35(40 μM) and observed an increase in neuronal apoptosis, a direct cause of memory and learning impairment, in HT22 cells cultured with high glucose or Aβ25-35. When there is a disturbance in the equilibrium between the generation and removal of proteins associated with AD, the accumulation of proteins like p-Tau can occur either outside or within the neurons, resulting in extensive neuronal death. According to reports, DACD, like AD, also exhibits neurodegenerative changes, and an increase in p-Tau protein is one of the important alterations.27 Elevated levels of p-Tau protein can destabilize the neuronal cytoskeleton and hinder axonal transport, leading to synaptic dysfunction and gradual neurodegeneration once a pathological threshold is surpassed.28 Our research validates the existence of excessive AD-like characteristics in HT22 cells cultured in high glucose or Aβ25-35 conditions.
Moreover, we identified 10 hub genes, respectively, in HT22 cells cultured with high glucose or Aβ25-35. The difference in the expression of 6 hub genes that GAD1, UCHL1, GAP43, CARNS1, TAGLN3 and SH3GL2 among the high glucose or Aβ25-35 groups and control groups were significantly different, which are likely to be potential crucial genes and therapeutic targets for AD and DACD.
Gamma-aminobutyric acid (GABA) is the most abundant inhibitory amino acid neurotransmitters in the brain,29 shaping the activity of brain tissue and providing a homeostatic stability to the nervous system and networks by preventing uncontrolled hyperexcitability,30 GABAergic neurotransmission is mediated by the ionotropic GABAA receptors (GABAARs),31 the metabotropic GABAB receptors (GABABR),32 GABA transporters, and synthesizing and metabolizing enzymes. Though functional enrichment analysis, we found shared genes were focus on synaptic vesicle cycle and GABAergic synapse.
GABA plays a significant role in the development of AD. Numerous studies have documented reduced levels of GABA in both the cerebrospinal fluid (CSF) and temporal cortex of individuals with AD33,34 and expression of GABA transporter also changes in human AD hippocampus, subiculum, entorhinal cortex and superior temporal gyrus.35 It has been revealed that the subunit composition of GABAARs is altered in certain regions of the cortex and hippocampus in AD,36 while in a mouse model of AD, reduction in the neuronal surface of post and presynaptic GABAARs receptors in the hippocampus37,38 and complete restoration of impaired spike probability, synaptic plasticity, and learning and memory in a mouse model of AD can be achieved by inhibiting the production or release of GABA from reactive astrocytes.39
In patients with DM, studies show an elevation in GABA levels within the medial prefrontal cortex, and these elevated GABA levels are inversely associated with memory function.40 These findings imply a potential link between aberrant GABA levels in the medial prefrontal cortex, alterations in the GABAergic system, and episodic memory impairment in individuals with DM.41 In vivo experiment, there is a marked elevation in glutamine levels, along with significant reductions in GABA and glutamate concentrations, in the brains of db/db mice. Specifically, a notable decrease in GABA is observed solely in the hippocampus and parietal lobe of db/db mice exhibiting impaired cognition.42 Studies have shown that hyperglycemia or hyperinsulinemia, the sensitivity of GABAARs and the functions of GABAergic neurons in the hippocampus increases, which may contribute to diabetic autonomic dysregulation and glucose neurotoxicity.43,44 Insulin promotes the accumulation of GABAARs at post-synaptic membranes and is involved in the translation of postsynaptic density protein-95 (PSD-95).45 The aforementioned research indicates a strong link between cognitive impairment in individuals with DM and alterations in the metabolism or synthesis of GABA in the brain. Therefore, we speculated that dysfunction of GABAergic synapse might lead to AD and DACD, and those shared genes are almost closely related to this biology process.
Among these shared genes, the GAD1 gene with high functional significance was selected as a central shared gene related to two diseases. GAD1, glutamate decarboxylase 1, encodes the glutamate decarboxylase enzyme glutamic acid decarboxylase 67 (GAD67) which is a critical actor of the GABA metabolism as it catalyzes the decarboxylation of glutamic acid to form GABA.46 GAD67 is distributed throughout the cell in the brain, and over 90% of the basal GABA is synthesized by GAD67.47 Studies show that dysfunction of GAD67 has been associated with several neurological disorders, including schizophrenia,47 bipolar disorders48 and Parkinson’s disease.49 And in researches about AD, researchers observed significant downregulations of GAD1 and GAD67 along with both AD pathology and cognitive function in AD mouse models with abnormal astrocytic GABA and excessive GABA tonic increasement.50
Okada et al. discovered that the concentration of GABA within the islet is equivalent to the concentrations found in neurons. Subsequently, they conducted measurements of GAD activity and GABA concentrations in human insulinoma, providing confirmation that GAD is expressed in human beta cells and that GABA synthesis decreases.51 The GABA content in islets is said to be notably decreased in human islets obtained from donors with T2DM.52,53 In the brains of mammals, one of the isoforms GAD, namely glutamic acid decarboxylase 65 (GAD65)54 mediates transport of the product GABA into the synaptic vesicle lumen, where it accumulates in preparation for regulated secretion during GABA-producing neurons, as the same as the process in islets beta cells.55 Zheng et al.56employed metabonomic profiles to delineate that in hippocampus of db/db mice with DACD, GAD were attenuated compared with WT mice. In two diseases cell models, we detected a significant reduction in GAD1 expression that aligns with previous research results, so we consider that alterations in the functioning of glutamatergic neurons which GAD1 participated in could potentially be a contributing factor to the neurological impairment in AD and DACD.
UCHL1 (Ubiquitin carboxy-terminal hydrolase L1) is a de-ubiquitinating enzyme with important functions in recycling of ubiquitin which we had identified its expression in biological experiment.57 Studies indicate that reduced UCHL1 activity or UCHL1 gene deficiency enhance the degradation of beta site amyloid precursor protein cleaving enzyme 1 (BACE1) and result in an increase in Aβ production. Consistent with these discoveries, diminished levels of UCHL1 have been observed in both human cases and mouse models of AD.58 UCHL1 improvement alone induces extracellular insoluble hyperphosphorylated tau aggregates and Aβ deposits in dentate gyrus (DG) area of the hippocampus.59 However, the expression of UCHL1 is different in brain tissue and CSF in AD patients. At the preclinical stage of AD, there was a notable elevation observed in the levels of CSF UCHL1 in AD patients.60 D Allan Butterfield et al. asset the oxidative and nitrosative modifications of UCHL1 play a significant role in the mechanisms underlying neuronal death, not only in the severe form of the degenerative condition known as AD but also in its earlier stage referred to as mild cognitive impairment.61 Many researches indicated medicines exposure clears the accumulation of neuropathic protein Aβ by improving UCHL1.61–63 Our study also found a significant decrease in the expression of UCHL1 in the Aβ25-35 treatment cell model, consistent with the findings reported in the literature. UCHL1 was identified as abundant protein in rat and human beta cells, showing promising beta cell-selectivity, and be considered as a potential biomarker for destruction of pancreatic beta cells.64 Safia et al.65 demonstrates that impaired UCHL1 function could potentially play a role in the early susceptibility of pancreatic β-cells to protein misfolding and proteotoxicity, which are characteristic abnormalities observed in the islets of individuals with DM. Diabetic sensory neuropathy (DSN) is one of the most common complications of T2DM, the absence of UCHL1 leads to DSN-like characteristics in flies’ legs, such as insensitivity to external painful stimuli and degeneration of sensory neuron axons, while the enhancement of UCHL1 expression can govern insulin signaling by deubiquitinating insulin receptor substrate 1 (IRS1) and antagonizes an E3 ligase of IRS1, Cullin 1 (CUL1) to ameliorates DSN-like abnormalities.66 Based on the role of UCHL1 in DM neuropathy, we speculate that UCHL1 may play an important role in the pathological process of DACD. Nevertheless, the role of UCHL1 in this process remains unclear, and further research is still needed in the future.
Growth-associated protein-43 (GAP43) is a presynaptic membrane protein predominantly found in the hippocampus and related cortex, playing a role in controlling synapse formation, synaptic plasticity, and axon extension in the mature brain.67 We validated the GAP43 gene successfully in two cell models. Researches had revealed that GAP43 plays a regulatory role in the clustering of gephyrin, a crucial protein responsible for the aggregation of postsynaptic GABAARs, in developing neurons of the cerebral cortex.68 Examinations conducted posthumously revealed a noticeable decline in GAP43 expression in the frontal cortex and certain regions of the hippocampus within the brains of individuals with AD.69 Another findings have provided compelling evidence demonstrating an elevation in CSF levels of GAP43 in individuals with AD.70,71 Upregulating the GAP43 expression led to improve nerve damage in AD mouse models.72 Studies show that the preventive effect of many kinds of medicines against diabetic neuropathy and neurodegeneration involves correction of neuronal plasticity by enhancing the expression of GAP43.73,74 However, the role of GAP43 in the pathological process of DACD had few studies. Additional translational research is required to obtain conclusive evidence supporting the notion that targeting the improvement of GAP43 could serve as a promising therapeutic strategy for DACD.
Our study found that TAGLN3, CARNS1, and SH3GL2 are also important crosstalk genes between AD and DACD, however, there are currently few studies on these genes in above two diseases. Laurie Arnaud et al. demonstrate that APOE controls low-grade chronic inflammation in human astrocytes by downregulating Transgelin 3 (TAGLN3) expression which involving histone deacetylases activity, results in inflammation and hyperactivated inflammatory responses in sporadic AD patients and TAGLN3 can be a potential biomarker for AD.75
Amilcare et al. find that increasement of carnosine synthase 1 (CARNS1) expression treatment produces positive effects on blood sugar levels and reduction in body weight in mice treated with streptozotocin by protecting the insulin gene products in the pancreas.76 Overexpression of SH3GL2 (endophilin A1) exacerbates Aβ-induced mitochondrial dysfunction, synaptic injury, and cognitive decline via reactive oxygen species/p38 mitogen-activated protein kinase in AD mouse models, this previous finding is inconsistent with our verification results77 and need further identification. However, currently there is no available research that has identified the role of TAGLN3 and SH3GL2 in DACD and the role of CARNS1 in the pathogenesis of AD and DACD, so these genes need more research as to whether they may be new candidate markers for identifying and treating the two diseases.
There are some shortcomings in this study: 1) we use the undifferentiated HT22cells instead of differentiated HT22 cells, though there is no significant difference between the undifferentiated HT22 cells and the differentiated HT22 cells in the experiments to detect cell function and abnormal protein deposition, differentiated HT22 cells are more susceptible to toxic insults and which is suitable in further research related to glutamate excitability; 2) we use high glucose treatment which can simulate the condition of diabetes to culture cells in experiment to explore the close relationship between neuron apoptosis and abnormal phosphorylated-tau protein deposition, while this condition could not totally simulate the pathological environment in T2DM, in future we need more research to solve this.
Conclusion
We illustrated the GABAergic synapse might be a vital pathway affecting the pathogenesis of AD and DACD, and identified GAD1, UCHL1, GAP43, CARNS1, TAGLN3 and SH3GL2 as hub genes of AD and DACD. Our research results are enough to show that there is a close correlation between the two diseases, and these findings provide a basis for future research and new potential therapeutic targets for the future treatment of the two diseases.
AUTHOR CONTRIBUTIONS
Yixin Chen (Writing – original draft; Writing – review & editing); Xueying Ji (Writing – review & editing); Zhijun Bao (Project administration; Supervision).
ACKNOWLEDGMENTS
The authors have no acknowledgments to report.
FUNDING
This work was supported by National Natural Science Foundation of China (grant number 82071581), Shanghai Leading Talent Program (2022002), Sponsored by Shanghai Sailing Program (21YF1411700), NSFC culture program (GZRPY007Y).
CONFLICT OF INTEREST
The authors have no conflict of interest to report.
DATA AVAILABILITY
The data supporting the findings of this study are available on request from the corresponding author. The data are not publicly available due to privacy or ethical restrictions.
REFERENCES
1. | Scheltens P , Blennow K , Breteler MMB , et al. Alzheimer’s disease. Lancet (2016) ; 388: : 505–517. |
2. | Kariharan T , Nanayakkara G , Parameshwaran K , et al. Central activation of PPAR-gamma ameliorates diabetes induced cognitive dysfunction and improves BDNF expression. Neurobiol Aging (2015) ; 36: : 1451–1461. |
3. | Huang R , Tian S , Zhang H , et al. Chronic hyperglycemia induces tau hyperphosphorylation by downregulating OGT-involved O-GlcNAcylation in vivo and in vitro. Brain Res Bull (2020) ; 156: : 76–85. |
4. | Karki R , Kodamullil AT and Hofmann-Apitius M . Comorbidity analysis between Alzheimer’s disease and type 2 diabetes mellitus (T2DM) based on shared pathways and the role of T2DM drugs. J Alzheimers Dis (2017) ; 60: : 721–731. |
5. | Bitel CL , Kasinathan C , Kaswala RH , et al. Amyloid-β and tau pathology of Alzheimer’s disease induced by diabetes in a rabbit animal model. J Alzheimers Dis (2012) ; 32: : 291–305. |
6. | Mehla J , Chauhan BC and Chauhan NB . Experimental induction of type 2 diabetes in aging-accelerated mice triggered Alzheimer-like pathology and memory deficits. J Alzheimers Dis (2014) ; 39: : 145–162. |
7. | Slatko BE , Gardner AF and Ausubel FM . Overview of next-generation sequencing technologies. Curr Protoc Mol Biol (2018) ; 122: : e59. |
8. | Gupta OP , Deshmukh R , Kumar A , et al. From gene to biomolecular networks: a review of evidences for understanding complex biological function in plants. Curr Opin Biotechnol (2022) ; 74: : 66–74. |
9. | Langfelder P and Horvath S . WGCNA: an R package for weighted correlation network analysis. BMC Bioinformatics (2008) ; 9: : 559. |
10. | Clough E and Barrett T . The Gene Expression Omnibus Database. Methods Mol Biol (2016) ; 1418: : 93–110. |
11. | Ritchie ME , Phipson B , Wu D , et al. limma powers differential expression analyses for RNA-sequencing and microarray studies. Nucleic Acids Res (2015) ; 43: : e47. |
12. | Chen K , Shang S , Yu S , et al. Identification and exploration of pharmacological pyroptosis-related biomarkers of ulcerative colitis. Front Immunol (2022) ; 13: : 998470. |
13. | Yu G , Li F , Qin Y , et al. GOSemSim: an R package for measuring semantic similarity among GO terms and gene products. Bioinformatics (2010) ; 26: : 976–978. |
14. | Yu G , Wang L-G , Yan G-R , et al. DOSE: an R/Bioconductor package for disease ontology semantic and enrichment analysis. Bioinformatics (2015) ; 31: : 608–609. |
15. | Shannon P , Markiel A , Ozier O , et al. Cytoscape: a software environment for integrated models of biomolecular interaction networks. Genome Res (2003) ; 13: : 2498–2504. |
16. | Yu G , Wang L-G , Han Y , et al. clusterProfiler: an R package for comparing biological themes among gene clusters. OMICS (2012) ; 16: : 284–287. |
17. | Zhang S , Xue R , Geng Y , et al. Fisetin prevents HT22 cells from high glucose-induced neurotoxicity via PI3K/Akt/CREB signaling pathway. Front Neurosci (2020) ; 14: : 241. |
18. | Jing G , Wang H , Nan F , et al. Naofucong ameliorates high glucose induced hippocampal neuron injury through suppressing P2X7/NLRP1/caspase-1 pathway. Front Pharmacol (2021) ; 12: : 647116. |
19. | Fang W-L , Zhao D-Q , Wang F , et al. Neurotropin® alleviates hippocampal neuron damage through a HIF-1α/MAPK pathway. CNS Neurosci Ther (2017) ; 23: : 428–437. |
20. | Kobayashi K , Nakano H , Hayashi M , et al. Association of phosphorylation site of tau protein with neuronal apoptosis in Alzheimer’s disease. J Neurol Sci (2003) ; 208: : 17–24. |
21. | Gao S , Chen Y , Sang F , et al. White matter microstructural change contributes to worse cognitive function in patients with type 2 diabetes. Diabetes (2019) ; 68: : 2085–2094. |
22. | van Sloten TT , Sedaghat S , Carnethon MR , et al. Cerebral microvascular complications of type 2 diabetes: stroke, cognitive dysfunction, and depression. lancet Diabetes Endocrinol (2020) ; 8: : 325–336. |
23. | Lane CA , Hardy J and Schott JM . Alzheimer’s disease. Eur J Neurol (2018) ; 25: : 59–70. |
24. | Ye X-W , Liu M-N , Wang X , et al. Exploring the common pathogenesis of Alzheimer’s disease and type 2 diabetes mellitus via microarray data analysis. Front Aging Neurosci (2023) ; 15: : 1071391. |
25. | Kang P , Wang Z , Qiao D , et al. Dissecting genetic links between Alzheimer’s disease and type 2 diabetes mellitus in a systems biology way. Front Genet (2022) ; 13: : 1019860. |
26. | Afzal M , Alharbi KS , Alzarea SI , et al. Revealing genetic links of type 2 diabetes that lead to the development of Alzheimer’s disease. Heliyon (2023) ; 9: : e12202. |
27. | Umegaki H . Type 2 diabetes as a risk factor for cognitive impairment: current insights. Clin Interv Aging (2014) ; 9: : 1011–1019. |
28. | Spires-Jones TL , Stoothoff WH , de Calignon A , et al. Tau pathophysiology in neurodegeneration: a tangled issue. Trends Neurosci (2009) ; 32: : 150–159. |
29. | Neuray C , Maroofian R , Scala M , et al. Early-infantile onset epilepsy and developmental delay caused by bi-allelic GAD1 variants. Brain (2020) ; 143: : 2388–2397. |
30. | Isaacson JS and Scanziani M . How inhibition shapes cortical activity. Neuron (2011) ; 72: : 231–243. |
31. | Field M , Lukacs IP , Hunter E , et al. Tonic GABA(A) receptor-mediated currents of human cortical GABAergic interneurons vary amongst cell types. J Neurosci (2021) ; 41: : 9702–9719. |
32. | Rose TR and Wickman K . Mechanisms and regulation of neuronal GABA(B) receptor-dependent signaling. Curr Top Behav Neurosci (2022) ; 52: : 39–79. |
33. | Gueli MC and Taibi G . Alzheimer’s disease: amino acid levels and brain metabolic status. Neurol Sci (2013) ; 34: : 1575–1579. |
34. | Li Y , Sun H , Chen Z , et al. Implications of GABAergic neurotransmission in Alzheimer’s disease. Front Aging Neurosci (2016) ; 8: : 31. |
35. | Fuhrer TE , Palpagama TH , Waldvogel HJ , et al. Impaired expression of GABA transporters in the human Alzheimer’s disease hippocampus, subiculum, entorhinal cortex and superior temporal gyrus. Neuroscience (2017) ; 351: : 108–118. |
36. | Govindpani K , Calvo-Flores Guzmán B , Vinnakota C , et al. Towards a better understanding of GABAergic remodeling in Alzheimer’s disease. Int J Mol Sci (2017) ; 18: : 1813. |
37. | Martín-Belmonte A , Aguado C , Alfaro-Ruíz R , et al. Reduction in the neuronal surface of post and presynaptic GABA(B) receptors in the hippocampus in a mouse model of Alzheimer’s disease. Brain Pathol (2020) ; 30: : 554–575. |
38. | Martín-Belmonte A , Aguado C , Alfaro-Ruíz R , et al. Density of GABA(B) receptors is reduced in granule cells of the hippocampus in a mouse model of Alzheimer’s disease. Int J Mol Sci (2020) ; 21: : 2459. |
39. | Jo S , Yarishkin O , Hwang YJ , et al. GABA from reactive astrocytes impairs memory in mouse models of Alzheimer’s disease. Nat Med (2014) ; 20: : 886–896. |
40. | Thielen J-W , Gancheva S , Hong D , et al. Higher GABA concentration in the medial prefrontal cortex of Type 2 diabetes patients is associated with episodic memory dysfunction. Hum Brain Mapp (2019) ; 40: : 4287–4295. |
41. | van Bussel FCG , Backes WH , Hofman PAM , et al. Increased GABA concentrations in type 2 diabetes mellitus are related to lower cognitive functioning. Medicine (Baltimore) (2016) ; 95: : e4803. |
42. | Zheng H , Zheng Y , Zhao L , et al. Cognitive decline in type 2 diabetic db/db mice may be associated with brain region-specific metabolic disorders. Biochim Biophys Acta Mol Basis Dis (2017) ; 1863: : 266–273. |
43. | Boychuk CR , Halmos KC and Smith BN . Diabetes induces GABA receptor plasticity in murine vagal motor neurons. J Neurophysiol (2015) ; 114: : 698–706. |
44. | Wang C , Li J , Zhao S , et al. Diabetic encephalopathy causes the imbalance of neural activities between hippocampal glutamatergic neurons and GABAergic neurons in mice. Brain Res (2020) ; 1742: : 146863. |
45. | Cid MP , Arce A and Salvatierra NA . Acute stress or systemic insulin injection increases flunitrazepam sensitive-GABAA receptor density in synaptosomes of chick forebrain: Modulation by systemic epinephrine. Stress (2008) ; 11: : 101–107 . |
46. | Chatron N , Becker F , Morsy H , et al. Bi-allelic GAD1 variants cause a neonatal onset syndromic developmental and epileptic encephalopathy. Brain (2020) ; 143: : 1447–1461. |
47. | Lau CG and Murthy VN . Activity-dependent regulation of inhibition via GAD67. J Neurosci (2012) ; 32: : 8521–8531. |
48. | Benes FM , Lim B , Matzilevich D , et al. Regulation of the GABA cell phenotype in hippocampus of schizophrenics and bipolars. Proc Natl Acad Sci U S A (2007) ; 104: : 10164–10169. |
49. | Lanoue AC , Dumitriu A , Myers RH , et al. Decreased glutamic acid decarboxylase mRNA expression in prefrontal cortex in Parkinson’s disease. Exp Neurol (2010) ; 226: : 207–217. |
50. | Wang Y , Wu Z , Bai Y-T , et al. Gad67 haploinsufficiency reduces amyloid pathology and rescues olfactory memory deficits in a mouse model of Alzheimer’s disease. Mol Neurodegener (2017) ; 12: : 73. |
51. | Okada Y , Taniguchi H and Schimada C . High concentration of GABA and high glutamate decarboxylase activity in rat pancreatic islets and human insulinoma. Science (1976) ; 194: : 620–622. |
52. | Korol SV , Jin Z , Jin Y , et al. Functional characterization of native, high-affinity GABA(A) receptors in human pancreatic β cells. EBioMedicine (2018) ; 30: : 273–282. |
53. | Menegaz D , Hagan DW , Almaça J , et al. Mechanism and effects of pulsatile GABA secretion from cytosolic pools in the human beta cell. Nat Metab (2019) ; 1: : 1110–1126. |
54. | Erlander MG , Tillakaratne NJ , Feldblum S , et al. Two genes encode distinct glutamate decarboxylases. Neuron (1991) ; 7: : 91–100. |
55. | Jenstad M and Chaudhry FA . The amino acid transporters of the glutamate/GABA-glutamine cycle and their impact on insulin and glucagon secretion. Front Endocrinol (Lausanne) (2013) ; 4: : 199. |
56. | Zheng Y , Yang Y , Dong B , et al. Metabonomic profiles delineate potential role of glutamate-glutamine cycle in db/db mice with diabetes-associated cognitive decline. Mol Brain (2016) ; 9: : 40. |
57. | Mi Z and Graham SH . Role of UCHL1 in the pathogenesis of neurodegenerative diseases and brain injury. Ageing Res Rev (2023) ; 86: : 101856. |
58. | Guglielmotto M , Monteleone D , Vasciaveo V , et al. The decrease of Uch-L1 activity is a common mechanism responsible for Aβ 42 accumulation in Alzheimer’s and vascular disease. Front Aging Neurosci (2017) ; 9: : 320. |
59. | Maniv I , Sarji M , Bdarneh A , et al. Altered ubiquitin signaling induces Alzheimer’s disease-like hallmarks in a three-dimensional human neural cell culture model. Nat Commun (2023) ; 14: : 5922. |
60. | Paciotti S , Wojdała AL , Bellomo G , et al. Potential diagnostic value of CSF metabolism-related proteins across the Alzheimer’s disease continuum. Alzheimers Res Ther (2023) ; 15: : 124. |
61. | Butterfield DA . Ubiquitin carboxyl-terminal hydrolase L-1 in brain: Focus on its oxidative/nitrosative modification and role in brains of subjects with Alzheimer disease and mild cognitive impairment. Free Radic Biol Med (2021) ; 177: : 278–286. |
62. | Guglielmotto M , Repetto IE , Monteleone D , et al. Stroke and amyloid-β downregulate TREM-2 and Uch-L1 expression that synergistically promote the inflammatory response. J Alzheimers Dis (2019) ; 71: : 907–920. |
63. | Kiprowska MJ , Stepanova A , Todaro DR , et al. Neurotoxic mechanisms by which the USP14 inhibitor IU1 depletes ubiquitinated proteins and Tau in rat cerebral cortical neurons: Relevance to Alzheimer’s disease. Biochim Biophys Acta Mol Basis Dis (2017) ; 1863: : 1157–1170. |
64. | Brackeva B , De Punt V , Kramer G , et al. Potential of UCHL1 as biomarker for destruction of pancreatic beta cells. J Proteomics (2015) ; 117: : 156–167. |
65. | Costes S , Gurlo T , Rivera JF , et al. UCHL1 deficiency exacerbates human islet amyloid polypeptide toxicity in β-cells: evidence of interplay between the ubiquitin/proteasome system and autophagy. Autophagy (2014) ; 10: : 1004–1014. |
66. | Lee D , Yoon E , Ham SJ , et al. Diabetic sensory neuropathy and insulin resistance are induced by loss of UCHL1 in Drosophila. Nat Commun (2024) ; 15: : 468. |
67. | Benowitz LI , Perrone-Bizzozero NI , Finklestein SP , et al. Localization of the growth-associated phosphoprotein GAP-43 (B-50, F1) in the human cerebral cortex. J Neurosci (1989) ; 9: : 990–995. |
68. | Wang C-Y , Lin H-C , Song Y-P , et al. Protein kinase C-dependent growth-associated protein 43 phosphorylation regulates gephyrin aggregation at developing GABAergic synapses. Mol Cell Biol (2015) ; 35: : 1712–1726. |
69. | Bogdanovic N , Davidsson P , Volkmann I , et al. Growth-associated protein GAP-43 in the frontal cortex and in the hippocampus in Alzheimer’s disease: an immunohistochemical and quantitative study. J Neural Transm (2000) ; 107: : 463–478. |
70. | Sandelius Å , Portelius E , Källén Å , et al. Elevated CSF GAP-43 is Alzheimer’s disease specific and associated with tau and amyloid pathology. Alzheimers Dement (2019) ; 15: : 55–64. |
71. | Tible M , Sandelius Å , Höglund K , et al. Dissection of synaptic pathways through the CSF biomarkers for predicting Alzheimer disease. Neurology (2020) ; 95: : e953–e961. |
72. | Chen QY , Yin Y , Li L , et al. Geniposidic acid confers neuroprotective effects in a mouse model of Alzheimer’s disease through activation of a PI3K/AKT/GAP43 regulatory axis. J Prev Alzheimers Dis (2022) ; 9: : 158–171. |
73. | Fontanella RA , Ghosh P , Pesapane A , et al. Tirzepatide prevents neurodegeneration through multiple molecular pathways. J Transl Med (2024) ; 22: : 114. |
74. | El-Sherbeeny NA , Ibrahiem AT , Ali HS , et al. Carbamazepine conquers spinal GAP43 deficiency and sciatic Nav1.5 upregulation in diabetic mice: novel mechanisms in alleviating allodynia and hyperalgesia Arch Pharm Res (2020) ; 43: : 724–734. |
75. | Arnaud L , Benech P , Greetham L , et al. APOE4 drives inflammation in human astrocytes via TAGLN3 repression and NF-κB activation. Cell Rep (2022) ; 40: : 111200. |
76. | Barca A , Gatti F , Spagnolo D , et al. Responsiveness of carnosine homeostasis genes in the pancreas and brain of streptozotocin-treated mice exposed to dietary carnosine. Int J Mol Sci (2018) ; 19: : 1713. |
77. | Yu Q , Wang Y , Du F , et al. Overexpression of endophilin A1 exacerbates synaptic alterations in a mouse model of Alzheimer’s disease. Nat Commun (2018) ; 9: : 2968. |


